
Asia Pacific Sports Apparel Market
Market Size in USD Billion
 USD
44.18 Billion
USD
69.36 Billion
2025
2033
USD
44.18 Billion
USD
69.36 Billion
2025
2033
| 2026 - 2033 | |
| USD 44.18 Billion | |
| USD 69.36 Billion | |
| % | |
|
What is the Asia-Pacific Sports Apparel Market Size and Growth Rate?
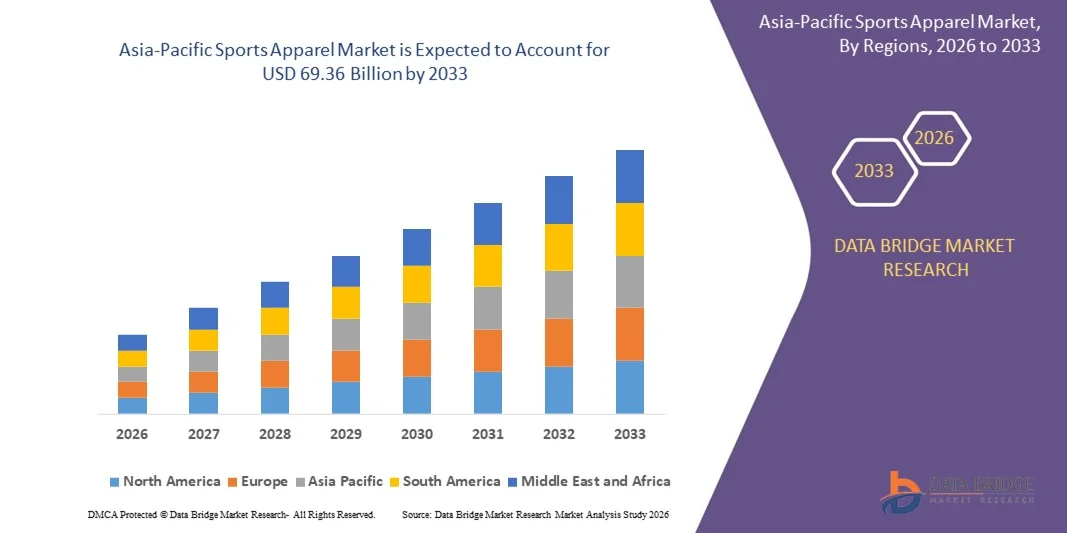
- As per Data Bridge Market Research Analysis the Asia-Pacific sports apparel market size was valued at USD 44.18 billion in 2025 and is expected to reach USD 69.36 billion by 2033, at a CAGR of 5.8% during the forecast period
- Increasing sport sponsorships is fuelling the growth of the sports apparel market. Commercialization of fake sports apparel products is hampering the growth of the sports apparel market
- Increasing huge number of participants in the numerous sports activities is acting as an opportunity for the growth of the sports apparel market. Expensive nature of sports apparels is challenging the growth of the sports apparel market
Market Size & Forecast
- Market Value (2025): USD 44.18 Billion
- Expected Market Value (2033): USD 69.36 Billion
- Forecast CAGR (2026–2033): 5.8%
What are the Major Takeaways of Sports Apparel Market?
- Rising consumer focus on fitness, growing disposable incomes, and the influence of athleisure trends are key factors positively impacting the sports apparel market. In addition, continuous product innovations and advanced performance materials present lucrative opportunities for market participants
- High product costs compared to conventional clothing, coupled with the easy availability of low-priced counterfeit alternatives, may hinder growth. Limited awareness about premium performance wear in emerging regions is projected to challenge widespread adoption
- Despite challenges, ongoing R&D, product diversification, and strong branding initiatives are expected to sustain long-term growth in the sports apparel market
- China dominated the Asia-Pacific sports apparel market with a revenue share of 39.87% in 2025, driven by high demand for performance wear, athleisure clothing, outdoor sports apparel, and premium fitness gear
- India is projected to register fastest CAGR of 11.58% from 2026 to 2033, driven by rising fitness awareness, rapid urbanization, and increasing interest in gym training, jogging, yoga, and sports activities
- The Synthetic segment dominated the market with a revenue share of 52.5% in 2025, driven by its extensive use in performance wear, activewear, and athleisure apparel
Report Scope and Sports Apparel Market Segmentation
|
Attributes |
Sports Apparel Key Market Insights |
|
Segments Covered |
|
|
Countries Covered |
Asia-Pacific
|
|
Key Market Players |
|
|
Market Opportunities |
|
|
Value Added Data Infosets |
In addition to the insights on market scenarios such as market value, growth rate, segmentation, geographical coverage, and major players, the market reports curated by the Data Bridge Market Research also include in-depth expert analysis, pricing analysis, brand share analysis, consumer survey, demography analysis, supply chain analysis, value chain analysis, raw material/consumables overview, vendor selection criteria, PESTLE Analysis, Porter Analysis, and regulatory framework. |
What is the Key Trend in the Sports Apparel Market?
Growing Shift Toward Sustainable, Performance-Driven, and Athleisure-Focused Apparel
- The sports apparel market is witnessing strong momentum toward eco-friendly materials, performance-enhancing fabrics, and athleisure wear, driven by rising health consciousness and demand for all-day comfort
- Manufacturers are developing multi-functional sportswear featuring moisture-wicking, anti-odor, UV-resistant, and temperature-regulating technologies to enhance athletic performance and everyday usability
- Consumers increasingly prefer natural, recycled, and ethically sourced fabrics over synthetic alternatives, accelerating adoption in fitness, outdoor, and lifestyle segments
- For instance, brands such as Nike, Adidas, PUMA, Under Armour, and Lululemon are expanding collections made from recycled polyester, plant-based fibers, and biodegradable materials
- Growing awareness of sustainability, wellness, and active living is fueling market penetration across the U.S., Europe, and Asia Pacific
- As consumer focus on comfort, performance, and eco-friendly design intensifies, Sports Apparel is expected to remain central to innovation across global fitness and lifestyle categories
What are the Key Drivers of Sports Apparel Market?
- Rising demand for athleisure, performance wear, and fitness-driven lifestyles is driving strong adoption of Sports Apparel globally
- For instance, in 2025, major brands such as Nike, Adidas, and Lululemon expanded their high-performance and athleisure lines to meet surging demand in fitness, yoga, running, and outdoor sports
- Growing awareness of health, wellness, and physical activity is boosting demand across the U.S., Europe, and Asia
- Advancements in fabric technology, digital design, and smart-textile integration have improved durability, breathability, and comfort across apparel categories
- Rising preference for sustainable, recycled, and non-toxic materials further supports market expansion, driven by environmentally conscious consumers
- With continuous R&D investments, product launches, collaborations, and expanded distribution, the Sports Apparel market is expected to maintain strong growth during the forecast period
Which Factor is Challenging the Growth of the Sports Apparel Market?
- High production costs associated with sustainable fabrics, advanced textiles, and smart wearables continue to limit affordability in price-sensitive regions
- For instance, during 2024–2025, fluctuations in raw material prices (cotton, polyester, elastane) and supply chain disruptions impacted production volumes for several brands
- Strict regulatory requirements related to chemical safety, labor compliance, and environmental standards add operational complexities
- Limited consumer awareness in emerging markets about premium performance wear restricts widespread adoption
- Competition from low-cost counterfeit products and unbranded alternatives exerts pressure on pricing and brand differentiation
- Companies are addressing these challenges through cost-efficient manufacturing, sustainable sourcing, regulatory alignment, and consumer education to expand adoption of high-quality Sports Apparel globally
How is the Sports Apparel Market Segmented?
The market is segmented on the basis of material, type of print, gender, and distribution channel.
- By Material
The Sports Apparel market is segmented into Natural and Synthetic materials. The Synthetic segment dominated the market with a revenue share of 52.5% in 2025, driven by its extensive use in performance wear, activewear, and athleisure apparel. Synthetic fabrics such as polyester, nylon, spandex, and elastane offer superior moisture-wicking, stretchability, durability, and quick-drying properties, making them ideal for fitness, running, training, and outdoor sports. Their compatibility with advanced textile technologies—including anti-odor coating, thermal regulation, and UV resistance—further boosts industrial adoption among global brands.
The Natural segment is projected to grow at the fastest CAGR from 2026 to 2033, fueled by rising demand for eco-friendly, breathable, and skin-friendly materials such as organic cotton, bamboo fibers, merino wool, and hemp. Growing sustainability awareness, ethical sourcing initiatives, and consumer preference for biodegradable fabrics across premium, lifestyle, and athleisure categories continue to support strong adoption worldwide.
- By Type of Print
The Sports Apparel market is segmented into Water-Based, Silicone Emboss, Reflective Transfer, Pigment, High Density, Foil, Glitter, Cracking Ink, Discharge, All Over Print, Photo Print, and Others. The Water-Based Print segment dominated the market with a revenue share of 31.8% in 2025, supported by its high breathability, softness, eco-friendly profile, and suitability for mass-production apparel such as t-shirts, jerseys, and activewear. Its low VOC emissions, smooth finish, and compatibility with cotton and blended fabrics enhance adoption across lifestyle and sportswear brands.
The Reflective Transfer segment is projected to grow at the fastest CAGR from 2026 to 2033, driven by rising demand for safety-focused and night-visibility sports apparel used in running, cycling, hiking, and outdoor activities. Increasing preference for personalized prints, brand logos, high-definition graphics, and performance-oriented embellishments across premium fitness and athleisure collections further accelerates growth in this category.
- By Gender
The Sports Apparel market is segmented into Men and Women. The Men segment dominated the market with a revenue share of 54.2% in 2025, attributed to high adoption of sportswear for gym workouts, running, outdoor sports, and casual athleisure use. Strong brand presence, continuous style innovations, and the popularity of versatile sportswear suitable for both training and lifestyle fashion strengthen segment leadership. Men’s categories such as compression wear, training apparel, outdoor jackets, and running gear continue to experience significant demand.
The Women segment is projected to grow at the fastest CAGR from 2026 to 2033, fueled by rising participation in fitness activities such as yoga, pilates, gym training, Zumba, and outdoor sports. Increasing demand for stylish athleisure, body-positive apparel, inclusive sizing, and premium performance fabrics further accelerates adoption. Social media influence, fitness culture growth, and expanding brand portfolios tailored for women support long-term expansion.
- By Distribution Channel
The Sports Apparel market is segmented into E-Commerce, Supermarket/Hypermarket, Brand Outlets, Discount Stores, and Others. The E-Commerce segment dominated the market with a revenue share of 38.6% in 2025, supported by rising online shopping penetration, attractive pricing, easy product comparison, and access to global brands. The availability of exclusive online collections, fast delivery services, and the growing influence of digital marketing and influencer-led promotions further drive online sales across regions.
The Brand Outlets segment is projected to grow at the fastest CAGR from 2026 to 2033, driven by increasing demand for personalized shopping experiences, premium collections, exclusive launches, and professional customer assistance. Expanding mono-brand stores from companies such as Nike, Adidas, Puma, Under Armour, and Lululemon is accelerating physical retail visibility. The segment also benefits from rising preferences for trial-based purchases, fit accuracy, and high-quality in-store experiences tailored to performance and athleisure consumers.
Which Region Holds the Largest Share of the Sports Apparel Market?
- China dominated the Asia-Pacific sports apparel market with a revenue share of 39.87% in 2025, driven by high demand for performance wear, athleisure clothing, outdoor sports apparel, and premium fitness gear. Rapid participation in gym workouts, running, yoga, and outdoor adventure activities—combined with strong brand presence—supports widespread adoption across major consumer groups
- Manufacturers are investing in advanced textile solutions, including sweat-wicking fabrics, heat-regulation technologies, anti-odor treatments, and recycled or bio-based material innovations to align with rising sustainability priorities across the region
- Strong e-commerce growth, social media-driven influence, and increasing focus on comfort, durability, and functionality continue to accelerate market expansion across both mass-market and premium product categories
Japan Sports Apparel Market Insight
Japan exhibits steady growth, supported by rising adoption of high-quality athleisure, technical sportswear, and performance apparel designed for running, training, and outdoor sports. Consumers increasingly prefer lightweight, breathable, and eco-friendly fabrics, prompting brands to expand offerings using recycled polyester, engineered knits, and thermal-regulated textiles. Increased participation in fitness routines, walking, cycling, and wellness activities fuels consistent demand. Retail expansion across department stores, specialty sports outlets, and online platforms—along with government-backed health and fitness awareness initiatives—further strengthens the country’s market development.
India Sports Apparel Market Insight
India is projected to register fastest CAGR of 11.58% from 2026 to 2033, driven by rising fitness awareness, rapid urbanization, and increasing interest in gym training, jogging, yoga, and sports activities. Strong demand for affordable performance wear, versatile athleisure styles, and branded apparel continues to grow across metropolitan and emerging cities. Expanding e-commerce access, influencer-led campaigns, and promotional activities by global and domestic brands are encouraging widespread adoption among young and active consumers. Growth in local manufacturing, retail store expansion, and premium product launches continues to enhance accessibility and market penetration across diverse population groups.
Which are the Top Companies in Asia-Pacific Sports Apparel Market?
The Sports Apparel industry is primarily led by well-established companies, including:
- Nike, Inc. (U.S.)
- ADIDAS AG (Germany)
- PUMA SE (Germany)
- Under Armour, Inc. (U.S.)
- lululemon athletica (Canada)
- SKECHERS USA, Inc. (U.S.)
- YONEX Co., Ltd. (Japan)
- ASICS Corporation (Japan)
- Columbia Sportswear Company (U.S.)
- FILA Luxembourg S.a.r.l. (Luxembourg)
- Amer Sports (Finland)
- CFBRAZIL Fitness & Beach Wear (Brazil)
- Formative Sports (Pakistan)
- Patagonia, Inc. (U.S.)
- Lotto Sport Italia S.p.A. (Italy)
- Diadora S.p.A. (Italy)
- The North Face (U.S.)
- Everlast Worldwide, Inc. (U.S.)
- Brooks Sports, Inc. (U.S.)
What are the Recent Developments in Asia-Pacific Sports Apparel Market?
- In April 2025, Game 7, a multi-platform sports and entertainment company, unveiled its new sports apparel collection in partnership with Centric Brands, a leading provider of premium clothing. The collection, described as a “style-driven sports team apparel line,” is offered exclusively through Amazon Stores in the U.S., expanding the brand’s reach across digital retail. This launch further strengthens the company’s presence in the modern sports fashion segment
- In January 2025, Franklin Sports, a well-established player in the sporting goods industry, introduced a new apparel line specifically crafted for pickleball enthusiasts. The Flex Collection features versatile, performance-driven designs engineered to deliver enhanced comfort, mobility, and support. This launch underscores Franklin Sports’ commitment to serving emerging athletic communities
- In July 2024, Lululemon Athletica Inc. rolled out its new Breezethrough leggings, tailored for yoga sessions and built with the brand’s smoothest, fastest-drying fabric. The cool-touch leggings, offered in 25-inch and 28-inch lengths along with 6-inch shorts, feature a seamless front design and a hidden back waistband pocket to prevent discomfort and sweat marks. This introduction marks Lululemon’s continued evolution in high-performance yoga wear
- In May 2024, The North Face debuted the LIGHTRANGE collection, a lightweight technical apparel line designed for outdoor adventures and engineered to provide UPF 40+ UV protection. Featuring breathable micro-grid weave technology, the line includes T-shirts, thin hoodies, and hats available in multiple sizes and colors, priced between USD 45 and USD 80. This collection reinforces the brand’s focus on comfort and protection for outdoor athletes
- In April 2024, Nike, Inc. launched a next-generation product series signaling the beginning of a multi-year innovation phase. The new line includes everyday running apparel and athlete-inspired footwear, all developed using digital tools and advanced cushioning systems optimized for various outdoor sports. This launch further enhances Nike’s leadership in integrating technology with performance gear
SKU-

- Interactive Data Analysis Dashboard
- Company Analysis Dashboard for high growth potential opportunities
- Research Analyst Access for customization & queries
- Competitor Analysis with Interactive dashboard
- Latest News, Updates & Trend analysis
- Harness the Power of Benchmark Analysis for Comprehensive Competitor Tracking
Data collection and base year analysis are done using data collection modules with large sample sizes. The stage includes obtaining market information or related data through various sources and strategies. It includes examining and planning all the data acquired from the past in advance. It likewise envelops the examination of information inconsistencies seen across different information sources. The market data is analysed and estimated using market statistical and coherent models. Also, market share analysis and key trend analysis are the major success factors in the market report. To know more, please request an analyst call or drop down your inquiry.
The key research methodology used by DBMR research team is data triangulation which involves data mining, analysis of the impact of data variables on the market and primary (industry expert) validation. Data models include Vendor Positioning Grid, Market Time Line Analysis, Market Overview and Guide, Company Positioning Grid, Patent Analysis, Pricing Analysis, Company Market Share Analysis, Standards of Measurement, Global versus Regional and Vendor Share Analysis. To know more about the research methodology, drop in an inquiry to speak to our industry experts.
Data Bridge Market Research is a leader in advanced formative research. We take pride in servicing our existing and new customers with data and analysis that match and suits their goal. The report can be customized to include price trend analysis of target brands understanding the market for additional countries (ask for the list of countries), clinical trial results data, literature review, refurbished market and product base analysis. Market analysis of target competitors can be analyzed from technology-based analysis to market portfolio strategies. We can add as many competitors that you require data about in the format and data style you are looking for. Our team of analysts can also provide you data in crude raw excel files pivot tables (Fact book) or can assist you in creating presentations from the data sets available in the report.


