
Asia-Pacific Structural Health Monitoring Market Analysis and Insights
Manufacturers are continuously trying to find ways to increase the precision of work, enhance services, and safety, and work with growing technology. The requirement for these reasons is being fulfilled by implementing structural health monitoring as they are used to provide enhanced, uninterrupted, free, and timely services at the end user applications. Structural health monitoring in the infrastructure industry is being used widely for structural health monitoring solutions and the rising adoption of digital technologies in the industrial sector. Structural health monitoring helps operators make better decisions around supply chain, machinery, assets performance, drilling, and others. The Asia-Pacific structural health monitoring market is expected to grow due to growing digitization in the construction industry.
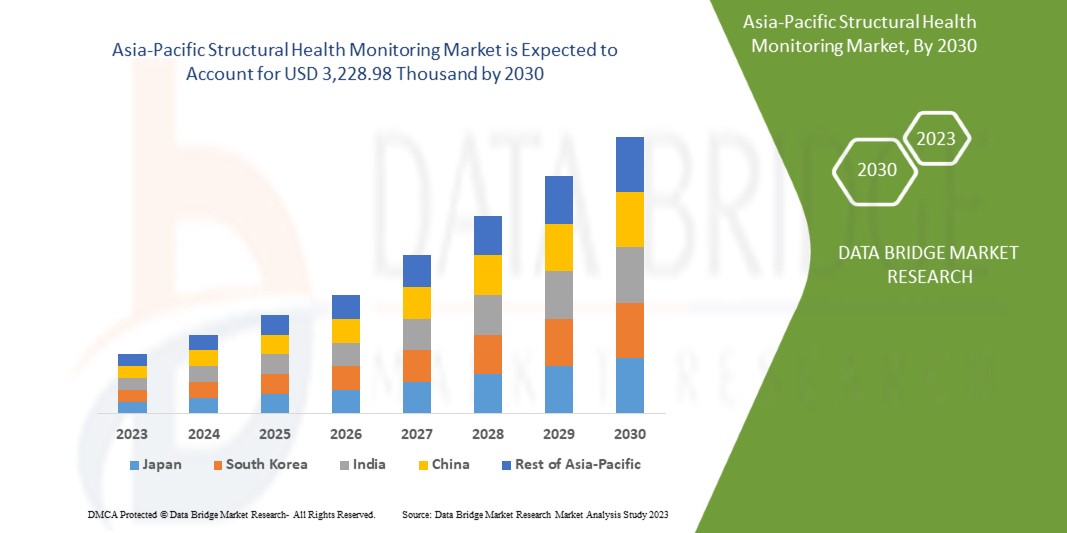
Data Bridge Market Research analyzes that the Asia-Pacific structural health monitoring market is expected to reach the value of USD 3,228.98 thousand by 2030, at a CAGR of 20.6% during the forecast period.
|
Report Metric |
Details |
|
Forecast Period |
2023 to 2030 |
|
Base Year |
2022 |
|
Historic Years |
2021 (Customizable to 2015-2020) |
|
Quantitative Units |
Revenue in USD Million, Pricing in USD |
|
Segments Covered |
By Type (Hardware, Software, and Services), Connectivity (Wired and Wireless), Installation Type (New installation and Retrofit), Method (Visual Inspection and Non-Destructive Evaluation), Application (Damage Detection, Crack Detection, Strain Monitoring, Wire Break Monitoring, Leakage Detection, Multimodal Sensing, Corrosion Detection, Hotspot Monitoring, Impact Monitoring, and Deflection Monitoring), End User (Civil, Aerospace, Energy, Mining, Marine, Industrial, Offshore Platform, Defense, School, Public Park and Recreation, Automotive, and Others) |
|
Countries Covered |
China, Japan, India, Australia, New Zealand, South Korea, Singapore, Malaysia, Thailand, Indonesia, Philippines, Vietnam, Taiwan and the rest of Asia-Pacific |
|
Market Players Covered |
GEOKON, Campbell Scientific, Inc., SIXENSE Systems, Kinemetrics, Digitexx Data Systems, Inc., NATIONAL INSTRUMENTS CORP., OSMOS Group SA, HBK, Nova Ventures, Acellent Technologies Inc., James Fisher and Sons plc., SODIS Lab, GoeSIG Ltd, STRUCTURAL MONITORING SYSTEMS PLC., FEAC Engineering, Xylem Inc., Sisgeo S.r.l., FIRST SENSOR AG, Digitex, Geomotion Singapore, and COWI A/S, among others. |
Asia-Pacific Structural Health Monitoring Market Definition
Structural health monitoring (SHM) monitors changes in the material and geometric qualities of engineering structures, such as bridges and buildings, over time using periodically sampled response measurements. The output of this process is periodically updated information regarding the ability of the structure to perform its intended function in light of the inevitable aging and degradation resulting from operational environments for long-term structural health monitoring. After extreme events, such as earthquakes or blast loading, structural health monitoring is used for rapid condition screening and aims to provide, in near real-time, reliable information regarding the integrity of the structure.
Structural health monitoring offers the following numerous benefits to the customers: forecast and measures profits, Integrate and augment systems, track and measure construction activities, manage risk portfolio, boost revenue and enhance productivity, enable remote operations, reduce manual interactions, automate decisions, and others. Structural health monitoring simplifies communications between the system and the operators. It is helping the laborers to enhance their productivity and to optimize cost and operations.
Asia-Pacific Structural Health Monitoring Market Dynamics
This section deals with understanding the market drivers, advantages, opportunities, restraints, and challenges. All of this is discussed in detail below:
Drivers
- GROWING INFRASTRUCTURAL DEVELOPMENT ACROSS THE GLOBE
Structural health monitoring (SHM) is a range of systems implemented on full-scale civil infrastructures to assist and inform operators about the continued 'fitness for purpose' of structures under gradual or sudden changes to their state and to learn about either or both of the load and response mechanisms.
Infrastructure plays a critical role in economic and social development across the globe. It has huge importance in both developed and developing economies. The impact of seismic transformation in the economy has changed citizens' perspectives.
The importance of infrastructure is widely recognized and well-researched. However, there have been relatively few attempts to track and monitor infrastructure investment across countries where studies have assessed Asia-Pacific infrastructure needs; the adoption of myriad definitions and approaches has consistently made monitoring trends difficult. The various initiatives and developments in infrastructure across the globe are expected to drive the growth of the Asia-Pacific structural health monitoring market.
Restraint
- HIGH INSTALLATION AND MONITORING COSTS
The need and requirement for structural health monitoring systems have increased due to rapid digitalization and improved industrialization. Most complicated civil structures need structural health monitoring systems. But small structures cannot manage the structural health monitoring systems' installation cost and maintenance charges. As the need increases, the raw materials cost for structural health monitoring systems gradually increases.
Both capital expenditure (CAPEX) and operational expenditure (OPEX) are essential for structural health monitoring systems. The initial procurement of structural health monitoring systems, huge cabinets, and monitoring software is included in CAPEX. Structural health monitoring systems cost more than others because they require huge cabinets containing modules that allow growth. As a result, organizations must plan for their desired capacity to reap the full benefits of structural health monitoring systems. Structural health monitoring units require ongoing, high-cost maintenance after installation. High-complexity structures necessitate high-efficiency instrumentation, which raises total costs. Furthermore, the expenditures of monitoring are quite significant. Also, structural health monitoring systems involve costing issues in the maintenance and upgradation of the system, which is projected to restrain the market.
Opportunity
INTEGRATION OF TECHNOLOGICALLY ADVANCED SOLUTIONS FOR STRUCTURAL HEALTH MONITORING
Business process automation uses technology to execute recurring tasks or processes in a business where manual effort can be replaced. It is done to minimize costs, increase efficiency, and streamline processes. Digital transformation has been a top priority for companies in recent years, but now many businesses are taking a closer look at the actively evolving concept of digitalization.
Structural health monitoring implements a damage detection strategy for aerospace, civil and mechanical engineering infrastructure. Advances in sensors and information technologies have brought structural health monitoring (SHM) a data-driven remedy for civil infrastructure safety. Typical damage experienced by this infrastructure might be the development of fatigue cracks, degradation of structural connections, or bearing wear in rotating machinery. This application's structural health monitoring solution will integrate structural dynamics, wireless data acquisition, local actuation, micro-electromechanical systems (MEMS) technology, and statistical pattern recognition algorithms.
In a sense, the new integrated technologies involve the usage of ultrasonic, dye penetration, and fibroscopy, among others. The involvement of these integrated technologies does not cause any defect or damage to the critical structures because it is difficult to monitor the entire health of a structure using only one technique; the integration approach is the greatest instrument for structural health monitoring. As a result, many key players are focusing on developing cost-effective structural health monitoring solutions that incorporate electrical, magnetic, thermal, and other physical variables, chemical variables, and a variety of technologies to provide more accurate results, which is likely to boost the adoption of integrated structural health monitoring systems.
Challenge
LACK OF STANDARDIZATION IN MANAGING LARGE VOLUMES OF DATA
The lack of standardized terminology for categorizing and describing various interventions in the field of structural health monitoring involves structural factors, environmental factors, and others that are causing problems for the health of critical structures. The structural health monitoring solution installed places is classified depending upon the criticality of the civil structures and the location of the structures. Different structural health monitoring solutions, such as the sensor system, the data acquisition, and transmission system, the data management system, the condition evaluation system, and others, are used for different intense critical structures in dams, bridges, and other manufacturing industries. Therefore, standardization acts as the major factor that acts as a major challenge for the market.
The intensity of the critical civil structure determines the appropriate structural health monitoring solution to be used with standard harmonization. However, there are some differences in the product design, testing, and installation requirements between the business and the government system due to the difference in the classification of zones by manufacturers and regulatory bodies. The above factors led to the lack of standardization, which is challenging for the market.
Recent Developments
- In May 2021, Sisgeo S.r.l. introduced the MD-Profile gauges. The system is suitable for geotechnical and structural applications, for which vertical or horizontal accurate profiling is needed, to improve the product portfolio of the company.
- In November 2020, HBK updated or technically refined its compressive force transducer C10 to make it more cost-efficient due to increased precision. This helped the product as an ideal solution for demanding test branches, laboratory, and production applications.
Asia-Pacific Structural Health Monitoring Market Scope
Asia-Pacific structural health monitoring market is segmented into six notable segments such as type, connectivity, installation, method, application, and end user. The growth among segments helps you analyze niche pockets of growth and strategies to approach the market and determine your core application areas and the difference in your target markets.
ASIA-PACIFIC STRUCTURAL HEALTH MONITORING MARKET, BY TYPE
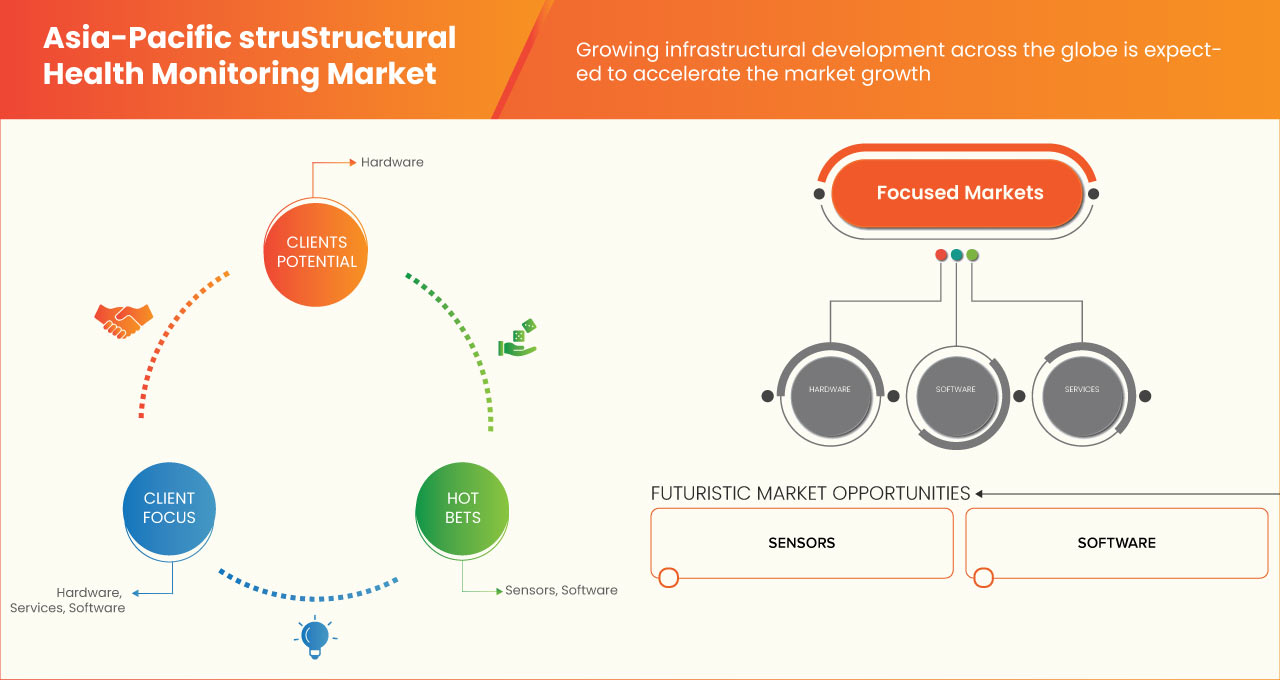
- Hardware
- Software
- Services
On the basis of type, the Asia-Pacific structural health monitoring market is segmented into hardware, software and services.
ASIA-PACIFIC STRUCTURAL HEALTH MONITORING MARKET, BY CONNECTIVITY
- Wired
- Wireless
On the basis of connectivity, the Asia-Pacific structural health monitoring market is segmented into wired and wireless.
ASIA-PACIFIC STRUCTURAL HEALTH MONITORING MARKET, BY INSTALLATION TYPE
- New Installation
- Retrofit
On the basis of installation, the Asia-Pacific structural health monitoring market is segmented into new installation and retrofit.
ASIA-PACIFIC STRUCTURAL HEALTH MONITORING MARKET, BY METHOD
- Visual Inspection
- Non-Destructive Evaluation (NDE)
On the basis of method, the Asia-Pacific structural health monitoring market is segmented into visual inspection and non-destructive evaluation.
ASIA-PACIFIC STRUCTURAL HEALTH MONITORING MARKET, BY APPLICATION
- Damage Detection
- Crack Detection
- Strain Monitoring
- Wire Break Monitoring
- Leakage Detection
- Multimodal Sensing
- Corrosion Monitoring
- Hotspot Monitoring
- Impact Monitoring
- Deflection Monitoring
On the basis of application, the Asia-Pacific structural health monitoring market is segmented into damage detection, crack detection, strain monitoring, wire break monitoring, leakage detection, multimodal sensing, corrosion monitoring, hotspot monitoring, impact monitoring and deflection monitoring.
ASIA-PACIFIC STRUCTURAL HEALTH MONITORING MARKET, BY END USER
- Civil
- Aerospace
- Energy
- Mining
- Marine
- Industrial
- Offshore Platform
- Defense
- Schools
- Public Parks And Recreation
- Automotive
- Others
On the basis of end user, the Asia-Pacific structural health monitoring market is segmented into civil, aerospace, energy, mining, marine, industrial, offshore platform, defense, school, public park & recreation, automotive and others.
Asia-Pacific Structural Health Monitoring Market Regional Analysis/Insights
The Asia-Pacific structural health monitoring market is categorized into six notable segments such as type, connectivity, installation type, method, application, and end user.
The countries covered in this market report China, Japan, India, Australia, New Zealand, South Korea, Singapore, Malaysia, Thailand, Indonesia, Philippines, Vietnam, Taiwan, and the rest of Asia-Pacific.
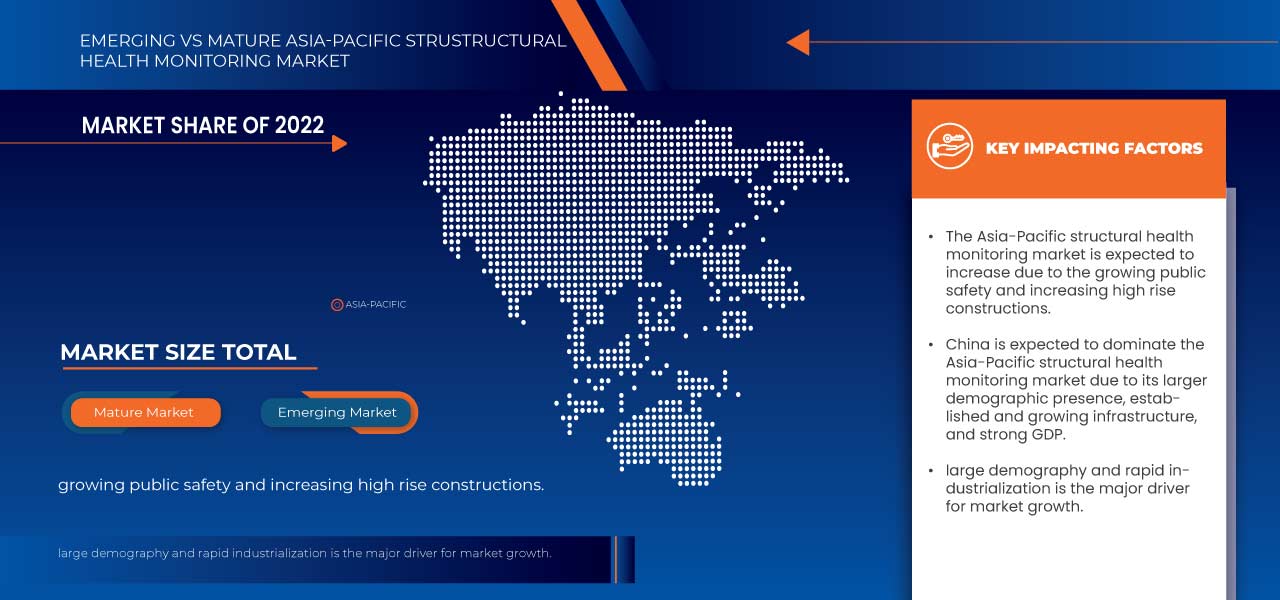
China dominates Asia-Pacific region due to due to increasing customer inclinations towards advanced technological processes.
The country section of the report also provides individual market impacting factors and changes in regulation in the market domestically that impact the current and future trends of the market. Data points such as new sales, replacement sales, country demographics, regulatory acts, and import-export tariffs are some of the major pointers used to forecast the market scenario for individual countries. In addition, presence and availability of Asia-Pacific brands and their challenges faced due to large or scarce competition from local and domestic brands, and impact of sales channels are considered while providing forecast analysis of the country data.
Competitive Landscape and Asia-Pacific Structural Health Monitoring Market Share Analysis
Asia-Pacific structural health monitoring market competitive landscape provides details by competitor. Details included are company overview, company financials, revenue generated, market potential, investment in R&D, new market initiatives, production sites and facilities, company strengths and weaknesses, product launch, product approvals, product width and breath, application dominance, product type lifeline curve. The above data points provided are only related to the company’s focus on the Asia-Pacific structural health monitoring market.
Some of the major players operating in the structural health monitoring market are GEOKON, Campbell Scientific, Inc., SIXENSE Systems, Kinemetrics, Digitexx Data Systems, Inc., NATIONAL INSTRUMENTS CORP., OSMOS Group SA, HBK, Nova Ventures, Acellent Technologies Inc., James Fisher and Sons plc., SODIS Lab, GoeSIG Ltd, STRUCTURAL MONITORING SYSTEMS PLC., FEAC Engineering, Xylem Inc., Sisgeo S.r.l., FIRST SENSOR AG, Digitex, Geomotion Singapore, and COWI A/S, among others.
SKU-

- Interactive Data Analysis Dashboard
- Company Analysis Dashboard for high growth potential opportunities
- Research Analyst Access for customization & queries
- Competitor Analysis with Interactive dashboard
- Latest News, Updates & Trend analysis
- Harness the Power of Benchmark Analysis for Comprehensive Competitor Tracking
Table of Content
1 INTRODUCTION
1.1 OBJECTIVES OF THE STUDY
1.2 MARKET DEFINITION
1.3 OVERVIEW OF THE ASIA PACIFIC STRUCTURAL HEALTH MONITORING MARKET
1.4 CURRENCY AND PRICING
1.5 LIMITATIONS
1.6 MARKETS COVERED
2 MARKET SEGMENTATION
2.1 MARKETS COVERED
2.2 GEOGRAPHICAL SCOPE
2.3 YEARS CONSIDERED FOR THE STUDY
2.4 DBMR TRIPOD DATA VALIDATION MODEL
2.5 PRIMARY INTERVIEWS WITH KEY OPINION LEADERS
2.6 DBMR MARKET POSITION GRID
2.7 VENDOR SHARE ANALYSIS
2.8 MULTIVARIATE MODELING
2.9 TYPE TIMELINE CURVE
2.1 MARKET APPLICATION COVERAGE GRID
2.11 SECONDARY SOURCES
2.12 ASSUMPTIONS
3 EXECUTIVE SUMMARY
4 PREMIUM INSIGHTS
4.1 POTER’S FIVE FORCES
4.2 ASIA PACIFIC STRUCTURAL HEALTH MONITORING MARKET, REGULATIONS
4.3 TECHNOLOGICAL TRENDS
4.4 PATENT ANALYSIS
4.5 ASIA PACIFIC STRUCTURAL HEALTH MONITORING MARKET, VALUE CHAIN ANALYSIS
4.6 CASE STUDIES
5 MARKET OVERVIEW
5.1 DRIVERS
5.1.1 GROWING INFRASTRUCTURAL DEVELOPMENT ACROSS THE GLOBE
5.1.2 INCREASING AUTOMATION, AND STANDARDIZATION IN THE MAINTENANCE & REPAIR OF CIVIL INFRASTRUCTURE
5.1.3 GROWING ADVANCEMENT IN SENSOR TECHNOLOGIES
5.1.4 IMPROVED SAFETY, AND MAINTAINABILITY OF CRITICAL STRUCTURES
5.2 RESTRAINTS
5.2.1 HIGH INSTALLATION AND MONITORING COSTS
5.2.2 INACCURATE RESULTS DUE TO CALIBRATION ERRORS
5.2.3 FLUCTUATING PRICES OF RAW MATERIALS
5.3 OPPORTUNITIES
5.3.1 INTEGRATION OF TECHNOLOGICALLY ADVANCED SOLUTIONS FOR STRUCTURAL HEALTH MONITORING
5.3.2 GROWTH IN INVESTMENTS IN INFRASTRUCTURE AND ADVANCES IN WIRELESS SENSOR NETWORKS
5.3.3 INCREASE IN VARIOUS STRATEGIC DECISIONS, SUCH AS PARTNERSHIP AND ACQUISITION
5.4 CHALLENGES
5.4.1 REQUIREMENT OF SKILLED OPERATORS FOR INSTALLATION AND CALIBRATION OF STRUCTURAL HEALTH MONITORING INSTRUMENTS
5.4.2 LACK OF STANDARDIZATION IN MANAGING LARGE VOLUMES OF DATA
5.4.3 TECHNICAL CHALLENGES AND OPERATIONAL FACTORS
6 ASIA PACIFIC STRUCTURAL HEALTH MONITORING MARKET, BY TYPE
6.1 OVERVIEW
6.2 HARDWARE
6.2.1 SENSORS
6.2.1.1 ACCELEROMETERS
6.2.1.2 ULTRASONIC SENSORS
6.2.1.3 TEMPERATURE SENSORS
6.2.1.4 STRAIN GAUGES
6.2.1.5 CORROSION SENSORS
6.2.1.6 DISPLACEMENT SENSOR
6.2.1.7 INCLINOMETERS AND TILT METERS
6.2.1.8 SEISMOMETERS
6.2.1.9 OTHERS
6.2.2 DATA ACQUISITION UNITS
6.2.3 AMPLIFIERS
6.2.4 CAMERA
6.2.5 OTHERS
6.3 SOFTWARE
6.4 SERVICES
6.4.1 INSTALLATION
6.4.1.1 PRE INSTALLATION
6.4.1.2 POST INSTALLATION
6.4.2 DESIGNING AND CONSULTING
6.4.3 MAINTENANCE
7 ASIA PACIFIC STRUCTURAL HEALTH MONITORING MARKET, BY CONNECTIVITY
7.1 OVERVIEW
7.2 WIRED
7.3 WIRELESS
8 ASIA PACIFIC STRUCTURAL HEALTH MONITORING MARKET, BY INSTALLATION TYPE
8.1 OVERVIEW
8.2 NEW INSTALLATION
8.3 RETROFIT
9 ASIA PACIFIC STRUCTURAL HEALTH MONITORING MARKET, BY METHOD
1.1. OVERVIEW
9.1 VISUAL INSPECTION
9.1.1 DATA-BASED TECHNIQUES
9.1.2 MODEL BASED TECHNIQUES
9.2 NON-DESTRUCTIVE EVALUATION (NDE)
10 ASIA PACIFIC STRUCTURAL HEALTH MONITORING MARKET, BY APPLICATION
10.1 OVERVIEW
10.2 DAMAGE DETECTION
10.3 CRACK DETECTION
10.4 STRAIN MONITORING
10.5 WIRE BREAK MONITORING
10.5.1 IN POST TENSION CONCRETE STRUCTURE
10.5.2 SUSPENSION AND CABLE STAY BRIDGES
10.6 LEAKAGE DETECTION
10.7 MULTIMODAL SENSING
10.8 CORROSION MONITORING
10.9 HOTSPOT MONITORING
10.1 IMPACT MONITORING
10.11 DEFLECTION MONITORING
11 ASIA PACIFIC STRUCTURAL HEALTH MONITORING MARKET, BY END USER
11.1 OVERVIEW
11.2 CIVIL
11.2.1 BUILDING
11.2.1.1 DAMAGE DETECTION
11.2.1.2 CRACK DETECTION
11.2.1.3 STRAIN MONITORING
11.2.1.4 WIRE BREAK MONITORING
11.2.1.5 LEAKAGE DETECTION
11.2.1.6 MULTIMODAL SENSING
11.2.1.7 CORROSION MONITORING
11.2.1.8 HOTSPOT MONITORING
11.2.1.9 IMPACT MONITORING
11.2.1.10 DEFLECTION MONITORING
11.2.2 BRIDGES
11.2.2.1 DAMAGE DETECTION
11.2.2.2 CRACK DETECTION
11.2.2.3 STRAIN MONITORING
11.2.2.4 WIRE BREAK MONITORING
11.2.2.5 LEAKAGE DETECTION
11.2.2.6 MULTIMODAL SENSING
11.2.2.7 CORROSION MONITORING
11.2.2.8 HOTSPOT MONITORING
11.2.2.9 IMPACT MONITORING
11.2.2.10 DEFLECTION MONITORING
11.2.3 TUNNELS
11.2.3.1 DAMAGE DETECTION
11.2.3.2 CRACK DETECTION
11.2.3.3 STRAIN MONITORING
11.2.3.4 HOTSPOT MONITORING
11.2.3.5 LEAKAGE DETECTION
11.2.3.6 WIRE BREAK MONITORING
11.2.3.7 CORROSION MONITORING
11.2.3.8 MULTIMODAL SENSING
11.2.3.9 IMPACT MONITORING
11.2.3.10 DEFLECTION MONITORING
11.2.4 DAMS
11.2.4.1 DAMAGE DETECTION
11.2.4.2 CRACK DETECTION
11.2.4.3 STRAIN MONITORING
11.2.4.4 IMPACT MONITORING
11.2.4.5 LEAKAGE DETECTION
11.2.4.6 MULTIMODAL SENSING
11.2.4.7 CORROSION MONITORING
11.2.4.8 HOTSPOT MONITORING
11.2.4.9 IMPACT MONITORING
11.2.4.10 DEFLECTION MONITORING
11.2.5 ROADS
11.2.5.1 DAMAGE DETECTION
11.2.5.2 CRACK DETECTION
11.2.5.3 STRAIN MONITORING
11.2.5.4 IMPACT MONITORING
11.2.5.5 HOTSPOT MONITORING
11.2.5.6 LEAKAGE DETECTION
11.2.5.7 MULTIMODAL SENSING
11.2.5.8 DEFLECTION MONITORING
11.2.5.9 WIRE BREAK MONITORING
11.2.5.10 CORROSION MONITORING
11.2.6 STADIUM
11.2.6.1 DAMAGE DETECTION
11.2.6.2 CRACK DETECTION
11.2.6.3 STRAIN MONITORING
11.2.6.4 CORROSION MONITORING
11.2.6.5 LEAKAGE DETECTION
11.2.6.6 WIRE BREAK MONITORING
11.2.6.7 MULTIMODAL SENSING
11.2.6.8 HOTSPOT MONITORING
11.2.6.9 IMPACT MONITORING
11.2.6.10 DEFLECTION MONITORING
11.2.7 OTHERS
11.3 AEROSPACE
11.3.1 DAMAGE DETECTION
11.3.2 IMPACT MONITORING
11.3.3 CORROSION MONITORING
11.3.4 CRACK DETECTION
11.3.5 STRAIN MONITORING
11.3.6 WIRE BREAK MONITORING
11.3.7 LEAKAGE DETECTION
11.3.8 MULTIMODAL SENSING
11.3.9 HOTSPOT MONITORING
11.3.10 DEFLECTION MONITORING
11.4 ENERGY
11.4.1 DAMAGE DETECTION
11.4.2 IMPACT MONITORING
11.4.3 CORROSION MONITORING
11.4.4 CRACK DETECTION
11.4.5 STRAIN MONITORING
11.4.6 WIRE BREAK MONITORING
11.4.7 LEAKAGE DETECTION
11.4.8 MULTIMODAL SENSING
11.4.9 HOTSPOT MONITORING
11.4.10 DEFLECTION MONITORING
11.4.10.1 WIND TURBINE
11.4.10.1.1 DAMAGE DETECTION
11.4.10.1.2 CRACK DETECTION
11.4.10.1.3 STRAIN MONITORING
11.4.10.1.4 WIRE BREAK MONITORING
11.4.10.1.5 CORROSION MONITORING
11.4.10.1.6 MULTIMODAL SENSING
11.4.10.1.7 LEAKAGE DETECTION
11.4.10.1.8 HOTSPOT MONITORING
11.4.10.1.9 IMPACT MONITORING
11.4.10.1.10 DEFLECTION MONITORING
11.4.10.2 OTHERS
11.5 MINING
11.5.1 LEAKAGE DETECTION
11.5.2 DAMAGE DETECTION
11.5.3 CRACK DETECTION
11.5.4 WIRE BREAK MONITORING
11.5.5 IMPACT MONITORING
11.5.6 CORROSION MONITORING
11.5.7 STRAIN MONITORING
11.5.8 MULTIMODAL SENSING
11.5.9 HOTSPOT MONITORING
11.5.10 DEFLECTION MONITORING
11.6 MARINE
11.6.1 DAMAGE DETECTION
11.6.2 CRACK DETECTION
11.6.3 LEAKAGE DETECTION
11.6.4 STRAIN MONITORING
11.6.5 CORROSION MONITORING
11.6.6 IMPACT MONITORING
11.6.7 HOTSPOT MONITORING
11.6.8 MULTIMODAL SENSING
11.6.9 DEFLECTION MONITORING
11.6.10 WIRE BREAK MONITORING
11.7 INDUSTRIAL
11.7.1 DAMAGE DETECTION
11.7.2 CRACK DETECTION
11.7.3 STRAIN MONITORING
11.7.4 CORROSION MONITORING
11.7.5 LEAKAGE DETECTION
11.7.6 WIRE BREAK MONITORING
11.7.7 MULTIMODAL SENSING
11.7.8 HOTSPOT MONITORING
11.7.9 IMPACT MONITORING
11.7.10 DEFLECTION MONITORING
11.8 OFFSHORE PLATFORM
11.8.1 CORROSION MONITORING
11.8.2 LEAKAGE DETECTION
11.8.3 DAMAGE DETECTION
11.8.4 CRACK DETECTION
11.8.5 STRAIN MONITORING
11.8.6 WIRE BREAK MONITORING
11.8.7 LEAKAGE DETECTION
11.8.8 MULTIMODAL SENSING
11.8.9 HOTSPOT MONITORING
11.8.10 DEFLECTION MONITORING
11.9 DEFENSE
11.9.1 DAMAGE DETECTION
11.9.2 CORROSION MONITORING
11.9.3 CRACK DETECTION
11.9.4 STRAIN MONITORING
11.9.5 WIRE BREAK MONITORING
11.9.6 IMPACT MONITORING
11.9.7 MULTIMODAL SENSING
11.9.8 LEAKAGE DETECTION
11.9.9 HOTSPOT MONITORING
11.9.10 DEFLECTION MONITORING
11.1 SCHOOLS
11.10.1 DAMAGE DETECTION
11.10.2 CRACK DETECTION
11.10.3 STRAIN MONITORING
11.10.4 WIRE BREAK MONITORING
11.10.5 LEAKAGE DETECTION
11.10.6 MULTIMODAL SENSING
11.10.7 CORROSION MONITORING
11.10.8 HOTSPOT MONITORING
11.10.9 IMPACT MONITORING
11.10.10 DEFLECTION MONITORING
11.11 PUBLIC PARKS AND RECREATION
11.11.1 DAMAGE DETECTION
11.11.2 CRACK DETECTION
11.11.3 STRAIN MONITORING
11.11.4 WIRE BREAK MONITORING
11.11.5 CORROSION MONITORING
11.11.6 LEAKAGE DETECTION
11.11.7 MULTIMODAL SENSING
11.11.8 HOTSPOT MONITORING
11.11.9 IMPACT MONITORING
11.11.10 DEFLECTION MONITORING
11.12 AUTOMOTIVE
11.12.1 DAMAGE DETECTION
11.12.2 CRACK DETECTION
11.12.3 STRAIN MONITORING
11.12.4 IMPACT MONITORING
11.12.5 COROSSION MONITORING
11.12.6 WIRE BREAK MONITORING
11.12.7 LEAKAGE DETECTION
11.12.8 MULTIMODAL SENSING
11.12.9 HOTSPOT MONITORING
11.12.10 DEFLECTION MONITORING
11.13 OTHERS
12 ASIA PACIFIC STRUCTURAL HEALTH MONITORING MARKET, BY REGION
12.1 ASIA-PACIFIC
12.1.1 CHINA
12.1.2 JAPAN
12.1.3 INDIA
12.1.4 SOUTH KOREA
12.1.5 AUSTRALIA
12.1.6 SINGAPORE
12.1.7 THAILAND
12.1.8 MALAYSIA
12.1.9 INDONESIA
12.1.10 NEW ZEALAND
12.1.11 PHILIPPINES
12.1.12 TAIWAN
12.1.13 VIETNAM
12.1.14 REST OF ASIA-PACIFIC
13 ASIA PACIFIC STRUCTURAL HEALTH MONITORING MARKET, COMPANY LANDSCAPE
13.1 COMPANY SHARE ANALYSIS: ASIA PACIFIC
14 SWOT ANALYSIS
15 COMPANY PROFILE
15.1 XYLEM INC.
15.1.1 COMPANY SNAPSHOT
15.1.2 REVENUE ANALYSIS
15.1.3 COMPANY SHARE ANALYSIS
15.1.4 PRODUCT PORTFOLIO
15.1.5 RECENT DEVELOPMENTS
15.2 NATIONAL INSTRUMENTS CORP.
15.2.1 COMPANY SNAPSHOT
15.2.2 REVENUE ANALYSIS
15.2.3 COMPANY SHARE ANALYSIS
15.2.4 PRODUCT PORTFOLIO
15.2.5 RECENT DEVELOPMENTS
15.3 JAMES FISHER AND SONS PLC. (2022)
15.3.1 COMPANY SNAPSHOT
15.3.2 REVENUE ANALYSIS
15.3.3 COMPANY SHARE ANALYSIS
15.3.4 PRODUCT PORTFOLIO
15.3.5 RECENT DEVELOPMENTS
15.4 HBK
15.4.1 COMPANY SNAPSHOT
15.4.2 COMPANY SHARE ANALYSIS
15.4.3 PRODUCT PORTFOLIO
15.4.4 RECENT DEVELOPMENTS
15.5 COWI A/S
15.5.1 COMPANY SNAPSHOT
15.5.2 REVENUE ANALYSIS
15.5.3 COMPANY SHARE ANALYSIS
15.5.4 PRODUCT PORTFOLIO
15.5.5 RECENT DEVELOPMENT
15.6 ACELLENT TECHNOLOGIES INC.
15.6.1 COMPANY SNAPSHOT
15.6.2 PRODUCT PORTFOLIO
15.6.3 RECENT DEVELOPMENTS
15.7 CAMPBELL SCIENTIFIC, INC.
15.7.1 COMPANY SNAPSHOT
15.7.2 PRODUCT PORTFOLIO
15.7.3 RECENT DEVELOPMENTS
15.8 DIGITEX
15.8.1 COMPANY SNAPSHOT
15.8.2 PRODUCT PORTFOLIO
15.8.3 RECENT DEVELOPMENT
15.9 DIGITEXX DATA SYSTEMS, INC.
15.9.1 COMPANY SNAPSHOT
15.9.2 PRODUCT PORTFOLIO
15.9.3 RECENT DEVELOPMENT
15.1 FEAC ENGINEERING
15.10.1 COMPANY SNAPSHOT
15.10.2 PRODUCT PORTFOLIO
15.10.3 RECENT DEVELOPMENTS
15.11 FIRST SENSOR AG (2022)
15.11.1 COMPANY SNAPSHOT
15.11.2 REVENUE ANALYSIS
15.11.3 PRODUCT PORTFOLIO
15.11.4 RECENT DEVELOPMENTS
15.12 GEOKON
15.12.1 COMPANY SNAPSHOT
15.12.2 PRODUCT PORTFOLIO
15.12.3 RECENT DEVELOPMENTS
15.13 GEOMOTION SINGAPORE
15.13.1 COMPANY SNAPSHOT
15.13.2 PRODUCT PORTFOLIO
15.13.3 RECENT DEVELOPMENT
15.14 GEOSIG LTD
15.14.1 COMPANY SNAPSHOT
15.14.2 PRODUCT PORTFOLIO
15.14.3 RECENT DEVELOPMENTS
15.15 KINEMETRICS
15.15.1 COMPANY SNAPSHOT
15.15.2 PRODUCT PORTFOLIO
15.15.3 RECENT DEVELOPMENTS
15.16 NOVA VENTURES
15.16.1 COMPANY SNAPSHOT
15.16.2 PRODUCT PORTFOLIO
15.16.3 RECENT DEVELOPMENTS
15.17 OSMOS GROUP SA
15.17.1 COMPANY SNAPSHOT
15.17.2 PRODUCT PORTFOLIO
15.17.3 RECENT DEVELOPMENTS
15.18 SISGEO S.R.L.
15.18.1 COMPANY SNAPSHOT
15.18.2 PRODUCT PORTFOLIO
15.18.3 RECENT DEVELOPMENTS
15.19 SIXENSE SYSTEMS
15.19.1 COMPANY SNAPSHOT
15.19.2 PRODUCT PORTFOLIO
15.19.3 RECENT DEVELOPMENTS
15.2 SODIS LAB
15.20.1 COMPANY SNAPSHOT
15.20.2 PRODUCT PORTFOLIO
15.20.3 RECENT DEVELOPMENTS
15.21 STRUCTURAL MONITORING SYSTEMS PLC. (2022)
15.21.1 COMPANY SNAPSHOT
15.21.2 REVENUE ANALYSIS
15.21.3 PRODUCT PORTFOLIO
15.21.4 RECENT DEVELOPMENT
16 QUESTIONNAIRE
17 RELATED REPORTS
List of Table
TABLE 1 ASIA PACIFIC STRUCTURAL HEALTH MONITORING MARKET, BY TYPE, 2021-2030 (USD MILLION)
TABLE 2 ASIA PACIFIC HARDWARE IN STRUCTURAL HEALTH MONITORING MARKET, BY REGION, 2021-2030 (USD MILLION)
TABLE 3 ASIA PACIFIC HARDWARE IN STRUCTURAL HEALTH MONITORING MARKET, BY TYPE, 2021-2030 (USD MILLION)
TABLE 4 ASIA PACIFIC SENSORS IN STRUCTURAL HEALTH MONITORING MARKET, BY TYPE, 2021-2030 (USD MILLION)
TABLE 5 ASIA PACIFIC SOFTWARE IN STRUCTURAL HEALTH MONITORING MARKET, BY REGION, 2021-2030 (USD MILLION)
TABLE 6 ASIA PACIFIC SERVICES IN STRUCTURAL HEALTH MONITORING MARKET, BY REGION, 2021-2030 (USD MILLION)
TABLE 7 ASIA PACIFIC SERVICES IN STRUCTURAL HEALTH MONITORING MARKET, BY TYPE, 2021-2030 (USD MILLION)
TABLE 8 ASIA PACIFIC INSTALLATION IN STRUCTURAL HEALTH MONITORING MARKET, BY TYPE, 2021-2030 (USD MILLION)
TABLE 9 ASIA PACIFIC STRUCTURAL HEALTH MONITORING MARKET, BY CONNECTIVITY, 2021-2030 (USD MILLION)
TABLE 10 ASIA PACIFIC WIRED IN STRUCTURAL HEALTH MONITORING MARKET, BY REGION, 2021-2030 (USD MILLION)
TABLE 11 ASIA PACIFIC WIRELESS IN STRUCTURAL HEALTH MONITORING MARKET, BY REGION, 2021-2030 (USD MILLION)
TABLE 12 ASIA PACIFIC STRUCTURAL HEALTH MONITORING MARKET, BY INSTALLATION TYPE, 2021-2030 (USD MILLION)
TABLE 13 ASIA PACIFIC NEW INSTALLATION IN STRUCTURAL HEALTH MONITORING MARKET, BY REGION, 2021-2030 (USD MILLION)
TABLE 14 ASIA PACIFIC RETROFIT IN STRUCTURAL HEALTH MONITORING MARKET, BY REGION, 2021-2030 (USD MILLION)
TABLE 15 ASIA PACIFIC STRUCTURAL HEALTH MONITORING MARKET, BY METHOD, 2021-2030 (USD MILLION)
TABLE 16 ASIA PACIFIC VISUAL INSPECTION IN STRUCTURAL HEALTH MONITORING MARKET, BY REGION, 2021-2030 (USD MILLION)
TABLE 17 ASIA PACIFIC VISUAL INSPECTION IN STRUCTURAL HEALTH MONITORING, BY METHOD, 2021-2030 (USD MILLION)
TABLE 18 ASIA PACIFIC NON-DESTRUCTIVE EVALUATION IN STRUCTURAL HEALTH MONITORING MARKET, BY REGION, 2021-2030 (USD MILLION)
TABLE 19 ASIA PACIFIC STRUCTURAL HEALTH MONITORING MARKET, BY APPLICATION, 2021-2030 (USD MILLION)
TABLE 20 ASIA PACIFIC DAMAGE DETECTION IN STRUCTURAL HEALTH MONITORING MARKET, BY REGION, 2019-2028 (USD MILLION)
TABLE 21 ASIA PACIFIC CRACK DETECTION IN STRUCTURAL HEALTH MONITORING MARKET, BY REGION, 2019-2028 (USD MILLION)
TABLE 22 ASIA PACIFIC STRAIN MONITORING IN STRUCTURAL HEALTH MONITORING MARKET, BY REGION, 2019-2028 (USD MILLION)
TABLE 23 ASIA PACIFIC WIRE BREAK MONITORING IN STRUCTURAL HEALTH MONITORING MARKET, BY REGION, 2019-2028 (USD MILLION)
TABLE 24 ASIA PACIFIC WIRE BREAK MONITORING IN STRUCTURAL HEALTH MONITORING MARKET, BY APPLICATION, 2021-2030 (USD MILLION)
TABLE 25 ASIA PACIFIC LEAKAGE DETECTION IN STRUCTURAL HEALTH MONITORING MARKET, BY REGION, 2019-2028 (USD MILLION)
TABLE 26 ASIA PACIFIC LEAKAGE DETECTION IN STRUCTURAL HEALTH MONITORING MARKET, BY REGION, 2019-2028 (USD MILLION)
TABLE 27 ASIA PACIFIC CORROSION MONITORING IN STRUCTURAL HEALTH MONITORING MARKET, BY REGION, 2019-2028 (USD MILLION)
TABLE 28 ASIA PACIFIC HOTSPOT MONITORING IN STRUCTURAL HEALTH MONITORING MARKET, BY REGION, 2019-2028 (USD MILLION)
TABLE 29 ASIA PACIFIC IMPACT MONITORING IN STRUCTURAL HEALTH MONITORING MARKET, BY REGION, 2019-2028 (USD MILLION)
TABLE 30 ASIA PACIFIC DEFLECTION MONITORING IN STRUCTURAL HEALTH MONITORING MARKET, BY REGION, 2019-2028 (USD MILLION)
TABLE 31 ASIA PACIFIC STRUCTURAL HEALTH MONITORING MARKET, BY END USER, 2021-2030 (USD MILLION)
TABLE 32 ASIA PACIFIC CIVIL IN STRUCTURAL HEALTH MONITORING MARKET, BY REGION, 2019-2028 (USD MILLION)
TABLE 33 ASIA PACIFIC CIVIL IN STRUCTURAL HEALTH MONITORING MARKET, BY TYPE, 2021-2030 (USD MILLION)
TABLE 34 ASIA PACIFIC BUILDING IN STRUCTURAL HEALTH MONITORING MARKET, BY APPLICATION, 2021-2030 (USD MILLION)
TABLE 35 ASIA PACIFIC BRIDGES IN STRUCTURAL HEALTH MONITORING MARKET, BY APPLICATION, 2021-2030 (USD MILLION)
TABLE 36 ASIA PACIFIC TUNNELS IN STRUCTURAL HEALTH MONITORING MARKET, BY APPLICATION, 2021-2030 (USD MILLION)
TABLE 37 ASIA PACIFIC BRIDGES IN STRUCTURAL HEALTH MONITORING MARKET, BY APPLICATION, 2021-2030 (USD MILLION)
TABLE 38 ASIA PACIFIC ROADS IN STRUCTURAL HEALTH MONITORING MARKET, BY APPLICATION, 2021-2030 (USD MILLION)
TABLE 39 ASIA PACIFIC STADIUM IN STRUCTURAL HEALTH MONITORING MARKET, BY APPLICATION, 2021-2030 (USD MILLION)
TABLE 40 ASIA PACIFIC AEROSPACE IN STRUCTURAL HEALTH MONITORING MARKET, BY REGION, 2021-2030 (USD MILLION)
TABLE 41 ASIA PACIFIC AEROSPACE IN STRUCTURAL HEALTH MONITORING MARKET, BY APPLICATION, 2021-2030 (USD MILLION)
TABLE 42 ASIA PACIFIC ENERGY IN STRUCTURAL HEALTH MONITORING MARKET, BY REGION, 2021-2030 (USD MILLION)
TABLE 43 ASIA PACIFIC ENERGY IN STRUCTURAL HEALTH MONITORING MARKET, BY APPLICATION, 2021-2030 (USD MILLION)
TABLE 44 ASIA PACIFIC ENERGY IN STRUCTURAL HEALTH MONITORING MARKET, BY TYPE, 2021-2030 (USD MILLION)
TABLE 45 ASIA PACIFIC WIND TURBINE IN STRUCTURAL HEALTH MONITORING MARKET, BY APPLICATION, 2021-2030 (USD MILLION)
TABLE 46 ASIA PACIFIC MINING IN STRUCTURAL HEALTH MONITORING MARKET, BY REGION, 2021-2030 (USD MILLION)
TABLE 47 ASIA PACIFIC MINING IN STRUCTURAL HEALTH MONITORING MARKET, BY APPLICATION, 2021-2030 (USD MILLION)
TABLE 48 ASIA PACIFIC MARINE IN STRUCTURAL HEALTH MONITORING MARKET, BY REGION, 2021-2030 (USD MILLION)
TABLE 49 ASIA PACIFIC AEROSPACE IN STRUCTURAL HEALTH MONITORING MARKET, BY APPLICATION, 2021-2030 (USD MILLION)
TABLE 50 ASIA PACIFIC INDUSTRIAL IN STRUCTURAL HEALTH MONITORING MARKET, BY REGION, 2021-2030 (USD MILLION)
TABLE 51 ASIA PACIFIC INDUSTRIAL IN STRUCTURAL HEALTH MONITORING MARKET, BY APPLICATION, 2021-2030 (USD MILLION)
TABLE 52 ASIA PACIFIC OFFSHORE PLATFORM IN STRUCTURAL HEALTH MONITORING MARKET, BY REGION, 2021-2030 (USD MILLION)
TABLE 53 ASIA PACIFIC OFFSHORE PLATFORM IN STRUCTURAL HEALTH MONITORING MARKET, BY APPLICATION, 2021-2030 (USD MILLION)
TABLE 54 ASIA PACIFIC DEFENSE IN STRUCTURAL HEALTH MONITORING MARKET, BY REGION, 2021-2030 (USD MILLION)
TABLE 55 ASIA PACIFIC DEFENSE IN STRUCTURAL HEALTH MONITORING MARKET, BY APPLICATION, 2021-2030 (USD MILLION)
TABLE 56 ASIA PACIFIC SCHOOLS IN STRUCTURAL HEALTH MONITORING MARKET, BY REGION, 2021-2030 (USD MILLION)
TABLE 57 ASIA PACIFIC SCHOOLS IN STRUCTURAL HEALTH MONITORING MARKET, BY APPLICATION, 2021-2030 (USD MILLION)
TABLE 58 ASIA PACIFIC PUBLIC PARKS AND RECREATION IN STRUCTURAL HEALTH MONITORING MARKET, BY REGION, 2021-2030 (USD MILLION)
TABLE 59 ASIA PACIFIC PUBLIC PARKS AND RECREATION IN STRUCTURAL HEALTH MONITORING MARKET, BY APPLICATION, 2021-2030 (USD MILLION)
TABLE 60 ASIA PACIFIC AUTOMOTIVE IN STRUCTURAL HEALTH MONITORING MARKET, BY REGION, 2021-2030 (USD MILLION)
TABLE 61 ASIA PACIFIC AUTOMOTIVE IN STRUCTURAL HEALTH MONITORING MARKET, BY APPLICATION, 2021-2030 (USD MILLION)
TABLE 62 ASIA PACIFIC OTHERS IN STRUCTURAL HEALTH MONITORING MARKET, BY REGION, 2021-2030 (USD MILLION)
TABLE 63 ASIA-PACIFIC STRUCTURAL HEALTH MONITORING MARKET, BY COUNTRY, 2021-2030 (USD MILLION)
TABLE 64 ASIA-PACIFIC STRUCTURAL HEALTH MONITORING, BY TYPE, 2021-2030 (USD MILLION)
TABLE 65 ASIA-PACIFIC HARDWARE IN STRUCTURAL HEALTH MONITORING, BY TYPE, 2021-2030 (USD MILLION)
TABLE 66 ASIA-PACIFIC SENSORS IN STRUCTURAL HEALTH MONITORING, BY TYPE, 2021-2030 (USD MILLION)
TABLE 67 ASIA-PACIFIC SERVICES IN STRUCTURAL HEALTH MONITORING, BY TYPE, 2021-2030 (USD MILLION)
TABLE 68 ASIA-PACIFIC INSTALLATION IN STRUCTURAL HEALTH MONITORING, BY TYPE, 2021-2030 (USD MILLION)
TABLE 69 ASIA-PACIFIC STRUCTURAL HEALTH MONITORING, BY CONNECTIVITY, 2021-2030 (USD MILLION)
TABLE 70 ASIA-PACIFIC STRUCTURAL HEALTH MONITORING, BY INSTALLATION TYPE, 2021-2030 (USD MILLION)
TABLE 71 ASIA-PACIFIC STRUCTURAL HEALTH MONITORING, BY METHOD, 2021-2030 (USD MILLION)
TABLE 72 ASIA-PACIFIC VISUAL INSPECTION IN STRUCTURAL HEALTH MONITORING, BY METHOD, 2021-2030 (USD MILLION)
TABLE 73 ASIA-PACIFIC STRUCTURAL HEALTH MONITORING, BY APPLICATION, 2021-2030 (USD MILLION)
TABLE 74 ASIA-PACIFIC WIRE BREAK MONITORING IN STRUCTURAL HEALTH MONITORING, BY APPLICATION, 2021-2030 (USD MILLION)
TABLE 75 ASIA-PACIFIC STRUCTURAL HEALTH MONITORING, BY END USER, 2021-2030 (USD MILLION)
TABLE 76 ASIA-PACIFIC CIVIL IN STRUCTURAL HEALTH MONITORING, BY TYPE, 2021-2030 (USD MILLION)
TABLE 77 ASIA-PACIFIC ENERGY IN STRUCTURAL HEALTH MONITORING, BY TYPE, 2021-2030 (USD MILLION)
TABLE 78 ASIA-PACIFIC BUILDING IN STRUCTURAL HEALTH MONITORING, BY APPLICATION, 2021-2030 (USD MILLION)
TABLE 79 ASIA-PACIFIC BRIDGES IN STRUCTURAL HEALTH MONITORING, BY APPLICATION, 2021-2030 (USD MILLION)
TABLE 80 ASIA-PACIFIC TUNNELS IN STRUCTURAL HEALTH MONITORING, BY APPLICATION, 2021-2030 (USD MILLION)
TABLE 81 ASIA-PACIFIC DAMS IN STRUCTURAL HEALTH MONITORING, BY APPLICATION, 2021-2030 (USD MILLION)
TABLE 82 ASIA-PACIFIC ROADS IN STRUCTURAL HEALTH MONITORING, BY APPLICATION, 2021-2030 (USD MILLION)
TABLE 83 ASIA-PACIFIC STADIUM IN STRUCTURAL HEALTH MONITORING, BY APPLICATION, 2021-2030 (USD MILLION)
TABLE 84 ASIA-PACIFIC AEROSPACE IN STRUCTURAL HEALTH MONITORING, BY APPLICATION, 2021-2030 (USD MILLION)
TABLE 85 ASIA-PACIFIC ENERGY IN STRUCTURAL HEALTH MONITORING, BY APPLICATION, 2021-2030 (USD MILLION)
TABLE 86 ASIA-PACIFIC WIND TURBINE IN STRUCTURAL HEALTH MONITORING, BY APPLICATION, 2021-2030 (USD MILLION)
TABLE 87 ASIA-PACIFIC MINING IN STRUCTURAL HEALTH MONITORING, BY APPLICATION, 2021-2030 (USD MILLION)
TABLE 88 ASIA-PACIFIC MARINE IN STRUCTURAL HEALTH MONITORING, BY APPLICATION, 2021-2030 (USD MILLION)
TABLE 89 ASIA-PACIFIC INDUSTRIAL IN STRUCTURAL HEALTH MONITORING, BY APPLICATION, 2021-2030 (USD MILLION)
TABLE 90 ASIA-PACIFIC OFFSHORE PLATFORM IN STRUCTURAL HEALTH MONITORING, BY APPLICATION, 2021-2030 (USD MILLION)
TABLE 91 ASIA-PACIFIC DEFENSE PLATFORM IN STRUCTURAL HEALTH MONITORING, BY APPLICATION, 2021-2030 (USD MILLION)
TABLE 92 ASIA-PACIFIC SCHOOLS IN STRUCTURAL HEALTH MONITORING, BY APPLICATION, 2021-2030 (USD MILLION)
TABLE 93 ASIA-PACIFIC PUBLIC PARKS AND RECREATION IN STRUCTURAL HEALTH MONITORING, BY APPLICATION, 2021-2030 (USD MILLION)
TABLE 94 ASIA-PACIFIC AUTOMOTIVE IN STRUCTURAL HEALTH MONITORING, BY APPLICATION, 2021-2030 (USD MILLION)
TABLE 95 CHINA STRUCTURAL HEALTH MONITORING, BY TYPE, 2021-2030 (USD MILLION)
TABLE 96 CHINA HARDWARE IN STRUCTURAL HEALTH MONITORING, BY TYPE, 2021-2030 (USD MILLION)
TABLE 97 CHINA SENSORS IN STRUCTURAL HEALTH MONITORING, BY TYPE, 2021-2030 (USD MILLION)
TABLE 98 CHINA SERVICES IN STRUCTURAL HEALTH MONITORING, BY TYPE, 2021-2030 (USD MILLION)
TABLE 99 CHINA INSTALLATION IN STRUCTURAL HEALTH MONITORING, BY TYPE, 2021-2030 (USD MILLION)
TABLE 100 CHINA STRUCTURAL HEALTH MONITORING, BY CONNECTIVITY, 2021-2030 (USD MILLION)
TABLE 101 CHINA STRUCTURAL HEALTH MONITORING, BY INSTALLATION TYPE, 2021-2030 (USD MILLION)
TABLE 102 CHINA STRUCTURAL HEALTH MONITORING, BY METHOD, 2021-2030 (USD MILLION)
TABLE 103 CHINA VISUAL INSPECTION IN STRUCTURAL HEALTH MONITORING, BY METHOD, 2021-2030 (USD MILLION)
TABLE 104 CHINA STRUCTURAL HEALTH MONITORING, BY APPLICATION, 2021-2030 (USD MILLION)
TABLE 105 CHINA WIRE BREAK MONITORING IN STRUCTURAL HEALTH MONITORING, BY APPLICATION, 2021-2030 (USD MILLION)
TABLE 106 CHINA STRUCTURAL HEALTH MONITORING, BY END USER, 2021-2030 (USD MILLION)
TABLE 107 CHINA CIVIL IN STRUCTURAL HEALTH MONITORING, BY TYPE, 2021-2030 (USD MILLION)
TABLE 108 CHINA ENERGY IN STRUCTURAL HEALTH MONITORING, BY TYPE, 2021-2030 (USD MILLION)
TABLE 109 CHINA BUILDING IN STRUCTURAL HEALTH MONITORING, BY APPLICATION, 2021-2030 (USD MILLION)
TABLE 110 CHINA BRIDGES IN STRUCTURAL HEALTH MONITORING, BY APPLICATION, 2021-2030 (USD MILLION)
TABLE 111 CHINA TUNNELS IN STRUCTURAL HEALTH MONITORING, BY APPLICATION, 2021-2030 (USD MILLION)
TABLE 112 CHINA DAMS IN STRUCTURAL HEALTH MONITORING, BY APPLICATION, 2021-2030 (USD MILLION)
TABLE 113 CHINA ROADS IN STRUCTURAL HEALTH MONITORING, BY APPLICATION, 2021-2030 (USD MILLION)
TABLE 114 CHINA STADIUM IN STRUCTURAL HEALTH MONITORING, BY APPLICATION, 2021-2030 (USD MILLION)
TABLE 115 CHINA AEROSPACE IN STRUCTURAL HEALTH MONITORING, BY APPLICATION, 2021-2030 (USD MILLION)
TABLE 116 CHINA ENERGY IN STRUCTURAL HEALTH MONITORING, BY APPLICATION, 2021-2030 (USD MILLION)
TABLE 117 CHINA WIND TURBINE IN STRUCTURAL HEALTH MONITORING, BY APPLICATION, 2021-2030 (USD MILLION)
TABLE 118 CHINA MINING IN STRUCTURAL HEALTH MONITORING, BY APPLICATION, 2021-2030 (USD MILLION)
TABLE 119 CHINA MARINE IN STRUCTURAL HEALTH MONITORING, BY APPLICATION, 2021-2030 (USD MILLION)
TABLE 120 CHINA INDUSTRIAL IN STRUCTURAL HEALTH MONITORING, BY APPLICATION, 2021-2030 (USD MILLION)
TABLE 121 CHINA OFFSHORE PLATFORM IN STRUCTURAL HEALTH MONITORING, BY APPLICATION, 2021-2030 (USD MILLION)
TABLE 122 CHINA DEFENSE PLATFORM IN STRUCTURAL HEALTH MONITORING, BY APPLICATION, 2021-2030 (USD MILLION)
TABLE 123 CHINA SCHOOLS IN STRUCTURAL HEALTH MONITORING, BY APPLICATION, 2021-2030 (USD MILLION)
TABLE 124 CHINA PUBLIC PARKS AND RECREATION IN STRUCTURAL HEALTH MONITORING, BY APPLICATION, 2021-2030 (USD MILLION)
TABLE 125 CHINA AUTOMOTIVE IN STRUCTURAL HEALTH MONITORING, BY APPLICATION, 2021-2030 (USD MILLION)
TABLE 126 JAPAN STRUCTURAL HEALTH MONITORING, BY TYPE, 2021-2030 (USD MILLION)
TABLE 127 JAPAN HARDWARE IN STRUCTURAL HEALTH MONITORING, BY TYPE, 2021-2030 (USD MILLION)
TABLE 128 JAPAN SENSORS IN STRUCTURAL HEALTH MONITORING, BY TYPE, 2021-2030 (USD MILLION)
TABLE 129 JAPAN SERVICES IN STRUCTURAL HEALTH MONITORING, BY TYPE, 2021-2030 (USD MILLION)
TABLE 130 JAPAN INSTALLATION IN STRUCTURAL HEALTH MONITORING, BY TYPE, 2021-2030 (USD MILLION)
TABLE 131 JAPAN STRUCTURAL HEALTH MONITORING, BY CONNECTIVITY, 2021-2030 (USD MILLION)
TABLE 132 JAPAN STRUCTURAL HEALTH MONITORING, BY INSTALLATION TYPE, 2021-2030 (USD MILLION)
TABLE 133 JAPAN STRUCTURAL HEALTH MONITORING, BY METHOD, 2021-2030 (USD MILLION)
TABLE 134 JAPAN VISUAL INSPECTION IN STRUCTURAL HEALTH MONITORING, BY METHOD, 2021-2030 (USD MILLION)
TABLE 135 JAPAN STRUCTURAL HEALTH MONITORING, BY APPLICATION, 2021-2030 (USD MILLION)
TABLE 136 JAPAN WIRE BREAK MONITORING IN STRUCTURAL HEALTH MONITORING, BY APPLICATION, 2021-2030 (USD MILLION)
TABLE 137 JAPAN STRUCTURAL HEALTH MONITORING, BY END USER, 2021-2030 (USD MILLION)
TABLE 138 JAPAN CIVIL IN STRUCTURAL HEALTH MONITORING, BY TYPE, 2021-2030 (USD MILLION)
TABLE 139 JAPAN ENERGY IN STRUCTURAL HEALTH MONITORING, BY TYPE, 2021-2030 (USD MILLION)
TABLE 140 JAPAN BUILDING IN STRUCTURAL HEALTH MONITORING, BY APPLICATION, 2021-2030 (USD MILLION)
TABLE 141 JAPAN BRIDGES IN STRUCTURAL HEALTH MONITORING, BY APPLICATION, 2021-2030 (USD MILLION)
TABLE 142 JAPAN TUNNELS IN STRUCTURAL HEALTH MONITORING, BY APPLICATION, 2021-2030 (USD MILLION)
TABLE 143 JAPAN DAMS IN STRUCTURAL HEALTH MONITORING, BY APPLICATION, 2021-2030 (USD MILLION)
TABLE 144 JAPAN ROADS IN STRUCTURAL HEALTH MONITORING, BY APPLICATION, 2021-2030 (USD MILLION)
TABLE 145 JAPAN STADIUM IN STRUCTURAL HEALTH MONITORING, BY APPLICATION, 2021-2030 (USD MILLION)
TABLE 146 JAPAN AEROSPACE IN STRUCTURAL HEALTH MONITORING, BY APPLICATION, 2021-2030 (USD MILLION)
TABLE 147 JAPAN ENERGY IN STRUCTURAL HEALTH MONITORING, BY APPLICATION, 2021-2030 (USD MILLION)
TABLE 148 JAPAN WIND TURBINE IN STRUCTURAL HEALTH MONITORING, BY APPLICATION, 2021-2030 (USD MILLION)
TABLE 149 JAPAN MINING IN STRUCTURAL HEALTH MONITORING, BY APPLICATION, 2021-2030 (USD MILLION)
TABLE 150 JAPAN MARINE IN STRUCTURAL HEALTH MONITORING, BY APPLICATION, 2021-2030 (USD MILLION)
TABLE 151 JAPAN INDUSTRIAL IN STRUCTURAL HEALTH MONITORING, BY APPLICATION, 2021-2030 (USD MILLION)
TABLE 152 JAPAN OFFSHORE PLATFORM IN STRUCTURAL HEALTH MONITORING, BY APPLICATION, 2021-2030 (USD MILLION)
TABLE 153 JAPAN DEFENSE PLATFORM IN STRUCTURAL HEALTH MONITORING, BY APPLICATION, 2021-2030 (USD MILLION)
TABLE 154 JAPAN SCHOOLS IN STRUCTURAL HEALTH MONITORING, BY APPLICATION, 2021-2030 (USD MILLION)
TABLE 155 JAPAN PUBLIC PARKS AND RECREATION IN STRUCTURAL HEALTH MONITORING, BY APPLICATION, 2021-2030 (USD MILLION)
TABLE 156 JAPAN AUTOMOTIVE IN STRUCTURAL HEALTH MONITORING, BY APPLICATION, 2021-2030 (USD MILLION)
TABLE 157 INDIA STRUCTURAL HEALTH MONITORING, BY TYPE, 2021-2030 (USD MILLION)
TABLE 158 INDIA HARDWARE IN STRUCTURAL HEALTH MONITORING, BY TYPE, 2021-2030 (USD MILLION)
TABLE 159 INDIA SENSORS IN STRUCTURAL HEALTH MONITORING, BY TYPE, 2021-2030 (USD MILLION)
TABLE 160 INDIA SERVICES IN STRUCTURAL HEALTH MONITORING, BY TYPE, 2021-2030 (USD MILLION)
TABLE 161 INDIA INSTALLATION IN STRUCTURAL HEALTH MONITORING, BY TYPE, 2021-2030 (USD MILLION)
TABLE 162 INDIA STRUCTURAL HEALTH MONITORING, BY CONNECTIVITY, 2021-2030 (USD MILLION)
TABLE 163 INDIA STRUCTURAL HEALTH MONITORING, BY INSTALLATION TYPE, 2021-2030 (USD MILLION)
TABLE 164 INDIA STRUCTURAL HEALTH MONITORING, BY METHOD, 2021-2030 (USD MILLION)
TABLE 165 INDIA VISUAL INSPECTION IN STRUCTURAL HEALTH MONITORING, BY METHOD, 2021-2030 (USD MILLION)
TABLE 166 INDIA STRUCTURAL HEALTH MONITORING, BY APPLICATION, 2021-2030 (USD MILLION)
TABLE 167 INDIA WIRE BREAK MONITORING IN STRUCTURAL HEALTH MONITORING, BY APPLICATION, 2021-2030 (USD MILLION)
TABLE 168 INDIA STRUCTURAL HEALTH MONITORING, BY END USER, 2021-2030 (USD MILLION)
TABLE 169 INDIA CIVIL IN STRUCTURAL HEALTH MONITORING, BY TYPE, 2021-2030 (USD MILLION)
TABLE 170 INDIA ENERGY IN STRUCTURAL HEALTH MONITORING, BY TYPE, 2021-2030 (USD MILLION)
TABLE 171 INDIA BUILDING IN STRUCTURAL HEALTH MONITORING, BY APPLICATION, 2021-2030 (USD MILLION)
TABLE 172 INDIA BRIDGES IN STRUCTURAL HEALTH MONITORING, BY APPLICATION, 2021-2030 (USD MILLION)
TABLE 173 INDIA TUNNELS IN STRUCTURAL HEALTH MONITORING, BY APPLICATION, 2021-2030 (USD MILLION)
TABLE 174 INDIA DAMS IN STRUCTURAL HEALTH MONITORING, BY APPLICATION, 2021-2030 (USD MILLION)
TABLE 175 INDIA ROADS IN STRUCTURAL HEALTH MONITORING, BY APPLICATION, 2021-2030 (USD MILLION)
TABLE 176 INDIA STADIUM IN STRUCTURAL HEALTH MONITORING, BY APPLICATION, 2021-2030 (USD MILLION)
TABLE 177 INDIA AEROSPACE IN STRUCTURAL HEALTH MONITORING, BY APPLICATION, 2021-2030 (USD MILLION)
TABLE 178 INDIA ENERGY IN STRUCTURAL HEALTH MONITORING, BY APPLICATION, 2021-2030 (USD MILLION)
TABLE 179 INDIA WIND TURBINE IN STRUCTURAL HEALTH MONITORING, BY APPLICATION, 2021-2030 (USD MILLION)
TABLE 180 INDIA MINING IN STRUCTURAL HEALTH MONITORING, BY APPLICATION, 2021-2030 (USD MILLION)
TABLE 181 INDIA MARINE IN STRUCTURAL HEALTH MONITORING, BY APPLICATION, 2021-2030 (USD MILLION)
TABLE 182 INDIA INDUSTRIAL IN STRUCTURAL HEALTH MONITORING, BY APPLICATION, 2021-2030 (USD MILLION)
TABLE 183 INDIA OFFSHORE PLATFORM IN STRUCTURAL HEALTH MONITORING, BY APPLICATION, 2021-2030 (USD MILLION)
TABLE 184 INDIA DEFENSE PLATFORM IN STRUCTURAL HEALTH MONITORING, BY APPLICATION, 2021-2030 (USD MILLION)
TABLE 185 INDIA SCHOOLS IN STRUCTURAL HEALTH MONITORING, BY APPLICATION, 2021-2030 (USD MILLION)
TABLE 186 INDIA PUBLIC PARKS AND RECREATION IN STRUCTURAL HEALTH MONITORING, BY APPLICATION, 2021-2030 (USD MILLION)
TABLE 187 INDIA AUTOMOTIVE IN STRUCTURAL HEALTH MONITORING, BY APPLICATION, 2021-2030 (USD MILLION)
TABLE 188 SOUTH KOREA STRUCTURAL HEALTH MONITORING, BY TYPE, 2021-2030 (USD MILLION)
TABLE 189 SOUTH KOREA HARDWARE IN STRUCTURAL HEALTH MONITORING, BY TYPE, 2021-2030 (USD MILLION)
TABLE 190 SOUTH KOREA SENSORS IN STRUCTURAL HEALTH MONITORING, BY TYPE, 2021-2030 (USD MILLION)
TABLE 191 SOUTH KOREA SERVICES IN STRUCTURAL HEALTH MONITORING, BY TYPE, 2021-2030 (USD MILLION)
TABLE 192 SOUTH KOREA INSTALLATION IN STRUCTURAL HEALTH MONITORING, BY TYPE, 2021-2030 (USD MILLION)
TABLE 193 SOUTH KOREA STRUCTURAL HEALTH MONITORING, BY CONNECTIVITY, 2021-2030 (USD MILLION)
TABLE 194 SOUTH KOREA STRUCTURAL HEALTH MONITORING, BY INSTALLATION TYPE, 2021-2030 (USD MILLION)
TABLE 195 SOUTH KOREA STRUCTURAL HEALTH MONITORING, BY METHOD, 2021-2030 (USD MILLION)
TABLE 196 SOUTH KOREA VISUAL INSPECTION IN STRUCTURAL HEALTH MONITORING, BY METHOD, 2021-2030 (USD MILLION)
TABLE 197 SOUTH KOREA STRUCTURAL HEALTH MONITORING, BY APPLICATION, 2021-2030 (USD MILLION)
TABLE 198 SOUTH KOREA WIRE BREAK MONITORING IN STRUCTURAL HEALTH MONITORING, BY APPLICATION, 2021-2030 (USD MILLION)
TABLE 199 SOUTH KOREA STRUCTURAL HEALTH MONITORING, BY END USER, 2021-2030 (USD MILLION)
TABLE 200 SOUTH KOREA CIVIL IN STRUCTURAL HEALTH MONITORING, BY TYPE, 2021-2030 (USD MILLION)
TABLE 201 SOUTH KOREA ENERGY IN STRUCTURAL HEALTH MONITORING, BY TYPE, 2021-2030 (USD MILLION)
TABLE 202 SOUTH KOREA BUILDING IN STRUCTURAL HEALTH MONITORING, BY APPLICATION, 2021-2030 (USD MILLION)
TABLE 203 SOUTH KOREA BRIDGES IN STRUCTURAL HEALTH MONITORING, BY APPLICATION, 2021-2030 (USD MILLION)
TABLE 204 SOUTH KOREA TUNNELS IN STRUCTURAL HEALTH MONITORING, BY APPLICATION, 2021-2030 (USD MILLION)
TABLE 205 SOUTH KOREA DAMS IN STRUCTURAL HEALTH MONITORING, BY APPLICATION, 2021-2030 (USD MILLION)
TABLE 206 SOUTH KOREA ROADS IN STRUCTURAL HEALTH MONITORING, BY APPLICATION, 2021-2030 (USD MILLION)
TABLE 207 SOUTH KOREA STADIUM IN STRUCTURAL HEALTH MONITORING, BY APPLICATION, 2021-2030 (USD MILLION)
TABLE 208 SOUTH KOREA AEROSPACE IN STRUCTURAL HEALTH MONITORING, BY APPLICATION, 2021-2030 (USD MILLION)
TABLE 209 SOUTH KOREA ENERGY IN STRUCTURAL HEALTH MONITORING, BY APPLICATION, 2021-2030 (USD MILLION)
TABLE 210 SOUTH KOREA WIND TURBINE IN STRUCTURAL HEALTH MONITORING, BY APPLICATION, 2021-2030 (USD MILLION)
TABLE 211 SOUTH KOREA MINING IN STRUCTURAL HEALTH MONITORING, BY APPLICATION, 2021-2030 (USD MILLION)
TABLE 212 SOUTH KOREA MARINE IN STRUCTURAL HEALTH MONITORING, BY APPLICATION, 2021-2030 (USD MILLION)
TABLE 213 SOUTH KOREA INDUSTRIAL IN STRUCTURAL HEALTH MONITORING, BY APPLICATION, 2021-2030 (USD MILLION)
TABLE 214 SOUTH KOREA OFFSHORE PLATFORM IN STRUCTURAL HEALTH MONITORING, BY APPLICATION, 2021-2030 (USD MILLION)
TABLE 215 SOUTH KOREA DEFENSE PLATFORM IN STRUCTURAL HEALTH MONITORING, BY APPLICATION, 2021-2030 (USD MILLION)
TABLE 216 SOUTH KOREA SCHOOLS IN STRUCTURAL HEALTH MONITORING, BY APPLICATION, 2021-2030 (USD MILLION)
TABLE 217 SOUTH KOREA PUBLIC PARKS AND RECREATION IN STRUCTURAL HEALTH MONITORING, BY APPLICATION, 2021-2030 (USD MILLION)
TABLE 218 SOUTH KOREA AUTOMOTIVE IN STRUCTURAL HEALTH MONITORING, BY APPLICATION, 2021-2030 (USD MILLION)
TABLE 219 AUSTRALIA STRUCTURAL HEALTH MONITORING, BY TYPE, 2021-2030 (USD MILLION)
TABLE 220 AUSTRALIA HARDWARE IN STRUCTURAL HEALTH MONITORING, BY TYPE, 2021-2030 (USD MILLION)
TABLE 221 AUSTRALIA SENSORS IN STRUCTURAL HEALTH MONITORING, BY TYPE, 2021-2030 (USD MILLION)
TABLE 222 AUSTRALIA SERVICES IN STRUCTURAL HEALTH MONITORING, BY TYPE, 2021-2030 (USD MILLION)
TABLE 223 AUSTRALIA INSTALLATION IN STRUCTURAL HEALTH MONITORING, BY TYPE, 2021-2030 (USD MILLION)
TABLE 224 AUSTRALIA STRUCTURAL HEALTH MONITORING, BY CONNECTIVITY, 2021-2030 (USD MILLION)
TABLE 225 AUSTRALIA STRUCTURAL HEALTH MONITORING, BY INSTALLATION TYPE, 2021-2030 (USD MILLION)
TABLE 226 AUSTRALIA STRUCTURAL HEALTH MONITORING, BY METHOD, 2021-2030 (USD MILLION)
TABLE 227 AUSTRALIA VISUAL INSPECTION IN STRUCTURAL HEALTH MONITORING, BY METHOD, 2021-2030 (USD MILLION)
TABLE 228 AUSTRALIA STRUCTURAL HEALTH MONITORING, BY APPLICATION, 2021-2030 (USD MILLION)
TABLE 229 AUSTRALIA WIRE BREAK MONITORING IN STRUCTURAL HEALTH MONITORING, BY APPLICATION, 2021-2030 (USD MILLION)
TABLE 230 AUSTRALIA STRUCTURAL HEALTH MONITORING, BY END USER, 2021-2030 (USD MILLION)
TABLE 231 AUSTRALIA CIVIL IN STRUCTURAL HEALTH MONITORING, BY TYPE, 2021-2030 (USD MILLION)
TABLE 232 AUSTRALIA ENERGY IN STRUCTURAL HEALTH MONITORING, BY TYPE, 2021-2030 (USD MILLION)
TABLE 233 AUSTRALIA BUILDING IN STRUCTURAL HEALTH MONITORING, BY APPLICATION, 2021-2030 (USD MILLION)
TABLE 234 AUSTRALIA BRIDGES IN STRUCTURAL HEALTH MONITORING, BY APPLICATION, 2021-2030 (USD MILLION)
TABLE 235 AUSTRALIA TUNNELS IN STRUCTURAL HEALTH MONITORING, BY APPLICATION, 2021-2030 (USD MILLION)
TABLE 236 AUSTRALIA DAMS IN STRUCTURAL HEALTH MONITORING, BY APPLICATION, 2021-2030 (USD MILLION)
TABLE 237 AUSTRALIA ROADS IN STRUCTURAL HEALTH MONITORING, BY APPLICATION, 2021-2030 (USD MILLION)
TABLE 238 AUSTRALIA STADIUM IN STRUCTURAL HEALTH MONITORING, BY APPLICATION, 2021-2030 (USD MILLION)
TABLE 239 AUSTRALIA AEROSPACE IN STRUCTURAL HEALTH MONITORING, BY APPLICATION, 2021-2030 (USD MILLION)
TABLE 240 AUSTRALIA ENERGY IN STRUCTURAL HEALTH MONITORING, BY APPLICATION, 2021-2030 (USD MILLION)
TABLE 241 AUSTRALIA WIND TURBINE IN STRUCTURAL HEALTH MONITORING, BY APPLICATION, 2021-2030 (USD MILLION)
TABLE 242 AUSTRALIA MINING IN STRUCTURAL HEALTH MONITORING, BY APPLICATION, 2021-2030 (USD MILLION)
TABLE 243 AUSTRALIA MARINE IN STRUCTURAL HEALTH MONITORING, BY APPLICATION, 2021-2030 (USD MILLION)
TABLE 244 AUSTRALIA INDUSTRIAL IN STRUCTURAL HEALTH MONITORING, BY APPLICATION, 2021-2030 (USD MILLION)
TABLE 245 AUSTRALIA OFFSHORE PLATFORM IN STRUCTURAL HEALTH MONITORING, BY APPLICATION, 2021-2030 (USD MILLION)
TABLE 246 AUSTRALIA DEFENSE PLATFORM IN STRUCTURAL HEALTH MONITORING, BY APPLICATION, 2021-2030 (USD MILLION)
TABLE 247 AUSTRALIA SCHOOLS IN STRUCTURAL HEALTH MONITORING, BY APPLICATION, 2021-2030 (USD MILLION)
TABLE 248 AUSTRALIA PUBLIC PARKS AND RECREATION IN STRUCTURAL HEALTH MONITORING, BY APPLICATION, 2021-2030 (USD MILLION)
TABLE 249 AUSTRALIA AUTOMOTIVE IN STRUCTURAL HEALTH MONITORING, BY APPLICATION, 2021-2030 (USD MILLION)
TABLE 250 SINGAPORE STRUCTURAL HEALTH MONITORING, BY TYPE, 2021-2030 (USD MILLION)
TABLE 251 SINGAPORE HARDWARE IN STRUCTURAL HEALTH MONITORING, BY TYPE, 2021-2030 (USD MILLION)
TABLE 252 SINGAPORE SENSORS IN STRUCTURAL HEALTH MONITORING, BY TYPE, 2021-2030 (USD MILLION)
TABLE 253 SINGAPORE SERVICES IN STRUCTURAL HEALTH MONITORING, BY TYPE, 2021-2030 (USD MILLION)
TABLE 254 SINGAPORE INSTALLATION IN STRUCTURAL HEALTH MONITORING, BY TYPE, 2021-2030 (USD MILLION)
TABLE 255 SINGAPORE STRUCTURAL HEALTH MONITORING, BY CONNECTIVITY, 2021-2030 (USD MILLION)
TABLE 256 SINGAPORE STRUCTURAL HEALTH MONITORING, BY INSTALLATION TYPE, 2021-2030 (USD MILLION)
TABLE 257 SINGAPORE STRUCTURAL HEALTH MONITORING, BY METHOD, 2021-2030 (USD MILLION)
TABLE 258 SINGAPORE VISUAL INSPECTION IN STRUCTURAL HEALTH MONITORING, BY METHOD, 2021-2030 (USD MILLION)
TABLE 259 SINGAPORE STRUCTURAL HEALTH MONITORING, BY APPLICATION, 2021-2030 (USD MILLION)
TABLE 260 SINGAPORE WIRE BREAK MONITORING IN STRUCTURAL HEALTH MONITORING, BY APPLICATION, 2021-2030 (USD MILLION)
TABLE 261 SINGAPORE STRUCTURAL HEALTH MONITORING, BY END USER, 2021-2030 (USD MILLION)
TABLE 262 SINGAPORE CIVIL IN STRUCTURAL HEALTH MONITORING, BY TYPE, 2021-2030 (USD MILLION)
TABLE 263 SINGAPORE ENERGY IN STRUCTURAL HEALTH MONITORING, BY TYPE, 2021-2030 (USD MILLION)
TABLE 264 SINGAPORE BUILDING IN STRUCTURAL HEALTH MONITORING, BY APPLICATION, 2021-2030 (USD MILLION)
TABLE 265 SINGAPORE BRIDGES IN STRUCTURAL HEALTH MONITORING, BY APPLICATION, 2021-2030 (USD MILLION)
TABLE 266 SINGAPORE TUNNELS IN STRUCTURAL HEALTH MONITORING, BY APPLICATION, 2021-2030 (USD MILLION)
TABLE 267 SINGAPORE DAMS IN STRUCTURAL HEALTH MONITORING, BY APPLICATION, 2021-2030 (USD MILLION)
TABLE 268 SINGAPORE ROADS IN STRUCTURAL HEALTH MONITORING, BY APPLICATION, 2021-2030 (USD MILLION)
TABLE 269 SINGAPORE STADIUM IN STRUCTURAL HEALTH MONITORING, BY APPLICATION, 2021-2030 (USD MILLION)
TABLE 270 SINGAPORE AEROSPACE IN STRUCTURAL HEALTH MONITORING, BY APPLICATION, 2021-2030 (USD MILLION)
TABLE 271 SINGAPORE ENERGY IN STRUCTURAL HEALTH MONITORING, BY APPLICATION, 2021-2030 (USD MILLION)
TABLE 272 SINGAPORE WIND TURBINE IN STRUCTURAL HEALTH MONITORING, BY APPLICATION, 2021-2030 (USD MILLION)
TABLE 273 SINGAPORE MINING IN STRUCTURAL HEALTH MONITORING, BY APPLICATION, 2021-2030 (USD MILLION)
TABLE 274 SINGAPORE MARINE IN STRUCTURAL HEALTH MONITORING, BY APPLICATION, 2021-2030 (USD MILLION)
TABLE 275 SINGAPORE INDUSTRIAL IN STRUCTURAL HEALTH MONITORING, BY APPLICATION, 2021-2030 (USD MILLION)
TABLE 276 SINGAPORE OFFSHORE PLATFORM IN STRUCTURAL HEALTH MONITORING, BY APPLICATION, 2021-2030 (USD MILLION)
TABLE 277 SINGAPORE DEFENSE PLATFORM IN STRUCTURAL HEALTH MONITORING, BY APPLICATION, 2021-2030 (USD MILLION)
TABLE 278 SINGAPORE SCHOOLS IN STRUCTURAL HEALTH MONITORING, BY APPLICATION, 2021-2030 (USD MILLION)
TABLE 279 SINGAPORE PUBLIC PARKS AND RECREATION IN STRUCTURAL HEALTH MONITORING, BY APPLICATION, 2021-2030 (USD MILLION)
TABLE 280 SINGAPORE AUTOMOTIVE IN STRUCTURAL HEALTH MONITORING, BY APPLICATION, 2021-2030 (USD MILLION)
TABLE 281 THAILAND STRUCTURAL HEALTH MONITORING, BY TYPE, 2021-2030 (USD MILLION)
TABLE 282 THAILAND HARDWARE IN STRUCTURAL HEALTH MONITORING, BY TYPE, 2021-2030 (USD MILLION)
TABLE 283 THAILAND SENSORS IN STRUCTURAL HEALTH MONITORING, BY TYPE, 2021-2030 (USD MILLION)
TABLE 284 THAILAND SERVICES IN STRUCTURAL HEALTH MONITORING, BY TYPE, 2021-2030 (USD MILLION)
TABLE 285 THAILAND INSTALLATION IN STRUCTURAL HEALTH MONITORING, BY TYPE, 2021-2030 (USD MILLION)
TABLE 286 THAILAND STRUCTURAL HEALTH MONITORING, BY CONNECTIVITY, 2021-2030 (USD MILLION)
TABLE 287 THAILAND STRUCTURAL HEALTH MONITORING, BY INSTALLATION TYPE, 2021-2030 (USD MILLION)
TABLE 288 THAILAND STRUCTURAL HEALTH MONITORING, BY METHOD, 2021-2030 (USD MILLION)
TABLE 289 THAILAND VISUAL INSPECTION IN STRUCTURAL HEALTH MONITORING, BY METHOD, 2021-2030 (USD MILLION)
TABLE 290 THAILAND STRUCTURAL HEALTH MONITORING, BY APPLICATION, 2021-2030 (USD MILLION)
TABLE 291 THAILAND WIRE BREAK MONITORING IN STRUCTURAL HEALTH MONITORING, BY APPLICATION, 2021-2030 (USD MILLION)
TABLE 292 THAILAND STRUCTURAL HEALTH MONITORING, BY END USER, 2021-2030 (USD MILLION)
TABLE 293 THAILAND CIVIL IN STRUCTURAL HEALTH MONITORING, BY TYPE, 2021-2030 (USD MILLION)
TABLE 294 THAILAND ENERGY IN STRUCTURAL HEALTH MONITORING, BY TYPE, 2021-2030 (USD MILLION)
TABLE 295 THAILAND BUILDING IN STRUCTURAL HEALTH MONITORING, BY APPLICATION, 2021-2030 (USD MILLION)
TABLE 296 THAILAND BRIDGES IN STRUCTURAL HEALTH MONITORING, BY APPLICATION, 2021-2030 (USD MILLION)
TABLE 297 THAILAND TUNNELS IN STRUCTURAL HEALTH MONITORING, BY APPLICATION, 2021-2030 (USD MILLION)
TABLE 298 THAILAND DAMS IN STRUCTURAL HEALTH MONITORING, BY APPLICATION, 2021-2030 (USD MILLION)
TABLE 299 THAILAND ROADS IN STRUCTURAL HEALTH MONITORING, BY APPLICATION, 2021-2030 (USD MILLION)
TABLE 300 THAILAND STADIUM IN STRUCTURAL HEALTH MONITORING, BY APPLICATION, 2021-2030 (USD MILLION)
TABLE 301 THAILAND AEROSPACE IN STRUCTURAL HEALTH MONITORING, BY APPLICATION, 2021-2030 (USD MILLION)
TABLE 302 THAILAND ENERGY IN STRUCTURAL HEALTH MONITORING, BY APPLICATION, 2021-2030 (USD MILLION)
TABLE 303 THAILAND WIND TURBINE IN STRUCTURAL HEALTH MONITORING, BY APPLICATION, 2021-2030 (USD MILLION)
TABLE 304 THAILAND MINING IN STRUCTURAL HEALTH MONITORING, BY APPLICATION, 2021-2030 (USD MILLION)
TABLE 305 THAILAND MARINE IN STRUCTURAL HEALTH MONITORING, BY APPLICATION, 2021-2030 (USD MILLION)
TABLE 306 THAILAND INDUSTRIAL IN STRUCTURAL HEALTH MONITORING, BY APPLICATION, 2021-2030 (USD MILLION)
TABLE 307 THAILAND OFFSHORE PLATFORM IN STRUCTURAL HEALTH MONITORING, BY APPLICATION, 2021-2030 (USD MILLION)
TABLE 308 THAILAND DEFENSE PLATFORM IN STRUCTURAL HEALTH MONITORING, BY APPLICATION, 2021-2030 (USD MILLION)
TABLE 309 THAILAND SCHOOLS IN STRUCTURAL HEALTH MONITORING, BY APPLICATION, 2021-2030 (USD MILLION)
TABLE 310 THAILAND PUBLIC PARKS AND RECREATION IN STRUCTURAL HEALTH MONITORING, BY APPLICATION, 2021-2030 (USD MILLION)
TABLE 311 THAILAND AUTOMOTIVE IN STRUCTURAL HEALTH MONITORING, BY APPLICATION, 2021-2030 (USD MILLION)
TABLE 312 MALAYSIA STRUCTURAL HEALTH MONITORING, BY TYPE, 2021-2030 (USD MILLION)
TABLE 313 MALAYSIA HARDWARE IN STRUCTURAL HEALTH MONITORING, BY TYPE, 2021-2030 (USD MILLION)
TABLE 314 MALAYSIA SENSORS IN STRUCTURAL HEALTH MONITORING, BY TYPE, 2021-2030 (USD MILLION)
TABLE 315 MALAYSIA SERVICES IN STRUCTURAL HEALTH MONITORING, BY TYPE, 2021-2030 (USD MILLION)
TABLE 316 MALAYSIA INSTALLATION IN STRUCTURAL HEALTH MONITORING, BY TYPE, 2021-2030 (USD MILLION)
TABLE 317 MALAYSIA STRUCTURAL HEALTH MONITORING, BY CONNECTIVITY, 2021-2030 (USD MILLION)
TABLE 318 MALAYSIA STRUCTURAL HEALTH MONITORING, BY INSTALLATION TYPE, 2021-2030 (USD MILLION)
TABLE 319 MALAYSIA STRUCTURAL HEALTH MONITORING, BY METHOD, 2021-2030 (USD MILLION)
TABLE 320 MALAYSIA VISUAL INSPECTION IN STRUCTURAL HEALTH MONITORING, BY METHOD, 2021-2030 (USD MILLION)
TABLE 321 MALAYSIA STRUCTURAL HEALTH MONITORING, BY APPLICATION, 2021-2030 (USD MILLION)
TABLE 322 MALAYSIA WIRE BREAK MONITORING IN STRUCTURAL HEALTH MONITORING, BY APPLICATION, 2021-2030 (USD MILLION)
TABLE 323 MALAYSIA STRUCTURAL HEALTH MONITORING, BY END USER, 2021-2030 (USD MILLION)
TABLE 324 MALAYSIA CIVIL IN STRUCTURAL HEALTH MONITORING, BY TYPE, 2021-2030 (USD MILLION)
TABLE 325 MALAYSIA ENERGY IN STRUCTURAL HEALTH MONITORING, BY TYPE, 2021-2030 (USD MILLION)
TABLE 326 MALAYSIA BUILDING IN STRUCTURAL HEALTH MONITORING, BY APPLICATION, 2021-2030 (USD MILLION)
TABLE 327 MALAYSIA BRIDGES IN STRUCTURAL HEALTH MONITORING, BY APPLICATION, 2021-2030 (USD MILLION)
TABLE 328 MALAYSIA TUNNELS IN STRUCTURAL HEALTH MONITORING, BY APPLICATION, 2021-2030 (USD MILLION)
TABLE 329 MALAYSIA DAMS IN STRUCTURAL HEALTH MONITORING, BY APPLICATION, 2021-2030 (USD MILLION)
TABLE 330 MALAYSIA ROADS IN STRUCTURAL HEALTH MONITORING, BY APPLICATION, 2021-2030 (USD MILLION)
TABLE 331 MALAYSIA STADIUM IN STRUCTURAL HEALTH MONITORING, BY APPLICATION, 2021-2030 (USD MILLION)
TABLE 332 MALAYSIA AEROSPACE IN STRUCTURAL HEALTH MONITORING, BY APPLICATION, 2021-2030 (USD MILLION)
TABLE 333 MALAYSIA ENERGY IN STRUCTURAL HEALTH MONITORING, BY APPLICATION, 2021-2030 (USD MILLION)
TABLE 334 MALAYSIA WIND TURBINE IN STRUCTURAL HEALTH MONITORING, BY APPLICATION, 2021-2030 (USD MILLION)
TABLE 335 MALAYSIA MINING IN STRUCTURAL HEALTH MONITORING, BY APPLICATION, 2021-2030 (USD MILLION)
TABLE 336 MALAYSIA MARINE IN STRUCTURAL HEALTH MONITORING, BY APPLICATION, 2021-2030 (USD MILLION)
TABLE 337 MALAYSIA INDUSTRIAL IN STRUCTURAL HEALTH MONITORING, BY APPLICATION, 2021-2030 (USD MILLION)
TABLE 338 MALAYSIA OFFSHORE PLATFORM IN STRUCTURAL HEALTH MONITORING, BY APPLICATION, 2021-2030 (USD MILLION)
TABLE 339 MALAYSIA DEFENSE PLATFORM IN STRUCTURAL HEALTH MONITORING, BY APPLICATION, 2021-2030 (USD MILLION)
TABLE 340 MALAYSIA SCHOOLS IN STRUCTURAL HEALTH MONITORING, BY APPLICATION, 2021-2030 (USD MILLION)
TABLE 341 MALAYSIA PUBLIC PARKS AND RECREATION IN STRUCTURAL HEALTH MONITORING, BY APPLICATION, 2021-2030 (USD MILLION)
TABLE 342 MALAYSIA AUTOMOTIVE IN STRUCTURAL HEALTH MONITORING, BY APPLICATION, 2021-2030 (USD MILLION)
TABLE 343 INDONESIA STRUCTURAL HEALTH MONITORING, BY TYPE, 2021-2030 (USD MILLION)
TABLE 344 INDONESIA HARDWARE IN STRUCTURAL HEALTH MONITORING, BY TYPE, 2021-2030 (USD MILLION)
TABLE 345 INDONESIA SENSORS IN STRUCTURAL HEALTH MONITORING, BY TYPE, 2021-2030 (USD MILLION)
TABLE 346 INDONESIA SERVICES IN STRUCTURAL HEALTH MONITORING, BY TYPE, 2021-2030 (USD MILLION)
TABLE 347 INDONESIA INSTALLATION IN STRUCTURAL HEALTH MONITORING, BY TYPE, 2021-2030 (USD MILLION)
TABLE 348 INDONESIA STRUCTURAL HEALTH MONITORING, BY CONNECTIVITY, 2021-2030 (USD MILLION)
TABLE 349 INDONESIA STRUCTURAL HEALTH MONITORING, BY INSTALLATION TYPE, 2021-2030 (USD MILLION)
TABLE 350 INDONESIA STRUCTURAL HEALTH MONITORING, BY METHOD, 2021-2030 (USD MILLION)
TABLE 351 INDONESIA VISUAL INSPECTION IN STRUCTURAL HEALTH MONITORING, BY METHOD, 2021-2030 (USD MILLION)
TABLE 352 INDONESIA STRUCTURAL HEALTH MONITORING, BY APPLICATION, 2021-2030 (USD MILLION)
TABLE 353 INDONESIA WIRE BREAK MONITORING IN STRUCTURAL HEALTH MONITORING, BY APPLICATION, 2021-2030 (USD MILLION)
TABLE 354 INDONESIA STRUCTURAL HEALTH MONITORING, BY END USER, 2021-2030 (USD MILLION)
TABLE 355 INDONESIA CIVIL IN STRUCTURAL HEALTH MONITORING, BY TYPE, 2021-2030 (USD MILLION)
TABLE 356 INDONESIA ENERGY IN STRUCTURAL HEALTH MONITORING, BY TYPE, 2021-2030 (USD MILLION)
TABLE 357 INDONESIA BUILDING IN STRUCTURAL HEALTH MONITORING, BY APPLICATION, 2021-2030 (USD MILLION)
TABLE 358 INDONESIA BRIDGES IN STRUCTURAL HEALTH MONITORING, BY APPLICATION, 2021-2030 (USD MILLION)
TABLE 359 INDONESIA TUNNELS IN STRUCTURAL HEALTH MONITORING, BY APPLICATION, 2021-2030 (USD MILLION)
TABLE 360 INDONESIA DAMS IN STRUCTURAL HEALTH MONITORING, BY APPLICATION, 2021-2030 (USD MILLION)
TABLE 361 INDONESIA ROADS IN STRUCTURAL HEALTH MONITORING, BY APPLICATION, 2021-2030 (USD MILLION)
TABLE 362 INDONESIA STADIUM IN STRUCTURAL HEALTH MONITORING, BY APPLICATION, 2021-2030 (USD MILLION)
TABLE 363 INDONESIA AEROSPACE IN STRUCTURAL HEALTH MONITORING, BY APPLICATION, 2021-2030 (USD MILLION)
TABLE 364 INDONESIA ENERGY IN STRUCTURAL HEALTH MONITORING, BY APPLICATION, 2021-2030 (USD MILLION)
TABLE 365 INDONESIA WIND TURBINE IN STRUCTURAL HEALTH MONITORING, BY APPLICATION, 2021-2030 (USD MILLION)
TABLE 366 INDONESIA MINING IN STRUCTURAL HEALTH MONITORING, BY APPLICATION, 2021-2030 (USD MILLION)
TABLE 367 INDONESIA MARINE IN STRUCTURAL HEALTH MONITORING, BY APPLICATION, 2021-2030 (USD MILLION)
TABLE 368 INDONESIA INDUSTRIAL IN STRUCTURAL HEALTH MONITORING, BY APPLICATION, 2021-2030 (USD MILLION)
TABLE 369 INDONESIA OFFSHORE PLATFORM IN STRUCTURAL HEALTH MONITORING, BY APPLICATION, 2021-2030 (USD MILLION)
TABLE 370 INDONESIA DEFENSE PLATFORM IN STRUCTURAL HEALTH MONITORING, BY APPLICATION, 2021-2030 (USD MILLION)
TABLE 371 INDONESIA SCHOOLS IN STRUCTURAL HEALTH MONITORING, BY APPLICATION, 2021-2030 (USD MILLION)
TABLE 372 INDONESIA PUBLIC PARKS AND RECREATION IN STRUCTURAL HEALTH MONITORING, BY APPLICATION, 2021-2030 (USD MILLION)
TABLE 373 INDONESIA AUTOMOTIVE IN STRUCTURAL HEALTH MONITORING, BY APPLICATION, 2021-2030 (USD MILLION)
TABLE 374 NEW ZEALAND STRUCTURAL HEALTH MONITORING, BY TYPE, 2021-2030 (USD MILLION)
TABLE 375 NEW ZEALAND HARDWARE IN STRUCTURAL HEALTH MONITORING, BY TYPE, 2021-2030 (USD MILLION)
TABLE 376 NEW ZEALAND SENSORS IN STRUCTURAL HEALTH MONITORING, BY TYPE, 2021-2030 (USD MILLION)
TABLE 377 NEW ZEALAND SERVICES IN STRUCTURAL HEALTH MONITORING, BY TYPE, 2021-2030 (USD MILLION)
TABLE 378 NEW ZEALAND INSTALLATION IN STRUCTURAL HEALTH MONITORING, BY TYPE, 2021-2030 (USD MILLION)
TABLE 379 NEW ZEALAND STRUCTURAL HEALTH MONITORING, BY CONNECTIVITY, 2021-2030 (USD MILLION)
TABLE 380 NEW ZEALAND STRUCTURAL HEALTH MONITORING, BY INSTALLATION TYPE, 2021-2030 (USD MILLION)
TABLE 381 NEW ZEALAND STRUCTURAL HEALTH MONITORING, BY METHOD, 2021-2030 (USD MILLION)
TABLE 382 NEW ZEALAND VISUAL INSPECTION IN STRUCTURAL HEALTH MONITORING, BY METHOD, 2021-2030 (USD MILLION)
TABLE 383 NEW ZEALAND STRUCTURAL HEALTH MONITORING, BY APPLICATION, 2021-2030 (USD MILLION)
TABLE 384 NEW ZEALAND WIRE BREAK MONITORING IN STRUCTURAL HEALTH MONITORING, BY APPLICATION, 2021-2030 (USD MILLION)
TABLE 385 NEW ZEALAND STRUCTURAL HEALTH MONITORING, BY END USER, 2021-2030 (USD MILLION)
TABLE 386 NEW ZEALAND CIVIL IN STRUCTURAL HEALTH MONITORING, BY TYPE, 2021-2030 (USD MILLION)
TABLE 387 NEW ZEALAND ENERGY IN STRUCTURAL HEALTH MONITORING, BY TYPE, 2021-2030 (USD MILLION)
TABLE 388 NEW ZEALAND BUILDING IN STRUCTURAL HEALTH MONITORING, BY APPLICATION, 2021-2030 (USD MILLION)
TABLE 389 NEW ZEALAND BRIDGES IN STRUCTURAL HEALTH MONITORING, BY APPLICATION, 2021-2030 (USD MILLION)
TABLE 390 NEW ZEALAND TUNNELS IN STRUCTURAL HEALTH MONITORING, BY APPLICATION, 2021-2030 (USD MILLION)
TABLE 391 NEW ZEALAND DAMS IN STRUCTURAL HEALTH MONITORING, BY APPLICATION, 2021-2030 (USD MILLION)
TABLE 392 NEW ZEALAND ROADS IN STRUCTURAL HEALTH MONITORING, BY APPLICATION, 2021-2030 (USD MILLION)
TABLE 393 NEW ZEALAND STADIUM IN STRUCTURAL HEALTH MONITORING, BY APPLICATION, 2021-2030 (USD MILLION)
TABLE 394 NEW ZEALAND AEROSPACE IN STRUCTURAL HEALTH MONITORING, BY APPLICATION, 2021-2030 (USD MILLION)
TABLE 395 NEW ZEALAND ENERGY IN STRUCTURAL HEALTH MONITORING, BY APPLICATION, 2021-2030 (USD MILLION)
TABLE 396 NEW ZEALAND WIND TURBINE IN STRUCTURAL HEALTH MONITORING, BY APPLICATION, 2021-2030 (USD MILLION)
TABLE 397 NEW ZEALAND MINING IN STRUCTURAL HEALTH MONITORING, BY APPLICATION, 2021-2030 (USD MILLION)
TABLE 398 NEW ZEALAND MARINE IN STRUCTURAL HEALTH MONITORING, BY APPLICATION, 2021-2030 (USD MILLION)
TABLE 399 NEW ZEALAND INDUSTRIAL IN STRUCTURAL HEALTH MONITORING, BY APPLICATION, 2021-2030 (USD MILLION)
TABLE 400 NEW ZEALAND OFFSHORE PLATFORM IN STRUCTURAL HEALTH MONITORING, BY APPLICATION, 2021-2030 (USD MILLION)
TABLE 401 NEW ZEALAND DEFENSE PLATFORM IN STRUCTURAL HEALTH MONITORING, BY APPLICATION, 2021-2030 (USD MILLION)
TABLE 402 NEW ZEALAND SCHOOLS IN STRUCTURAL HEALTH MONITORING, BY APPLICATION, 2021-2030 (USD MILLION)
TABLE 403 NEW ZEALAND PUBLIC PARKS AND RECREATION IN STRUCTURAL HEALTH MONITORING, BY APPLICATION, 2021-2030 (USD MILLION)
TABLE 404 NEW ZEALAND AUTOMOTIVE IN STRUCTURAL HEALTH MONITORING, BY APPLICATION, 2021-2030 (USD MILLION)
TABLE 405 PHILIPPINES STRUCTURAL HEALTH MONITORING, BY TYPE, 2021-2030 (USD MILLION)
TABLE 406 PHILIPPINES HARDWARE IN STRUCTURAL HEALTH MONITORING, BY TYPE, 2021-2030 (USD MILLION)
TABLE 407 PHILIPPINES SENSORS IN STRUCTURAL HEALTH MONITORING, BY TYPE, 2021-2030 (USD MILLION)
TABLE 408 PHILIPPINES SERVICES IN STRUCTURAL HEALTH MONITORING, BY TYPE, 2021-2030 (USD MILLION)
TABLE 409 PHILIPPINES INSTALLATION IN STRUCTURAL HEALTH MONITORING, BY TYPE, 2021-2030 (USD MILLION)
TABLE 410 PHILIPPINES STRUCTURAL HEALTH MONITORING, BY CONNECTIVITY, 2021-2030 (USD MILLION)
TABLE 411 PHILIPPINES STRUCTURAL HEALTH MONITORING, BY INSTALLATION TYPE, 2021-2030 (USD MILLION)
TABLE 412 PHILIPPINES STRUCTURAL HEALTH MONITORING, BY METHOD, 2021-2030 (USD MILLION)
TABLE 413 PHILIPPINES VISUAL INSPECTION IN STRUCTURAL HEALTH MONITORING, BY METHOD, 2021-2030 (USD MILLION)
TABLE 414 PHILIPPINES STRUCTURAL HEALTH MONITORING, BY APPLICATION, 2021-2030 (USD MILLION)
TABLE 415 PHILIPPINES WIRE BREAK MONITORING IN STRUCTURAL HEALTH MONITORING, BY APPLICATION, 2021-2030 (USD MILLION)
TABLE 416 PHILIPPINES STRUCTURAL HEALTH MONITORING, BY END USER, 2021-2030 (USD MILLION)
TABLE 417 PHILIPPINES CIVIL IN STRUCTURAL HEALTH MONITORING, BY TYPE, 2021-2030 (USD MILLION)
TABLE 418 PHILIPPINES ENERGY IN STRUCTURAL HEALTH MONITORING, BY TYPE, 2021-2030 (USD MILLION)
TABLE 419 PHILIPPINES BUILDING IN STRUCTURAL HEALTH MONITORING, BY APPLICATION, 2021-2030 (USD MILLION)
TABLE 420 PHILIPPINES BRIDGES IN STRUCTURAL HEALTH MONITORING, BY APPLICATION, 2021-2030 (USD MILLION)
TABLE 421 PHILIPPINES TUNNELS IN STRUCTURAL HEALTH MONITORING, BY APPLICATION, 2021-2030 (USD MILLION)
TABLE 422 PHILIPPINES DAMS IN STRUCTURAL HEALTH MONITORING, BY APPLICATION, 2021-2030 (USD MILLION)
TABLE 423 PHILIPPINES ROADS IN STRUCTURAL HEALTH MONITORING, BY APPLICATION, 2021-2030 (USD MILLION)
TABLE 424 PHILIPPINES STADIUM IN STRUCTURAL HEALTH MONITORING, BY APPLICATION, 2021-2030 (USD MILLION)
TABLE 425 PHILIPPINES AEROSPACE IN STRUCTURAL HEALTH MONITORING, BY APPLICATION, 2021-2030 (USD MILLION)
TABLE 426 PHILIPPINES ENERGY IN STRUCTURAL HEALTH MONITORING, BY APPLICATION, 2021-2030 (USD MILLION)
TABLE 427 PHILIPPINES WIND TURBINE IN STRUCTURAL HEALTH MONITORING, BY APPLICATION, 2021-2030 (USD MILLION)
TABLE 428 PHILIPPINES MINING IN STRUCTURAL HEALTH MONITORING, BY APPLICATION, 2021-2030 (USD MILLION)
TABLE 429 PHILIPPINES MARINE IN STRUCTURAL HEALTH MONITORING, BY APPLICATION, 2021-2030 (USD MILLION)
TABLE 430 PHILIPPINES INDUSTRIAL IN STRUCTURAL HEALTH MONITORING, BY APPLICATION, 2021-2030 (USD MILLION)
TABLE 431 PHILIPPINES OFFSHORE PLATFORM IN STRUCTURAL HEALTH MONITORING, BY APPLICATION, 2021-2030 (USD MILLION)
TABLE 432 PHILIPPINES DEFENSE PLATFORM IN STRUCTURAL HEALTH MONITORING, BY APPLICATION, 2021-2030 (USD MILLION)
TABLE 433 PHILIPPINES SCHOOLS IN STRUCTURAL HEALTH MONITORING, BY APPLICATION, 2021-2030 (USD MILLION)
TABLE 434 PHILIPPINES PUBLIC PARKS AND RECREATION IN STRUCTURAL HEALTH MONITORING, BY APPLICATION, 2021-2030 (USD MILLION)
TABLE 435 PHILIPPINES AUTOMOTIVE IN STRUCTURAL HEALTH MONITORING, BY APPLICATION, 2021-2030 (USD MILLION)
TABLE 436 TAIWAN STRUCTURAL HEALTH MONITORING, BY TYPE, 2021-2030 (USD MILLION)
TABLE 437 TAIWAN HARDWARE IN STRUCTURAL HEALTH MONITORING, BY TYPE, 2021-2030 (USD MILLION)
TABLE 438 TAIWAN SENSORS IN STRUCTURAL HEALTH MONITORING, BY TYPE, 2021-2030 (USD MILLION)
TABLE 439 TAIWAN SERVICES IN STRUCTURAL HEALTH MONITORING, BY TYPE, 2021-2030 (USD MILLION)
TABLE 440 TAIWAN INSTALLATION IN STRUCTURAL HEALTH MONITORING, BY TYPE, 2021-2030 (USD MILLION)
TABLE 441 TAIWAN STRUCTURAL HEALTH MONITORING, BY CONNECTIVITY, 2021-2030 (USD MILLION)
TABLE 442 TAIWAN STRUCTURAL HEALTH MONITORING, BY INSTALLATION TYPE, 2021-2030 (USD MILLION)
TABLE 443 TAIWAN STRUCTURAL HEALTH MONITORING, BY METHOD, 2021-2030 (USD MILLION)
TABLE 444 TAIWAN VISUAL INSPECTION IN STRUCTURAL HEALTH MONITORING, BY METHOD, 2021-2030 (USD MILLION)
TABLE 445 TAIWAN STRUCTURAL HEALTH MONITORING, BY APPLICATION, 2021-2030 (USD MILLION)
TABLE 446 TAIWAN WIRE BREAK MONITORING IN STRUCTURAL HEALTH MONITORING, BY APPLICATION, 2021-2030 (USD MILLION)
TABLE 447 TAIWAN STRUCTURAL HEALTH MONITORING, BY END USER, 2021-2030 (USD MILLION)
TABLE 448 TAIWAN CIVIL IN STRUCTURAL HEALTH MONITORING, BY TYPE, 2021-2030 (USD MILLION)
TABLE 449 TAIWAN ENERGY IN STRUCTURAL HEALTH MONITORING, BY TYPE, 2021-2030 (USD MILLION)
TABLE 450 TAIWAN BUILDING IN STRUCTURAL HEALTH MONITORING, BY APPLICATION, 2021-2030 (USD MILLION)
TABLE 451 TAIWAN BRIDGES IN STRUCTURAL HEALTH MONITORING, BY APPLICATION, 2021-2030 (USD MILLION)
TABLE 452 TAIWAN TUNNELS IN STRUCTURAL HEALTH MONITORING, BY APPLICATION, 2021-2030 (USD MILLION)
TABLE 453 TAIWAN DAMS IN STRUCTURAL HEALTH MONITORING, BY APPLICATION, 2021-2030 (USD MILLION)
TABLE 454 TAIWAN ROADS IN STRUCTURAL HEALTH MONITORING, BY APPLICATION, 2021-2030 (USD MILLION)
TABLE 455 TAIWAN STADIUM IN STRUCTURAL HEALTH MONITORING, BY APPLICATION, 2021-2030 (USD MILLION)
TABLE 456 TAIWAN AEROSPACE IN STRUCTURAL HEALTH MONITORING, BY APPLICATION, 2021-2030 (USD MILLION)
TABLE 457 TAIWAN ENERGY IN STRUCTURAL HEALTH MONITORING, BY APPLICATION, 2021-2030 (USD MILLION)
TABLE 458 TAIWAN WIND TURBINE IN STRUCTURAL HEALTH MONITORING, BY APPLICATION, 2021-2030 (USD MILLION)
TABLE 459 TAIWAN MINING IN STRUCTURAL HEALTH MONITORING, BY APPLICATION, 2021-2030 (USD MILLION)
TABLE 460 TAIWAN MARINE IN STRUCTURAL HEALTH MONITORING, BY APPLICATION, 2021-2030 (USD MILLION)
TABLE 461 TAIWAN INDUSTRIAL IN STRUCTURAL HEALTH MONITORING, BY APPLICATION, 2021-2030 (USD MILLION)
TABLE 462 TAIWAN OFFSHORE PLATFORM IN STRUCTURAL HEALTH MONITORING, BY APPLICATION, 2021-2030 (USD MILLION)
TABLE 463 TAIWAN DEFENSE PLATFORM IN STRUCTURAL HEALTH MONITORING, BY APPLICATION, 2021-2030 (USD MILLION)
TABLE 464 TAIWAN SCHOOLS IN STRUCTURAL HEALTH MONITORING, BY APPLICATION, 2021-2030 (USD MILLION)
TABLE 465 TAIWAN PUBLIC PARKS AND RECREATION IN STRUCTURAL HEALTH MONITORING, BY APPLICATION, 2021-2030 (USD MILLION)
TABLE 466 TAIWAN AUTOMOTIVE IN STRUCTURAL HEALTH MONITORING, BY APPLICATION, 2021-2030 (USD MILLION)
TABLE 467 VIETNAM STRUCTURAL HEALTH MONITORING, BY TYPE, 2021-2030 (USD MILLION)
TABLE 468 VIETNAM HARDWARE IN STRUCTURAL HEALTH MONITORING, BY TYPE, 2021-2030 (USD MILLION)
TABLE 469 VIETNAM SENSORS IN STRUCTURAL HEALTH MONITORING, BY TYPE, 2021-2030 (USD MILLION)
TABLE 470 VIETNAM SERVICES IN STRUCTURAL HEALTH MONITORING, BY TYPE, 2021-2030 (USD MILLION)
TABLE 471 VIETNAM INSTALLATION IN STRUCTURAL HEALTH MONITORING, BY TYPE, 2021-2030 (USD MILLION)
TABLE 472 VIETNAM STRUCTURAL HEALTH MONITORING, BY CONNECTIVITY, 2021-2030 (USD MILLION)
TABLE 473 VIETNAM STRUCTURAL HEALTH MONITORING, BY INSTALLATION TYPE, 2021-2030 (USD MILLION)
TABLE 474 VIETNAM STRUCTURAL HEALTH MONITORING, BY METHOD, 2021-2030 (USD MILLION)
TABLE 475 VIETNAM VISUAL INSPECTION IN STRUCTURAL HEALTH MONITORING, BY METHOD, 2021-2030 (USD MILLION)
TABLE 476 VIETNAM STRUCTURAL HEALTH MONITORING, BY APPLICATION, 2021-2030 (USD MILLION)
TABLE 477 VIETNAM WIRE BREAK MONITORING IN STRUCTURAL HEALTH MONITORING, BY APPLICATION, 2021-2030 (USD MILLION)
TABLE 478 VIETNAM STRUCTURAL HEALTH MONITORING, BY END USER, 2021-2030 (USD MILLION)
TABLE 479 VIETNAM CIVIL IN STRUCTURAL HEALTH MONITORING, BY TYPE, 2021-2030 (USD MILLION)
TABLE 480 VIETNAM ENERGY IN STRUCTURAL HEALTH MONITORING, BY TYPE, 2021-2030 (USD MILLION)
TABLE 481 VIETNAM BUILDING IN STRUCTURAL HEALTH MONITORING, BY APPLICATION, 2021-2030 (USD MILLION)
TABLE 482 VIETNAM BRIDGES IN STRUCTURAL HEALTH MONITORING, BY APPLICATION, 2021-2030 (USD MILLION)
TABLE 483 VIETNAM TUNNELS IN STRUCTURAL HEALTH MONITORING, BY APPLICATION, 2021-2030 (USD MILLION)
TABLE 484 VIETNAM DAMS IN STRUCTURAL HEALTH MONITORING, BY APPLICATION, 2021-2030 (USD MILLION)
TABLE 485 VIETNAM ROADS IN STRUCTURAL HEALTH MONITORING, BY APPLICATION, 2021-2030 (USD MILLION)
TABLE 486 VIETNAM STADIUM IN STRUCTURAL HEALTH MONITORING, BY APPLICATION, 2021-2030 (USD MILLION)
TABLE 487 VIETNAM AEROSPACE IN STRUCTURAL HEALTH MONITORING, BY APPLICATION, 2021-2030 (USD MILLION)
TABLE 488 VIETNAM ENERGY IN STRUCTURAL HEALTH MONITORING, BY APPLICATION, 2021-2030 (USD MILLION)
TABLE 489 VIETNAM WIND TURBINE IN STRUCTURAL HEALTH MONITORING, BY APPLICATION, 2021-2030 (USD MILLION)
TABLE 490 VIETNAM MINING IN STRUCTURAL HEALTH MONITORING, BY APPLICATION, 2021-2030 (USD MILLION)
TABLE 491 VIETNAM MARINE IN STRUCTURAL HEALTH MONITORING, BY APPLICATION, 2021-2030 (USD MILLION)
TABLE 492 VIETNAM INDUSTRIAL IN STRUCTURAL HEALTH MONITORING, BY APPLICATION, 2021-2030 (USD MILLION)
TABLE 493 VIETNAM OFFSHORE PLATFORM IN STRUCTURAL HEALTH MONITORING, BY APPLICATION, 2021-2030 (USD MILLION)
TABLE 494 VIETNAM DEFENSE PLATFORM IN STRUCTURAL HEALTH MONITORING, BY APPLICATION, 2021-2030 (USD MILLION)
TABLE 495 VIETNAM SCHOOLS IN STRUCTURAL HEALTH MONITORING, BY APPLICATION, 2021-2030 (USD MILLION)
TABLE 496 VIETNAM PUBLIC PARKS AND RECREATION IN STRUCTURAL HEALTH MONITORING, BY APPLICATION, 2021-2030 (USD MILLION)
TABLE 497 VIETNAM AUTOMOTIVE IN STRUCTURAL HEALTH MONITORING, BY APPLICATION, 2021-2030 (USD MILLION)
TABLE 498 REST OF ASIA-PACIFIC STRUCTURAL HEALTH MONITORING, BY TYPE, 2021-2030 (USD MILLION)
List of Figure
FIGURE 1 ASIA PACIFIC STRUCTURAL HEALTH MONITORING MARKET: SEGMENTATION
FIGURE 2 ASIA PACIFIC STRUCTURAL HEALTH MONITORING MARKET: DATA TRIANGULATION
FIGURE 3 ASIA PACIFIC STRUCTURAL HEALTH MONITORING MARKET: DROC ANALYSIS
FIGURE 4 ASIA PACIFIC STRUCTURAL HEALTH MONITORING MARKET: ASIA PACIFIC VS REGIONAL MARKET ANALYSIS
FIGURE 5 ASIA PACIFIC STRUCTURAL HEALTH MONITORING MARKET: COMPANY RESEARCH ANALYSIS
FIGURE 6 ASIA PACIFIC STRUCTURAL HEALTH MONITORING MARKET: INTERVIEW DEMOGRAPHICS
FIGURE 7 ASIA PACIFIC STRUCTURAL HEALTH MONITORING MARKET: DBMR MARKET POSITION GRID
FIGURE 8 ASIA PACIFIC STRUCTURAL HEALTH MONITORING MARKET: VENDOR SHARE ANALYSIS
FIGURE 9 ASIA PACIFIC STRUCTURAL HEALTH MONITORING MARKET: MARKET APPLICATION COVERAGE GRID
FIGURE 10 ASIA PACIFIC STRUCTURAL HEALTH MONITORING MARKET: SEGMENTATION
FIGURE 11 GROWING INFRASTRUCTURAL DEVELOPMENT ACROSS THE GLOBE AND IMPROVED SAFETY AND MAINTAINABILITY OF CRITICAL STRUCTURES ARE EXPECTED TO DRIVE THE ASIA PACIFIC STRUCTURAL HEALTH MONITORING MARKET IN THE FORECAST PERIOD OF 2023 TO 2030
FIGURE 12 HARDWARE SEGMENT IS EXPECTED TO ACCOUNT FOR THE LARGEST SHARE OF THE ASIA PACIFIC STRUCTURAL HEALTH MONITORING MARKET IN 2023 & 2030
FIGURE 13 DRIVERS, RESTRAINT, OPPORTUNITIES AND CHALLENGES OF THE ASIA PACIFIC STRUCTURAL HEALTH MONITORING MARKET
FIGURE 14 REGIONAL SHARE OF ASIA PACIFIC INFRASTRUCTURE INVESTMENT
FIGURE 15 PRICE ANALYSIS OF I-35W ST. ANTHONY FALLS BRIDGE, LOCATED IN MINNEAPOLIS, U.S.
FIGURE 16 ASIA PACIFIC STRUCTURAL HEALTH MONITORING MARKET: BY TYPE, 2022
FIGURE 17 ASIA PACIFIC STRUCTURAL HEALTH MONITORING MARKET: BY TYPE, 2023-2030 (USD MILLION)
FIGURE 18 ASIA PACIFIC STRUCTURAL HEALTH MONITORING MARKET: BY TYPE, CAGR (2023-2030)
FIGURE 19 ASIA PACIFIC STRUCTURAL HEALTH MONITORING MARKET: BY TYPE, LIFELINE CURVE
FIGURE 20 ASIA PACIFIC STRUCTURAL HEALTH MONITORING MARKET: BY CONNECTIVITY, 2022
FIGURE 21 ASIA PACIFIC STRUCTURAL HEALTH MONITORING MARKET: BY CONNECTIVITY, 2023-2030 (USD MILLION)
FIGURE 22 ASIA PACIFIC STRUCTURAL HEALTH MONITORING MARKET: BY CONNECTIVITY, CAGR (2023-2030)
FIGURE 23 ASIA PACIFIC STRUCTURAL HEALTH MONITORING MARKET: BY CONNECTIVITY, LIFELINE CURVE
FIGURE 24 ASIA PACIFIC STRUCTURAL HEALTH MONITORING MARKET: BY INSTALLATION TYPE, 2022
FIGURE 25 ASIA PACIFIC STRUCTURAL HEALTH MONITORING MARKET: BY INSTALLATION TYPE, 2023-2030 (USD MILLION)
FIGURE 26 ASIA PACIFIC STRUCTURAL HEALTH MONITORING MARKET: BY INSTALLATION TYPE, CAGR (2023-2030)
FIGURE 27 ASIA PACIFIC STRUCTURAL HEALTH MONITORING MARKET: BY INSTALLATION TYPE, LIFELINE CURVE
FIGURE 28 ASIA PACIFIC STRUCTURAL HEALTH MONITORING MARKET: BY METHOD, 2022
FIGURE 29 ASIA PACIFIC STRUCTURAL HEALTH MONITORING MARKET: BY METHOD, 2023-2030 (USD MILLION)
FIGURE 30 ASIA PACIFIC STRUCTURAL HEALTH MONITORING MARKET: BY METHOD, CAGR (2023-2030)
FIGURE 31 ASIA PACIFIC STRUCTURAL HEALTH MONITORING MARKET: BY METHOD, LIFELINE CURVE
FIGURE 32 ASIA PACIFIC STRUCTURAL HEALTH MONITORING MARKET: BY APPLICATION, 2022
FIGURE 33 ASIA PACIFIC STRUCTURAL HEALTH MONITORING MARKET: BY APPLICATION, 2023-2030 (USD MILLION)
FIGURE 34 ASIA PACIFIC STRUCTURAL HEALTH MONITORING MARKET: BY APPLICATION, CAGR (2023-2030)
FIGURE 35 ASIA PACIFIC STRUCTURAL HEALTH MONITORING MARKET: BY APPLICATION, LIFELINE CURVE
FIGURE 36 ASIA PACIFIC STRUCTURAL HEALTH MONITORING MARKET: BY END USER, 2022
FIGURE 37 ASIA PACIFIC STRUCTURAL HEALTH MONITORING MARKET: BY END USER, 2023-2030 (USD MILLION)
FIGURE 38 ASIA PACIFIC STRUCTURAL HEALTH MONITORING MARKET: BY END USER, CAGR (2023-2030)
FIGURE 39 ASIA PACIFIC STRUCTURAL HEALTH MONITORING MARKET: BY END USER, LIFELINE CURVE
FIGURE 40 ASIA-PACIFIC STRUCTURAL HEALTH MONITORING MARKET: SNAPSHOT (2022)
FIGURE 41 ASIA-PACIFIC STRUCTURAL HEALTH MONITORING MARKET: BY COUNTRY (2022)
FIGURE 42 ASIA-PACIFIC STRUCTURAL HEALTH MONITORING MARKET: BY COUNTRY (2023 & 2030)
FIGURE 43 ASIA-PACIFIC STRUCTURAL HEALTH MONITORING MARKET: BY COUNTRY (2022 & 2030)
FIGURE 44 ASIA-PACIFIC STRUCTURAL HEALTH MONITORING MARKET: TYPE (2023-2030)
FIGURE 45 ASIA PACIFIC STRUCTURAL HEALTH MONITORING MARKET: COMPANY SHARE 2022 (%)
Data collection and base year analysis are done using data collection modules with large sample sizes. The stage includes obtaining market information or related data through various sources and strategies. It includes examining and planning all the data acquired from the past in advance. It likewise envelops the examination of information inconsistencies seen across different information sources. The market data is analysed and estimated using market statistical and coherent models. Also, market share analysis and key trend analysis are the major success factors in the market report. To know more, please request an analyst call or drop down your inquiry.
The key research methodology used by DBMR research team is data triangulation which involves data mining, analysis of the impact of data variables on the market and primary (industry expert) validation. Data models include Vendor Positioning Grid, Market Time Line Analysis, Market Overview and Guide, Company Positioning Grid, Patent Analysis, Pricing Analysis, Company Market Share Analysis, Standards of Measurement, Global versus Regional and Vendor Share Analysis. To know more about the research methodology, drop in an inquiry to speak to our industry experts.
Data Bridge Market Research is a leader in advanced formative research. We take pride in servicing our existing and new customers with data and analysis that match and suits their goal. The report can be customized to include price trend analysis of target brands understanding the market for additional countries (ask for the list of countries), clinical trial results data, literature review, refurbished market and product base analysis. Market analysis of target competitors can be analyzed from technology-based analysis to market portfolio strategies. We can add as many competitors that you require data about in the format and data style you are looking for. Our team of analysts can also provide you data in crude raw excel files pivot tables (Fact book) or can assist you in creating presentations from the data sets available in the report.


