
Asia Pacific Submarine Cable System Market
Market Size in USD Million
 USD
6.90 Million
USD
13.55 Million
2024
2032
USD
6.90 Million
USD
13.55 Million
2024
2032
| 2025 - 2032 | |
| USD 6.90 Million | |
| USD 13.55 Million | |
| % | |
|
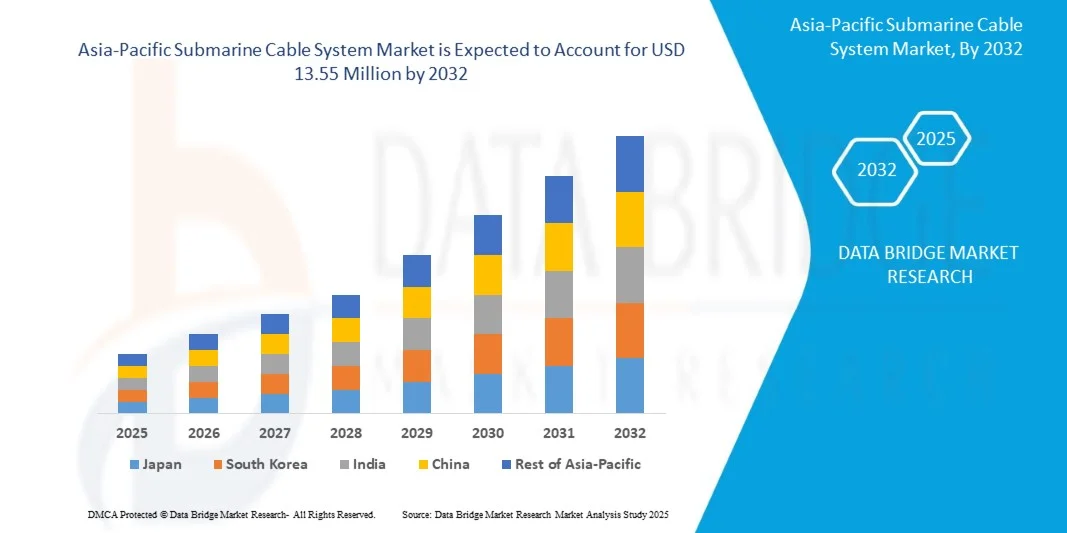
Asia-Pacific Submarine Cable System Market Size
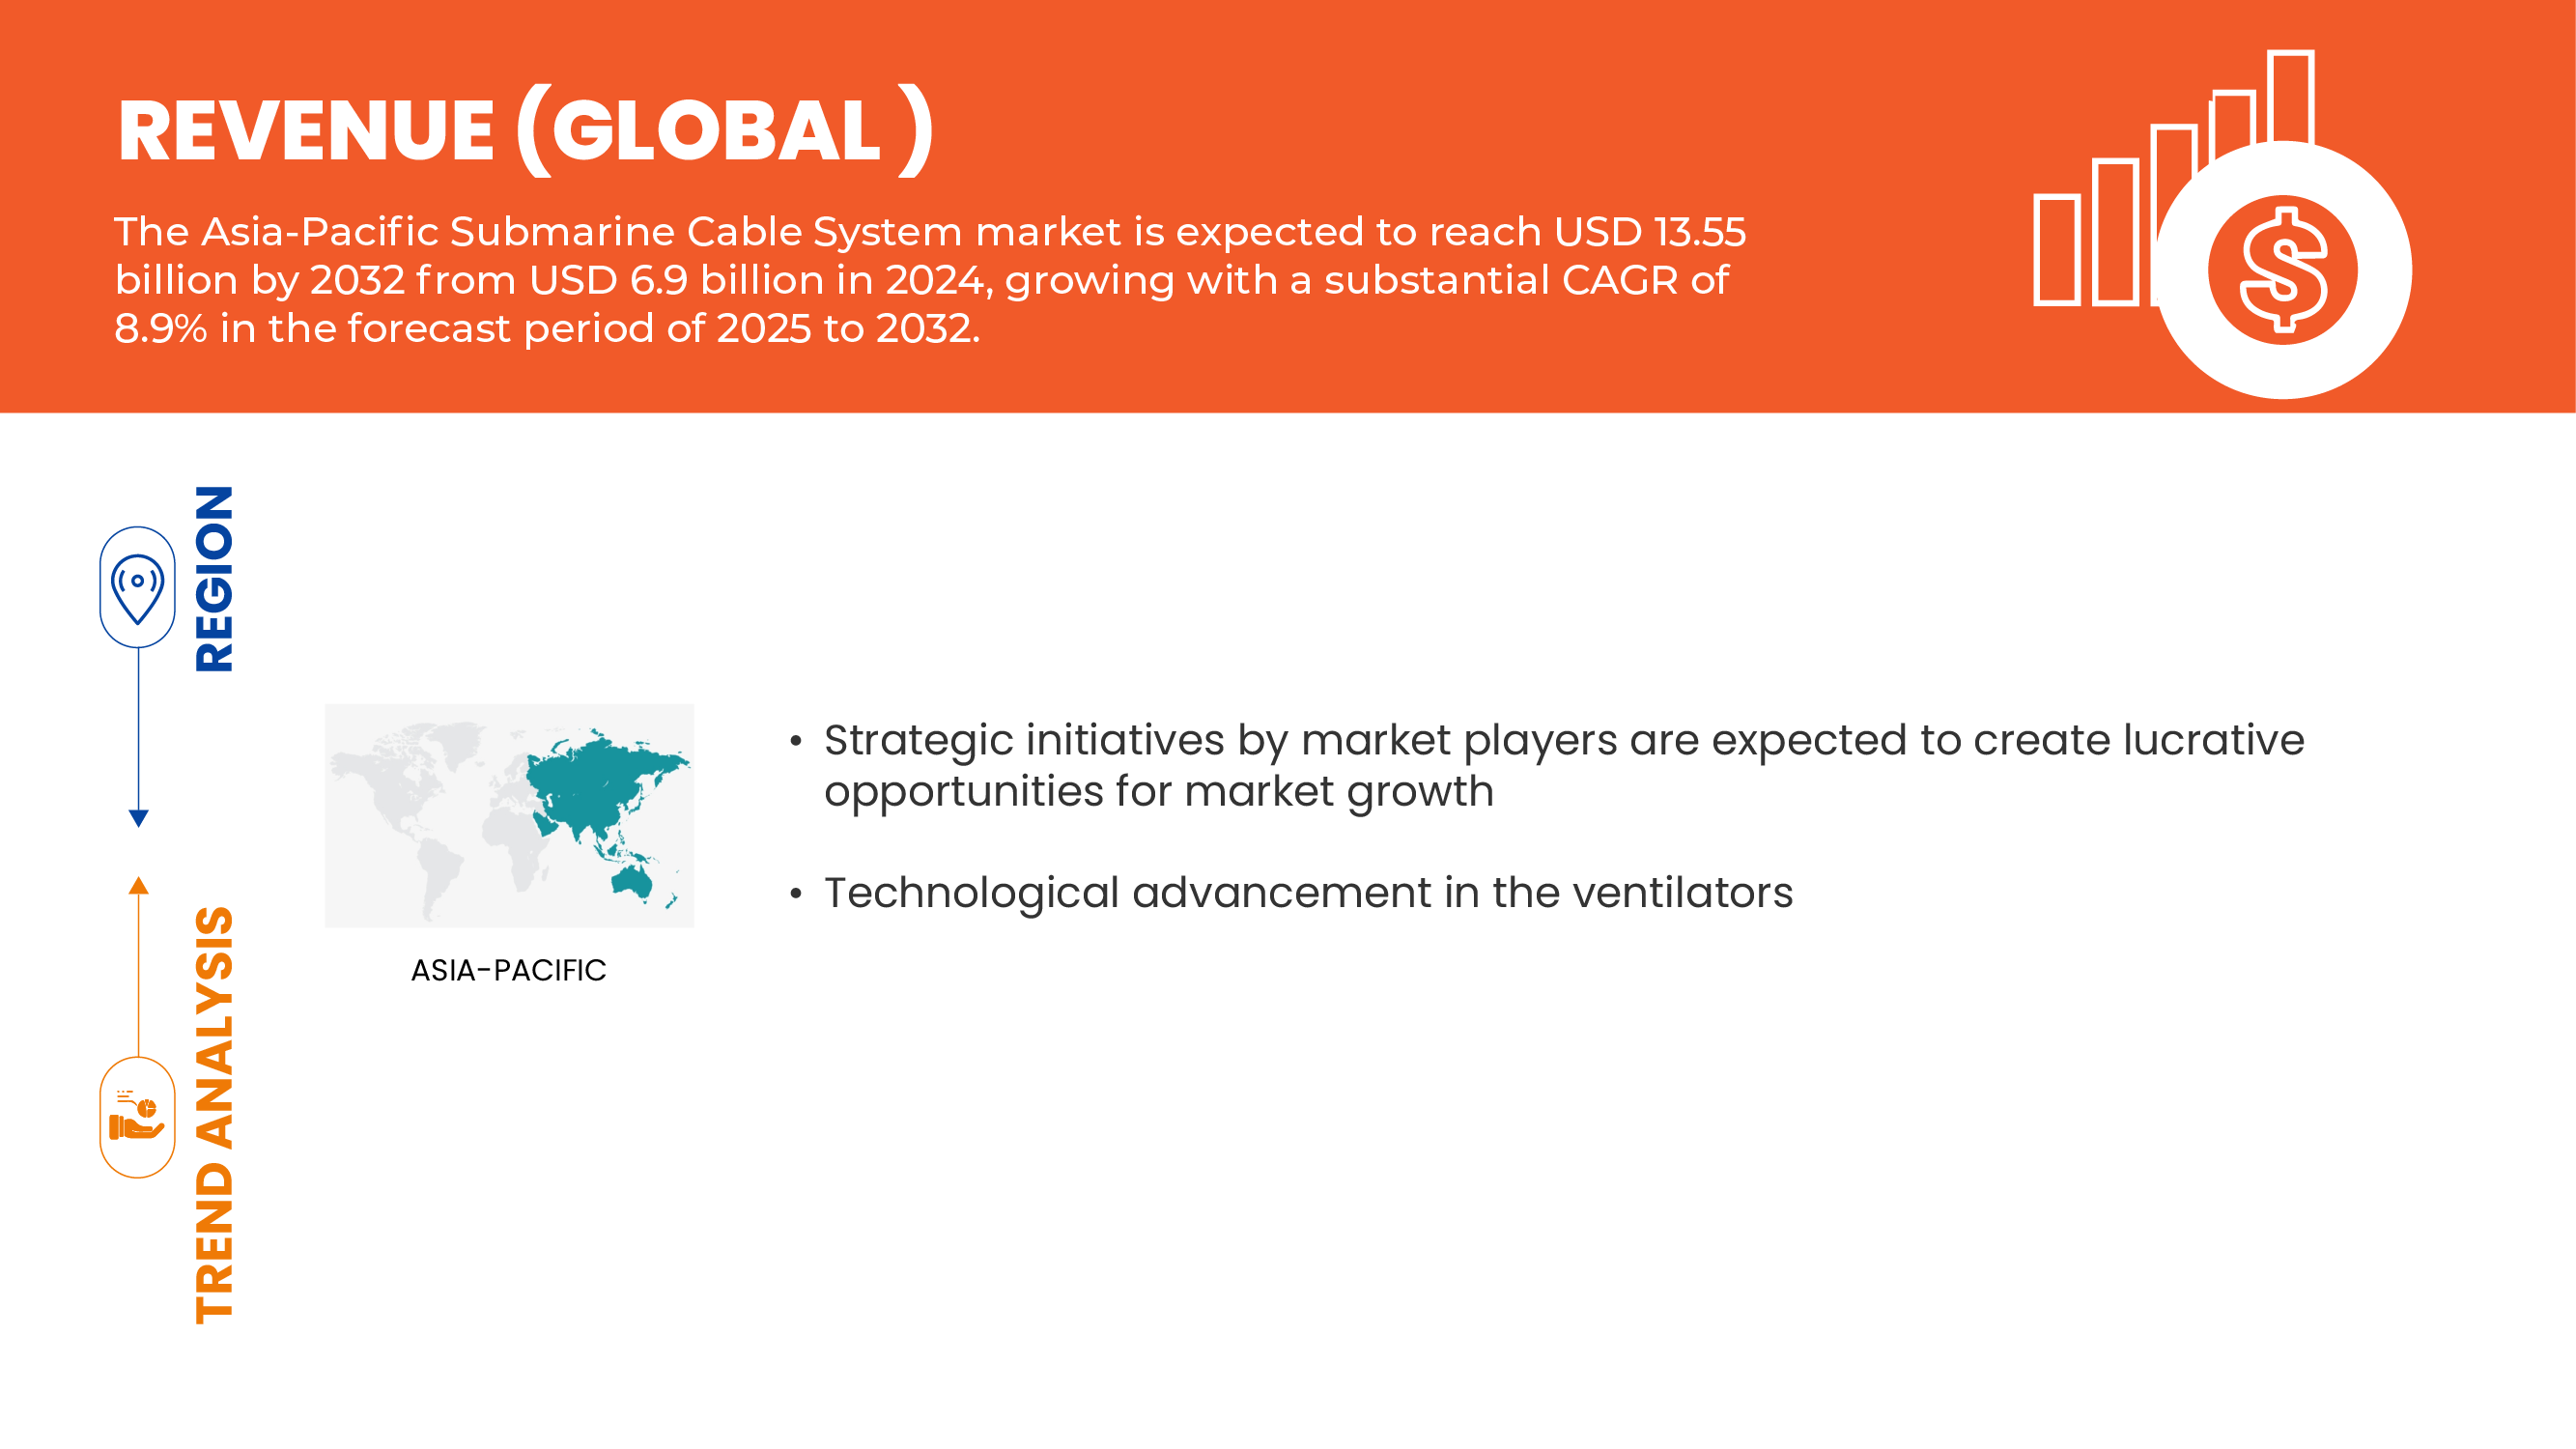
- The Asia-Pacific Submarine Cable System Market is expected to reach USD 13.55 million by 2032 from USD 6.90 million in 2024, growing with a substantial CAGR of 8.9% in the forecast period of 2025 to 2032
- The Asia-Pacific Submarine Cable System Market growth is significantly influenced by the rising prevalence of multidrug-resistant (MDR) bacterial infections, which necessitates the use of broad-spectrum carbapenem antibiotics like Meropenem.
- This expansion is further supported by increasing investments in the Asia-Pacific healthcare infrastructure, including hospital capacity and improved diagnostics, which drive the demand for potent, injectable antibiotics. In addition, there is a growing availability and adoption of generic Submarine Cable System formulations, which contributes to market accessibility and sustained growth by offering more cost-effective treatment options.
Asia-Pacific Submarine Cable System Market Analysis
- The escalating demand for high-bandwidth and low-latency connectivity, driven by digitalization, cloud adoption, and emerging technologies, is a major trend driving the demand for Submarine Cable Systems in the Asia-Pacific region. As data traffic continues to surge, existing terrestrial and satellite networks face limitations in capacity and speed.
- Submarine cable systems, being the crucial backbone of global internet and data transfer, remain an essential infrastructure solution for connecting continents, supporting hyperscale data centers, and enabling seamless digital communication across the vast Asia-Pacific geography.
- The increasing complexity and volume of data exchange, including streaming services, AI/ML applications, and IoT, lead to a need for highly robust and high-capacity infrastructure like Submarine Cable Systems to support economic growth and digital transformation. This sustains the cable's critical role in the region's digital ecosystem
- The Asia-Pacific Submarine Cable System Market is primarily driven by the critical need to combat MDR bacteria and the high utilization rate of injectable antibiotics in hospitals and other clinical settings for serious, often nosocomial (hospital-acquired) infections. The market is influenced by the prevalence of infectious diseases and the regulatory environment for antibiotic use and dispensing, including the practice of selling antimicrobials with or without prescriptions, which affects overall consumption.
- China emerge as a significant region in the Submarine cable system market, with high growth potential due to increasing healthcare spending and a rising incidence of infectious diseases. The region's market is primarily characterized by the urgent demand for effective antibiotics to manage serious infections, a trend common in many emerging economies with expanding healthcare facilities.
- The Asia-Pacific Submarine Cable System Market is expected to be part of the growing with a CAGR of 8.9%, propelled by continuous healthcare sector reforms and investments. The regional focus on improving hospital care and controlling severe infections in a densely populated environment is further driving demand for potent, broad-spectrum antibiotics like Submarine cable system as a critical part of infection control and patient management strategies.
- The Dry Plant Products segment is the dominant end-user in the Asia-Pacific Submarine Cable System Market with a market share of 63.20% reflecting resilient network infrastructure necessitates the continued and strategic deployment of Submarine Cable Systems for international and inter-regional connectivity, positioning the systems as a vital component in the Asia-Pacific's digital future.
Report Scope and Asia-Pacific Submarine Cable System Market Segmentation
|
Attributes |
Asia-Pacific Submarine cable system Key Market Insights |
|
Segments Covered |
|
|
Countries Covered |
China, Japan, South Korea, India, Singapore, Australia, Indonesia, Thailand, Malaysia, Philippines, Taiwan, Vietnam, New Zealand and Rest of Asia-Pacific |
|
Key Market Players |
|
|
Market Opportunities |
|
|
Value Added Data Infosets |
In addition to the insights on market scenarios such as market value, growth rate, segmentation, geographical coverage, and major players, the market reports curated by the Data Bridge Market Research also include in-depth expert analysis, geographically represented company-wise production and capacity, network layouts of distributors and partners, detailed and updated price trend analysis and deficit analysis of supply chain and demand. |
Asia-Pacific Submarine Cable System Market Trends
“Increasing Demand for High-Bandwidth and Low-Latency Connectivity”
- The escalating demand for high-bandwidth and low-latency connectivity, driven by digitalization, cloud adoption, and emerging technologies, is a major trend driving the demand for Submarine Cable Systems in the Asia-Pacific region. As data traffic continues to surge, existing terrestrial and satellite networks face limitations in capacity and speed.
- Submarine cable systems, being the crucial backbone of global internet and data transfer, remain an essential infrastructure solution for connecting continents, supporting hyperscale data centers, and enabling seamless digital communication across the vast Asia-Pacific geography.
- The increasing complexity and volume of data exchange, including streaming services, AI/ML applications, and IoT, lead to a need for highly robust and high-capacity infrastructure like Submarine Cable Systems to support economic growth and digital transformation. This sustains the cable's critical role in the region's digital ecosystem.
- For instance, a recent report highlighted that data traffic across the Asia-Pacific region is expected to grow by over 30% annually, reaching unprecedented levels by 2028, necessitating significant investments in new cable systems and upgrades to existing ones. This underscores the urgent necessity for advanced Submarine Cable Systems to meet these increasing demands.
- The rising incidence of data-intensive activities and the need for resilient network infrastructure necessitates the continued and strategic deployment of Submarine Cable Systems for international and inter-regional connectivity, positioning the systems as a vital component in the Asia-Pacific's digital future.
Asia-Pacific Submarine Cable System Market Dynamics
Driver
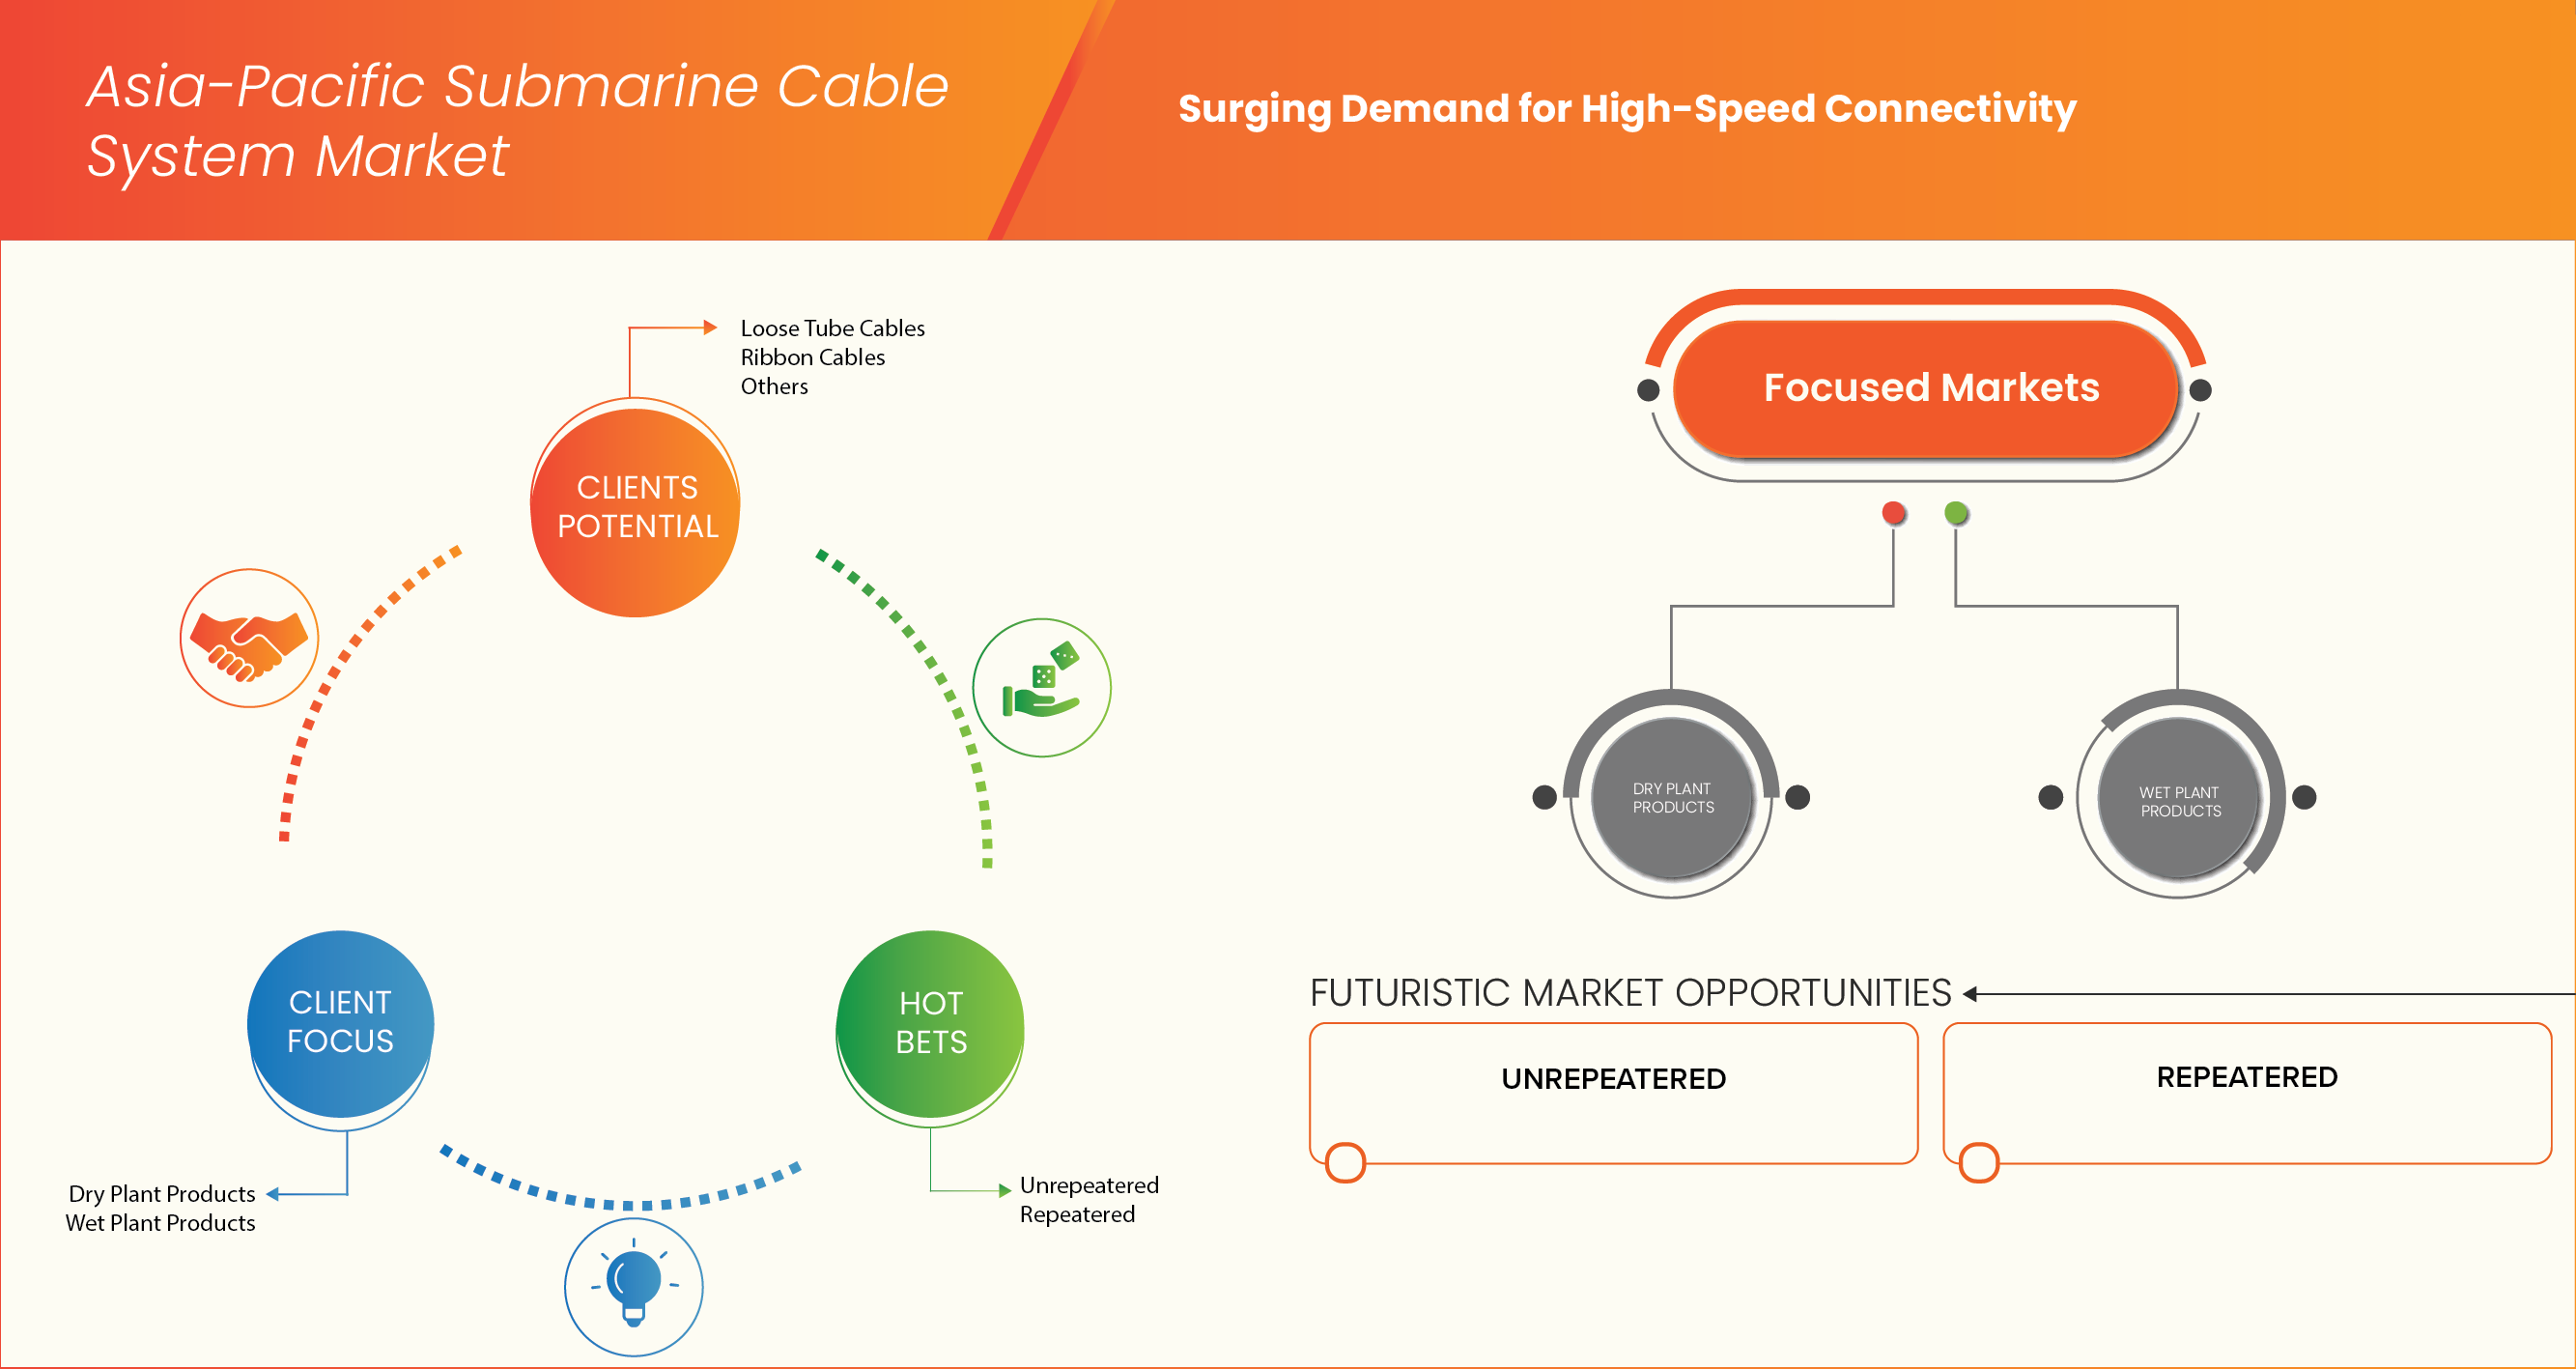
“Surging Demand For High-Speed Connectivity ”
- High-speed internet connectivity is becoming a foundational requirement across the Asia-Pacific region, driven by the rapid adoption of digital services, cloud computing, remote work, and data-intensive applications.
- As consumer expectations for seamless streaming, instant communication, and real-time access continue to rise, the demand for faster, more reliable global data transmission is surging. Submarine cable systems—responsible for carrying over 95% of international internet traffic—are now central to enabling this digital transformation, particularly in emerging economies with growing online populations.
- To meet escalating bandwidth demands, governments, telecom providers, and tech companies are investing heavily in new and upgraded undersea cable infrastructure. These systems not only improve network speed and reduce latency but also support the growth of smart cities, digital commerce, and cross-border data exchange. As digital connectivity becomes an economic and strategic priority across the region, high-speed internet demand is firmly positioning submarine cables as a critical driver of market expansion.
For Instances
- In November 2024, Digital Realty highlighted the escalating demand for high-speed connectivity in Asia-Pacific's hyperscale data centers. The company emphasized that 65% of organizations in the region are actively executing formal data strategies for their IT locations. Furthermore, 72% of enterprises are integrating data location strategies into their AI plans to enhance performance and scalability. Digital Realty's PlatformDIGITAL® is designed to support these needs by offering scalable and secure interconnection solutions across key Asia-Pacific markets, including Tokyo, Osaka, Singapore, Hong Kong, and Sydney
- In August 2024, Swarajya Magazine highlighted India’s plan to increase its internet capacity fourfold by 2025 through three major undersea cable projects: 2Africa Pearls, India-Asia-Express (IAX), and India-Europe-Express (IEX). These initiatives reflect the surging demand for high-speed connectivity in the Asia-Pacific region, driven by rapid digital growth and data consumption. By significantly boosting bandwidth and enhancing connectivity to key regions, these submarine cables will play a vital role in supporting bandwidth-intensive applications and meeting the rising data demands of enterprises, cloud providers, and consumers across the region.
- In December 2024, NEC Corporation announced the completion of the Asia Direct Cable (ADC), a high-performance submarine cable system spanning approximately 10,000 kilometers. The ADC connects China (Hong Kong SAR and Guangdong Province), Japan, the Philippines, Singapore, Thailand, and Vietnam. Designed to handle over 160 terabits per second (Tbps) of data traffic, the ADC aims to meet the growing demand for high-speed connectivity across East and Southeast Asia. The cable is owned by the ADC Consortium, which includes major telecommunications and technology companies such as China Telecom, China Unicom, PLDT Inc., Singtel, SoftBank Corp., Tata Communications, and Viettel. NEC, with over 60 years of experience in submarine cable systems, served as the system integrator for this project, providing end-to-end solutions including cable manufacturing, installation, and testing
- The rapidly growing need for high-speed, reliable internet across the Asia-Pacific region is a major catalyst driving the expansion of submarine cable systems. Fueled by increasing digital consumption, cloud services, and emerging technologies, this demand pushes telecom providers and tech giants to invest heavily in new cable infrastructure. These investments not only enhance data capacity and reduce latency but also support regional economic growth and digital inclusion. As connectivity becomes ever more critical to everyday life and business, submarine cables remain at the heart of this digital transformation, securing their role as a key growth driver in the market
Restraint/Challenge
“High Installation And Maintenance Costs”
- Submarine cable systems are among the most capital-intensive components of digital infrastructure, with high upfront costs linked to undersea surveying, cable manufacturing, marine operations, and specialized installation equipment. Depending on the length and route, deploying a single submarine cable can cost anywhere between USD 100 million to over USD 500 million.
- These costs are further elevated by the need to navigate complex maritime geographies, secure cross-border permits, and comply with environmental and security regulations. For developing economies and smaller operators, such significant capital requirements can act as a major barrier to entry, limiting broader participation in subsea infrastructure development.
- In addition to installation, long-term maintenance and repair of submarine cables add to the financial burden. Damage from natural disasters, fishing activities, and ship anchors is relatively common—especially in shallow waters—requiring costly and time-sensitive interventions by specialized cable repair vessels. Because maintenance operations can involve long downtimes and are geographically constrained by the availability of vessels and permits, operational expenses remain high throughout the lifecycle of the cable. These financial and logistical challenges can delay new deployments and complicate the expansion of international connectivity, making cost a persistent constraint on the growth of the Asia-Pacific submarine cable system market.
For Instances,
- In August 2021 study published in the Journal of Marine Science and Engineering, researchers identified that the installation of repeaters in deep-sea fiber-optic submarine cable systems significantly increases the risk of cable faults. The study suggests that minimizing the number of repeaters can reduce both the risk of faults and the associated high installation and maintenance costs. This highlights how technical design choices, such as the number of repeaters, can impact the overall cost-effectiveness and resilience of submarine cable systems
- High installation and maintenance costs remain a critical restraint in the Asia-Pacific submarine cable market. The capital-intensive nature of deploying and maintaining undersea cables poses significant financial barriers, particularly for smaller players and emerging economies. Frequent disruptions and the complexity of maritime logistics further compound these expenses. As a result, these high costs can delay infrastructure projects, limit regional connectivity expansion, and challenge the economic viability of new deployments.

Asia-Pacific Submarine Cable System Market Scope
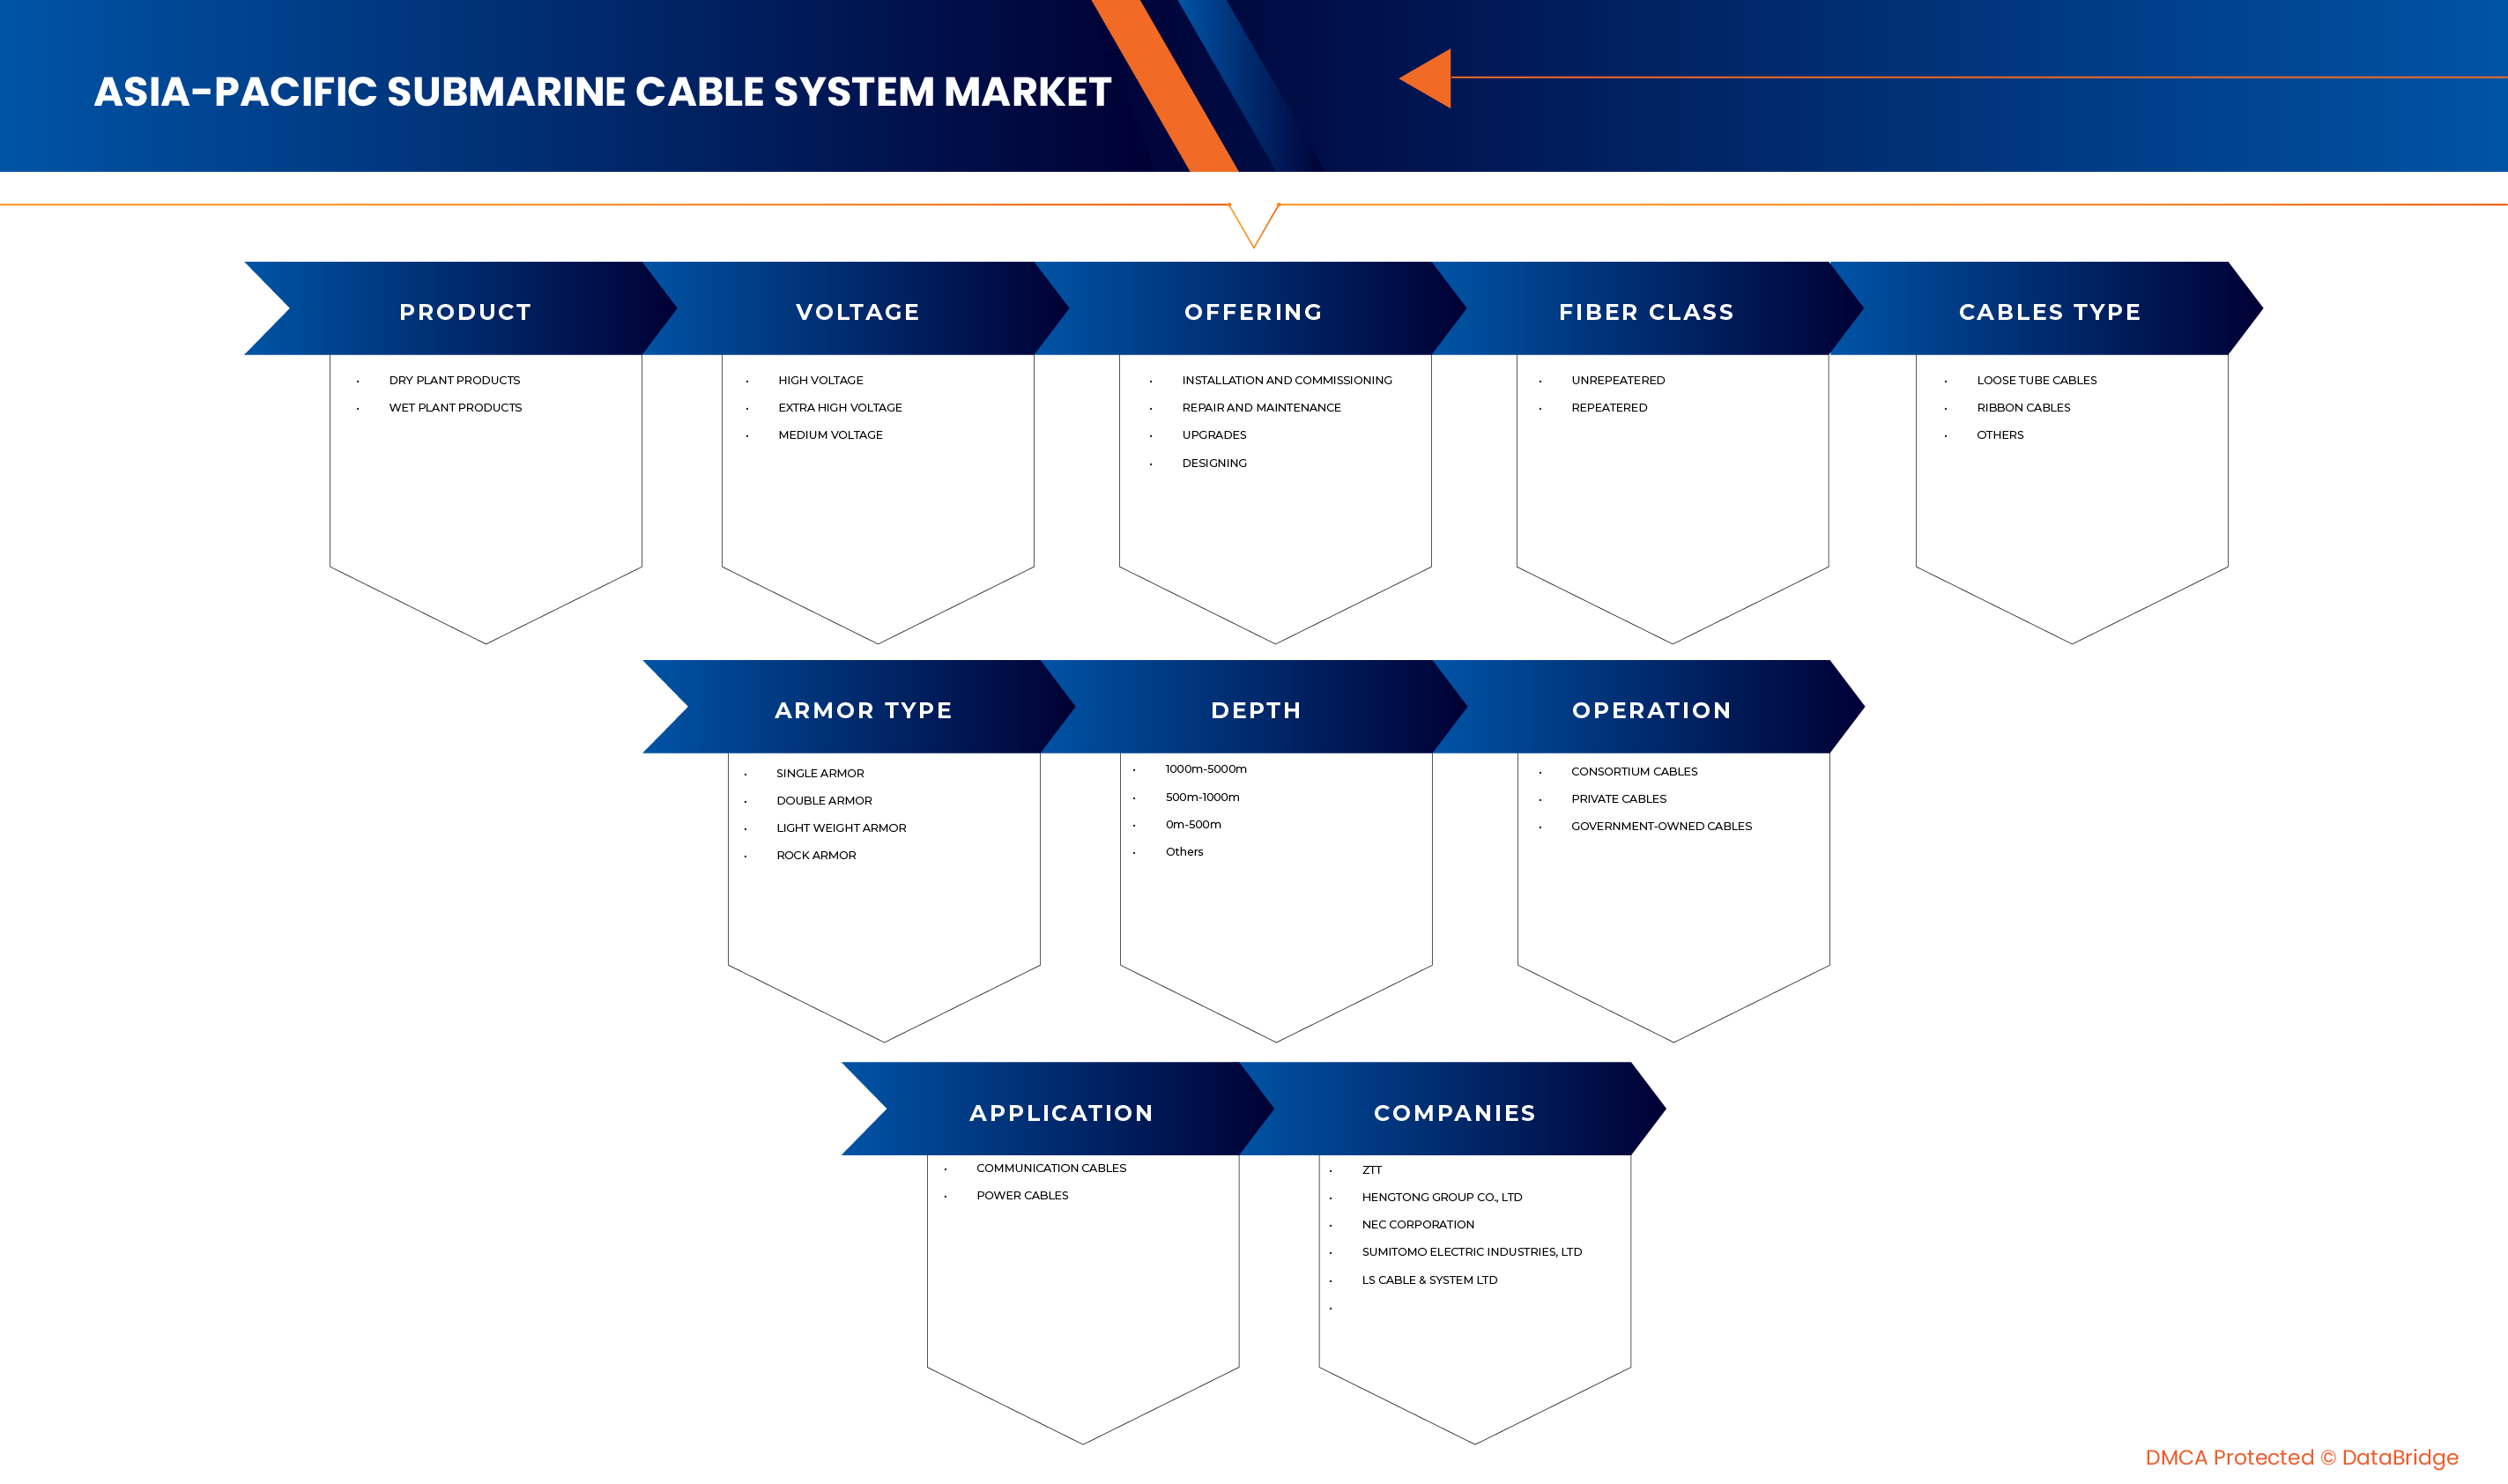
The Asia-Pacific Submarine Cable System Market is segmented into product, voltage, offering, fiber class, cable type, armor type, depth, operation, and application.
• By Product
On the basis of product, the Asia-Pacific Submarine Cable System Market is segmented into Dry Plant Products and Wet Plant Products. The Dry Plant Products segment is expected to dominate the market due to its critical role as the on-shore infrastructure, including cable landing stations, network operations centers, and power feeding equipment, which are essential for the effective operation and management of submarine cables. The established nature and significant capital expenditure associated with land-based components for seamless integration with terrestrial networks contribute significantly to its market precedence, ensuring reliable power supply and data processing.
The Dry Plant Products segment is projected to be the fastest-growing due to the continuous technological advancements in submerged components like repeaters, branch units, and subsea optical amplifiers, which significantly enhance cable capacity, reduce signal loss, and extend operational lifespans. This growth is also fueled by the increasing depth and length of new cable routes, necessitating more sophisticated and resilient wet plant components to ensure long-term performance. Furthermore, innovations in deep-sea deployment and maintenance technologies for wet plant products may accelerate the adoption of this segment.
• By Voltage
On the basis of voltage, the Asia-Pacific Submarine Cable System Market is segmented into High Voltage, Extra High Voltage, and Medium Voltage. The High Voltage segment is expected to dominate the market due to the standard power requirements for driving repeaters and other active components in long-haul communication cables, which typically operate at higher voltages to minimize power loss over vast distances. The widespread deployment of trans-oceanic communication cables, which constitute the majority of new installations, also contributes to the preference for high voltage systems. Furthermore, the increasing demand for data capacity often necessitates more powerful repeaters, solidifying the High Voltage segment's leading position.
The High Voltage segment is projected to be the fastest-growing due to the specific power requirements for shorter-distance inter-island or coastal communication cables, as well as increasingly for subsea power transmission projects where lower voltages might be more efficient or suitable for grid integration. This growth is also fueled by the expanding use of specialized short-haul data center interconnects where medium voltage can be cost-effective. The growing availability of advanced power conversion technologies for various voltage levels, which can enhance affordability and access across diverse subsea applications in the Asia-Pacific, is further accelerating this market expansion.
• By Offering
On the basis of offering, the Asia-Pacific Submarine Cable System Market is segmented into Installation and Commissioning, Repair and Maintenance, Upgrades, and Designing. The Installation and Commissioning segment is expected to dominate the market due to the inherently high capital expenditure and specialized expertise required for deploying new submarine cables, which includes route surveying, cable laying, and final system activation. The continuous expansion of data traffic and the need for new routes to connect emerging economies and bypass congested areas directly translate into a larger market volume share for this crucial initial phase.
The Installation and Commissioning segment is projected to be the fastest-growing due to the critical importance of ensuring continuous operation and maximizing the lifespan of existing cable systems. As cables age, and as new technologies emerge, there is a growing need for proactive maintenance, fault detection, and capacity enhancements. Increased awareness and adherence to operational best practices, coupled with improvements in subsea robotics and repair vessel capabilities, are boosting the utilization of these services to prevent costly downtime and extend system longevity.
• By Fiber Class
On the basis of fiber class, the Asia-Pacific Submarine Cable System Market is segmented into Unrepeatered and Repeatered. The Repeatered segment is expected to dominate the market driven by the vast distances covered by most international submarine cables in the Asia-Pacific, which necessitate repeaters to amplify optical signals and maintain data integrity over thousands of kilometers. The high-capacity requirements of trans-Pacific and intra-Asia routes demand systems capable of sustained high-speed data transmission over long hauls, making repeatered cables an indispensable solution and solidifying their primary use.
The Repeatered segment is projected to be the fastest-growing due to the increasing deployment of shorter-haul inter-island or coastal cables, particularly in archipelagic nations within the Asia-Pacific. These systems often operate without active repeaters over distances typically up to a few hundred kilometers, offering a more cost-effective and simpler deployment solution. Additionally, advancements in fiber optic technology, such as improved fiber attenuation and coherent transmission, are extending the viable reach of unrepeatered systems, further fueling the demand and growth rate for this application.
• By Cables Type
On the basis of cables type, the Asia-Pacific Submarine Cable System Market is segmented into Loose Tube Cables, Ribbon Cables, and Others. The Loose Tube Cables segment is expected to dominate the market as it is a widely adopted and robust design for submarine cables, known for its flexibility, ease of handling during deployment, and effective protection of individual optical fibers from stress and environmental factors. Its proven reliability in harsh subsea environments, coupled with its ability to accommodate varying fiber counts, firmly centralizes its usage in diverse submarine cable projects.
The Loose Tube Cables segment is projected to be the fastest-growing due to the rising demand for higher fiber count cables in new deployments and upgrades, driven by the need for increased capacity and future-proofing. Ribbon cables allow for extremely dense packing of fibers within a smaller cable diameter, offering significant advantages in terms of manufacturing efficiency, trenching, and overall cost per fiber. This shift aims to maximize data throughput in increasingly crowded cable corridors. The growing establishment of new high-capacity routes also contributes to increased Ribbon Cable deployment, accelerating this segment’s growth.
• By Armor Type
On the basis of armor type, the Asia-Pacific Submarine Cable System Market is segmented into Single Armor, Double Armor, Light Weight Armor, and Rock Armor. The Single Armor segment is expected to dominate the market due to its common use in deeper ocean sections where risks from external aggression (e.g., fishing, anchoring) are significantly lower. Single armor provides sufficient protection against tension during deployment and modest abrasion, striking a balance between protection and cost-effectiveness for the vast majority of deep-water cable routes.
The Single Armor segment is projected to be the fastest-growing due to the increasing deployment of cables in shallow water coastal areas and high-traffic shipping lanes, where external threats from fishing trawlers, ship anchors, and seabed abrasion are significantly higher. Double armor offers enhanced mechanical protection, crucial for preventing damage and ensuring system resilience in these vulnerable zones. Furthermore, the greater emphasis on cable protection and resilience in critical national infrastructure projects is driving higher growth rates for robustly armored cable types.
• By Depth
On the basis of depth, the Asia-Pacific Submarine Cable System Market is segmented into 0m-500m, 500m-1000m, 1000m-5000m, and Others. The 1000m-5000m segment is expected to dominate the market due to the vast expanses of deep ocean traversed by major international communication cables in the Asia-Pacific region. This depth range encompasses the majority of the ocean floor where cables are laid, demanding specialized deep-water installation techniques and components. The primary purpose of connecting continents and large landmasses necessarily involves significant sections at these depths.
The 1000m-5000m segment is projected to be the fastest-growing due to the increasing number of domestic and regional cable systems, especially in archipelagic countries, that primarily operate in shallower waters closer to coastlines, islands, and continental shelves. This segment also includes critical infrastructure for offshore wind farms and oil/gas platforms. While a smaller volume share, the rapid development of coastal economies and specialized subsea applications is driving significantly higher growth rates for cable systems deployed in these shallower depths.
• By Operation
On the basis of operation, the Asia-Pacific Submarine Cable System Market is segmented into Consortium Cables, Private Cables, and Government-Owned Cables. The Consortium Cables segment is expected to dominate the market due to the high capital costs and shared risk involved in developing transcontinental and major intercontinental cable systems. Consortia, comprising multiple telecom operators and content providers, pool resources to build and operate these large-scale, high-capacity networks, which form the backbone of global internet connectivity and represent the majority of cable deployments.
The Consortium Cables segment is projected to be the fastest-growing due to the increasing investment by hyperscale content providers (e.g., Google, Meta, Amazon, Microsoft) in their own dedicated submarine cable infrastructure to support their vast data center networks and cloud services. These private cables offer greater control over network architecture, capacity, and security. This strategic shift by tech giants, aiming to optimize their global data traffic flow, is driving higher growth rates for privately owned and operated cable systems.
• By Application
On the basis of application, the Asia-Pacific Submarine Cable System Market is segmented into Communication Cables and Power Cables. The Communication Cables segment is expected to dominate the market due to the overwhelming global reliance on submarine cables for transmitting internet data, voice, and video traffic across continents. The continuous explosion of digital content, cloud computing, and international business operations drives an insatiable demand for high-bandwidth, low-latency communication links, making this the primary and largest application for submarine cable systems.
The Communication Cables segment is projected to be the fastest-growing due to the rising global emphasis on renewable energy sources, particularly offshore wind farms. Subsea power cables are essential for transmitting electricity generated by these offshore facilities to onshore grids. Additionally, there's a growing trend for interconnecting national power grids across bodies of water to enhance energy security and optimize power distribution. While a smaller market share compared to communication cables, the rapid development in green energy infrastructure is driving significantly higher growth rates for subsea power transmission..
Asia-Pacific Submarine Cable System Market Regional Analysis
- The Asia-Pacific region is recognized as a significant market for Submarine Cable Systems, driven by the high and increasing prevalence of digital transformation, massive data traffic growth, and the expansion of cloud services, making the infrastructure an essential component of the region's global connectivity and digital economy strategies.
- The escalating rate of data consumption and internet penetration, coupled with the need for enhanced network resilience and improved digital infrastructure across diverse Asia-Pacific economies, is a major catalyst for the essential and growing adoption of Submarine Cable Systems in the region.
- The steady expansion and modernization of telecommunications infrastructure, especially in major economic hubs and emerging markets, and the high burden of ensuring seamless international communication and data center interconnectivity, are further accelerating the demand for potent, high-capacity Submarine Cable System offerings in the Asia-Pacific.
China Asia-Pacific Submarine Cable System Market Insight
The China Asia-Pacific Submarine Cable System Market is primarily driven by the critical need to support the high and increasing volume of digital data traffic, particularly stemming from its vast internet user base, burgeoning cloud computing industry, and extensive digital economy. This necessitates the continuous deployment and upgrade of Submarine Cable Systems for international connectivity and data center interconnectivity, while the market also emphasizes the growing role of domestic manufacturing and innovation to reduce reliance on foreign technology and the urgent expansion of network capacity to meet insatiable demand.
India Asia-Pacific Submarine Cable System Market Insight
The India Asia-Pacific Submarine Cable System Market is primarily driven by the critical need to support the high and increasing volume of digital data traffic, particularly stemming from its rapidly expanding internet penetration, booming digital services sector, and ambitious 'Digital India' initiatives. This necessitates the continuous deployment and upgrade of Submarine Cable Systems for international connectivity and regional data hubs, while the market also emphasizes the growing role of foreign investment and partnerships to enhance network infrastructure and the urgent expansion of broadband access to connect its massive population.
Asia-Pacific Submarine Cable System Market Share
The Submarine cable system industry is primarily led by well-established companies, including:
- ZTT (China)
- HENGTONG GROUP CO. LTD. (China)
- NEC Corporation (Japan)
- Sumitomo Electric Industries, Ltd. (Japan)
- LS Cable & System Ltd. (South Korea)
- SSGCABLE (China)
- APAR Industries Ltd (India)
- Furukawa Electric Co., Ltd (Japan)
- Nusantara Marine (Indonesia)
- PT Ketrosden Triasmitra Tbk (Indonesia)
- PT INFRASTRUKTUR TELEKOMUNIKASI I (Indonesia)
- Taihan Cable & Solution Co., Ltd. (South Korea)
- Ningbo Orient Wires & Cables Co., Ltd. (China)
- SubCom, LLC (U.S.)
- Pure Pro Technology Co., Ltd (China)
- PT NICA Globalmarin Indonesia (Indonesia)
- Prima Navalink (Indonesia)
- PT TWINK INDONESIA (Indonesia)
- OPTIC MARINE GROUP (Singapore)
- Xtera Inc. (U.S.)
- PT. Nautic Maritime Salvage (Indonesia)
- Qingdao Hanhe Cable Co. (China)
- OCC Corporation (Japan)
- PT Communication Cable Systems Indo (Indonesia)
- Prysmian Group (Italy)
- PT Voksel Electric Tbk (Indonesia)
Latest Developments in Asia-Pacific submarine cable system Market
- In December 2024, NEC Corporation finished construction of the Asia Direct Cable (ADC), a high-performance submarine cable connecting China (Hong Kong SAR and Guangdong Province), Japan, the Philippines, Singapore, Thailand, and Vietnam. The ADC submarine cable is owned by the ADC Consortium and features multiple pairs of high-capacity optical fibers. It is designed to carry more than 160 Tbps of traffic, enabling high-capacity transmission of data across the East and Southeast Asian regions.
- In June 2024, Sumitomo Electric acquired a majority stake in Südkabel, a leading German high-voltage cable manufacturer. This acquisition enhances Sumitomo Electric's capacity to deliver two major HVDC (High Voltage Direct Current) cable projects for Amprion, a German transmission system operator. The projects, Korridor B V49 and part of the Rhein-Main-Link, are pivotal to Germany's energy transition and have a combined value exceeding EUR 3 billion. The acquisition also supports Sumitomo Electric's expansion of its manufacturing capabilities in Germany, aligning with the country's net-zero objectives.
- In May 2024, Sumitomo Electric was appointed the preferred bidder by SSEN Transmission for the installation of subsea electricity cables, known as the Shetland 2 High Voltage Direct Current link, between Shetland and the Scottish mainland. This project will help connect three offshore wind farm sites near Shetland to the National Grid, adding 1.8GW of wind-generated power, equivalent to 13% of the UK's commissioned offshore wind capacity. As part of this initiative, Sumitomo Electric is constructing a GBP 350 million cable manufacturing facility in Nigg, Scotland, expected to create hundreds of jobs and support the UK's goal of achieving net-zero carbon emissions by 2050.
- In April 2025, APAR Industries Limited is expanding the cable manufacturing capacity at its Khatalwada facility in Gujarat, which is one of its key production units. This facility already produces a wide range of cables, including submarine cables, specialty marine cables, and elastomeric cables. The expansion project aims to enhance APAR’s ability to meet growing domestic and international demand for high-performance cable systems across sectors like power, renewable energy, defense, and marine infrastructure. However, it's important to note that this development is an internal capacity expansion initiative, not the result of any partnership, joint venture, or acquisition.
SKU-

- Interactive Data Analysis Dashboard
- Company Analysis Dashboard for high growth potential opportunities
- Research Analyst Access for customization & queries
- Competitor Analysis with Interactive dashboard
- Latest News, Updates & Trend analysis
- Harness the Power of Benchmark Analysis for Comprehensive Competitor Tracking
Table of Content
1 INTRODUCTION
1.1 OBJECTIVES OF THE STUDY
1.2 MARKET DEFINITION
1.3 OVERVIEW
1.4 LIMITATIONS
1.5 MARKETS COVERED
2 MARKET SEGMENTATION
2.1 MARKETS COVERED
2.2 GEOGRAPHICAL SCOPE
2.3 YEARS CONSIDERED FOR THE STUDY
2.4 CURRENCY AND PRICING
2.5 DBMR TRIPOD DATA VALIDATION MODEL
2.6 MULTIVARIATE MODELING
2.7 PRIMARY INTERVIEWS WITH KEY OPINION LEADERS
2.8 DBMR MARKET POSITION GRID
2.9 DBMR VENDOR SHARE ANALYSIS
2.1 SECONDARY SOURCES
2.11 ASSUMPTIONS
3 EXECUTIVE SUMMARY
4 PREMIUM INSIGHTS
4.1 COMPANY COMPETITIVE ANALYSIS
4.1.1 STRATEGIC DEVELOPMENT
4.1.2 TECHNOLOGY IMPLEMENTATION PROCESS
4.1.2.1 CHALLENGES
4.1.2.2 IN-HOUSE IMPLEMENTATION/OUTSOURCED (THIRD PARTY) IMPLEMENTATION
4.1.2.3 TECHNOLOGY SPEND OF THE COMPANY
4.1.2.4 CUSTOMER BASE
4.1.2.5 SERVICE POSITIONING
4.1.2.6 CUSTOMER FEEDBACK/RATING (B2B OR B2C)
4.1.2.7 APPLICATION REACH
4.1.2.8 SERVICE PLATFORM MATRIX
4.2 TECHNOLOGY ANALYSIS
4.2.1 KEY TECHNOLOGIES
4.2.1.1 OPTICAL FIBER TECHNOLOGY
4.2.1.2 REPEATERS/OPTICAL AMPLIFIERS
4.2.1.3 POWER FEED EQUIPMENT (PFE)
4.2.1.4 SPATIAL DIVISION MULTIPLEXING (SDM)
4.2.2 COMPLEMENTARY TECHNOLOGIES
4.2.2.1 INSTALLATION AND COMMISSIONING
4.2.3 ADJACENT TECHNOLOGIES
4.3 USED CASES & ITS ANALYSIS
4.4 OVERVIEW
4.4.1 PRIMARY PRICING MODELS
4.4.2 PRICING INFLUENCERS
4.4.3 COMPETITOR PRICING TACTICS
4.4.4 MARKET CHALLENGES INFLUENCING PRICE STRATEGY
4.4.5 STRATEGIC PRICING APPROACHES ADOPTED BY LEADING PLAYERS
4.4.6 CONCLUSION
4.5 FUNDING DETAILS – INVESTOR OVERVIEW: ASIA-PACIFIC SUBMARINE CABLE SYSTEM MARKET
4.5.1 TECHNOLOGY GIANTS
4.5.2 TELECOM AND INFRASTRUCTURE COMPANIES
4.5.3 GOVERNMENT AND PUBLIC SECTOR INVOLVEMENT
4.5.4 PRIVATE EQUITY AND INVESTMENT FUNDS
4.5.5 COLLABORATIVE AND CROSS-BORDER FUNDING
4.5.6 STRATEGIC FOCUS OF FUNDING
4.5.7 TRENDS IN INVESTOR PARTICIPATION
4.5.8 CONCLUSION
4.6 INDUSTRY ANALYSIS & FUTURISTIC SCENARIO: ASIA-PACIFIC SUBMARINE CABLE SYSTEM MARKET
4.6.1 CURRENT INDUSTRY LANDSCAPE
4.6.2 TECHNOLOGICAL ADVANCEMENTS TRANSFORMING THE INDUSTRY
4.6.3 REGIONAL AND GEOPOLITICAL DIMENSIONS
4.6.4 INDUSTRY CHALLENGES
4.6.5 MARKET DRIVERS AND STRATEGIC SHIFTS
4.6.6 INTEGRATION WITH RENEWABLE ENERGY AND SUSTAINABILITY GOALS
4.6.7 FUTURE OUTLOOK AND EMERGING OPPORTUNITIES
4.6.8 CONCLUSION: THE ROAD AHEAD
4.7 PENETRATION AND GROWTH PROSPECT MAPPING: ASIA-PACIFIC SUBMARINE CABLE SYSTEM MARKET
4.7.1 MARKET PENETRATION OVERVIEW
4.7.1.1 MATURE ECONOMIES WITH HIGH INFRASTRUCTURE DENSITY
4.7.1.2 EMERGING ECONOMIES WITH RAPID ADOPTION
4.7.1.3 ISLAND AND DEVELOPING NATIONS WITH LOW PENETRATION
4.7.2 KEY DRIVERS OF MARKET PENETRATION
4.7.2.1 EXPLOSIVE GROWTH IN DATA DEMAND
4.7.2.2 DIGITAL TRANSFORMATION AND CLOUD INFRASTRUCTURE
4.7.2.3 REGIONAL CONNECTIVITY AND TRADE INTEGRATION
4.7.2.4 PUBLIC-PRIVATE PARTNERSHIPS
4.7.3 GROWTH PROSPECT MAPPING
4.7.3.1 TECHNOLOGICAL ADVANCEMENTS
4.7.3.2 GEOGRAPHIC EXPANSION
4.7.3.3 SERVICE LAYER DIVERSIFICATION
4.7.4 GROWTH HOTSPOTS AND STRATEGIC MARKETS
4.7.4.1 SOUTHEAST ASIA
4.7.4.2 SOUTH ASIA
4.7.4.3 OCEANIA AND PACIFIC ISLANDS
4.7.5 FUTURE GROWTH PROSPECTS
4.7.5.1 INTEGRATION WITH EMERGING TECHNOLOGIES
4.7.5.2 SUSTAINABILITY AND GREEN INFRASTRUCTURE
4.7.5.3 STRATEGIC RESILIENCE AND SECURITY
4.7.5.4 INCREASING ROLE OF HYPERSCALERS
4.7.5.5 GOVERNMENT-LED REGIONAL INITIATIVES
4.7.6 LONG-TERM OUTLOOK
4.7.7 CONCLUSION
4.8 REASONS FOR INVESTMENT FROM INVESTORS IN THE ASIA-PACIFIC SUBMARINE CABLE SYSTEM MARKET
4.8.1 RISING DEMAND FOR DATA CONNECTIVITY
4.8.2 STRATEGIC CONTROL OVER DIGITAL INFRASTRUCTURE
4.8.3 REGIONAL ECONOMIC INTEGRATION AND DIGITAL TRANSFORMATION
4.8.4 LONG-TERM INFRASTRUCTURE INVESTMENT APPEAL
4.8.5 SUPPORT FOR CLOUD EXPANSION AND DATA CENTER ECOSYSTEMS
4.8.6 GEOPOLITICAL AND SECURITY CONSIDERATIONS
4.8.7 EMERGENCE OF RENEWABLE ENERGY AND POWER TRANSMISSION PROJECTS
4.8.8 TECHNOLOGICAL ADVANCEMENT AND INNOVATION OPPORTUNITIES
4.8.9 COLLABORATIVE INVESTMENT ECOSYSTEM
4.8.10 SUSTAINABILITY AND ENVIRONMENTAL GOALS
4.8.11 CONCLUSION
5 MARKET OVERVIEW
5.1 DRIVERS
5.1.1 SURGING DEMAND FOR HIGH-SPEED CONNECTIVITY.
5.1.2 RAPID GROWTH OF DATA CENTER ECOSYSTEMS
5.1.3 GOVERNMENT SUPPORT FOR DIGITAL INFRASTRUCTURE
5.1.4 RISING INVESTMENTS FROM HYPERSCALE CLOUD PROVIDERS
5.2 RESTRAINTS
5.2.1 HIGH INSTALLATION AND MAINTENANCE COSTS
5.2.2 GEOPOLITICAL TENSIONS IMPACTING CABLE ROUTES
5.3 OPPORTUNITY
5.3.1 EMERGENCE OF AI AND 6G TECHNOLOGIES
5.3.2 LACK OF RELIABLE CONNECTIVITY IN ISOLATED ISLANDS
5.3.3 INCREASE IN FUNDING BY PRIVATE CONSORTIUMS
5.4 CHALLENGES
5.4.1 DELAYS DUE TO COMPLEX REGULATORY APPROVALS
5.4.2 REGULAR SERVICE DISRUPTIONS DUE TO NATURAL HAZARDS
6 ASIA-PACIFIC SUBMARINE CABLE SYSTEM MARKET, BY PRODUCT
6.1 OVERVIEW
6.2 DRY PLANT PRODUCTS
6.3 WET PLANT PRODUCTS
7 ASIA-PACIFIC SUBMARINE CABLE SYSTEM MARKET, BY VOLTAGE
7.1 OVERVIEW
7.2 HIGH VOLTAGE
7.3 EXTRA HIGH VOLTAGE
7.4 MEDIUM VOLTAGE
8 ASIA-PACIFIC SUBMARINE CABLE SYSTEM MARKET, BY OFFERING
8.1 OVERVIEW
8.2 INSTALLATION AND COMMISSIONING
8.3 REPAIR AND MAINTENANCE
8.4 UPGRADES
8.5 DESIGNING
9 ASIA-PACIFIC SUBMARINE CABLE SYSTEM MARKET, BY FIBER CLASS
9.1 OVERVIEW
9.2 UNREPEATED
9.3 REPEATED
10 ASIA-PACIFIC SUBMARINE CABLE SYSTEM MARKET, BY CABLE TYPE
10.1 OVERVIEW
10.2 LOOSE TUBE CABLES
10.3 RIBBON CABLES
10.4 OTHERS
11 ASIA-PACIFIC SUBMARINE CABLE SYSTEM MARKET, BY ARMOR TYPE
11.1 OVERVIEW
11.2 SINGLE ARMOR
11.3 DOUBLE ARMOR
11.4 LIGHTWEIGHT ARMOR
11.5 ROCK ARMOR
12 ASIA-PACIFIC SUBMARINE CABLE SYSTEM MARKET, BY DEPTH
12.1 OVERVIEW
12.2 1000M-5000M
12.3 500M-1000M
12.4 0M-500M
12.5 OTHERS
13 ASIA-PACIFIC SUBMARINE CABLE SYSTEM MARKET, BY OPERATION
13.1 OVERVIEW
13.2 CONSORTIUM CABLES
13.3 PRIVATE CABLES
13.4 GOVERNMENT-OWNED CABLES
14 ASIA-PACIFIC SUBMARINE CABLE SYSTEM MARKET, BY APPLICATION
14.1 OVERVIEW
14.2 COMMUNICATION CABLES
14.3 POWER CABLES
15 ASIA-PACIFIC SUBMARINE CABLE SYSTEM MARKET, BY COUNTRY
15.1 ASIA- PACIFIC
15.1.1 CHINA
15.1.2 JAPAN
15.1.3 SOUTH KOREA
15.1.4 INDIA
15.1.5 SINGAPORE
15.1.6 AUSTRALIA
15.1.7 INDONESIA
15.1.8 THAILAND
15.1.9 MALAYSIA
15.1.10 PHILIPPINES
15.1.11 TAIWAN
15.1.12 VIETNAM
15.1.13 NEW ZEALAND
15.1.14 REST OF ASIA-PACIFIC
16 ASIA-PACIFIC SUBMARINE CABLE SYSTEM MARKET, COMPANY LANDSCAPE
16.1 COMPANY SHARE ANALYSIS: ASIA-PACIFIC
17 SWOT ANALYSIS
18 COMPANY PROFILE
18.1 ZTT
18.1.1 COMPANY SNAPSHOT
18.1.2 PRODUCT PORTFOLIO
18.1.3 RECENT DEVELOPMENT
18.2 HENGTONG GROUP CO., LTD
18.2.1 COMPANY SNAPSHOT
18.2.2 PRODUCT PORTFOLIO
18.2.3 RECENT DEVELOPMENT
18.3 NEC CORPORATION
18.3.1 COMPANY SNAPSHOT
18.3.2 REVENUE ANALYSIS
18.3.3 PRODUCT PORTFOLIO
18.3.4 RECENT DEVELOPMENT
18.4 SUMITOMO ELECTRIC INDUSTRIES, LTD.
18.4.1 COMPANY SNAPSHOT
18.4.2 REVENUE ANALYSIS
18.4.3 PRODUCT PORTFOLIO
18.4.4 RECENT DEVELOPMENT
18.5 LS CABLE & SYSTEM LTD
18.5.1 COMPANY SNAPSHOT
18.5.2 PRODUCT PORTFOLIO
18.5.3 RECENT DEVELOPMENTS
18.6 APAR INDUSTRIES LTD.
18.6.1 COMPANY SNAPSHOT
18.6.2 REVENUE ANALYSIS
18.6.3 PRODUCT PORTFOLIO
18.6.4 RECENT DEVELOPMENT
18.7 FURUKAWA ELECTRIC CO., LTD.
18.7.1 COMPANY SNAPSHOT
18.7.2 REVENUE ANALYSIS
18.7.3 PRODUCT PORTFOLIO
18.7.4 RECENT DEVELOPMENT
18.8 NINGBO ORIENT WIRES &CABLES CO., LTD.
18.8.1 COMPANY SNAPSHOT
18.8.2 REVENUE ANALYSIS
18.8.3 PRODUCT PORTFOLIO
18.8.4 RECENT DEVELOPMENT
18.9 NUSANTARA MARINE
18.9.1 COMPANY SNAPSHOT
18.9.2 PRODUCT PORTFOLIO
18.9.3 RECENT DEVELOPMENT
18.1 OCC CORPORATION
18.10.1 COMPANY SNAPSHOT
18.10.2 PRODUCT PORTFOLIO
18.10.3 RECENT DEVELOPMENTS
18.11 OMS GROUP SDN BHD.
18.11.1 COMPANY SNAPSHOT
18.11.2 PRODUCT PORTFOLIO
18.11.3 RECENT DEVELOPMENT
18.12 PT COMMUNICATION CABLE SYSTEMS INDONESIA TBK.
18.12.1 COMPANY SNAPSHOT
18.12.2 REVENUE ANALYSIS
18.12.3 PRODUCT PORTFOLIO
18.12.4 RECENT DEVELOPMENT
18.13 PT KETROSDEN TRIASMITRA TBK
18.13.1 COMPANY SNAPSHOT
18.13.2 REVENUE ANALYSIS
18.13.3 PRODUCT PORTFOLIO
18.13.4 RECENT DEVELOPMENT
18.14 PT. NAUTIC MARITIME SALVAGE
18.14.1 COMPANY SNAPSHOT
18.14.2 PRODUCT PORTFOLIO
18.14.3 RECENT DEVELOPMENT
18.15 PT NICA EUMARIN INDONESIA
18.15.1 COMPANY SNAPSHOT
18.15.2 PRODUCT PORTFOLIO
18.15.3 RECENT DEVELOPMENT
18.16 PT TWINK INDONESIA
18.16.1 COMPANY SNAPSHOT
18.16.2 PRODUCT PORTFOLIO
18.16.3 RECENT DEVELOPMENT
18.17 PT VOKSEL ELECTRIC TBK
18.17.1 COMPANY SNAPSHOT
18.17.2 REVENUE ANALYSIS
18.17.3 PRODUCT PORTFOLIO
18.17.4 RECENT DEVELOPMENT
18.18 PRIMA NAVALINK
18.18.1 COMPANY SNAPSHOT
18.18.2 PRODUCT PORTFOLIO
18.18.3 RECENT DEVELOPMENT
18.19 PRYSMIAN
18.19.1 COMPANY SNAPSHOT
18.19.2 REVENUE ANALYSIS
18.19.3 PRODUCT PORTFOLIO
18.19.4 RECENT DEVELOPMENT
18.2 PURE PRO TECHNOBLOGY CO., LTD
18.20.1 COMPANY SNAPSHOT
18.20.2 PRODUCT PORTFOLIO
18.20.3 RECENT DEVELOPMENT
18.21 SSGCABLE
18.21.1 COMPANY SNAPSHOT
18.21.2 PRODUCT PORTFOLIO
18.21.3 RECENT DEVELOPMENT
18.22 SUBCOM, LLC
18.22.1 COMPANY SNAPSHOT
18.22.2 PRODUCT PORTFOLIO
18.22.3 RECENT DEVELOPMENT
18.23 TAIHAN CABLE & SOLUTION CO., LTD.
18.23.1 COMPANY SNAPSHOT
18.23.2 REVENUE ANALYSIS
18.23.3 PRODUCT PORTFOLIO
18.23.4 RECENT DEVELOPMENT
18.24 TELKOM INFRA
18.24.1 COMPANY SNAPSHOT
18.24.2 PRODUCT PORTFOLIO
18.24.3 RECENT DEVELOPMENT
18.25 QINGDAO HANHE CABLE CO., LTD.
18.25.1 COMPANY SNAPSHOT
18.25.2 REVENUE ANALYSIS
18.25.3 PRODUCT PORTFOLIO
18.25.4 RECENT DEVELOPMENT
18.26 XTERA
18.26.1 COMPANY SNAPSHOT
18.26.2 PRODUCT PORTFOLIO
18.26.3 RECENT DEVELOPMENT
19 QUESTIONNAIRE
20 RELATED REPORTS
List of Table
TABLE 1 COMPANY COMPARATIVE ANALYSIS
TABLE 2 TECHNOLOGY MATRIX
TABLE 3 USED CASE ANALYSIS
TABLE 4 ASIA-PACIFIC SUBMARINE CABLE SYSTEM MARKET, BY PRODUCT, 2018-2032 (USD THOUSAND)
TABLE 5 ASIA-PACIFIC DRY PLANT PRODUCTS IN SUBMARINE CABLE SYSTEM MARKET, BY TYPE, 2018-2032 (USD THOUSAND)
TABLE 6 ASIA-PACIFIC WET PLANT PRODUCTS IN SUBMARINE CABLE SYSTEM MARKET, BY TYPE, 2018-2032 (USD THOUSAND)
TABLE 7 ASIA-PACIFIC SUBMARINE CABLE SYSTEM MARKET, BY VOLTAGE, 2018-2032 (USD THOUSAND)
TABLE 8 ASIA-PACIFIC SUBMARINE CABLE SYSTEM MARKET, BY OFFERING, 2018-2032 (USD THOUSAND)
TABLE 9 TABLE 7 ASIA-PACIFIC SUBMARINE CABLE SYSTEM MARKET, BY FIBER CLASS, 2018-2032 (USD THOUSAND)
TABLE 10 ASIA-PACIFIC SUBMARINE CABLE SYSTEM MARKET, BY CABLES TYPE, 2018-2032 (USD THOUSAND)
TABLE 11 ASIA-PACIFIC SUBMARINE CABLE SYSTEM MARKET, BY ARMOR TYPE, 2018-2032 (USD THOUSAND)
TABLE 12 ASIA-PACIFIC SUBMARINE CABLE SYSTEM MARKET, BY DEPTH, 2018-2032 (USD THOUSAND)
TABLE 13 ASIA-PACIFIC SUBMARINE CABLE SYSTEM MARKET, BY OPERATION, 2018-2032 (USD THOUSAND)
TABLE 14 ASIA-PACIFIC SUBMARINE CABLE SYSTEM MARKET, BY APPLICATION, 2018-2032 (USD THOUSAND)
TABLE 15 ASIA-PACIFIC COMMUNICATION CABLE IN SUBMARINE CABLE SYSTEM MARKET, BY TYPE, 2018-2032 (USD THOUSAND)
TABLE 16 ASIA-PACIFIC DRY PLANT PRODUCTS IN SUBMARINE CABLE SYSTEM MARKET, BY TYPE, 2018-2032 (USD THOUSAND)
TABLE 17 ASIA-PACIFIC WET PLANT PRODUCTS IN SUBMARINE CABLE SYSTEM MARKET, BY TYPE, 2018-2032 (USD THOUSAND)
TABLE 18 TABLE 16 ASIA-PACIFIC POWER CABLE IN SUBMARINE CABLE SYSTEM MARKET, BY TYPE, 2018-2032 (USD THOUSAND)
TABLE 19 ASIA-PACIFIC DRY PLANT PRODUCTS IN SUBMARINE CABLE SYSTEM MARKET, BY TYPE, 2018-2032 (USD THOUSAND)
TABLE 20 ASIA-PACIFIC WET PLANT PRODUCTS IN POWER CABLE IN SUBMARINE CABLE SYSTEM MARKET, BY TYPE, 2018-2032 (USD THOUSAND)
TABLE 21 ASIA-PACIFIC SUBMARINE CABLE SYSTEM MARKET, 2018-2032 (USD THOUSAND)
TABLE 22 ASIA-PACIFIC SUBMARINE CABLE SYSTEM MARKET, BY COUNTRY, 2018-2032 (USD THOUSAND)
TABLE 23 CHINA SUBMARINE CABLE SYSTEM MARKET, BY PRODUCT, 2018-2032 (USD THOUSAND)
TABLE 24 CHINA DRY PLANT PRODUCTS IN SUBMARINE CABLE SYSTEM MARKET, BY TYPE, 2018-2032 (USD THOUSAND)
TABLE 25 CHINA WET PLANT PRODUCTS IN SUBMARINE CABLE SYSTEM MARKET, BY TYPE, 2018-2032 (USD THOUSAND)
TABLE 26 CHINA SUBMARINE CABLE SYSTEM MARKET, BY VOLTAGE, 2018-2032 (USD THOUSAND)
TABLE 27 CHINA SUBMARINE CABLE SYSTEM MARKET, BY OFFERING, 2018-2032 (USD THOUSAND)
TABLE 28 CHINA SUBMARINE CABLE SYSTEM MARKET, BY FIBER CLASS, 2018-2032 (USD THOUSAND)
TABLE 29 CHINA SUBMARINE CABLE SYSTEM MARKET, BY CABLES TYPE, 2018-2032 (USD THOUSAND)
TABLE 30 CHINA SUBMARINE CABLE SYSTEM MARKET, BY ARMOR TYPE, 2018-2032 (USD THOUSAND)
TABLE 31 CHINA SUBMARINE CABLE SYSTEM MARKET, BY DEPTH, 2018-2032 (USD THOUSAND)
TABLE 32 CHINA SUBMARINE CABLE SYSTEM MARKET, BY OPERATION, 2018-2032 (USD THOUSAND)
TABLE 33 CHINA SUBMARINE CABLE SYSTEM MARKET, BY APPLICATION, 2018-2032 (USD THOUSAND)
TABLE 34 CHINA COMMUNICATION CABLE IN SUBMARINE CABLE SYSTEM MARKET, BY TYPE, 2018-2032 (USD THOUSAND)
TABLE 35 CHINA DRY PLANT PRODUCTS IN SUBMARINE CABLE SYSTEM MARKET, BY TYPE, 2018-2032 (USD THOUSAND)
TABLE 36 CHINA WET PLANT PRODUCTS IN SUBMARINE CABLE SYSTEM MARKET, BY TYPE, 2018-2032 (USD THOUSAND)
TABLE 37 CHINA POWER CABLE IN SUBMARINE CABLE SYSTEM MARKET, BY TYPE, 2018-2032 (USD THOUSAND)
TABLE 38 CHINA DRY PLANT PRODUCTS IN SUBMARINE CABLE SYSTEM MARKET, BY TYPE, 2018-2032 (USD THOUSAND)
TABLE 39 CHINA WET PLANT PRODUCTS IN POWER CABLE IN SUBMARINE CABLE SYSTEM MARKET, BY TYPE, 2018-2032 (USD THOUSAND)
TABLE 40 JAPAN SUBMARINE CABLE SYSTEM MARKET, BY PRODUCT, 2018-2032 (USD THOUSAND)
TABLE 41 JAPAN DRY PLANT PRODUCTS IN SUBMARINE CABLE SYSTEM MARKET, BY TYPE, 2018-2032 (USD THOUSAND)
TABLE 42 JAPAN WET PLANT PRODUCTS IN SUBMARINE CABLE SYSTEM MARKET, BY TYPE, 2018-2032 (USD THOUSAND)
TABLE 43 JAPAN SUBMARINE CABLE SYSTEM MARKET, BY VOLTAGE, 2018-2032 (USD THOUSAND)
TABLE 44 JAPAN SUBMARINE CABLE SYSTEM MARKET, BY OFFERING, 2018-2032 (USD THOUSAND)
TABLE 45 JAPAN SUBMARINE CABLE SYSTEM MARKET, BY FIBER CLASS, 2018-2032 (USD THOUSAND)
TABLE 46 JAPAN SUBMARINE CABLE SYSTEM MARKET, BY CABLES TYPE, 2018-2032 (USD THOUSAND)
TABLE 47 JAPAN SUBMARINE CABLE SYSTEM MARKET, BY ARMOR TYPE, 2018-2032 (USD THOUSAND)
TABLE 48 JAPAN SUBMARINE CABLE SYSTEM MARKET, BY DEPTH, 2018-2032 (USD THOUSAND)
TABLE 49 JAPAN SUBMARINE CABLE SYSTEM MARKET, BY OPERATION, 2018-2032 (USD THOUSAND)
TABLE 50 JAPAN SUBMARINE CABLE SYSTEM MARKET, BY APPLICATION, 2018-2032 (USD THOUSAND)
TABLE 51 JAPAN COMMUNICATION CABLE IN SUBMARINE CABLE SYSTEM MARKET, BY TYPE, 2018-2032 (USD THOUSAND)
TABLE 52 JAPAN DRY PLANT PRODUCTS IN SUBMARINE CABLE SYSTEM MARKET, BY TYPE, 2018-2032 (USD THOUSAND)
TABLE 53 JAPAN WET PLANT PRODUCTS IN SUBMARINE CABLE SYSTEM MARKET, BY TYPE, 2018-2032 (USD THOUSAND)
TABLE 54 JAPAN POWER CABLE IN SUBMARINE CABLE SYSTEM MARKET, BY TYPE, 2018-2032 (USD THOUSAND)
TABLE 55 JAPAN DRY PLANT PRODUCTS IN SUBMARINE CABLE SYSTEM MARKET, BY TYPE, 2018-2032 (USD THOUSAND)
TABLE 56 JAPAN WET PLANT PRODUCTS IN POWER CABLE IN SUBMARINE CABLE SYSTEM MARKET, BY TYPE, 2018-2032 (USD THOUSAND)
TABLE 57 SOUTH KOREA SUBMARINE CABLE SYSTEM MARKET, BY PRODUCT, 2018-2032 (USD THOUSAND)
TABLE 58 SOUTH KOREA DRY PLANT PRODUCTS IN SUBMARINE CABLE SYSTEM MARKET, BY TYPE, 2018-2032 (USD THOUSAND)
TABLE 59 SOUTH KOREA WET PLANT PRODUCTS IN SUBMARINE CABLE SYSTEM MARKET, BY TYPE, 2018-2032 (USD THOUSAND)
TABLE 60 SOUTH KOREA SUBMARINE CABLE SYSTEM MARKET, BY VOLTAGE, 2018-2032 (USD THOUSAND)
TABLE 61 SOUTH KOREA SUBMARINE CABLE SYSTEM MARKET, BY OFFERING, 2018-2032 (USD THOUSAND)
TABLE 62 SOUTH KOREA SUBMARINE CABLE SYSTEM MARKET, BY FIBER CLASS, 2018-2032 (USD THOUSAND)
TABLE 63 SOUTH KOREA SUBMARINE CABLE SYSTEM MARKET, BY CABLES TYPE, 2018-2032 (USD THOUSAND)
TABLE 64 SOUTH KOREA SUBMARINE CABLE SYSTEM MARKET, BY ARMOR TYPE, 2018-2032 (USD THOUSAND)
TABLE 65 SOUTH KOREA SUBMARINE CABLE SYSTEM MARKET, BY DEPTH, 2018-2032 (USD THOUSAND)
TABLE 66 SOUTH KOREA SUBMARINE CABLE SYSTEM MARKET, BY OPERATION, 2018-2032 (USD THOUSAND)
TABLE 67 SOUTH KOREA SUBMARINE CABLE SYSTEM MARKET, BY APPLICATION, 2018-2032 (USD THOUSAND)
TABLE 68 SOUTH KOREA COMMUNICATION CABLE IN SUBMARINE CABLE SYSTEM MARKET, BY TYPE, 2018-2032 (USD THOUSAND)
TABLE 69 SOUTH KOREA DRY PLANT PRODUCTS IN SUBMARINE CABLE SYSTEM MARKET, BY TYPE, 2018-2032 (USD THOUSAND)
TABLE 70 SOUTH KOREA WET PLANT PRODUCTS IN SUBMARINE CABLE SYSTEM MARKET, BY TYPE, 2018-2032 (USD THOUSAND)
TABLE 71 SOUTH KOREA POWER CABLE IN SUBMARINE CABLE SYSTEM MARKET, BY TYPE, 2018-2032 (USD THOUSAND)
TABLE 72 SOUTH KOREA DRY PLANT PRODUCTS IN SUBMARINE CABLE SYSTEM MARKET, BY TYPE, 2018-2032 (USD THOUSAND)
TABLE 73 SOUTH KOREA WET PLANT PRODUCTS IN POWER CABLE IN SUBMARINE CABLE SYSTEM MARKET, BY TYPE, 2018-2032 (USD THOUSAND)
TABLE 74 INDIA SUBMARINE CABLE SYSTEM MARKET, BY PRODUCT, 2018-2032 (USD THOUSAND)
TABLE 75 INDIA DRY PLANT PRODUCTS IN SUBMARINE CABLE SYSTEM MARKET, BY TYPE, 2018-2032 (USD THOUSAND)
TABLE 76 INDIA WET PLANT PRODUCTS IN SUBMARINE CABLE SYSTEM MARKET, BY TYPE, 2018-2032 (USD THOUSAND)
TABLE 77 INDIA SUBMARINE CABLE SYSTEM MARKET, BY VOLTAGE, 2018-2032 (USD THOUSAND)
TABLE 78 INDIA SUBMARINE CABLE SYSTEM MARKET, BY OFFERING, 2018-2032 (USD THOUSAND)
TABLE 79 INDIA SUBMARINE CABLE SYSTEM MARKET, BY FIBER CLASS, 2018-2032 (USD THOUSAND)
TABLE 80 INDIA SUBMARINE CABLE SYSTEM MARKET, BY CABLES TYPE, 2018-2032 (USD THOUSAND)
TABLE 81 INDIA SUBMARINE CABLE SYSTEM MARKET, BY ARMOR TYPE, 2018-2032 (USD THOUSAND)
TABLE 82 INDIA SUBMARINE CABLE SYSTEM MARKET, BY DEPTH, 2018-2032 (USD THOUSAND)
TABLE 83 INDIA SUBMARINE CABLE SYSTEM MARKET, BY OPERATION, 2018-2032 (USD THOUSAND)
TABLE 84 INDIA SUBMARINE CABLE SYSTEM MARKET, BY APPLICATION, 2018-2032 (USD THOUSAND)
TABLE 85 INDIA COMMUNICATION CABLE IN SUBMARINE CABLE SYSTEM MARKET, BY TYPE, 2018-2032 (USD THOUSAND)
TABLE 86 INDIA DRY PLANT PRODUCTS IN SUBMARINE CABLE SYSTEM MARKET, BY TYPE, 2018-2032 (USD THOUSAND)
TABLE 87 INDIA WET PLANT PRODUCTS IN SUBMARINE CABLE SYSTEM MARKET, BY TYPE, 2018-2032 (USD THOUSAND)
TABLE 88 INDIA POWER CABLE IN SUBMARINE CABLE SYSTEM MARKET, BY TYPE, 2018-2032 (USD THOUSAND)
TABLE 89 INDIA DRY PLANT PRODUCTS IN SUBMARINE CABLE SYSTEM MARKET, BY TYPE, 2018-2032 (USD THOUSAND)
TABLE 90 INDIA WET PLANT PRODUCTS IN POWER CABLE IN SUBMARINE CABLE SYSTEM MARKET, BY TYPE, 2018-2032 (USD THOUSAND)
TABLE 91 SINGAPORE SUBMARINE CABLE SYSTEM MARKET, BY PRODUCT, 2018-2032 (USD THOUSAND)
TABLE 92 SINGAPORE DRY PLANT PRODUCTS IN SUBMARINE CABLE SYSTEM MARKET, BY TYPE, 2018-2032 (USD THOUSAND)
TABLE 93 SINGAPORE WET PLANT PRODUCTS IN SUBMARINE CABLE SYSTEM MARKET, BY TYPE, 2018-2032 (USD THOUSAND)
TABLE 94 SINGAPORE SUBMARINE CABLE SYSTEM MARKET, BY VOLTAGE, 2018-2032 (USD THOUSAND)
TABLE 95 SINGAPORE SUBMARINE CABLE SYSTEM MARKET, BY OFFERING, 2018-2032 (USD THOUSAND)
TABLE 96 SINGAPORE SUBMARINE CABLE SYSTEM MARKET, BY FIBER CLASS, 2018-2032 (USD THOUSAND)
TABLE 97 SINGAPORE SUBMARINE CABLE SYSTEM MARKET, BY CABLES TYPE, 2018-2032 (USD THOUSAND)
TABLE 98 SINGAPORE SUBMARINE CABLE SYSTEM MARKET, BY ARMOR TYPE, 2018-2032 (USD THOUSAND)
TABLE 99 SINGAPORE SUBMARINE CABLE SYSTEM MARKET, BY DEPTH, 2018-2032 (USD THOUSAND)
TABLE 100 SINGAPORE SUBMARINE CABLE SYSTEM MARKET, BY OPERATION, 2018-2032 (USD THOUSAND)
TABLE 101 SINGAPORE SUBMARINE CABLE SYSTEM MARKET, BY APPLICATION, 2018-2032 (USD THOUSAND)
TABLE 102 SINGAPORE COMMUNICATION CABLE IN SUBMARINE CABLE SYSTEM MARKET, BY TYPE, 2018-2032 (USD THOUSAND)
TABLE 103 SINGAPORE DRY PLANT PRODUCTS IN SUBMARINE CABLE SYSTEM MARKET, BY TYPE, 2018-2032 (USD THOUSAND)
TABLE 104 SINGAPORE WET PLANT PRODUCTS IN SUBMARINE CABLE SYSTEM MARKET, BY TYPE, 2018-2032 (USD THOUSAND)
TABLE 105 SINGAPORE POWER CABLE IN SUBMARINE CABLE SYSTEM MARKET, BY TYPE, 2018-2032 (USD THOUSAND)
TABLE 106 SINGAPORE DRY PLANT PRODUCTS IN SUBMARINE CABLE SYSTEM MARKET, BY TYPE, 2018-2032 (USD THOUSAND)
TABLE 107 SINGAPORE WET PLANT PRODUCTS IN POWER CABLE IN SUBMARINE CABLE SYSTEM MARKET, BY TYPE, 2018-2032 (USD THOUSAND)
TABLE 108 AUSTRALIA SUBMARINE CABLE SYSTEM MARKET, BY PRODUCT, 2018-2032 (USD THOUSAND)
TABLE 109 AUSTRALIA DRY PLANT PRODUCTS IN SUBMARINE CABLE SYSTEM MARKET, BY TYPE, 2018-2032 (USD THOUSAND)
TABLE 110 AUSTRALIA WET PLANT PRODUCTS IN SUBMARINE CABLE SYSTEM MARKET, BY TYPE, 2018-2032 (USD THOUSAND)
TABLE 111 AUSTRALIA SUBMARINE CABLE SYSTEM MARKET, BY VOLTAGE, 2018-2032 (USD THOUSAND)
TABLE 112 AUSTRALIA SUBMARINE CABLE SYSTEM MARKET, BY OFFERING, 2018-2032 (USD THOUSAND)
TABLE 113 AUSTRALIA SUBMARINE CABLE SYSTEM MARKET, BY FIBER CLASS, 2018-2032 (USD THOUSAND)
TABLE 114 AUSTRALIA SUBMARINE CABLE SYSTEM MARKET, BY CABLES TYPE, 2018-2032 (USD THOUSAND)
TABLE 115 AUSTRALIA SUBMARINE CABLE SYSTEM MARKET, BY ARMOR TYPE, 2018-2032 (USD THOUSAND)
TABLE 116 AUSTRALIA SUBMARINE CABLE SYSTEM MARKET, BY DEPTH, 2018-2032 (USD THOUSAND)
TABLE 117 AUSTRALIA SUBMARINE CABLE SYSTEM MARKET, BY OPERATION, 2018-2032 (USD THOUSAND)
TABLE 118 AUSTRALIA SUBMARINE CABLE SYSTEM MARKET, BY APPLICATION, 2018-2032 (USD THOUSAND)
TABLE 119 AUSTRALIA COMMUNICATION CABLE IN SUBMARINE CABLE SYSTEM MARKET, BY TYPE, 2018-2032 (USD THOUSAND)
TABLE 120 AUSTRALIA DRY PLANT PRODUCTS IN SUBMARINE CABLE SYSTEM MARKET, BY TYPE, 2018-2032 (USD THOUSAND)
TABLE 121 AUSTRALIA WET PLANT PRODUCTS IN SUBMARINE CABLE SYSTEM MARKET, BY TYPE, 2018-2032 (USD THOUSAND)
TABLE 122 AUSTRALIA POWER CABLE IN SUBMARINE CABLE SYSTEM MARKET, BY TYPE, 2018-2032 (USD THOUSAND)
TABLE 123 AUSTRALIA DRY PLANT PRODUCTS IN SUBMARINE CABLE SYSTEM MARKET, BY TYPE, 2018-2032 (USD THOUSAND)
TABLE 124 AUSTRALIA WET PLANT PRODUCTS IN POWER CABLE IN SUBMARINE CABLE SYSTEM MARKET, BY TYPE, 2018-2032 (USD THOUSAND)
TABLE 125 INDONESIA SUBMARINE CABLE SYSTEM MARKET, BY PRODUCT, 2018-2032 (USD THOUSAND)
TABLE 126 INDONESIA DRY PLANT PRODUCTS IN SUBMARINE CABLE SYSTEM MARKET, BY TYPE, 2018-2032 (USD THOUSAND)
TABLE 127 INDONESIA WET PLANT PRODUCTS IN SUBMARINE CABLE SYSTEM MARKET, BY TYPE, 2018-2032 (USD THOUSAND)
TABLE 128 INDONESIA SUBMARINE CABLE SYSTEM MARKET, BY VOLTAGE, 2018-2032 (USD THOUSAND)
TABLE 129 INDONESIA SUBMARINE CABLE SYSTEM MARKET, BY OFFERING, 2018-2032 (USD THOUSAND)
TABLE 130 INDONESIA SUBMARINE CABLE SYSTEM MARKET, BY FIBER CLASS, 2018-2032 (USD THOUSAND)
TABLE 131 INDONESIA SUBMARINE CABLE SYSTEM MARKET, BY CABLES TYPE, 2018-2032 (USD THOUSAND)
TABLE 132 INDONESIA SUBMARINE CABLE SYSTEM MARKET, BY ARMOR TYPE, 2018-2032 (USD THOUSAND)
TABLE 133 INDONESIA SUBMARINE CABLE SYSTEM MARKET, BY DEPTH, 2018-2032 (USD THOUSAND)
TABLE 134 INDONESIA SUBMARINE CABLE SYSTEM MARKET, BY OPERATION, 2018-2032 (USD THOUSAND)
TABLE 135 INDONESIA SUBMARINE CABLE SYSTEM MARKET, BY APPLICATION, 2018-2032 (USD THOUSAND)
TABLE 136 INDONESIA COMMUNICATION CABLE IN SUBMARINE CABLE SYSTEM MARKET, BY TYPE, 2018-2032 (USD THOUSAND)
TABLE 137 INDONESIA DRY PLANT PRODUCTS IN SUBMARINE CABLE SYSTEM MARKET, BY TYPE, 2018-2032 (USD THOUSAND)
TABLE 138 INDONESIA WET PLANT PRODUCTS IN SUBMARINE CABLE SYSTEM MARKET, BY TYPE, 2018-2032 (USD THOUSAND)
TABLE 139 INDONESIA POWER CABLE IN SUBMARINE CABLE SYSTEM MARKET, BY TYPE, 2018-2032 (USD THOUSAND)
TABLE 140 INDONESIA DRY PLANT PRODUCTS IN SUBMARINE CABLE SYSTEM MARKET, BY TYPE, 2018-2032 (USD THOUSAND)
TABLE 141 INDONESIA WET PLANT PRODUCTS IN POWER CABLE IN SUBMARINE CABLE SYSTEM MARKET, BY TYPE, 2018-2032 (USD THOUSAND)
TABLE 142 THAILAND SUBMARINE CABLE SYSTEM MARKET, BY PRODUCT, 2018-2032 (USD THOUSAND)
TABLE 143 THAILAND DRY PLANT PRODUCTS IN SUBMARINE CABLE SYSTEM MARKET, BY TYPE, 2018-2032 (USD THOUSAND)
TABLE 144 THAILAND WET PLANT PRODUCTS IN SUBMARINE CABLE SYSTEM MARKET, BY TYPE, 2018-2032 (USD THOUSAND)
TABLE 145 THAILAND SUBMARINE CABLE SYSTEM MARKET, BY VOLTAGE, 2018-2032 (USD THOUSAND)
TABLE 146 THAILAND SUBMARINE CABLE SYSTEM MARKET, BY OFFERING, 2018-2032 (USD THOUSAND)
TABLE 147 THAILAND SUBMARINE CABLE SYSTEM MARKET, BY FIBER CLASS, 2018-2032 (USD THOUSAND)
TABLE 148 THAILAND SUBMARINE CABLE SYSTEM MARKET, BY CABLES TYPE, 2018-2032 (USD THOUSAND)
TABLE 149 THAILAND SUBMARINE CABLE SYSTEM MARKET, BY ARMOR TYPE, 2018-2032 (USD THOUSAND)
TABLE 150 THAILAND SUBMARINE CABLE SYSTEM MARKET, BY DEPTH, 2018-2032 (USD THOUSAND)
TABLE 151 THAILAND SUBMARINE CABLE SYSTEM MARKET, BY OPERATION, 2018-2032 (USD THOUSAND)
TABLE 152 THAILAND SUBMARINE CABLE SYSTEM MARKET, BY APPLICATION, 2018-2032 (USD THOUSAND)
TABLE 153 THAILAND COMMUNICATION CABLE IN SUBMARINE CABLE SYSTEM MARKET, BY TYPE, 2018-2032 (USD THOUSAND)
TABLE 154 THAILAND DRY PLANT PRODUCTS IN SUBMARINE CABLE SYSTEM MARKET, BY TYPE, 2018-2032 (USD THOUSAND)
TABLE 155 THAILAND WET PLANT PRODUCTS IN SUBMARINE CABLE SYSTEM MARKET, BY TYPE, 2018-2032 (USD THOUSAND)
TABLE 156 THAILAND POWER CABLE IN SUBMARINE CABLE SYSTEM MARKET, BY TYPE, 2018-2032 (USD THOUSAND)
TABLE 157 THAILAND DRY PLANT PRODUCTS IN SUBMARINE CABLE SYSTEM MARKET, BY TYPE, 2018-2032 (USD THOUSAND)
TABLE 158 THAILAND WET PLANT PRODUCTS IN POWER CABLE IN SUBMARINE CABLE SYSTEM MARKET, BY TYPE, 2018-2032 (USD THOUSAND)
TABLE 159 MALAYSIA SUBMARINE CABLE SYSTEM MARKET, BY PRODUCT, 2018-2032 (USD THOUSAND)
TABLE 160 MALAYSIA DRY PLANT PRODUCTS IN SUBMARINE CABLE SYSTEM MARKET, BY TYPE, 2018-2032 (USD THOUSAND)
TABLE 161 MALAYSIA WET PLANT PRODUCTS IN SUBMARINE CABLE SYSTEM MARKET, BY TYPE, 2018-2032 (USD THOUSAND)
TABLE 162 MALAYSIA SUBMARINE CABLE SYSTEM MARKET, BY VOLTAGE, 2018-2032 (USD THOUSAND)
TABLE 163 MALAYSIA SUBMARINE CABLE SYSTEM MARKET, BY OFFERING, 2018-2032 (USD THOUSAND)
TABLE 164 MALAYSIA SUBMARINE CABLE SYSTEM MARKET, BY FIBER CLASS, 2018-2032 (USD THOUSAND)
TABLE 165 MALAYSIA SUBMARINE CABLE SYSTEM MARKET, BY CABLES TYPE, 2018-2032 (USD THOUSAND)
TABLE 166 MALAYSIA SUBMARINE CABLE SYSTEM MARKET, BY ARMOR TYPE, 2018-2032 (USD THOUSAND)
TABLE 167 MALAYSIA SUBMARINE CABLE SYSTEM MARKET, BY DEPTH, 2018-2032 (USD THOUSAND)
TABLE 168 MALAYSIA SUBMARINE CABLE SYSTEM MARKET, BY OPERATION, 2018-2032 (USD THOUSAND)
TABLE 169 MALAYSIA SUBMARINE CABLE SYSTEM MARKET, BY APPLICATION, 2018-2032 (USD THOUSAND)
TABLE 170 MALAYSIA COMMUNICATION CABLE IN SUBMARINE CABLE SYSTEM MARKET, BY TYPE, 2018-2032 (USD THOUSAND)
TABLE 171 MALAYSIA DRY PLANT PRODUCTS IN SUBMARINE CABLE SYSTEM MARKET, BY TYPE, 2018-2032 (USD THOUSAND)
TABLE 172 MALAYSIA WET PLANT PRODUCTS IN SUBMARINE CABLE SYSTEM MARKET, BY TYPE, 2018-2032 (USD THOUSAND)
TABLE 173 MALAYSIA POWER CABLE IN SUBMARINE CABLE SYSTEM MARKET, BY TYPE, 2018-2032 (USD THOUSAND)
TABLE 174 MALAYSIA DRY PLANT PRODUCTS IN SUBMARINE CABLE SYSTEM MARKET, BY TYPE, 2018-2032 (USD THOUSAND)
TABLE 175 MALAYSIA WET PLANT PRODUCTS IN POWER CABLE IN SUBMARINE CABLE SYSTEM MARKET, BY TYPE, 2018-2032 (USD THOUSAND)
TABLE 176 PHILIPPINES SUBMARINE CABLE SYSTEM MARKET, BY PRODUCT, 2018-2032 (USD THOUSAND)
TABLE 177 PHILIPPINES DRY PLANT PRODUCTS IN SUBMARINE CABLE SYSTEM MARKET, BY TYPE, 2018-2032 (USD THOUSAND)
TABLE 178 PHILIPPINES WET PLANT PRODUCTS IN SUBMARINE CABLE SYSTEM MARKET, BY TYPE, 2018-2032 (USD THOUSAND)
TABLE 179 PHILIPPINES SUBMARINE CABLE SYSTEM MARKET, BY VOLTAGE, 2018-2032 (USD THOUSAND)
TABLE 180 PHILIPPINES SUBMARINE CABLE SYSTEM MARKET, BY OFFERING, 2018-2032 (USD THOUSAND)
TABLE 181 PHILIPPINES SUBMARINE CABLE SYSTEM MARKET, BY FIBER CLASS, 2018-2032 (USD THOUSAND)
TABLE 182 PHILIPPINES SUBMARINE CABLE SYSTEM MARKET, BY CABLES TYPE, 2018-2032 (USD THOUSAND)
TABLE 183 PHILIPPINES SUBMARINE CABLE SYSTEM MARKET, BY ARMOR TYPE, 2018-2032 (USD THOUSAND)
TABLE 184 PHILIPPINES SUBMARINE CABLE SYSTEM MARKET, BY DEPTH, 2018-2032 (USD THOUSAND)
TABLE 185 PHILIPPINES SUBMARINE CABLE SYSTEM MARKET, BY OPERATION, 2018-2032 (USD THOUSAND)
TABLE 186 PHILIPPINES SUBMARINE CABLE SYSTEM MARKET, BY APPLICATION, 2018-2032 (USD THOUSAND)
TABLE 187 PHILIPPINES COMMUNICATION CABLE IN SUBMARINE CABLE SYSTEM MARKET, BY TYPE, 2018-2032 (USD THOUSAND)
TABLE 188 PHILIPPINES DRY PLANT PRODUCTS IN SUBMARINE CABLE SYSTEM MARKET, BY TYPE, 2018-2032 (USD THOUSAND)
TABLE 189 PHILIPPINES WET PLANT PRODUCTS IN SUBMARINE CABLE SYSTEM MARKET, BY TYPE, 2018-2032 (USD THOUSAND)
TABLE 190 PHILIPPINES POWER CABLE IN SUBMARINE CABLE SYSTEM MARKET, BY TYPE, 2018-2032 (USD THOUSAND)
TABLE 191 PHILIPPINES DRY PLANT PRODUCTS IN SUBMARINE CABLE SYSTEM MARKET, BY TYPE, 2018-2032 (USD THOUSAND)
TABLE 192 PHILIPPINES WET PLANT PRODUCTS IN POWER CABLE IN SUBMARINE CABLE SYSTEM MARKET, BY TYPE, 2018-2032 (USD THOUSAND)
TABLE 193 TAIWAN SUBMARINE CABLE SYSTEM MARKET, BY PRODUCT, 2018-2032 (USD THOUSAND)
TABLE 194 TAIWAN DRY PLANT PRODUCTS IN SUBMARINE CABLE SYSTEM MARKET, BY TYPE, 2018-2032 (USD THOUSAND)
TABLE 195 TAIWAN WET PLANT PRODUCTS IN SUBMARINE CABLE SYSTEM MARKET, BY TYPE, 2018-2032 (USD THOUSAND)
TABLE 196 TAIWAN SUBMARINE CABLE SYSTEM MARKET, BY VOLTAGE, 2018-2032 (USD THOUSAND)
TABLE 197 TAIWAN SUBMARINE CABLE SYSTEM MARKET, BY OFFERING, 2018-2032 (USD THOUSAND)
TABLE 198 TAIWAN SUBMARINE CABLE SYSTEM MARKET, BY FIBER CLASS, 2018-2032 (USD THOUSAND)
TABLE 199 TAIWAN SUBMARINE CABLE SYSTEM MARKET, BY CABLES TYPE, 2018-2032 (USD THOUSAND)
TABLE 200 TAIWAN SUBMARINE CABLE SYSTEM MARKET, BY ARMOR TYPE, 2018-2032 (USD THOUSAND)
TABLE 201 TAIWAN SUBMARINE CABLE SYSTEM MARKET, BY DEPTH, 2018-2032 (USD THOUSAND)
TABLE 202 TAIWAN SUBMARINE CABLE SYSTEM MARKET, BY OPERATION, 2018-2032 (USD THOUSAND)
TABLE 203 TAIWAN SUBMARINE CABLE SYSTEM MARKET, BY APPLICATION, 2018-2032 (USD THOUSAND)
TABLE 204 TAIWAN COMMUNICATION CABLE IN SUBMARINE CABLE SYSTEM MARKET, BY TYPE, 2018-2032 (USD THOUSAND)
TABLE 205 TAIWAN DRY PLANT PRODUCTS IN SUBMARINE CABLE SYSTEM MARKET, BY TYPE, 2018-2032 (USD THOUSAND)
TABLE 206 TAIWAN WET PLANT PRODUCTS IN SUBMARINE CABLE SYSTEM MARKET, BY TYPE, 2018-2032 (USD THOUSAND)
TABLE 207 TAIWAN POWER CABLE IN SUBMARINE CABLE SYSTEM MARKET, BY TYPE, 2018-2032 (USD THOUSAND)
TABLE 208 TAIWAN DRY PLANT PRODUCTS IN SUBMARINE CABLE SYSTEM MARKET, BY TYPE, 2018-2032 (USD THOUSAND)
TABLE 209 TAIWAN WET PLANT PRODUCTS IN POWER CABLE IN SUBMARINE CABLE SYSTEM MARKET, BY TYPE, 2018-2032 (USD THOUSAND)
TABLE 210 VIETNAM SUBMARINE CABLE SYSTEM MARKET, BY PRODUCT, 2018-2032 (USD THOUSAND)
TABLE 211 VIETNAM DRY PLANT PRODUCTS IN SUBMARINE CABLE SYSTEM MARKET, BY TYPE, 2018-2032 (USD THOUSAND)
TABLE 212 VIETNAM WET PLANT PRODUCTS IN SUBMARINE CABLE SYSTEM MARKET, BY TYPE, 2018-2032 (USD THOUSAND)
TABLE 213 VIETNAM SUBMARINE CABLE SYSTEM MARKET, BY VOLTAGE, 2018-2032 (USD THOUSAND)
TABLE 214 VIETNAM SUBMARINE CABLE SYSTEM MARKET, BY OFFERING, 2018-2032 (USD THOUSAND)
TABLE 215 VIETNAM SUBMARINE CABLE SYSTEM MARKET, BY FIBER CLASS, 2018-2032 (USD THOUSAND)
TABLE 216 VIETNAM SUBMARINE CABLE SYSTEM MARKET, BY CABLES TYPE, 2018-2032 (USD THOUSAND)
TABLE 217 VIETNAM SUBMARINE CABLE SYSTEM MARKET, BY ARMOR TYPE, 2018-2032 (USD THOUSAND)
TABLE 218 VIETNAM SUBMARINE CABLE SYSTEM MARKET, BY DEPTH, 2018-2032 (USD THOUSAND)
TABLE 219 VIETNAM SUBMARINE CABLE SYSTEM MARKET, BY OPERATION, 2018-2032 (USD THOUSAND)
TABLE 220 VIETNAM SUBMARINE CABLE SYSTEM MARKET, BY APPLICATION, 2018-2032 (USD THOUSAND)
TABLE 221 VIETNAM COMMUNICATION CABLE IN SUBMARINE CABLE SYSTEM MARKET, BY TYPE, 2018-2032 (USD THOUSAND)
TABLE 222 VIETNAM DRY PLANT PRODUCTS IN SUBMARINE CABLE SYSTEM MARKET, BY TYPE, 2018-2032 (USD THOUSAND)
TABLE 223 VIETNAM WET PLANT PRODUCTS IN SUBMARINE CABLE SYSTEM MARKET, BY TYPE, 2018-2032 (USD THOUSAND)
TABLE 224 VIETNAM POWER CABLE IN SUBMARINE CABLE SYSTEM MARKET, BY TYPE, 2018-2032 (USD THOUSAND)
TABLE 225 VIETNAM DRY PLANT PRODUCTS IN SUBMARINE CABLE SYSTEM MARKET, BY TYPE, 2018-2032 (USD THOUSAND)
TABLE 226 VIETNAM WET PLANT PRODUCTS IN POWER CABLE IN SUBMARINE CABLE SYSTEM MARKET, BY TYPE, 2018-2032 (USD THOUSAND)
TABLE 227 NEW ZEALAND SUBMARINE CABLE SYSTEM MARKET, BY PRODUCT, 2018-2032 (USD THOUSAND)
TABLE 228 NEW ZEALAND DRY PLANT PRODUCTS IN SUBMARINE CABLE SYSTEM MARKET, BY TYPE, 2018-2032 (USD THOUSAND)
TABLE 229 NEW ZEALAND WET PLANT PRODUCTS IN SUBMARINE CABLE SYSTEM MARKET, BY TYPE, 2018-2032 (USD THOUSAND)
TABLE 230 NEW ZEALAND SUBMARINE CABLE SYSTEM MARKET, BY VOLTAGE, 2018-2032 (USD THOUSAND)
TABLE 231 NEW ZEALAND SUBMARINE CABLE SYSTEM MARKET, BY OFFERING, 2018-2032 (USD THOUSAND)
TABLE 232 NEW ZEALAND SUBMARINE CABLE SYSTEM MARKET, BY FIBER CLASS, 2018-2032 (USD THOUSAND)
TABLE 233 NEW ZEALAND SUBMARINE CABLE SYSTEM MARKET, BY CABLES TYPE, 2018-2032 (USD THOUSAND)
TABLE 234 NEW ZEALAND SUBMARINE CABLE SYSTEM MARKET, BY ARMOR TYPE, 2018-2032 (USD THOUSAND)
TABLE 235 NEW ZEALAND SUBMARINE CABLE SYSTEM MARKET, BY DEPTH, 2018-2032 (USD THOUSAND)
TABLE 236 NEW ZEALAND SUBMARINE CABLE SYSTEM MARKET, BY OPERATION, 2018-2032 (USD THOUSAND)
TABLE 237 NEW ZEALAND SUBMARINE CABLE SYSTEM MARKET, BY APPLICATION, 2018-2032 (USD THOUSAND)
TABLE 238 NEW ZEALAND COMMUNICATION CABLE IN SUBMARINE CABLE SYSTEM MARKET, BY TYPE, 2018-2032 (USD THOUSAND)
TABLE 239 NEW ZEALAND DRY PLANT PRODUCTS IN SUBMARINE CABLE SYSTEM MARKET, BY TYPE, 2018-2032 (USD THOUSAND)
TABLE 240 NEW ZEALAND WET PLANT PRODUCTS IN SUBMARINE CABLE SYSTEM MARKET, BY TYPE, 2018-2032 (USD THOUSAND)
TABLE 241 NEW ZEALAND POWER CABLE IN SUBMARINE CABLE SYSTEM MARKET, BY TYPE, 2018-2032 (USD THOUSAND)
TABLE 242 NEW ZEALAND DRY PLANT PRODUCTS IN SUBMARINE CABLE SYSTEM MARKET, BY TYPE, 2018-2032 (USD THOUSAND)
TABLE 243 NEW ZEALAND WET PLANT PRODUCTS IN POWER CABLE IN SUBMARINE CABLE SYSTEM MARKET, BY TYPE, 2018-2032 (USD THOUSAND)
TABLE 244 REST OF ASIA-PACIFIC SUBMARINE CABLE SYSTEM MARKET, BY PRODUCT, 2018-2032 (USD THOUSAND)
List of Figure
FIGURE 1 ASIA-PACIFIC SUBMARINE CABLE SYSTEM MARKET
FIGURE 2 ASIA-PACIFIC SUBMARINE CABLE SYSTEM MARKET: DATA TRIANGULATION
FIGURE 3 ASIA-PACIFIC SUBMARINE CABLE SYSTEM MARKET: DROC ANALYSIS
FIGURE 4 ASIA-PACIFIC SUBMARINE CABLE SYSTEM MARKET: COUNTRYWISE MARKET ANALYSIS
FIGURE 5 ASIA-PACIFIC SUBMARINE CABLE SYSTEM MARKET: COMPANY RESEARCH ANALYSIS
FIGURE 6 ASIA-PACIFIC SUBMARINE CABLE SYSTEM MARKET: MULTIVARIATE MODELLING
FIGURE 7 ASIA-PACIFIC SUBMARINE CABLE SYSTEM MARKET: INTERVIEW DEMOGRAPHICS
FIGURE 8 ASIA-PACIFIC SUBMARINE CABLE SYSTEM MARKET: DBMR MARKET POSITION GRID
FIGURE 9 ASIA-PACIFIC SUBMARINE CABLE SYSTEM MARKET: VENDOR SHARE ANALYSIS
FIGURE 10 ASIA-PACIFIC SUBMARINE CABLE SYSTEM MARKET: SEGMENTATION
FIGURE 11 EXECUTIVE SUMMARY
FIGURE 12 STRATEGIC DECISIONS
FIGURE 13 THREE SEGMENTS COMPRISE THE ASIA-PACIFIC SUBMARINE CABLE SYSTEM MARKET, BY ULTRASOUND SENSOR TYPE (2024)
FIGURE 14 RISING CHRONIC DISEASE BURDEN & AGING POPULATION DRIVING NEED FOR DIAGNOSTIC IMAGING IS EXPECTED TO DRIVE THE ASIA-PACIFIC SUBMARINE CABLE SYSTEM MARKET IN THE FORECAST PERIOD
FIGURE 15 THE BULK PIEZOELECTRIC TRANSDUCERS (CONVENTIONAL) SEGMENT IS EXPECTED TO ACCOUNT FOR THE LARGEST SHARE OF THE ASIA-PACIFIC SUBMARINE CABLE SYSTEM MARKET IN 2025 AND 2032
FIGURE 16 DROC ANALYSIS
FIGURE 17 ASIA-PACIFIC SUBMARINE CABLE SYSTEM MARKET: BY PRODUCT, 2024
FIGURE 18 ASIA-PACIFIC SUBMARINE CABLE SYSTEM MARKET: BY VOLTAGE, 2024
FIGURE 19 ASIA-PACIFIC SUBMARINE CABLE SYSTEM MARKET: BY OFFERINGS, 2024
FIGURE 20 ASIA-PACIFIC SUBMARINE CABLE SYSTEM MARKET: BY FIBRE CLASS, 2024
FIGURE 21 ASIA-PACIFIC SUBMARINE CABLE SYSTEM MARKET: BY CABLES TYPE, 2024
FIGURE 22 ASIA-PACIFIC SUBMARINE CABLE SYSTEM MARKET: BY CABLES TYPE, 2024
FIGURE 23 ASIA-PACIFIC SUBMARINE CABLE SYSTEM MARKET: BY CABLES TYPE, 2024
FIGURE 24 ASIA-PACIFIC SUBMARINE CABLE SYSTEM MARKET: BY OPERATION, 2024
FIGURE 25 ASIA-PACIFIC SUBMARINE CABLE SYSTEM MARKET: BY APPLICATION, 2024
FIGURE 26 ASIA-PACIFIC SUBMARINE CABLE SYSTEM MARKET: SNAPSHOT (2024)
FIGURE 27 ASIA-PACIFIC SUBMARINE CABLE SYSTEM MARKET: COMPANY SHARE 2024 (%)
Asia Pacific Submarine Cable System Market, Supply Chain Analysis and Ecosystem Framework
To support market growth and help clients navigate the impact of geopolitical shifts, DBMR has integrated in-depth supply chain analysis into its Asia Pacific Submarine Cable System Market research reports. This addition empowers clients to respond effectively to global changes affecting their industries. The supply chain analysis section includes detailed insights such as Asia Pacific Submarine Cable System Market consumption and production by country, price trend analysis, the impact of tariffs and geopolitical developments, and import and export trends by country and HSN code. It also highlights major suppliers with data on production capacity and company profiles, as well as key importers and exporters. In addition to research, DBMR offers specialized supply chain consulting services backed by over a decade of experience, providing solutions like supplier discovery, supplier risk assessment, price trend analysis, impact evaluation of inflation and trade route changes, and comprehensive market trend analysis.
Data collection and base year analysis are done using data collection modules with large sample sizes. The stage includes obtaining market information or related data through various sources and strategies. It includes examining and planning all the data acquired from the past in advance. It likewise envelops the examination of information inconsistencies seen across different information sources. The market data is analysed and estimated using market statistical and coherent models. Also, market share analysis and key trend analysis are the major success factors in the market report. To know more, please request an analyst call or drop down your inquiry.
The key research methodology used by DBMR research team is data triangulation which involves data mining, analysis of the impact of data variables on the market and primary (industry expert) validation. Data models include Vendor Positioning Grid, Market Time Line Analysis, Market Overview and Guide, Company Positioning Grid, Patent Analysis, Pricing Analysis, Company Market Share Analysis, Standards of Measurement, Global versus Regional and Vendor Share Analysis. To know more about the research methodology, drop in an inquiry to speak to our industry experts.
Data Bridge Market Research is a leader in advanced formative research. We take pride in servicing our existing and new customers with data and analysis that match and suits their goal. The report can be customized to include price trend analysis of target brands understanding the market for additional countries (ask for the list of countries), clinical trial results data, literature review, refurbished market and product base analysis. Market analysis of target competitors can be analyzed from technology-based analysis to market portfolio strategies. We can add as many competitors that you require data about in the format and data style you are looking for. Our team of analysts can also provide you data in crude raw excel files pivot tables (Fact book) or can assist you in creating presentations from the data sets available in the report.


