
Asia Pacific Ultrasound Imaging Devices Market
Market Size in USD Billion
 USD
1.38 Billion
USD
1.55 Billion
2024
2032
USD
1.38 Billion
USD
1.55 Billion
2024
2032
| 2025 - 2032 | |
| USD 1.38 Billion | |
| USD 1.55 Billion | |
| % | |
|
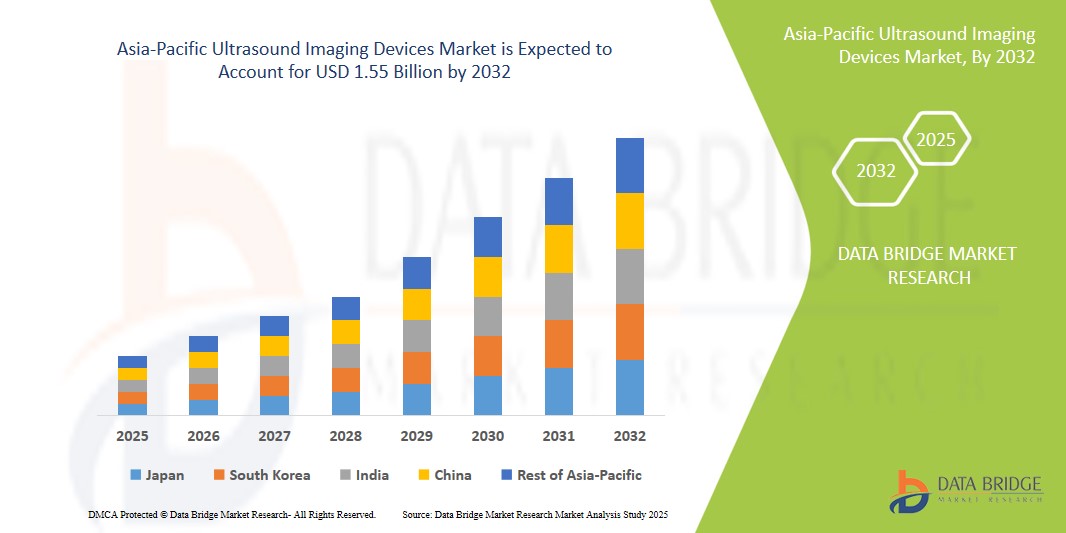
Asia-Pacific Ultrasound Imaging Devices Market Size
- The Asia-Pacific ultrasound imaging devices market size was valued at USD 1.38 billion in 2024 and is expected to reach USD 1.55 billion by 2032, at a CAGR of 1.5% during the forecast period
- This growth is driven by factors such as the rising prevalence of chronic diseases, technological advancements, and increasing demand for non-invasive diagnostic procedures
Asia-Pacific Ultrasound Imaging Devices Market Analysis
- Ultrasound imaging devices are essential diagnostic tools that use high-frequency sound waves to create real-time images of internal body structures. They are widely used across various medical fields, including cardiology, obstetrics and gynecology, musculoskeletal imaging, and general internal medicine
- The demand for ultrasound imaging devices in the Asia-Pacific region is significantly driven by the rising incidence of chronic diseases, the growing preference for non-invasive diagnostic methods, and advancements in imaging technology. Factors such as expanding healthcare infrastructure, increasing medical tourism, and supportive government initiatives further contribute to market growth
- China is expected to dominate the Asia-Pacific ultrasound imaging devices market with share of 42.45% driven by several key factors, including China’s robust domestic manufacturing base, with prominent companies such as Mindray and SIUI producing a wide range of affordable and technologically advanced ultrasound systems
- India is expected to be the fastest growing region with market share of 8.3% in the Asia-Pacific ultrasound imaging devices market. This robust growth is driven by several factors, including the expansion of hospitals and diagnostic centres, increasing adoption of advanced imaging technologies, and rising demand for affordable and portable ultrasound solutions across both urban and rural areas
- The compact/handheld ultrasound devices segment is expected to dominate the Asia-Pacific ultrasound imaging devices market with the largest share of 58.62% in 2024, driven by the rising demand for point-of-care diagnostics, especially in remote and resource-limited settings. Technological advancements have led to the development of more affordable and user-friendly devices, further boosting adoption
Report Scope and Asia-Pacific Ultrasound Imaging Devices Market Segmentation
|
Attributes |
Asia-Pacific Ultrasound Imaging Devices Key Market Insights |
|
Segments Covered |
|
|
Countries Covered |
Asia-Pacific
|
|
Key Market Players |
|
|
Market Opportunities |
|
|
Value Added Data Infosets |
In addition to the insights on market scenarios such as market value, growth rate, segmentation, geographical coverage, and major players, the market reports curated by the Data Bridge Market Research also include import export analysis, production capacity overview, production consumption analysis, price trend analysis, climate change scenario, supply chain analysis, value chain analysis, raw material/consumables overview, vendor selection criteria, PESTLE Analysis, Porter Analysis, and regulatory framework. |
Asia-Pacific Ultrasound Imaging Devices Market Trends
“Technological Advancements in Ultrasound Imaging and Expansion of Portable Devices”
- One prominent trend in the evolution of ultrasound imaging devices in the Asia-Pacific market is the rapid advancement in imaging technologies and the growing adoption of portable and handheld ultrasound systems
- These innovations enhance diagnostic capabilities by providing high-resolution, real-time imaging that improves the accuracy of disease detection and monitoring, even in remote or resource-limited settings
- For instance, modern portable ultrasound devices now integrate 3D/4D imaging and artificial intelligence (AI)-driven features, enabling healthcare professionals to perform faster, more precise diagnostics at the point of care. This is particularly valuable for applications in emergency medicine, obstetrics, cardiology, and rural healthcare services
- These advancements are reshaping diagnostic practices across the Asia-Pacific region, improving access to quality healthcare, enhancing patient outcomes, and driving the demand for next-generation ultrasound imaging systems equipped with smart, portable, and AI-enhanced technologies
Asia-Pacific Ultrasound Imaging Devices Market Dynamics
Driver
“Rising Demand Due to Growing Chronic Disease Burden”
- The increasing prevalence of chronic diseases such as cardiovascular disorders, cancer, and musculoskeletal conditions is significantly contributing to the rising demand for ultrasound imaging devices in the Asia-Pacific region
- As lifestyles change and populations age, the incidence of such health conditions continues to climb, necessitating frequent, accurate diagnostic imaging for timely treatment and monitoring
- As more individuals require medical imaging for disease diagnosis and management, the need for ultrasound devices, known for their non-invasive and radiation-free advantages, continues to expand across hospitals, diagnostic centers, and outpatient settings
- For instance, In February 2024, according to an article published by the World Health Organization (WHO) Asia-Pacific office, non-communicable diseases (NCDs) account for nearly 75% of deaths across the region, with heart diseases and cancers being the leading causes. Early diagnosis enabled by technologies such as ultrasound imaging is essential to curb this rising burden
- Consequently, the escalating chronic disease burden directly fuels the growth of the ultrasound imaging devices market in Asia-Pacific, encouraging further investments in advanced and portable diagnostic solutions
Opportunity
“Advancing Diagnostic Imaging through AI-Integrated Ultrasound Systems”
- AI-powered ultrasound imaging devices are creating new opportunities by enhancing diagnostic precision, automating routine imaging tasks, and assisting healthcare professionals in interpreting complex datasets quickly and accurately
- AI algorithms embedded in ultrasound systems can analyze images in real time, highlight abnormalities, and even predict disease progression, thereby helping clinicians make faster, better-informed decisions
- In addition, AI-driven systems allow for standardized imaging protocols, improved workflow efficiency, and reduced operator dependency, enabling broader use across various clinical settings, including rural and underserved areas
- For instance, In January 2025, according to an article published by The Lancet Digital Health, AI-assisted ultrasound imaging was reported to significantly improve early-stage cancer detection rates in resource-constrained settings, leading to earlier interventions and better patient outcomes across several Asia-Pacific countries
- The integration of AI with ultrasound imaging is expected to boost diagnostic capabilities, reduce healthcare disparities, and substantially increase market opportunities across the Asia-Pacific region
Restraint/Challenge
“High Costs and Affordability Issues Limiting Market Expansion”
- The high cost of advanced ultrasound imaging devices, especially those equipped with 3D/4D capabilities and AI enhancements, poses a significant challenge for widespread market penetration, particularly in low- and middle-income countries within the Asia-Pacific region
- These devices can range in price from several thousand to over a hundred thousand dollars, depending on the technology and features, placing them beyond the reach of smaller clinics and public healthcare facilities
- This substantial financial burden can deter many healthcare providers from upgrading their diagnostic equipment, leading to continued reliance on outdated ultrasound systems that offer lower image quality and diagnostic accuracy
- For instance, In October 2024, according to a report published by Asia-Pacific Medical Device Insights, the average cost of acquiring a high-end AI-integrated portable ultrasound device in the region was approximately USD 80,000, posing significant barriers for widespread adoption, especially in rural and remote healthcare settings
- Consequently, the high acquisition and maintenance costs of modern ultrasound systems may create disparities in healthcare access and slow down the overall adoption of advanced diagnostic technologies across the Asia-Pacific region
Asia-Pacific Ultrasound Imaging Devices Market Scope
The market is segmented on the basis of array format, device display, device portability, technology, application, end user and distribution channel
|
Segmentation |
Sub-Segmentation |
|
By Array Format |
|
|
By Device Display |
|
|
By Device Portability |
|
|
By Technology
|
|
|
By Application |
|
|
By End User |
|
|
By Distribution Channel
|
|
In 2025, the Compact/Handheld Ultrasound Devices is projected to dominate the market with a largest share in device portability segment
The compact/handheld ultrasound devices segment is expected to dominate the Asia-Pacific ultrasound imaging devices market with the largest share of 58.62% in 2024, driven by the rising demand for point-of-care diagnostics, especially in remote and resource-limited settings. Technological advancements have led to the development of more affordable and user-friendly devices, further boosting adoption. The increasing use of handheld ultrasound devices across emergency medicine, obstetrics, and primary care settings, coupled with the growing need for portable solutions, is significantly contributing to the segment’s market dominance.
The radiology/general Imaging is expected to account for the largest share during the forecast period in application segment market
In 2025, The radiology/general imaging segment is expected to dominate the Asia-Pacific ultrasound imaging devices market with the largest share of approximately 32% by 2025. This is driven by the extensive application of ultrasound in diagnosing a wide range of conditions, including abdominal, pelvic, and musculoskeletal imaging. The growing prevalence of chronic diseases and the increasing demand for early-stage diagnostic tools are further fuelling the demand for ultrasound in general imaging. Technological advancements, such as AI integration and improved image quality, are also contributing to the segment’s market dominance.
Asia-Pacific Ultrasound Imaging Devices Market Regional Analysis
- Asia-Pacific region accounts for approximately 23% of the global ultrasound devices market in 2024
- China is the dominant country in the Asia-Pacific ultrasound imaging devices market with market share of 42.45% driven by several key factors, including China’s robust domestic manufacturing base, with prominent companies such as Mindray and SIUI producing a wide range of affordable and technologically advanced ultrasound systems
- India is expected to witness the highest CAGR of 8.3% in the Asia-Pacific ultrasound imaging devices market. This robust growth is driven by several factors, including the expansion of hospitals and diagnostic centres, increasing adoption of advanced imaging technologies, and rising demand for affordable and portable ultrasound solutions across both urban and rural areas
Asia-Pacific Ultrasound Imaging Devices Market Share
The market competitive landscape provides details by competitor. Details included are company overview, company financials, revenue generated, market potential, investment in research and development, new market initiatives, global presence, production sites and facilities, production capacities, company strengths and weaknesses, product launch, product width and breadth, application dominance. The above data points provided are only related to the companies' focus related to market.
The Major Market Leaders Operating in the Market Are:
- Koninklijke Philips N.V. (Netherlands)
- CANON MEDICAL SYSTEMS CORPORATION (Japan)
- Hitachi, Ltd. (Japan)
- Siemens (Germany)
- Shenzhen Mindray Bio-Medical Electronics Co., Ltd. (China)
- ALPINION MEDICAL SYSTEMS Co., Ltd (South Korea)
- CHISON Medical Technologies Co., Ltd. (China)
- EDAN Instruments, Inc. (China)
- ESAOTE SPA (Italy)
- FUJIFILM Corporation (Japan)
- FUKUDA DENSHI (Japan)
- Hologic, Inc. (U.S.)
- Samsung Medison Co., Ltd. (South Korea)
- Analogic Corporation (U.S.)
- General Electric Company (U.S.)
- TOSHIBA CORPORATION (Japan)
- Trivitron Healthcare (India)
Latest Developments in Asia-Pacific Ultrasound Imaging Devices Market
- In January 2025, Mindray launched its M9 portable ultrasound system in the Asia-Pacific market, featuring advanced imaging technology, compact design, and AI-powered features. The system provides high-resolution imaging with superior color Doppler performance, making it ideal for obstetrics, cardiology, and emergency care settings. Mindray's system is particularly designed for mobile usage in point-of-care environments and hospitals in rural areas, helping expand healthcare access in underserved regions
- In October 2024, GE Healthcare presented its LOGIQ e10 ultrasound system at the Asia-Pacific Ultrasound Summit 2024. The LOGIQ e10 features enhanced imaging capabilities with deep learning algorithms to improve diagnostic accuracy. It includes tools for assessing cardiovascular conditions, gastrointestinal imaging, and musculoskeletal injuries, making it a versatile choice for hospitals and clinics. GE Healthcare emphasized the device's role in increasing operational efficiency, especially in emergency and critical care departments
- In September 2024, Siemens Healthineers unveiled its ACUSON Sequoia ultrasound system at the Asia-Pacific Imaging Conference. This high-performance ultrasound system integrates cutting-edge AI technologies, providing real-time image optimization. The system's advanced features cater to a variety of applications including radiology, obstetrics, and musculoskeletal imaging. Siemens highlighted its focus on enhancing diagnostic confidence and workflow in both urban and rural healthcare settings across the Asia-Pacific region
- In August 2024, Philips Healthcare introduced its Lumify mobile ultrasound solution to several Southeast Asian countries, offering a cost-effective, portable ultrasound device designed for mobile healthcare providers. Lumify's integration with mobile devices enables remote consultations and telemedicine, improving healthcare access in remote regions. Philips emphasized the device’s adaptability in obstetrics, cardiology, and emergency departments, aiming to reduce the burden on hospitals with growing patient volumes
- In July 2024, Fujifilm launched the SonoSite SII ultrasound system in the Asia-Pacific market, targeting both compact ultrasound and high-end applications. The system offers advanced imaging for a wide range of specialties, including emergency medicine, cardiology, and urology. Fujifilm's introduction of this device aims to address the growing demand for portable ultrasound systems that deliver diagnostic clarity in both clinical and point-of-care environments
SKU-

- Interactive Data Analysis Dashboard
- Company Analysis Dashboard for high growth potential opportunities
- Research Analyst Access for customization & queries
- Competitor Analysis with Interactive dashboard
- Latest News, Updates & Trend analysis
- Harness the Power of Benchmark Analysis for Comprehensive Competitor Tracking
Data collection and base year analysis are done using data collection modules with large sample sizes. The stage includes obtaining market information or related data through various sources and strategies. It includes examining and planning all the data acquired from the past in advance. It likewise envelops the examination of information inconsistencies seen across different information sources. The market data is analysed and estimated using market statistical and coherent models. Also, market share analysis and key trend analysis are the major success factors in the market report. To know more, please request an analyst call or drop down your inquiry.
The key research methodology used by DBMR research team is data triangulation which involves data mining, analysis of the impact of data variables on the market and primary (industry expert) validation. Data models include Vendor Positioning Grid, Market Time Line Analysis, Market Overview and Guide, Company Positioning Grid, Patent Analysis, Pricing Analysis, Company Market Share Analysis, Standards of Measurement, Global versus Regional and Vendor Share Analysis. To know more about the research methodology, drop in an inquiry to speak to our industry experts.
Data Bridge Market Research is a leader in advanced formative research. We take pride in servicing our existing and new customers with data and analysis that match and suits their goal. The report can be customized to include price trend analysis of target brands understanding the market for additional countries (ask for the list of countries), clinical trial results data, literature review, refurbished market and product base analysis. Market analysis of target competitors can be analyzed from technology-based analysis to market portfolio strategies. We can add as many competitors that you require data about in the format and data style you are looking for. Our team of analysts can also provide you data in crude raw excel files pivot tables (Fact book) or can assist you in creating presentations from the data sets available in the report.


