
Asia Pacific Viscosupplementation Market
Market Size in USD Billion
 USD
1.39 Billion
USD
2.89 Billion
2025
2033
USD
1.39 Billion
USD
2.89 Billion
2025
2033
| 2026 - 2033 | |
| USD 1.39 Billion | |
| USD 2.89 Billion | |
| % | |
|
Asia-Pacific Viscosupplementation Market Overview
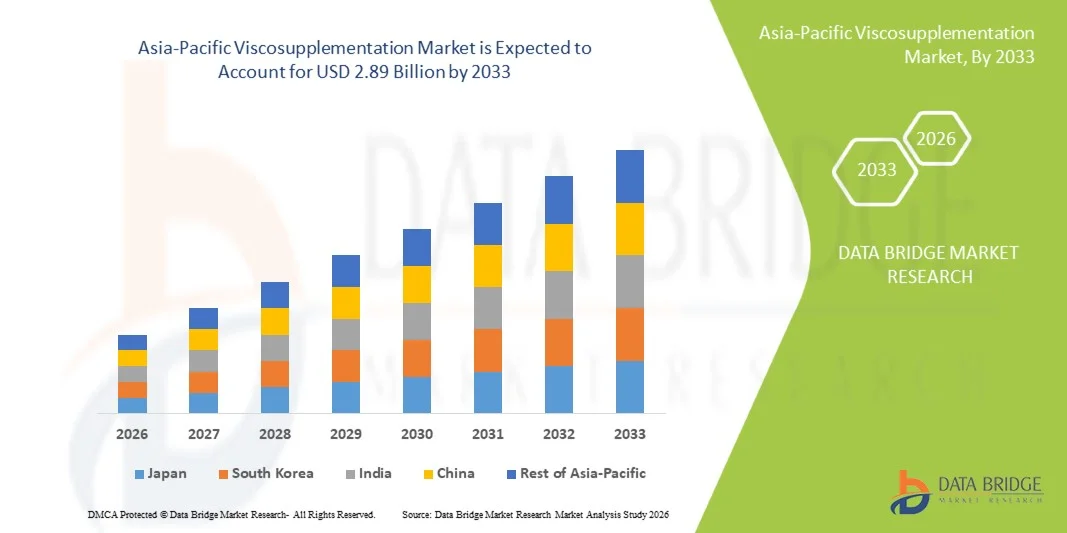
The Asia-Pacific viscosupplementation market was valued at USD 1.39 billion in 2025 and is projected to reach USD 2.89 billion by 2033, growing at a CAGR of 9.6% from 2026 to 2033. The market is witnessing steady expansion driven by the rising prevalence of osteoarthritis, increasing geriatric population, and growing preference for minimally invasive joint pain management therapies.
The increasing burden of knee osteoarthritis across aging populations, combined with greater awareness of hyaluronic acid–based injections, is encouraging wider adoption of viscosupplementation treatments across hospitals, orthopedic clinics, and specialty care centers. In addition, advancements in injection techniques and expanding healthcare infrastructure in emerging Asia-Pacific economies are further supporting market penetration, as patients and clinicians increasingly opt for non-surgical alternatives to delay or avoid joint replacement procedures.
Key Market Trends & Insights
- China dominated the Asia-Pacific viscosupplementation market with the largest revenue share of 35.40% in 2025, supported by a high osteoarthritis burden, large aging population, and expanding orthopedic care infrastructure.
- The Non-Animal Origin segment led the market with a 60.65% share in 2025, driven by strong clinical preference for biofermentation-derived hyaluronic acid formulations with higher purity and lower immunogenic risk
- India is expected to be the fastest-growing country market at a CAGR of 10.2% from 2026 to 2033, fueled by rising geriatric population, increasing osteoarthritis prevalence, improving healthcare access, and growing awareness of non-surgical joint pain treatments.
- Adults are the fastest-growing age group type, projected to register a CAGR of 7.8%, reflecting the surge in cases of early-onset osteoarthritis linked to obesity, sedentary lifestyles, sports injuries, and occupational strain.
- The Three Injections segment dominated the injection type category with a 40.50% revenue share in 2025, led by the most widely adopted clinical protocol for knee osteoarthritis management across Asia-Pacific.
- Intermediate Molecular Weight accounted for 45.50% of the market, preferred by its optimal balance of viscosity, safety, and clinical efficacy.
- The High Molecular Weight segment is the fastest-growing molecular weight category, with a CAGR of 8.2%, driven by its superior long-lasting pain relief and reduced injection frequency requirements.
Market Size & Forecast
- Global Market Value (2025): USD 1.39 Billion
- Expected Market Value (2033): USD 2.89 Billion
- Forecast CAGR (2026–2033): 9.6%
- Leading Country in 2025: China
- Fastest Growing Country: India
Report Scope and Asia-Pacific Viscosupplementation Market Segmentation
|
Attributes |
Asia-Pacific Viscosupplementation Key Market Insights |
|
Segments Covered |
|
|
Countries Covered |
Asia-Pacific · China · Japan · India · South Korea · Singapore · Malaysia · Australia · Thailand · Indonesia · Philippines · Rest of Asia-Pacific |
|
Key Market Players |
· Sanofi (France) · Fidia Farmaceutici S.p.A. (Italy) · Anika Therapeutics, Inc. (U.S.) · Seikagaku Corporation (Japan) · LG Chem, Ltd. (South Korea) · Shandong Haohai Biological Technology Co., Ltd. (China) · Meiji Seika Pharma Co., Ltd. (Japan) · Daiichi Sankyo Company, Limited (Japan) · Chugai Pharmaceutical Co., Ltd. (Japan) · Kyowa Kirin Co., Ltd. (Japan) · Teva Pharmaceutical Industries Ltd. (Israel) · Zimmer Biomet (U.S.) · Johnson & Johnson Services, Inc. (U.S.) · Bioventus Inc. (U.S.) · Hyaltech Ltd. (U.K.) · Contura International A/S (Denmark) · Smith & Nephew (U.K.) · Rottapharm Madaus S.p.A. (Italy) · Arthrex, Inc. (U.S.) · Bausch Health (Canada) |
|
Market Opportunities |
· Rising adoption of hyaluronic acid injections in early-stage osteoarthritis patients · Expansion of private orthopedic chains and specialty clinics · Increasing clinical preference for single-injection and high–molecular weight formulations |
|
Value Added Data Infosets |
In addition to the insights on market scenarios such as market value, growth rate, segmentation, geographical coverage, and major players, the market reports curated by the Data Bridge Market Research also include in-depth expert analysis, patient epidemiology, pipeline analysis, pricing analysis, and regulatory framework. |
Asia-Pacific Viscosupplementation Market Trends
Trend: Rising Shift Toward Minimally Invasive Osteoarthritis Treatment Adoption
Asia-Pacific viscosupplementation market is experiencing a strong structural shift toward minimally invasive treatment approaches, particularly hyaluronic acid intra-articular injections, as both patients and clinicians increasingly prioritize non-surgical management of knee osteoarthritis. This trend is being reinforced by growing awareness of early-stage intervention, where delaying or avoiding total knee replacement has become a key clinical objective. Improvements in orthopedic outpatient care, faster procedure times, and higher patient acceptance of repeat injection cycles are further strengthening adoption. In addition, updated treatment protocols across major hospitals are increasingly recommending viscosupplementation as a first-line or intermediate therapy before surgical escalation. For instance, urban tertiary hospitals in China and India are reporting rising volumes of outpatient knee injection procedures as patients shift away from long recovery surgical options.
Asia-Pacific Viscosupplementation Market Dynamics
Key Market Driver: Rising Prevalence of Osteoarthritis and Aging Population Growth
The primary driver of the Asia-Pacific viscosupplementation market is the rapid increase in osteoarthritis prevalence, strongly linked to demographic aging, sedentary lifestyles, and rising obesity rates across major economies such as China, Japan, and India. As the elderly population expands, the incidence of degenerative joint disorders is accelerating, creating sustained demand for long-term pain management therapies that preserve joint function. Viscosupplementation is increasingly positioned as a preferred alternative to corticosteroids and surgical interventions due to its better safety profile and ability to improve mobility over multiple treatment cycles. Healthcare systems are also under pressure to reduce surgical burdens, further encouraging early-stage injection therapies. For instance, orthopedic departments in Japan are increasingly integrating hyaluronic acid injections into standardized osteoarthritis treatment pathways for elderly patients to delay knee replacement surgery.
Key Restraint/Challenge: Limited Reimbursement Coverage and High Out-of-Pocket Costs
A significant barrier to market expansion in the Asia-Pacific viscosupplementation industry is the uneven reimbursement landscape, where many public insurance systems do not fully cover intra-articular hyaluronic acid injections, shifting a substantial financial burden onto patients. This leads to affordability challenges, particularly in low- and middle-income populations, where treatment decisions are highly price-sensitive. In addition, limited awareness among primary care physicians and patients about the long-term benefits of viscosupplementation reduces early adoption rates, resulting in delayed treatment initiation or preference for cheaper analgesic alternatives. The fragmented healthcare financing structure across the region further intensifies accessibility gaps between urban and rural populations. For instance, in several Southeast Asian countries, patients often opt for oral pain management drugs instead of injection-based therapies due to lack of insurance reimbursement support for viscosupplementation procedures.
Key Market Opportunity: Expansion of Advanced Orthopedic Care Infrastructure in Emerging Economies
The Asia-Pacific viscosupplementation market presents a strong growth opportunity driven by the rapid expansion of orthopedic care infrastructure, particularly in emerging economies where private healthcare investment is accelerating. The increasing establishment of specialty orthopedic clinics, ambulatory surgical centers, and hospital chains is significantly improving patient access to joint injection therapies beyond major metropolitan areas. This infrastructure expansion is also enabling the adoption of premium viscosupplementation products, including single-injection and high molecular weight formulations that offer improved patient compliance and longer-lasting relief. In addition, rising medical tourism and private sector participation are supporting technology transfer and wider availability of advanced orthopedic procedures. For instance, the growth of multi-specialty orthopedic hospital networks in tier-2 and tier-3 cities across India and China is enabling broader access to viscosupplementation therapies for previously underserved patient populations.
Asia-Pacific Viscosupplementation Market Scope
The Asia-Pacific viscosupplementation market is segmented on the basis of source, age group, injection type, molecular weight, end user, and distribution channel.
- By Source
On the basis of source, the Asia-Pacific viscosupplementation market is segmented into animal origin and non-animal origin. The Non-Animal Origin segment dominated the market with an estimated 60.65% share in 2025, driven by strong clinical preference for biofermentation-derived hyaluronic acid formulations with higher purity and lower immunogenic risk. These products are widely preferred in developed healthcare systems such as Japan and South Korea due to stricter regulatory standards and advanced clinical adoption practices. Hospitals and orthopedic specialists favor non-animal origin formulations because they offer consistent molecular structure, improved safety profiles, and reduced risk of allergic reactions. Continuous advancements in cross-linked hyaluronic acid technology are further enhancing treatment efficacy and duration of pain relief. Increasing physician awareness and guideline-driven adoption are also reinforcing dominance. The segment benefits from strong penetration in premium hospital settings and specialty orthopedic clinics.
The Animal Origin segment is expected to be the fastest-growing, registering a CAGR of 8.7% from 2026 to 2033, as it remains primarily driven by cost-sensitive healthcare systems in emerging economies. Although still widely used in certain public procurement programs, concerns regarding variability, purification standards, and immunogenic responses limit broader adoption. However, its affordability ensures continued relevance in rural and semi-urban healthcare facilities. Gradual substitution by non-animal formulations is expected over the forecast period as safety standards tighten across the region.
- By Age Group
On the basis of age group, the market is segmented into geriatric and adults. The Geriatric segment dominated the market with an estimated 70.75% share in 2025, driven by the high prevalence of osteoarthritis among aging populations in countries such as China, Japan, and India. Age-related cartilage degeneration, reduced joint lubrication, and limited mobility significantly increase demand for viscosupplementation therapies in this population. Hospitals widely prefer injectable hyaluronic acid treatments for elderly patients as a safer alternative to surgical interventions such as total knee replacement. Rising life expectancy and improved access to orthopedic care are further strengthening market dominance. Government-led elderly healthcare programs and insurance support in select countries are also contributing to higher adoption rates. The segment remains the core revenue contributor across Asia-Pacific.
The Adults segment is expected to be the fastest-growing, registering a CAGR of 7.8% from 2026 to 2033, driven by increasing cases of early-onset osteoarthritis linked to obesity, sedentary lifestyles, sports injuries, and occupational strain. Younger patients are increasingly opting for preventive joint care to delay disease progression and avoid surgical procedures later in life. Growing awareness of non-surgical treatment options and improved diagnostic rates are encouraging earlier intervention. Expanding orthopedic clinic networks and outpatient care facilities are improving access for working-age populations. Rising sports participation and injury-related joint disorders are further accelerating demand for viscosupplementation therapies in this segment.
- By Injection Type
On the basis of injection type, the market is segmented into single injection, three injections, and five injections. The Three Injections segment dominated the market with an estimated 40.45% share in 2025, as it remains the most widely adopted clinical protocol for knee osteoarthritis management across Asia-Pacific. It is favored for its balanced approach between cost, clinical effectiveness, and established physician familiarity. Many treatment guidelines still recommend multi-dose regimens due to long-standing clinical validation and predictable therapeutic outcomes. Hospitals and orthopedic clinics continue to rely on this protocol for moderate osteoarthritis cases. Reimbursement structures in several countries also favor multi-injection regimens over premium single-dose alternatives. Strong physician trust and historical usage patterns continue to reinforce dominance.
The Single Injection segment is expected to be the fastest-growing, registering a CAGR of 8.5% from 2026 to 2033, driven by rising patient preference for convenience, fewer hospital visits, and improved compliance. Advances in high molecular weight and cross-linked formulations have significantly improved efficacy, making single-dose therapy a strong alternative to multi-injection regimens. Outpatient care expansion and time-efficient treatment models are further supporting adoption. Physicians are increasingly recommending single-injection therapies for mild to moderate osteoarthritis cases due to reduced procedural burden. Growing demand for fast, effective, and minimally disruptive treatment options is accelerating this segment’s growth.
- By Molecular Weight
On the basis of molecular weight, the market is segmented into low molecular weight, intermediate molecular weight, and high molecular weight. The Intermediate Molecular Weight segment dominated the market with an estimated 45.50% share in 2025, due to its optimal balance of viscosity, safety, and clinical efficacy. It is widely used as a standard treatment option in hospitals and orthopedic clinics across Asia-Pacific. Physicians prefer this category because it provides consistent pain relief with moderate duration and well-established safety profiles. It also offers a favorable balance between cost and therapeutic outcomes, making it suitable for large patient populations. Strong availability across public and private healthcare systems further supports dominance. The segment continues to be the most commonly prescribed formulation type in routine osteoarthritis treatment.
The High Molecular Weight segment is expected to be the fastest-growing, registering a CAGR of 8.2% from 2026 to 2033, driven by its superior long-lasting pain relief and reduced injection frequency requirements. It is increasingly preferred for moderate to severe osteoarthritis cases where extended symptom control is required. Advances in cross-linking technology have improved stability, residence time, and clinical performance. Hospitals are increasingly shifting toward premium formulations to enhance patient satisfaction and treatment outcomes. Rising demand for single-injection, long-duration therapies is further accelerating adoption across the region.
- By End User
On the basis of end user, the market is segmented into hospitals, orthopedic clinics, ambulatory care centers, and others. The Hospitals segment dominated the market with an estimated 55.60% share in 2025, driven by high patient inflow, advanced diagnostic capabilities, and availability of skilled orthopedic specialists. Hospitals remain the primary treatment centers for moderate to severe osteoarthritis cases requiring structured injection therapy and follow-up care. Strong institutional procurement systems and reimbursement support further reinforce dominance. They also serve as referral hubs for complex joint disorders and advanced treatment planning. High procedural volumes across tertiary care hospitals continue to sustain leadership. The segment benefits from well-established infrastructure and multidisciplinary care teams.
The Ambulatory Care Centers segment is expected to be the fastest-growing, registering a CAGR of 9.1% from 2026 to 2033, driven by rising demand for outpatient-based treatment models and cost-efficient healthcare delivery. Patients increasingly prefer these centers due to shorter waiting times, faster procedures, and lower overall treatment costs. Expansion of private healthcare infrastructure in emerging Asia-Pacific economies is significantly improving accessibility. Physicians are shifting routine viscosupplementation procedures to outpatient settings for greater efficiency. Rising decentralization of orthopedic care and growing focus on day-care procedures are further accelerating growth.
- By Distribution Channel
On the basis of distribution channel, the market is segmented into direct tender and retail sales. The Direct Tender segment dominated the market with an estimated 65.70% share in 2025, driven by bulk procurement from government hospitals, public healthcare systems, and institutional buyers. This channel enables cost-effective purchasing, long-term supply stability, and standardized procurement across large hospital networks. It is particularly dominant in countries with strong public healthcare systems such as China and India. Hospitals prefer this channel due to predictable pricing and streamlined procurement processes. Government-led healthcare programs and centralized purchasing mechanisms continue to reinforce dominance. The segment remains the backbone of large-scale market distribution across Asia-Pacific.
The Retail Sales segment is expected to be the fastest-growing, registering a CAGR of 8.6% from 2026 to 2033, driven by expanding private orthopedic clinics, specialty centers, and decentralized healthcare delivery models. Increasing patient access to outpatient care is strengthening direct-to-clinic product flow. Improved pharmaceutical distribution networks are enhancing product availability across urban and semi-urban regions. Rising private healthcare spending and medical tourism are further contributing to growth. The shift toward patient-centric, convenience-driven treatment pathways is accelerating retail channel expansion across the region.
Asia-Pacific Viscosupplementation Market Regional Analysis
China dominated the Asia-Pacific viscosupplementation market with the largest revenue share of 35.40% in 2025, supported by a high osteoarthritis burden, large aging population, and expanding orthopedic care infrastructure. The country also benefits from increasing adoption of hyaluronic acid-based injections as a preferred non-surgical treatment option for knee osteoarthritis, particularly in outpatient hospital settings. Rising healthcare expenditure, improved access to advanced orthopedic therapies, and growing awareness of joint preservation treatments are further strengthening market penetration. Expansion of large hospital networks and increasing procedural volumes in tier-1 and tier-2 cities continue to support China’s leadership position in the Asia-Pacific viscosupplementation market.
The China Viscosupplementation Market Insight
The China viscosupplementation market is witnessing rapid growth due to a high burden of osteoarthritis, a large aging population, and strong expansion of orthopedic care infrastructure across urban and tier-2 cities. Increasing adoption of hyaluronic acid injections as a preferred non-surgical treatment option is significantly supporting market demand in hospitals and specialty orthopedic clinics. The country also benefits from rising healthcare investments, improved access to advanced joint care therapies, and growing awareness of early-stage osteoarthritis management. Expansion of large hospital networks and increasing outpatient procedures are further strengthening China’s dominance in the Asia-Pacific viscosupplementation market.
Japan Viscosupplementation Market Insight
The Japan viscosupplementation market is witnessing steady growth due to one of the highest aging populations globally and strong prevalence of knee osteoarthritis among elderly patients. The country has well-established acceptance of hyaluronic acid-based injections as a standard non-surgical treatment for joint pain management. Increasing integration of advanced formulations, including high molecular weight viscosupplements, is further supporting clinical adoption. Strong healthcare infrastructure, high patient awareness, and focus on maintaining mobility in aging populations continue to drive market growth. In addition, Japan’s emphasis on preventive healthcare and reduced surgical dependency is further reinforcing viscosupplementation demand.
India Viscosupplementation Market Insight
The India viscosupplementation market is witnessing rapid growth due to rising osteoarthritis cases, increasing geriatric population, and improving access to orthopedic care across urban and semi-urban regions. Growing awareness of non-surgical treatment options and increasing affordability of hyaluronic acid injections are driving adoption across private hospitals and specialty clinics. Expansion of orthopedic chains and ambulatory care centers is further improving treatment accessibility. Rising lifestyle-related joint disorders and increasing sports injuries are also contributing to higher demand. Strengthening healthcare infrastructure and growing patient preference for cost-effective pain management therapies are positioning India as one of the fastest-growing markets in the region.
South Korea Viscosupplementation Market Insight
The South Korea viscosupplementation market is witnessing steady growth due to rising prevalence of osteoarthritis, increasing aging population, and strong adoption of advanced orthopedic treatment technologies across hospitals and specialty clinics. The country benefits from a highly developed healthcare system, high patient awareness, and early adoption of minimally invasive procedures such as hyaluronic acid injections for knee osteoarthritis. Growing preference for non-surgical pain management solutions and increasing focus on maintaining mobility in elderly populations are further supporting market expansion. In addition, continuous advancements in formulation technologies and strong penetration of private healthcare providers are enhancing treatment accessibility and clinical adoption. Rising emphasis on outpatient orthopedic care and preventive joint health management continues to strengthen South Korea’s position in the Asia-Pacific viscosupplementation market.
Asia-Pacific Viscosupplementation Market Share
The Asia-Pacific viscosupplementation industry is primarily led by well-established companies, including:
- Sanofi (France)
- Fidia Farmaceutici S.p.A. (Italy)
- Anika Therapeutics, Inc. (U.S.)
- Seikagaku Corporation (Japan)
- LG Chem, Ltd. (South Korea)
- Shandong Haohai Biological Technology Co., Ltd. (China)
- Meiji Seika Pharma Co., Ltd. (Japan)
- Daiichi Sankyo Company, Limited (Japan)
- Chugai Pharmaceutical Co., Ltd. (Japan)
- Kyowa Kirin Co., Ltd. (Japan)
- Teva Pharmaceutical Industries Ltd. (Israel)
- Zimmer Biomet (U.S.)
- Johnson & Johnson Services, Inc. (U.S.)
- Bioventus Inc. (U.S.)
- Hyaltech Ltd. (U.K.)
- Contura International A/S (Denmark)
- Smith & Nephew (U.K.)
- Rottapharm Madaus S.p.A. (Italy)
- Arthrex, Inc. (U.S.)
- Bausch Health (Canada)
Latest Developments in Asia-Pacific Viscosupplementation Market
- In March 2024, Seikagaku Corporation (Japan), a leading manufacturer of glycosaminoglycan-based pharmaceuticals, announced the continued expansion and clinical adoption support of its hyaluronic acid viscosupplement SUPARTZ FX in Japan and international markets. The company highlighted growing utilization of its intra-articular knee osteoarthritis treatment across orthopedic clinics due to its long-standing clinical efficacy and safety profile. This development reflects the strengthening demand for HA-based viscosupplementation in aging populations across Asia-Pacific
- In June 2023, LG Chem (South Korea), a major life sciences company, advanced the commercialization and expansion of its hyaluronic acid joint injection portfolio, including Hyruan One, targeting increasing demand for osteoarthritis treatment in Asian markets. The company emphasized broader distribution in domestic and regional healthcare systems to address rising joint disorder cases. This reflects South Korea’s growing role in advanced viscosupplementation manufacturing and adoption
- In September 2022, Haohai Biological Technology (China), a key player in ophthalmic and orthopedic biomaterials, announced expansion of its hyaluronic acid injection product applications in domestic orthopedic treatment markets. The company’s HA-based injectable products continued to gain traction in knee osteoarthritis management across Chinese hospitals due to increasing demand for minimally invasive therapies. This highlights China’s strengthening domestic supply chain in viscosupplementation products
- In May 2022, Fidia Farmaceutici (Italy), a global leader in hyaluronic acid-based therapies, expanded its distribution partnerships across Asia-Pacific markets to strengthen access to Hyalgan viscosupplementation products. The company focused on increasing availability in orthopedic clinics across emerging Asian economies where osteoarthritis prevalence is rising. This expansion reflects growing regional demand for established HA injection therapies
- In July 2021, Sanofi (France), through its Genzyme division, continued strengthening the availability and clinical use of Synvisc (hylan G-F 20) across Asia-Pacific markets, particularly in India and Southeast Asia through regional healthcare distribution channels. The therapy remained widely used for knee osteoarthritis management in patients seeking non-surgical pain relief options. This underscores the continued reliance on established viscosupplement brands in developing APAC healthcare systems
SKU-

- Interactive Data Analysis Dashboard
- Company Analysis Dashboard for high growth potential opportunities
- Research Analyst Access for customization & queries
- Competitor Analysis with Interactive dashboard
- Latest News, Updates & Trend analysis
- Harness the Power of Benchmark Analysis for Comprehensive Competitor Tracking
Data collection and base year analysis are done using data collection modules with large sample sizes. The stage includes obtaining market information or related data through various sources and strategies. It includes examining and planning all the data acquired from the past in advance. It likewise envelops the examination of information inconsistencies seen across different information sources. The market data is analysed and estimated using market statistical and coherent models. Also, market share analysis and key trend analysis are the major success factors in the market report. To know more, please request an analyst call or drop down your inquiry.
The key research methodology used by DBMR research team is data triangulation which involves data mining, analysis of the impact of data variables on the market and primary (industry expert) validation. Data models include Vendor Positioning Grid, Market Time Line Analysis, Market Overview and Guide, Company Positioning Grid, Patent Analysis, Pricing Analysis, Company Market Share Analysis, Standards of Measurement, Global versus Regional and Vendor Share Analysis. To know more about the research methodology, drop in an inquiry to speak to our industry experts.
Data Bridge Market Research is a leader in advanced formative research. We take pride in servicing our existing and new customers with data and analysis that match and suits their goal. The report can be customized to include price trend analysis of target brands understanding the market for additional countries (ask for the list of countries), clinical trial results data, literature review, refurbished market and product base analysis. Market analysis of target competitors can be analyzed from technology-based analysis to market portfolio strategies. We can add as many competitors that you require data about in the format and data style you are looking for. Our team of analysts can also provide you data in crude raw excel files pivot tables (Fact book) or can assist you in creating presentations from the data sets available in the report.


