
Asia Pacific Wearable Devices In Sports Market
Market Size in USD Billion
 USD
5.58 Billion
USD
23.36 Billion
2025
2033
USD
5.58 Billion
USD
23.36 Billion
2025
2033
| 2026 - 2033 | |
| USD 5.58 Billion | |
| USD 23.36 Billion | |
| % | |
|
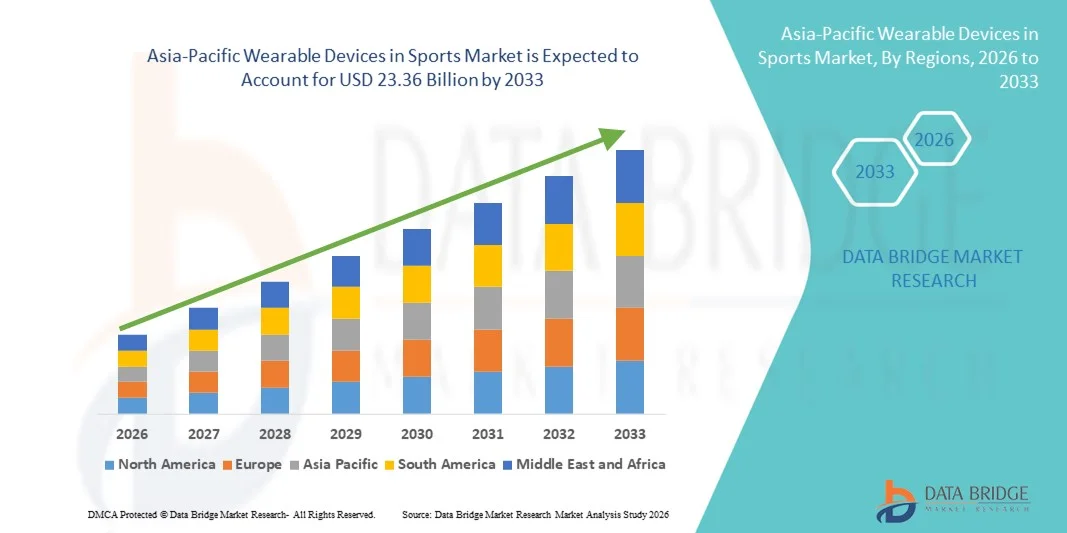
Asia-Pacific Wearable Devices in Sports Market Size
- The Asia-Pacific wearable devices in sports market size was valued at USD 5.58 billion in 2025 and is expected to reach USD 23.36 billion by 2033, at a CAGR of 19.6% during the forecast period
- The market growth is primarily driven by the rising participation in sports and fitness activities, along with increasing awareness of performance optimization and health monitoring through advanced wearable technologies across professional and amateur athletes
- Moreover, growing adoption of smart sensors, AI-enabled analytics, and real-time performance tracking by sports organizations, fitness centers, and consumers is positioning wearable sports devices as essential tools for training, injury prevention, and performance enhancement, thereby significantly accelerating overall market growth
Asia-Pacific Wearable Devices in Sports Market Analysis
- Wearable devices in sports, enabling digital tracking of physical activity, health metrics, and athletic performance, are becoming increasingly essential across the Asia-Pacific region in both professional and recreational sports settings due to their ability to deliver real-time insights, performance optimization, and data-driven training support
- The rising demand for wearable sports devices is primarily driven by increasing health and fitness awareness, growing participation in sports and physical activities, and expanding adoption of connected fitness technologies supported by smartphones and digital platforms
- China dominated the Asia-Pacific wearable devices in sports market with a revenue share of 38.6% in 2025, supported by its large consumer base, strong domestic manufacturing ecosystem, rapid adoption of smart fitness technologies, and widespread use of fitness & heart rate monitors across urban populations and professional sports environments
- India is expected to be the fastest growing country during the forecast period due to rising disposable incomes, an expanding youth population, increasing sports participation, and growing penetration of affordable wearable fitness devices
- Fitness & heart rate monitors dominated the Asia-Pacific wearable devices in sports market with a market share of 41.3% in 2025, driven by strong demand for heart rate monitoring, calorie burnt tracking, and step count applications, along with their ease of use for both amateur users and professional athletes
Report Scope and Asia-Pacific Wearable Devices in Sports Market Segmentation
|
Attributes |
Asia-Pacific Wearable Devices in Sports Key Market Insights |
|
Segments Covered |
|
|
Countries Covered |
Asia-Pacific
|
|
Key Market Players |
|
|
Market Opportunities |
|
|
Value Added Data Infosets |
In addition to the insights on market scenarios such as market value, growth rate, segmentation, geographical coverage, and major players, the market reports curated by the Data Bridge Market Research also include in-depth expert analysis, patient epidemiology, pipeline analysis, pricing analysis, and regulatory framework |
Asia-Pacific Wearable Devices in Sports Market Trends
“AI-Driven Performance Analytics and Connected Sports Ecosystems”
- A major and rapidly strengthening trend in the Asia-Pacific wearable devices in sports market is the integration of artificial intelligence (AI), data analytics, and cloud connectivity to deliver personalized performance insights and real-time health monitoring for athletes and fitness enthusiasts
- For instance, wearable sports devices from brands such as Xiaomi and Huawei integrate AI-based algorithms to analyze heart rate variability, activity intensity, and recovery patterns, enabling users to optimize training and reduce injury risks
- AI integration in sports wearables enables features such as adaptive training recommendations, anomaly detection in biometric data, and predictive insights related to fatigue and performance decline. For instance, advanced fitness & heart rate monitors can provide intelligent alerts when abnormal heart rate patterns are detected during workouts
- The seamless integration of wearable sports devices with mobile applications and digital fitness platforms allows centralized access to performance data, training history, and health metrics through a single interface, supporting a more connected and data-driven fitness experience
- This shift toward intelligent, connected, and analytics-driven sports wearables is reshaping user expectations across both professional sports and recreational fitness, encouraging manufacturers to continuously innovate with AI-enabled sensors and software capabilities
- The growing use of wearable devices by professional sports teams, coaches, and training academies for performance benchmarking and injury prevention is further reinforcing the adoption of advanced sports wearables
- In addition, the expansion of online fitness communities and subscription-based coaching platforms is amplifying demand for wearables that support data sharing, remote training, and real-time performance feedback
Asia-Pacific Wearable Devices in Sports Market Dynamics
Driver
“Rising Health Awareness and Increasing Participation in Sports Activities”
- The growing awareness of health, fitness, and preventive wellness, combined with rising participation in professional and recreational sports across Asia-Pacific countries, is a key driver fueling demand for wearable devices in sports
- For instance, government-led fitness initiatives and expanding sports leagues in countries such as China and India are encouraging individuals to adopt wearable devices for tracking physical activity, heart rate, and overall performance
- As consumers become more focused on maintaining active lifestyles and monitoring health indicators, wearable sports devices offer valuable features such as real-time tracking, performance analytics, and long-term health insights
- Furthermore, the increasing penetration of smartphones and digital fitness platforms is making wearable sports devices more accessible and easier to integrate into daily routines, strengthening adoption across diverse age groups
- The convenience of continuous monitoring, personalized feedback, and data-driven training support is accelerating the adoption of wearable devices in sports across both urban and semi-urban markets within the Asia-Pacific region
- Rising disposable incomes and improving affordability of entry-level wearable devices are enabling broader consumer adoption, particularly among younger populations
- The growing influence of fitness influencers, digital health campaigns, and sports events is also motivating consumers to invest in wearable sports technologies
Restraint/Challenge
“Data Privacy Concerns and High Cost of Advanced Wearable Technologies”
- Concerns related to data privacy and security pose a notable challenge to the widespread adoption of wearable devices in sports, as these devices collect sensitive personal and health-related information
- For instance, increasing reports of data breaches and misuse of personal fitness data have raised concerns among consumers regarding how wearable device manufacturers store, process, and share user information
- Addressing these concerns through strong data encryption, transparent privacy policies, and compliance with regional data protection regulations is essential to building consumer trust and confidence
- In addition, the relatively high cost of advanced wearable sports devices with AI-enabled analytics and specialized sensors can limit adoption among price-sensitive consumers in emerging Asia-Pacific markets
- While affordability is improving with the availability of basic fitness trackers, premium wearable devices offering advanced features may still face adoption barriers, making cost optimization and value-focused innovation critical for long-term market growth
- Limited battery life and the need for frequent charging can reduce user convenience, especially for continuous performance and sleep tracking applications
- Moreover, a lack of standardization across devices and platforms can hinder interoperability and data consistency, creating challenges for users seeking integrated sports and health monitoring solutions
Asia-Pacific Wearable Devices in Sports Market Scope
The market is segmented on the basis of component, product type, site, application, end user, and distribution channel.
- By Component
On the basis of component, the Asia-Pacific wearable devices in sports market is segmented into hardware and software. The hardware segment dominated the market in 2025, driven by the high demand for physical devices such as fitness trackers, heart rate monitors, pedometers, and sensor-enabled sports equipment. Hardware components form the foundation of wearable sports solutions, as they are responsible for data collection related to movement, biometrics, and physiological performance. Increasing affordability of sensor technology and large-scale manufacturing capabilities in countries such as China have further strengthened hardware adoption. In addition, consumers typically prioritize device accuracy, durability, and comfort, reinforcing the dominance of hardware in overall market revenue.
The software segment is expected to register the fastest growth rate from 2026 to 2033, fueled by rising adoption of AI-driven analytics, cloud-based platforms, and mobile fitness applications. Software solutions enable advanced data interpretation, personalized training insights, and long-term performance tracking, significantly enhancing the value of wearable devices. Growing integration of subscription-based fitness platforms and digital coaching services is accelerating software demand. Moreover, continuous updates and feature enhancements make software a recurring revenue stream, supporting its rapid growth trajectory.
- By Product Type
On the basis of product type, the market is segmented into pedometers, fitness & heart rate monitors, smart fabrics, smart cameras, shot trackers, and others. The fitness & heart rate monitors segment dominated the market in 2025 with a market share of 41.3%, owing to their widespread use among both amateur users and professional athletes. These devices provide essential metrics such as heart rate, calorie burnt, activity intensity, and endurance levels, making them suitable for a broad consumer base. Their compatibility with smartphones and fitness apps has further boosted adoption. In addition, increasing awareness of cardiovascular health across Asia-Pacific countries has reinforced strong demand for fitness and heart rate monitoring devices.
The smart fabrics segment is projected to be the fastest growing during the forecast period, driven by rising adoption in professional sports and performance-focused training environments. Smart fabrics integrate sensors directly into clothing, enabling continuous and non-intrusive monitoring of muscle activity, posture, and movement efficiency. Growing investments in sports science and wearable innovation are accelerating product development in this segment. As technology matures and production costs decline, smart fabrics are expected to gain wider commercial adoption.
- By Site
On the basis of site, the Asia-Pacific wearable devices in sports market is segmented into headband, handheld, arm & wrist, clip, shoe sensor, and others. The arm & wrist segment dominated the market in 2025, supported by the popularity of wrist-worn fitness bands and smart sports watches. These devices offer ease of use, high comfort, and continuous monitoring, making them suitable for daily wear and sports activities. Their ability to track multiple parameters such as step counts, heart rate, and sleep patterns contributes to strong consumer preference. Moreover, frequent product launches and design enhancements have reinforced the dominance of this segment.
The shoe sensor segment is expected to witness the fastest growth rate from 2026 to 2033, driven by its increasing adoption in performance-centric sports such as running, football, and basketball. Shoe sensors provide precise data on stride length, foot pressure, and movement dynamics, offering valuable insights for performance improvement and injury prevention. Growing use by professional athletes and sports training centers is accelerating demand. Advancements in miniaturization and wireless connectivity are further supporting segment growth.
- By Application
On the basis of application, the market is segmented into step counts, calorie burnt, heart rate monitoring, sleep tracking, and others. The heart rate monitoring segment dominated the market in 2025, as heart rate is a critical indicator for fitness performance, endurance, and overall health assessment. Wearable sports devices offering real-time heart rate tracking are widely used during workouts, training sessions, and competitive sports. Increasing prevalence of lifestyle-related health concerns has further strengthened demand. Integration with AI-based alerts and performance analytics also contributes to the segment’s leadership position.
The sleep tracking segment is anticipated to be the fastest growing during the forecast period, driven by rising awareness of recovery, rest, and overall wellness among athletes and fitness-conscious consumers. Sleep quality data is increasingly used to optimize training schedules and prevent fatigue-related injuries. Wearable devices offering advanced sleep stage analysis are gaining traction across Asia-Pacific markets. The growing focus on holistic health management is expected to further accelerate adoption.
- By End User
On the basis of end user, the market is segmented into sports centers, fitness centers, homecare settings, and others. The homecare settings segment dominated the market in 2025, driven by the growing adoption of wearable sports devices for personal fitness, home workouts, and self-monitoring. Consumers increasingly prefer tracking their activity levels and health metrics independently, supported by mobile apps and online fitness programs. The rise of at-home training routines has further strengthened demand. Affordable wearable devices and ease of use have made homecare settings the largest end-user segment.
The sports centers segment is expected to grow at the fastest rate during the forecast period, fueled by increasing use of wearables for performance analysis, athlete monitoring, and injury prevention. Professional sports organizations and training academies are integrating wearable technology into structured coaching programs. Data-driven training methods are becoming standard practice, accelerating adoption. Growing investments in sports infrastructure across Asia-Pacific countries further support rapid growth in this segment.
- By Distribution Channel
On the basis of distribution channel, the market is segmented into independent retail stores, hypermarkets/supermarkets, brand stores, and online sale channels. The online sale channel dominated the market in 2025, supported by the rapid expansion of e-commerce platforms and direct-to-consumer sales models. Online channels offer a wide product range, competitive pricing, and easy access to product information and reviews. Increased smartphone and internet penetration across Asia-Pacific countries has further strengthened online sales. Promotional discounts and digital marketing strategies have also contributed to channel dominance.
The brand store segment is projected to be the fastest growing from 2026 to 2033, driven by increasing consumer preference for authentic products, hands-on experience, and after-sales support. Brand stores allow manufacturers to showcase advanced features and educate consumers on device usage. Growing brand awareness and premium positioning of sports wearables are accelerating footfall in exclusive stores. Expansion of brand-owned outlets in urban centers is expected to sustain high growth rates.
Asia-Pacific Wearable Devices in Sports Market Regional Analysis
- China dominated the Asia-Pacific wearable devices in sports market with a revenue share of 38.6% in 2025, supported by its large consumer base, strong domestic manufacturing ecosystem, rapid adoption of smart fitness technologies, and widespread use of fitness & heart rate monitors across urban populations and professional sports environments
- Consumers in China increasingly value real-time performance tracking, heart rate monitoring, and activity analytics offered by wearable sports devices, supporting widespread adoption across fitness enthusiasts, amateur users, and professional athletes
- This strong market position is further supported by rising disposable incomes, rapid urbanization, extensive smartphone penetration, and the availability of cost-effective wearable devices from local and international brands, establishing China as the leading hub for sports wearable adoption in the region
The China Wearable Devices in Sports Market Insight
China wearable devices in sports market captured the largest revenue share within Asia-Pacific in 2025, fueled by a massive consumer base, strong domestic manufacturing capabilities, and rapid adoption of fitness and performance-tracking technologies. Consumers are increasingly prioritizing health monitoring, sports performance optimization, and data-driven training through wearable devices. The widespread availability of affordable fitness & heart rate monitors, combined with strong smartphone penetration and AI-enabled ecosystems, continues to propel market growth. Moreover, the presence of leading domestic brands and integration with digital fitness platforms are significantly contributing to the expansion of the sports wearables market in China.
Japan Wearable Devices in Sports Market Insight
The Japan wearable devices in sports market is anticipated to grow at a notable CAGR during the forecast period, supported by the country’s advanced technological ecosystem and strong focus on precision health monitoring. Japanese consumers place high importance on accuracy, reliability, and seamless integration of wearable devices with digital platforms. The adoption of sports wearables is driven by increasing engagement in fitness activities and the growing use of connected devices for performance tracking. Furthermore, Japan’s aging population is encouraging demand for wearable solutions that support health monitoring, injury prevention, and recovery management in both recreational and professional sports settings.
India Wearable Devices in Sports Market Insight
The India wearable devices in sports market accounted for a significant revenue share in Asia-Pacific in 2025, driven by rapid urbanization, a large youth population, and increasing participation in sports and fitness activities. The growing popularity of affordable fitness trackers and heart rate monitors is accelerating adoption across homecare settings and fitness centers. Rising disposable incomes, expanding digital payment ecosystems, and strong penetration of online sales channels are further supporting market growth. Government initiatives promoting fitness, sports development, and digital health are also playing a key role in driving demand for sports wearable devices in India.
Australia Wearable Devices in Sports Market Insight
The Australia wearable devices in sports market is experiencing steady growth, supported by high health consciousness, strong participation in outdoor sports, and widespread adoption of fitness technologies. Consumers increasingly use wearable devices to monitor activity levels, heart rate, and recovery performance across both professional and recreational sports. The presence of well-established fitness centers and sports training facilities is driving demand for advanced performance-tracking wearables. In addition, the integration of wearable devices with mobile health applications and digital coaching platforms is further strengthening market expansion in Australia.
Asia-Pacific Wearable Devices in Sports Market Share
The Asia-Pacific Wearable Devices in Sports industry is primarily led by well-established companies, including:
- Apple Inc. (U.S.)
- Samsung Electronics Co., Ltd. (South Korea)
- Garmin Ltd. (Switzerland)
- Xiaomi Corporation (China)
- Huawei Technologies Co., Ltd. (China)
- Polar Electro Oy (Finland)
- Suunto Oy (Finland)
- Zepp Health Corporation (China)
- Withings SA (France)
- Omron Corporation (Japan)
- Casio Computer Co., Ltd. (Japan)
- Sony Group Corporation (Japan)
- GOQii Inc (U.S.)
- NOISE MOGULS, LLC (U.S.)
- boAt Lifestyle Ltd (India)
- Acer Incorporated (Taiwan)
- Panasonic Holdings Corporation (Japan)
- Fujitsu Limited (Japan)
- LG Electronics Inc. (South Korea)
- HTC Corporation (Taiwan)
What are the Recent Developments in Asia-Pacific Wearable Devices in Sports Market?
- In January 2026, tennis star Aryna Sabalenka publicly criticized the banning of wrist-worn fitness trackers at the Australian Open, drawing attention to how athletes in Asia-Pacific and globally are using wearable sports devices such as Whoop and others to track performance metrics even amid regulatory challenges
- In October 2025, Indian wearable technology firms announced efforts to expand into international markets and premium segments as domestic wearable sales softened, reflecting strategic shifts by Asia-Pacific manufacturers toward higher-end sports and fitness wearables globally
- In September 2025, at Meta Connect 2025, Meta highlighted a suite of next-generation wearable tech including Oakley Meta Vanguard sport glasses with fitness app integrations (such as Strava), showing growing convergence between smart wearables and sports performance tracking platforms relevant to APAC audiences
- In May 2025, US-based wearable brand Whoop launched its advanced Whoop 5.0 and Whoop MG devices, featuring extended battery life, ECG heart screening, and blood pressure insights to deliver deeper health and performance tracking for users, highlighting enhanced sensor and analytics capabilities relevant to Asia-Pacific fitness and sports consumers
- In June 2023, Wearable Devices Ltd. announced an Asia-Pacific Technology Showcase to expand partnerships in Japan, Taiwan, and China for its AI-enabled Mudra wearable sensing technology, underlining cross-border collaboration and innovation in gesture-based wearables with potential sports applications
SKU-

- Interactive Data Analysis Dashboard
- Company Analysis Dashboard for high growth potential opportunities
- Research Analyst Access for customization & queries
- Competitor Analysis with Interactive dashboard
- Latest News, Updates & Trend analysis
- Harness the Power of Benchmark Analysis for Comprehensive Competitor Tracking
Data collection and base year analysis are done using data collection modules with large sample sizes. The stage includes obtaining market information or related data through various sources and strategies. It includes examining and planning all the data acquired from the past in advance. It likewise envelops the examination of information inconsistencies seen across different information sources. The market data is analysed and estimated using market statistical and coherent models. Also, market share analysis and key trend analysis are the major success factors in the market report. To know more, please request an analyst call or drop down your inquiry.
The key research methodology used by DBMR research team is data triangulation which involves data mining, analysis of the impact of data variables on the market and primary (industry expert) validation. Data models include Vendor Positioning Grid, Market Time Line Analysis, Market Overview and Guide, Company Positioning Grid, Patent Analysis, Pricing Analysis, Company Market Share Analysis, Standards of Measurement, Global versus Regional and Vendor Share Analysis. To know more about the research methodology, drop in an inquiry to speak to our industry experts.
Data Bridge Market Research is a leader in advanced formative research. We take pride in servicing our existing and new customers with data and analysis that match and suits their goal. The report can be customized to include price trend analysis of target brands understanding the market for additional countries (ask for the list of countries), clinical trial results data, literature review, refurbished market and product base analysis. Market analysis of target competitors can be analyzed from technology-based analysis to market portfolio strategies. We can add as many competitors that you require data about in the format and data style you are looking for. Our team of analysts can also provide you data in crude raw excel files pivot tables (Fact book) or can assist you in creating presentations from the data sets available in the report.


