
Asia Pacific Weight Loss And Obesity Management Market
Market Size in USD Million
 USD
5,983.74 Million
USD
12,632.55 Million
2021
2029
USD
5,983.74 Million
USD
12,632.55 Million
2021
2029
| 2022 - 2029 | |
| USD 5,983.74 Million | |
| USD 12,632.55 Million | |
| % | |
Market Analysis and Insights: Asia-Pacific Weight Loss and Obesity Management Market
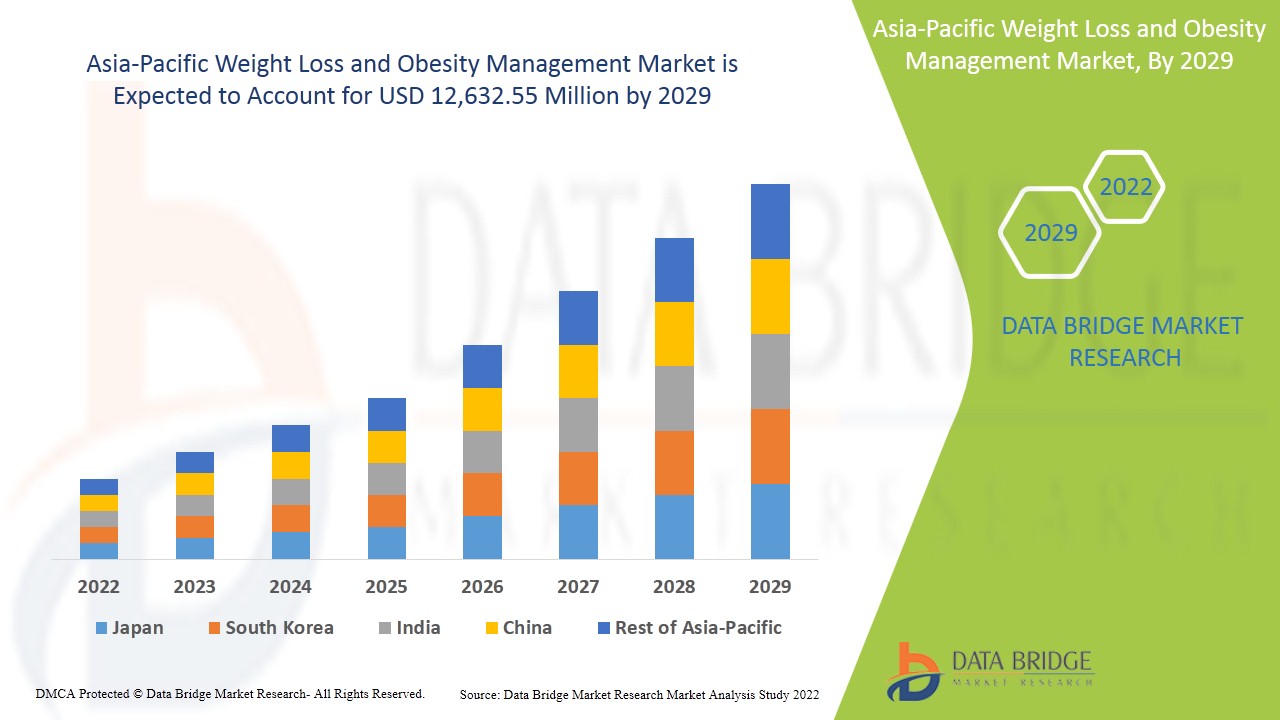
Asia-Pacific market is expected to grow in the forecast period of 2022 to 2029. Data Bridge Market Research analyses that the market is growing with a CAGR of 9.9% in the forecast period of 2022 to 2029 and is expected to reach USD 12,632.55 million by 2029 from USD 5,983.74 million in 2021. Rising demand for non-alcoholic drinks, including fruit juices and energy drinks, thus driving the Asia-Pacific Weight loss and obesity management market growth.
Obesity impacts the health of an individual in several ways, such as it may increase the risks of chronic diseases declining the life expectancy of individuals. Various diets, devices, and drugs are utilized with the purpose of controlling or reducing weight in obese individuals in these management programs. It is measured by Body Mass Index (BMI). Various methods used for management of weight loss & obesity are drugs, dietary supplements, weight loss surgery, and exercising. As per the World Health Organization (WHO) information, when the Body-Mass-Index is greater than/equal to 25, the person is categorized as overweight and Body Mass Index (BMI) above 30 is classified as obese.
The surge in the number of obesity cases among population Asia-Pacific is expected to drive the growth of weight loss and obesity management market. Increase in prevalence of chronic diseases, such as hypertension and diabetes, caused by rise in adoption of unhealthy and sedentary lifestyle patterns and surge in the number of bariatric surgeries are expected to accelerate the weight loss and obesity management market growth.
- In addition, increase in preference for junk food, physical inactivity, hectic routine, and growing stress are causing people to consume fast food, which will further influence the weight loss and obesity management market growth. Furthermore, growing adoption of online weight loss and weight management programs, government initiatives for creating awareness, and rise in disposable income in developing economies will positively affect the growth of the weight loss and obesity management market. Moreover, rise in the rate of childhood obesity and emerging nations extend profitable opportunities to the weight loss and obesity management market.
The Asia-Pacific weight loss and obesity management market report provides details of market share, new developments, and product pipeline analysis, the impact of domestic and localized market players, analyses opportunities in terms of emerging revenue pockets, changes in market regulations, product approvals, strategic decisions, product launches, geographic expansions, and technological innovations in the market. To understand the analysis and the Asia-Pacific weight loss and obesity management market scenario, contact Data Bridge Market Research for an Analyst Brief; our team will help you create a revenue impact solution to achieve your desired goal.
Asia-Pacific Weight Loss and Obesity Management Market Scope and Market Size
Asia-Pacific weight loss and obesity management market is segmented into six notable segments based on product type, product form, nature, category, end user demography and distribution channel. The growth among segments helps you analyze niche pockets of growth and strategies to approach the market and determine your core application areas and the difference in your target markets.
- On the basis of product type, the Asia-Pacific weight loss and obesity management market is segmented into dietary supplements and meal replacements. In 2022, dietary supplements segment is expected to dominate the market due to increasing obese population, rising consumer awareness regarding low-calorie food and beverages in developing economies.
- On the basis of product form, the Asia-Pacific weight loss and obesity management market is segmented into the soft gels, tablets, capsule, powders, gummies & jellies, premixes, liquids, and others. In 2022, powder segment is expected to dominate the market due to easy to use nature of powder form as compared to other forms of weight loss and obesity management.
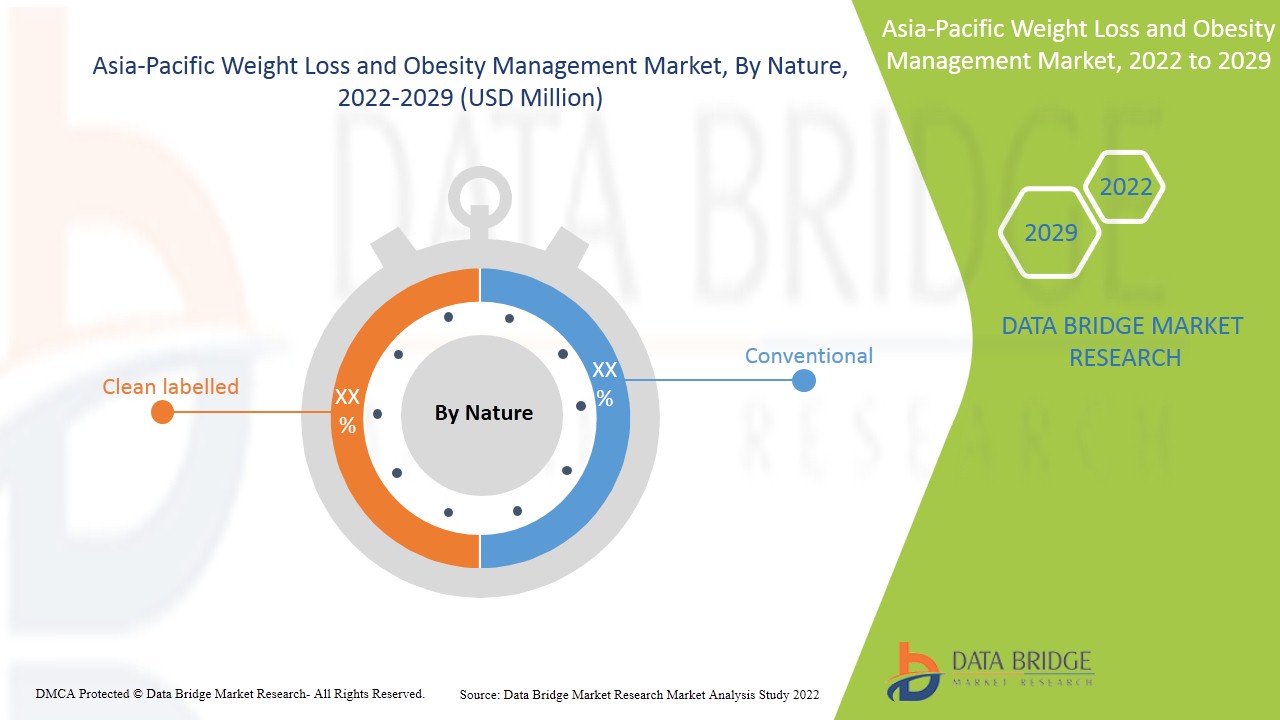
- On the basis of nature, the Asia-Pacific weight loss and obesity management market is segmented into the conventional and clean labelled. In 2022, conventional segment is expected to dominate the market due to growing demand for organic, naturally grown products.
- On the basis of category, the Asia-Pacific weight loss and obesity management market is segmented into prescribed and over the counter (OTC). In 2022, Over the Counter (OTC) segment is expected to dominate the market due to growing popularity of OTCs for weight loss and obesity management.
- On the basis of end user, the Asia-Pacific weight loss and obesity management market is segmented into under 18 years, 18 to 35 years, 35 to 50 years, and above 50 years. In 2022, 18 To 35 years segment is expected to dominate the market due to rise in the rate of childhood obesity.
- On the basis of distribution channel, the Asia-Pacific weight loss and obesity management market is segmented into the store based and non-stored based. In 2022, non-stored based segment is expected to dominate the market due to emerging COVID-19 pandemic.
- Based on geography, the weight loss and obesity management market is segmented into five geographical regions, five regions, North America, Europe, Asia-Pacific, South America, and Middle East and Africa. The regions are further segmented into major countries such as the India, Australia, Singapore, Thailand, Malaysia, Indonesia, Philippines, rest of Asia-Pacific. In 2022, the Japan is expected to dominate the market due to rising disposable incomes coupled with changing lifestyles due to rapid urbanization.
Asia-Pacific Weight Loss and Obesity Management Market Country Level Analysis
Asia-Pacific weight loss and obesity management market is segmented into six notable segments based on product type, product form, nature, category, end user demography and distribution channel.
The countries covered in the Asia-Pacific weight loss and obesity management market report are the Japan, China, South Korea, India, Australia, Singapore, Malaysia, Thailand, Indonesia, Philippines and Rest of Asia-Pacific.
The type segment in the Asia-Pacific region is expected to grow with the highest growth rate in the forecast period of 2022 to 2029 because of growth in investments & collaborations in weight loss and obesity management business. The product type segment in Japan dominates the Asia-Pacific market owing to rising disposable incomes coupled with changing lifestyles due to rapid urbanization.
The country section of the report also provides individual market impacting factors and changes in market regulation that impact the current and future trends of the market. Data points such as new sales, replacement sales, country demographics, regulatory acts, and import-export tariffs are some of the major pointers used to forecast the market scenario for individual countries. Also, the presence and availability of Asia-Pacific brands and their challenges faced due to large or scarce competition from local and domestic brands, the impact of sales channels are considered while providing forecast analysis of the country data.
Growing Strategic Activities by Major Market Players to Enhance the Awareness for Weight Loss and Obesity Management Is Boosting the Market Growth of Asia-Pacific Weight Loss and Obesity Management Market
Asia-Pacific Weight loss and obesity management market also provides you with a detailed market analysis for every country's growth in a particular market. Additionally, it provides detailed information regarding the market players’ strategy and their geographical presence. The data is available for the historical period 2011 to 2020.
Competitive Landscape and Asia-Pacific Weight Loss and Obesity Management Market Share Analysis
Asia-Pacific weight loss and obesity management market competitive landscape provides details by the competitor. Details included are company overview, company financials, revenue generated, market potential, investment in research and development, new market initiatives, production sites and facilities, company strengths and weaknesses, product launch, product trials pipelines, product approvals, patents, product width, and breadth, application dominance, technology lifeline curve. The above data points are only related to the company’s focus on the Asia-Pacific weight loss and obesity management market.
Some of the major players operating in the Asia-Pacific Weight loss and obesity management market are Herbalife International of America, Inc., ABH Pharma Inc., Vitaco, Amway Corp., Stepan Company, GNC Holdings, LLC, GlaxoSmithKline plc., Glanbia PLC, Abbott, Shaklee Corporation, Nu Skin Enterprises, Atlantic Multipower UK Ltd., Nature's Sunshine Products, Inc., Ajinomoto Co., Inc., Bionova, DSM, American Health, Omega Protein Corporation, Integrated BioPharma, Inc., Bio-Tech Pharmacal, The Himalaya Drug Company, Pharmavite, Ricola, BLACKMORES, among others.
DBMR analysts understand competitive strengths and provide competitive analysis for each competitor separately.
Many product launches are also initiated by companies worldwide, which also accelerates the Asia-Pacific Weight loss and obesity management market.
For instance,
- In July 2021, according to Cision US Inc., Body Complete Rx (BCRX) launched their TRIM line, its exclusive plant-based, vegan weight management supplements at The Vitamin Shoppe. The supplement offer benefits such as improve energy, nutrition and helps in weight management.
- In October 2020, according to GlobeNewswire, Inc., Meticore launched new weight loss supplement for men and women. The supplement helps in boosting the metabolism as it helps in increasing the temperature of internal cells, which results in metabolism regeneration. The formula is made with the help of six superior quality plant-based nutrients and herbal extracts coupled with Meticore pills.
Collaboration, product launch, business expansion, award and recognition, joint ventures, and other strategies by the market player enhance the company's footprints in the Asia-Pacific Weight loss and obesity management market, which also benefits the organization’s profit growth.
SKU-

- Interactive Data Analysis Dashboard
- Company Analysis Dashboard for high growth potential opportunities
- Research Analyst Access for customization & queries
- Competitor Analysis with Interactive dashboard
- Latest News, Updates & Trend analysis
- Harness the Power of Benchmark Analysis for Comprehensive Competitor Tracking
Table of Content
1 INTRODUCTION
1.1 OBJECTIVES OF THE STUDY
1.2 MARKET DEFINITION
1.3 OVERVIEW OF ASIA-PACIFIC WEIGHT LOSS AND OBESITY MANAGEMENT MARKET
1.4 LIMITATIONS
1.5 MARKETS COVERED
2 MARKET SEGMENTATION
2.1 MARKETS COVERED
2.2 GEOGRAPHICAL SCOPE
2.3 YEARS CONSIDERED FOR THE STUDY
2.4 CURRENCY AND PRICING
2.5 DBMR TRIPOD DATA VALIDATION MODEL
2.6 MULTIVARIATE MODELLING
2.7 PRODUCT LIFELINE CURVE
2.8 PRIMARY INTERVIEWS WITH KEY OPINION LEADERS
2.9 DBMR MARKET POSITION GRID
2.1 VENDOR SHARE ANALYSIS
2.11 SECONDARY SOURCES
2.12 ASSUMPTIONS
3 EXECUTIVE SUMMARY
4 PREMIUM INSIGHTS
4.1 COMPARATIVE ANALYSIS (HERBAL SUPPLEMENTS VS SYNTHETIC SUPPLEMENTS)
4.2 PRICING ANALYSIS FOR WEIGHT LOSS & OBESITY MANAGEMENT SUPPLEMENTS-
4.3 VALUE CHAIN FOR ASIA-PACIFIC WEIGHT LOSS AND OBESITY MANAGEMENT MARKET
4.4 SUPPLY CHAIN OF ASIA-PACIFIC WEIGHT LOSS & OBESITY MANAGEMENT MARKET
4.5 BRAND COMPARATIVE ANALYSIS
4.6 CLEAN LABELED PRODUCT LAUNCHES
4.7 CONSUMER TRENDS
4.8 ASIA-PACIFIC WEIGHT LOSS AND OBESITY MANAGEMENT MARKET- GROWTH STRATEGIES ADOPTED BY KEY PLAYERS
4.9 ASIA-PACIFIC WEIGHT LOSS AND OBESITY MANAGEMENT MARKET- INDUSTRY TRENDS AND FUTURE PERSPECTIVES
5 ASIA-PACIFIC WEIGHT LOSS AND OBESITY MANAGEMENT MARKET- REGULATIONS
6 MARKET OVERVIEW
6.1 DRIVERS
6.1.1 INCREASING RATES IN CHRONIC DISEASES
6.1.2 INCREASING PREVALENCE OF OBESITY
6.1.3 INCREASE IN GERIATRIC POPULATION
6.1.4 INCREASING BARIATRIC SURGERIES
6.2 RESTRAINTS
6.2.1 STRINGENT RULES & REGULATIONS
6.2.2 HIGH COST ASSOCIATED WITH THE LOW-CALORIE DIETS
6.3 OPPORTUNITIES
6.3.1 RISING DISPOSABLE INCOME ENHANCING THE PURCHASING POWER OF RELATED WEIGHT LOSS PRODUCTS
6.3.2 GROWING CONSUMPTION OF PROCESSED FOOD
6.3.3 RISE IN STRATEGIC INITIATIVES BY MARKET PLAYERS
6.4 CHALLENGES
6.4.1 LACK OF AWARENESS IN LOWER INCOME COUNTRIES
6.4.2 INCREASE IN PRODUCT RECALL
7 IMPACT OF COVID-19 ON THE ASIA-PACIFIC WEIGHT LOSS AND OBESITY MANAGEMENT MARKET
7.1 AFTERMATH OF COVID-19
7.2 IMPACT ON DEMAND AND SUPPLY CHAIN
7.3 IMPACT ON PRICE
7.4 CONCLUSION
8 ASIA-PACIFIC WEIGHT LOSS AND OBESITY MANAGEMENT MARKET, BY PRODUCT TYPE
8.1 OVERVIEW
8.2 DIETARY SUPPLEMENTS
8.2.1 SUPPLEMENT TYPE
8.2.1.1 Herbal/Natural
8.2.1.2 Synthetic
8.2.2 ACTIVE INGREDIENT TYPE
8.2.2.1 Green Tea Extract
8.2.2.2 Chitosan
8.2.2.3 Pyruvate
8.2.2.4 Probiotics
8.2.2.5 Conjugated Linoleic Acid
8.2.2.6 Green Coffee Bean Extract
8.2.2.7 Caffeine
8.2.2.8 Chromium
8.2.2.9 Bitter Orange (Citrus Aurantium L.)
8.2.2.10 Carnitine
8.2.2.11 African Mango (Irvingia Gabonensis)
8.2.2.12 White Kidney Bean (Phaseolus Vulgaris)
8.2.2.13 Others
8.3 MEAL REPLACEMENTS
8.3.1 POWDERED MIXES
8.3.2 READY TO DRINK BEVERAGES/SHAKES
8.3.3 PROTEIN BARS
8.3.4 OTHERS
9 ASIA-PACIFIC WEIGHT LOSS AND OBESITY MANAGEMENT MARKET, BY PRODUCT FORM
9.1 OVERVIEW
9.2 POWDERS
9.3 CAPSULE
9.4 LIQUIDS
9.5 TABLETS
9.6 PREMIXES
9.7 SOFT GELS
9.8 GUMMIES & JELLIES
9.9 OTHERS
10 ASIA-PACIFIC WEIGHT LOSS AND OBESITY MANAGEMENT MARKET, BY DISTRIBUTION CHANNEL
10.1 OVERVIEW
10.2 STORE BASED
10.2.1 PHARMACIES
10.2.2 SPECIALTY STORES
10.2.3 HEALTH AND BEAUTY STORES
10.2.4 CONVENIENCE STORE
10.2.5 SUPERMARKET/HYPERMARKET
10.2.6 OTHERS
10.3 NON STORED BASED
10.3.1 ONLINE (THIRD PARTY ONLINE RETAILERS)
10.3.2 COMPANY OWNED WEBSITE
11 ASIA-PACIFIC WEIGHT LOSS AND OBESITY MANAGEMENT MARKET, BY END-USER DEMOGRAPHY
11.1 OVERVIEW
11.2 TO 35 YEARS
11.3 TO 50 YEARS
11.4 ABOVE 50 YEARS
11.5 UNDER 18 YEARS
12 ASIA-PACIFIC WEIGHT LOSS AND OBESITY MANAGEMENT MARKET, BY REGION
12.1 ASIA-PACIFIC
12.1.1 JAPAN
12.1.2 CHINA
12.1.3 INDIA
12.1.4 AUSTRALIA
12.1.5 SOUTH KOREA
12.1.6 MALAYSIA
12.1.7 THAILAND
12.1.8 SINGAPORE
12.1.9 INDONESIA
12.1.10 PHILIPPINES
12.1.11 REST OF ASIA-PACIFIC
13 ASIA-PACIFIC WEIGHT LOSS AND OBESITY MANAGEMENT MARKET: COMPANY LANDSCAPE
13.1 COMPANY SHARE ANALYSIS: ASIA-PACIFIC
14 QUESTIONNAIRE
15 RELATED REPORTS
List of Table
TABLE 1 MOST OBESE COUNTRIES OF ASIA-PACIFIC 2020
TABLE 2 ASIA-PACIFIC WEIGHT LOSS AND OBESITY MANAGEMENT MARKET, BY PRODUCT TYPE, 2020-2029 (USD MILLION)
TABLE 3 ASIA-PACIFIC DIETARY SUPPLEMENTS IN WEIGHT LOSS AND OBESITY MANAGEMENT MARKET, BY REGION, 2020-2029 (USD MILLION)
TABLE 4 ASIA-PACIFIC DIETARY SUPPLEMENTS IN WEIGHT LOSS AND OBESITY MANAGEMENT MARKET, BY SUPPLEMENT TYPE, 2020-2029 (USD MILLION)
TABLE 5 ASIA-PACIFIC DIETARY SUPPLEMENTS IN WEIGHT LOSS AND OBESITY MANAGEMENT MARKET, BY ACTIVE INGREDIENT TYPE, 2020-2029 (USD MILLION)
TABLE 6 ASIA-PACIFIC MEAL REPLACEMENTS IN WEIGHT LOSS AND OBESITY MANAGEMENT MARKET, BY COUNTRY, 2020-2029 (USD MILLION)
TABLE 7 ASIA-PACIFIC MEAL REPLACEMENTS IN WEIGHT LOSS AND OBESITY MANAGEMENT MARKET, BY PRODUCT TYPE, 2020-2029 (USD MILLION)
TABLE 8 ASIA-PACIFIC WEIGHT LOSS AND OBESITY MANAGEMENT MARKET, BY PRODUCT FORM, 2020-2029 (USD MILLION)
TABLE 9 ASIA-PACIFIC POWDERS IN WEIGHT LOSS AND OBESITY MANAGEMENT MARKET, BY REGION, 2020-2029 (USD MILLION)
TABLE 10 ASIA-PACIFIC CAPSULE IN WEIGHT LOSS AND OBESITY MANAGEMENT MARKET, BY REGION, 2020-2029 (USD MILLION)
TABLE 11 ASIA-PACIFIC LIQUIDS IN WEIGHT LOSS AND OBESITY MANAGEMENT MARKET, BY REGION, 2020-2029 (USD MILLION)
TABLE 12 ASIA-PACIFIC TABLETS IN WEIGHT LOSS AND OBESITY MANAGEMENT MARKET, BY REGION, 2020-2029 (USD MILLION)
TABLE 13 ASIA-PACIFIC PREMIXES IN WEIGHT LOSS AND OBESITY MANAGEMENT MARKET, BY REGION, 2020-2029 (USD MILLION)
TABLE 14 ASIA-PACIFIC SOFT GELS IN WEIGHT LOSS AND OBESITY MANAGEMENT MARKET, BY REGION, 2020-2029 (USD MILLION)
TABLE 15 ASIA-PACIFIC GUMMIES & JELLIES IN WEIGHT LOSS AND OBESITY MANAGEMENT MARKET, BY REGION, 2020-2029 (USD MILLION)
TABLE 16 ASIA-PACIFIC OTHERS IN WEIGHT LOSS AND OBESITY MANAGEMENT MARKET, BY REGION, 2020-2029 (USD MILLION)
TABLE 17 ASIA-PACIFIC WEIGHT LOSS AND OBESITY MANAGEMENT MARKET, BY DISTRIBUTION CHANNEL, 2020-2029 (USD MILLION))
TABLE 18 ASIA-PACIFIC STORE BASED IN WEIGHT LOSS AND OBESITY MANAGEMENT MARKET, BY REGION, 2020-2029 (USD MILLION)
TABLE 19 ASIA-PACIFIC STORE BASED IN WEIGHT LOSS AND OBESITY MANAGEMENT MARKET, BY DISTRIBUTION CHANNEL, 2020-2029 (USD MILLION)
TABLE 20 ASIA-PACIFIC NON STORED BASED IN WEIGHT LOSS AND OBESITY MANAGEMENT MARKET, BY REGION, 2020-2029 (USD MILLION)
TABLE 21 ASIA-PACIFIC NON STORED BASED IN WEIGHT LOSS AND OBESITY MANAGEMENT MARKET, BY DISTRIBUTION CHANNEL, 2020-2029 (USD MILLION)
TABLE 22 ASIA-PACIFIC WEIGHT LOSS AND OBESITY MANAGEMENT MARKET, BY END-USER DEMOGRAPHY, 2020-2029 (USD MILLION)
TABLE 23 ASIA-PACIFIC 18 TO 35 YEARS IN WEIGHT LOSS AND OBESITY MANAGEMENT MARKET, BY REGION, 2020-2029 (USD MILLION)
TABLE 24 ASIA-PACIFIC 35 TO 50 YEARS IN WEIGHT LOSS AND OBESITY MANAGEMENT MARKET, BY REGION, 2020-2029 (USD MILLION)
TABLE 25 ASIA-PACIFIC ABOVE 50 YEARS IN WEIGHT LOSS AND OBESITY MANAGEMENT MARKET, BY REGION, 2020-2029 (USD MILLION)
TABLE 26 ASIA-PACIFIC UNDER 18 YEARS IN WEIGHT LOSS AND OBESITY MANAGEMENT MARKET, BY REGION, 2020-2029 (USD MILLION)
TABLE 27 ASIA-PACIFIC WEIGHT LOSS AND OBESITY MANAGEMENT MARKET, BY COUNTRY, 2020-2029 (USD MILLION)
TABLE 28 ASIA-PACIFIC WEIGHT LOSS AND OBESITY MANAGEMENT MARKET, BY PRODUCT TYPE, 2020-2029 (USD MILLION)
TABLE 29 ASIA-PACIFIC DIETARY SUPPLEMENTS IN WEIGHT LOSS AND OBESITY MANAGEMENT MARKET, BY SUPPLEMENT TYPE, 2020-2029 (USD MILLION)
TABLE 30 ASIA-PACIFIC DIETARY SUPPLEMENTS IN WEIGHT LOSS AND OBESITY MANAGEMENT MARKET, BY ACTIVE INGREDIENT TYPE, 2020-2029 (USD MILLION)
TABLE 31 ASIA-PACIFIC MEAL REPLACEMENTS IN WEIGHT LOSS AND OBESITY MANAGEMENT MARKET, BY PRODUCT TYPE, 2020-2029 (USD MILLION)
TABLE 32 ASIA-PACIFIC WEIGHT LOSS AND OBESITY MANAGEMENT MARKET, BY PRODUCT FORM, 2020-2029 (USD MILLION)
TABLE 33 ASIA-PACIFIC WEIGHT LOSS AND OBESITY MANAGEMENT MARKET, BY END-USER DEMOGRAPHY, 2020-2029 (USD MILLION)
TABLE 34 ASIA-PACIFIC WEIGHT LOSS AND OBESITY MANAGEMENT MARKET, BY DISTRIBUTION CHANNEL, 2020-2029 (USD MILLION)
TABLE 35 ASIA-PACIFIC STORE BASED IN WEIGHT LOSS AND OBESITY MANAGEMENT MARKET, BY DISTRIBUTION CHANNEL, 2020- 2029 (USD MILLION)
TABLE 36 ASIA-PACIFIC NON STORED BASED IN WEIGHT LOSS AND OBESITY MANAGEMENT MARKET, BY DISTRIBUTION CHANNEL, 2020- 2029 (USD MILLION)
TABLE 37 JAPAN WEIGHT LOSS AND OBESITY MANAGEMENT MARKET, BY PRODUCT TYPE, 2020-2029 (USD MILLION)
TABLE 38 JAPAN DIETARY SUPPLEMENTS IN WEIGHT LOSS AND OBESITY MANAGEMENT MARKET, BY SUPPLEMENT TYPE, 2020-2029 (USD MILLION)
TABLE 39 JAPAN DIETARY SUPPLEMENTS IN WEIGHT LOSS AND OBESITY MANAGEMENT MARKET, BY ACTIVE INGREDIENT TYPE, 2020-2029 (USD MILLION)
TABLE 40 JAPAN MEAL REPLACEMENTS IN WEIGHT LOSS AND OBESITY MANAGEMENT MARKET, BY PRODUCT TYPE, 2020-2029 (USD MILLION)
TABLE 41 JAPAN WEIGHT LOSS AND OBESITY MANAGEMENT MARKET, BY PRODUCT FORM, 2020-2029 (USD MILLION)
TABLE 42 JAPAN WEIGHT LOSS AND OBESITY MANAGEMENT MARKET, BY END-USER DEMOGRAPHY, 2020-2029 (USD MILLION)
TABLE 43 JAPAN WEIGHT LOSS AND OBESITY MANAGEMENT MARKET, BY DISTRIBUTION CHANNEL, 2020-2029 (USD MILLION)
TABLE 44 JAPAN STORE BASED IN WEIGHT LOSS AND OBESITY MANAGEMENT MARKET, BY DISTRIBUTION CHANNEL, 2020- 2029 (USD MILLION)
TABLE 45 JAPAN NON STORED BASED IN WEIGHT LOSS AND OBESITY MANAGEMENT MARKET, BY DISTRIBUTION CHANNEL, 2020- 2029 (USD MILLION)
TABLE 46 CHINA WEIGHT LOSS AND OBESITY MANAGEMENT MARKET, BY PRODUCT TYPE, 2020-2029 (USD MILLION)
TABLE 47 CHINA DIETARY SUPPLEMENTS IN WEIGHT LOSS AND OBESITY MANAGEMENT MARKET, BY SUPPLEMENT TYPE, 2020-2029 (USD MILLION)
TABLE 48 CHINA DIETARY SUPPLEMENTS IN WEIGHT LOSS AND OBESITY MANAGEMENT MARKET, BY ACTIVE INGREDIENT TYPE, 2020-2029 (USD MILLION)
TABLE 49 CHINA MEAL REPLACEMENTS IN WEIGHT LOSS AND OBESITY MANAGEMENT MARKET, BY PRODUCT TYPE, 2020-2029 (USD MILLION)
TABLE 50 CHINA WEIGHT LOSS AND OBESITY MANAGEMENT MARKET, BY PRODUCT FORM, 2020-2029 (USD MILLION)
TABLE 51 CHINA WEIGHT LOSS AND OBESITY MANAGEMENT MARKET, BY END-USER DEMOGRAPHY, 2020-2029 (USD MILLION)
TABLE 52 CHINA WEIGHT LOSS AND OBESITY MANAGEMENT MARKET, BY DISTRIBUTION CHANNEL, 2020-2029 (USD MILLION)
TABLE 53 CHINA STORE BASED IN WEIGHT LOSS AND OBESITY MANAGEMENT MARKET, BY DISTRIBUTION CHANNEL, 2020- 2029 (USD MILLION)
TABLE 54 CHINA NON STORED BASED IN WEIGHT LOSS AND OBESITY MANAGEMENT MARKET, BY DISTRIBUTION CHANNEL, 2020- 2029 (USD MILLION)
TABLE 55 INDIA WEIGHT LOSS AND OBESITY MANAGEMENT MARKET, BY PRODUCT TYPE, 2020-2029 (USD MILLION)
TABLE 56 INDIA DIETARY SUPPLEMENTS IN WEIGHT LOSS AND OBESITY MANAGEMENT MARKET, BY SUPPLEMENT TYPE, 2020-2029 (USD MILLION)
TABLE 57 INDIA DIETARY SUPPLEMENTS IN WEIGHT LOSS AND OBESITY MANAGEMENT MARKET, BY ACTIVE INGREDIENT TYPE, 2020-2029 (USD MILLION)
TABLE 58 INDIA MEAL REPLACEMENTS IN WEIGHT LOSS AND OBESITY MANAGEMENT MARKET, BY PRODUCT TYPE, 2020-2029 (USD MILLION)
TABLE 59 INDIA WEIGHT LOSS AND OBESITY MANAGEMENT MARKET, BY PRODUCT FORM, 2020-2029 (USD MILLION)
TABLE 60 INDIA WEIGHT LOSS AND OBESITY MANAGEMENT MARKET, BY END-USER DEMOGRAPHY, 2020-2029 (USD MILLION)
TABLE 61 INDIA WEIGHT LOSS AND OBESITY MANAGEMENT MARKET, BY DISTRIBUTION CHANNEL, 2020-2029 (USD MILLION)
TABLE 62 INDIA STORE BASED IN WEIGHT LOSS AND OBESITY MANAGEMENT MARKET, BY DISTRIBUTION CHANNEL, 2020- 2029 (USD MILLION)
TABLE 63 INDIA NON STORED BASED IN WEIGHT LOSS AND OBESITY MANAGEMENT MARKET, BY DISTRIBUTION CHANNEL, 2020- 2029 (USD MILLION)
TABLE 64 AUSTRALIA WEIGHT LOSS AND OBESITY MANAGEMENT MARKET, BY PRODUCT TYPE, 2020-2029 (USD MILLION)
TABLE 65 AUSTRALIA DIETARY SUPPLEMENTS IN WEIGHT LOSS AND OBESITY MANAGEMENT MARKET, BY SUPPLEMENT TYPE, 2020-2029 (USD MILLION)
TABLE 66 AUSTRALIA DIETARY SUPPLEMENTS IN WEIGHT LOSS AND OBESITY MANAGEMENT MARKET, BY ACTIVE INGREDIENT TYPE, 2020-2029 (USD MILLION)
TABLE 67 AUSTRALIA MEAL REPLACEMENTS IN WEIGHT LOSS AND OBESITY MANAGEMENT MARKET, BY PRODUCT TYPE, 2020-2029 (USD MILLION)
TABLE 68 AUSTRALIA WEIGHT LOSS AND OBESITY MANAGEMENT MARKET, BY PRODUCT FORM, 2020-2029 (USD MILLION)
TABLE 69 AUSTRALIA WEIGHT LOSS AND OBESITY MANAGEMENT MARKET, BY END-USER DEMOGRAPHY, 2020-2029 (USD MILLION)
TABLE 70 AUSTRALIA WEIGHT LOSS AND OBESITY MANAGEMENT MARKET, BY DISTRIBUTION CHANNEL, 2020-2029 (USD MILLION)
TABLE 71 AUSTRALIA STORE BASED IN WEIGHT LOSS AND OBESITY MANAGEMENT MARKET, BY DISTRIBUTION CHANNEL, 2020- 2029 (USD MILLION)
TABLE 72 AUSTRALIA NON STORED BASED IN WEIGHT LOSS AND OBESITY MANAGEMENT MARKET, BY DISTRIBUTION CHANNEL, 2020- 2029 (USD MILLION)
TABLE 73 SOUTH KOREA WEIGHT LOSS AND OBESITY MANAGEMENT MARKET, BY PRODUCT TYPE, 2020-2029 (USD MILLION)
TABLE 74 SOUTH KOREA DIETARY SUPPLEMENTS IN WEIGHT LOSS AND OBESITY MANAGEMENT MARKET, BY SUPPLEMENT TYPE, 2020-2029 (USD MILLION)
TABLE 75 SOUTH KOREA DIETARY SUPPLEMENTS IN WEIGHT LOSS AND OBESITY MANAGEMENT MARKET, BY ACTIVE INGREDIENT TYPE, 2020-2029 (USD MILLION)
TABLE 76 SOUTH KOREA MEAL REPLACEMENTS IN WEIGHT LOSS AND OBESITY MANAGEMENT MARKET, BY PRODUCT TYPE, 2020-2029 (USD MILLION)
TABLE 77 SOUTH KOREA WEIGHT LOSS AND OBESITY MANAGEMENT MARKET, BY PRODUCT FORM, 2020-2029 (USD MILLION)
TABLE 78 SOUTH KOREA WEIGHT LOSS AND OBESITY MANAGEMENT MARKET, BY END-USER DEMOGRAPHY, 2020-2029 (USD MILLION)
TABLE 79 SOUTH KOREA WEIGHT LOSS AND OBESITY MANAGEMENT MARKET, BY DISTRIBUTION CHANNEL, 2020-2029 (USD MILLION)
TABLE 80 SOUTH KOREA STORE BASED IN WEIGHT LOSS AND OBESITY MANAGEMENT MARKET, BY DISTRIBUTION CHANNEL, 2020- 2029 (USD MILLION)
TABLE 81 SOUTH KOREA NON STORED BASED IN WEIGHT LOSS AND OBESITY MANAGEMENT MARKET, BY DISTRIBUTION CHANNEL, 2020- 2029 (USD MILLION)
TABLE 82 MALAYSIA WEIGHT LOSS AND OBESITY MANAGEMENT MARKET, BY PRODUCT TYPE, 2020-2029 (USD MILLION)
TABLE 83 MALAYSIA DIETARY SUPPLEMENTS IN WEIGHT LOSS AND OBESITY MANAGEMENT MARKET, BY SUPPLEMENT TYPE, 2020-2029 (USD MILLION)
TABLE 84 MALAYSIA DIETARY SUPPLEMENTS IN WEIGHT LOSS AND OBESITY MANAGEMENT MARKET, BY ACTIVE INGREDIENT TYPE, 2020-2029 (USD MILLION)
TABLE 85 MALAYSIA MEAL REPLACEMENTS IN WEIGHT LOSS AND OBESITY MANAGEMENT MARKET, BY PRODUCT TYPE, 2020-2029 (USD MILLION)
TABLE 86 MALAYSIA WEIGHT LOSS AND OBESITY MANAGEMENT MARKET, BY PRODUCT FORM, 2020-2029 (USD MILLION)
TABLE 87 MALAYSIA WEIGHT LOSS AND OBESITY MANAGEMENT MARKET, BY END-USER DEMOGRAPHY, 2020-2029 (USD MILLION)
TABLE 88 MALAYSIA WEIGHT LOSS AND OBESITY MANAGEMENT MARKET, BY DISTRIBUTION CHANNEL, 2020-2029 (USD MILLION)
TABLE 89 MALAYSIA STORE BASED IN WEIGHT LOSS AND OBESITY MANAGEMENT MARKET, BY DISTRIBUTION CHANNEL, 2020- 2029 (USD MILLION)
TABLE 90 MALAYSIA NON STORED BASED IN WEIGHT LOSS AND OBESITY MANAGEMENT MARKET, BY DISTRIBUTION CHANNEL, 2020- 2029 (USD MILLION)
TABLE 91 THAILAND WEIGHT LOSS AND OBESITY MANAGEMENT MARKET, BY PRODUCT TYPE, 2020-2029 (USD MILLION)
TABLE 92 THAILAND DIETARY SUPPLEMENTS IN WEIGHT LOSS AND OBESITY MANAGEMENT MARKET, BY SUPPLEMENT TYPE, 2020-2029 (USD MILLION)
TABLE 93 THAILAND DIETARY SUPPLEMENTS IN WEIGHT LOSS AND OBESITY MANAGEMENT MARKET, BY ACTIVE INGREDIENT TYPE, 2020-2029 (USD MILLION)
TABLE 94 THAILAND MEAL REPLACEMENTS IN WEIGHT LOSS AND OBESITY MANAGEMENT MARKET, BY PRODUCT TYPE, 2020-2029 (USD MILLION)
TABLE 95 THAILAND WEIGHT LOSS AND OBESITY MANAGEMENT MARKET, BY PRODUCT FORM, 2020-2029 (USD MILLION)
TABLE 96 THAILAND WEIGHT LOSS AND OBESITY MANAGEMENT MARKET, BY END-USER DEMOGRAPHY, 2020-2029 (USD MILLION)
TABLE 97 THAILAND WEIGHT LOSS AND OBESITY MANAGEMENT MARKET, BY DISTRIBUTION CHANNEL, 2020-2029 (USD MILLION)
TABLE 98 THAILAND STORE BASED IN WEIGHT LOSS AND OBESITY MANAGEMENT MARKET, BY DISTRIBUTION CHANNEL, 2020- 2029 (USD MILLION)
TABLE 99 THAILAND NON STORED BASED IN WEIGHT LOSS AND OBESITY MANAGEMENT MARKET, BY DISTRIBUTION CHANNEL, 2020- 2029 (USD MILLION)
TABLE 100 SINGAPORE WEIGHT LOSS AND OBESITY MANAGEMENT MARKET, BY PRODUCT TYPE, 2020-2029 (USD MILLION)
TABLE 101 SINGAPORE DIETARY SUPPLEMENTS IN WEIGHT LOSS AND OBESITY MANAGEMENT MARKET, BY SUPPLEMENT TYPE, 2020-2029 (USD MILLION)
TABLE 102 SINGAPORE DIETARY SUPPLEMENTS IN WEIGHT LOSS AND OBESITY MANAGEMENT MARKET, BY ACTIVE INGREDIENT TYPE, 2020-2029 (USD MILLION)
TABLE 103 SINGAPORE MEAL REPLACEMENTS IN WEIGHT LOSS AND OBESITY MANAGEMENT MARKET, BY PRODUCT TYPE, 2020-2029 (USD MILLION)
TABLE 104 SINGAPORE WEIGHT LOSS AND OBESITY MANAGEMENT MARKET, BY PRODUCT FORM, 2020-2029 (USD MILLION)
TABLE 105 SINGAPORE WEIGHT LOSS AND OBESITY MANAGEMENT MARKET, BY END-USER DEMOGRAPHY, 2020-2029 (USD MILLION)
TABLE 106 SINGAPORE WEIGHT LOSS AND OBESITY MANAGEMENT MARKET, BY DISTRIBUTION CHANNEL, 2020-2029 (USD MILLION)
TABLE 107 SINGAPORE STORE BASED IN WEIGHT LOSS AND OBESITY MANAGEMENT MARKET, BY DISTRIBUTION CHANNEL, 2020- 2029 (USD MILLION)
TABLE 108 SINGAPORE NON STORED BASED IN WEIGHT LOSS AND OBESITY MANAGEMENT MARKET, BY DISTRIBUTION CHANNEL, 2020- 2029 (USD MILLION)
TABLE 109 INDONESIA WEIGHT LOSS AND OBESITY MANAGEMENT MARKET, BY PRODUCT TYPE, 2020-2029 (USD MILLION)
TABLE 110 INDONESIA DIETARY SUPPLEMENTS IN WEIGHT LOSS AND OBESITY MANAGEMENT MARKET, BY SUPPLEMENT TYPE, 2020-2029 (USD MILLION)
TABLE 111 INDONESIA DIETARY SUPPLEMENTS IN WEIGHT LOSS AND OBESITY MANAGEMENT MARKET, BY ACTIVE INGREDIENT TYPE, 2020-2029 (USD MILLION)
TABLE 112 INDONESIA MEAL REPLACEMENTS IN WEIGHT LOSS AND OBESITY MANAGEMENT MARKET, BY PRODUCT TYPE, 2020-2029 (USD MILLION)
TABLE 113 INDONESIA WEIGHT LOSS AND OBESITY MANAGEMENT MARKET, BY PRODUCT FORM, 2020-2029 (USD MILLION)
TABLE 114 INDONESIA WEIGHT LOSS AND OBESITY MANAGEMENT MARKET, BY END-USER DEMOGRAPHY, 2020-2029 (USD MILLION)
TABLE 115 INDONESIA WEIGHT LOSS AND OBESITY MANAGEMENT MARKET, BY DISTRIBUTION CHANNEL, 2020-2029 (USD MILLION)
TABLE 116 INDONESIA STORE BASED IN WEIGHT LOSS AND OBESITY MANAGEMENT MARKET, BY DISTRIBUTION CHANNEL, 2020- 2029 (USD MILLION)
TABLE 117 INDONESIA NON STORED BASED IN WEIGHT LOSS AND OBESITY MANAGEMENT MARKET, BY DISTRIBUTION CHANNEL, 2020- 2029 (USD MILLION)
TABLE 118 PHILIPPINES WEIGHT LOSS AND OBESITY MANAGEMENT MARKET, BY PRODUCT TYPE, 2020-2029 (USD MILLION)
TABLE 119 PHILIPPINES DIETARY SUPPLEMENTS IN WEIGHT LOSS AND OBESITY MANAGEMENT MARKET, BY SUPPLEMENT TYPE, 2020-2029 (USD MILLION)
TABLE 120 PHILIPPINES DIETARY SUPPLEMENTS IN WEIGHT LOSS AND OBESITY MANAGEMENT MARKET, BY ACTIVE INGREDIENT TYPE, 2020-2029 (USD MILLION)
TABLE 121 PHILIPPINES MEAL REPLACEMENTS IN WEIGHT LOSS AND OBESITY MANAGEMENT MARKET, BY PRODUCT TYPE, 2020-2029 (USD MILLION)
TABLE 122 PHILIPPINES WEIGHT LOSS AND OBESITY MANAGEMENT MARKET, BY PRODUCT FORM, 2020-2029 (USD MILLION)
TABLE 123 PHILIPPINES WEIGHT LOSS AND OBESITY MANAGEMENT MARKET, BY END-USER DEMOGRAPHY, 2020-2029 (USD MILLION)
TABLE 124 PHILIPPINES WEIGHT LOSS AND OBESITY MANAGEMENT MARKET, BY DISTRIBUTION CHANNEL, 2020-2029 (USD MILLION)
TABLE 125 PHILIPPINES STORE BASED IN WEIGHT LOSS AND OBESITY MANAGEMENT MARKET, BY DISTRIBUTION CHANNEL, 2020- 2029 (USD MILLION)
TABLE 126 PHILIPPINES NON STORED BASED IN WEIGHT LOSS AND OBESITY MANAGEMENT MARKET, BY DISTRIBUTION CHANNEL, 2020- 2029 (USD MILLION)
TABLE 127 REST OF ASIA-PACIFIC WEIGHT LOSS AND OBESITY MANAGEMENT MARKET, BY PRODUCT TYPE, 2020-2029 (USD MILLION)
List of Figure
FIGURE 1 ASIA-PACIFIC WEIGHT LOSS AND OBESITY MANAGEMENT MARKET: SEGMENTATION
FIGURE 2 ASIA-PACIFIC WEIGHT LOSS AND OBESITY MANAGEMENT MARKET: DATA TRIANGULATION
FIGURE 3 ASIA-PACIFIC WEIGHT LOSS AND OBESITY MANAGEMENT MARKET : DROC ANALYSIS
FIGURE 4 ASIA-PACIFIC WEIGHT LOSS AND OBESITY MANAGEMENT MARKET: ASIA-PACIFIC VS REGIONAL ANALYSIS
FIGURE 5 ASIA-PACIFIC WEIGHT LOSS AND OBESITY MANAGEMENT MARKET: COMPANY RESEARCH ANALYSIS
FIGURE 6 ASIA-PACIFIC WEIGHT LOSS AND OBESITY MANAGEMENT MARKET: INTERVIEW DEMOGRAPHICS
FIGURE 7 ASIA-PACIFIC WEIGHT LOSS AND OBESITY MANAGEMENT MARKET: DBMR POSITION GRID
FIGURE 8 ASIA-PACIFIC WEIGHT LOSS AND OBESITY MANAGEMENT MARKET: VENDOR SHARE ANALYSIS
FIGURE 9 ASIA-PACIFIC WEIGHT LOSS AND OBESITY MANAGEMENT MARKET: SEGMENTATION
FIGURE 10 INCREASE IN OBESE POPULATION IS DRIVING THE GROWTH OF ASIA-PACIFIC WEIGHT LOSS AND OBESITY MANAGEMENT MARKET IN THE FORECAST PERIOD OF 2022 TO 2029
FIGURE 11 DIETARY SUPPLEMENTS SEGMENT IS EXPECTED TO ACCOUNT FOR THE LARGEST SHARE OF THE ASIA-PACIFIC WEIGHT LOSS AND OBESITY MANAGEMENT MARKET IN 2022 & 2029
FIGURE 12 SUPPLY CHAIN OF WEIGHT LOSS & OBESITY MANAGEMENT MARKET
FIGURE 13 DRIVERS, RESTRAINTS, OPPORTUNITIES, AND CHALLENGES OF ASIA-PACIFIC WEIGHT LOSS AND OBESITY MANAGEMENT MARKET
FIGURE 14 ASIA-PACIFIC WEIGHT LOSS AND OBESITY MANAGEMENT MARKET: BY PRODUCT TYPE, 2021
FIGURE 15 ASIA-PACIFIC WEIGHT LOSS AND OBESITY MANAGEMENT MARKET: BY PRODUCT FORM, 2021
FIGURE 16 ASIA-PACIFIC WEIGHT LOSS AND OBESITY MANAGEMENT MARKET: BY DISTRIBUTION CHANNEL, 2021
FIGURE 17 ASIA-PACIFIC WEIGHT LOSS AND OBESITY MANAGEMENT MARKET, BY END-USER DEMOGRAPHY, 2021
FIGURE 18 ASIA-PACIFIC WEIGHT LOSS AND OBESITY MANAGEMENT MARKET: SNAPSHOT (2021)
FIGURE 19 ASIA-PACIFIC WEIGHT LOSS AND OBESITY MANAGEMENT MARKET: BY COUNTRY (2021)
FIGURE 20 ASIA-PACIFIC WEIGHT LOSS AND OBESITY MANAGEMENT MARKET: BY COUNTRY (2022 & 2029)
FIGURE 21 ASIA-PACIFIC WEIGHT LOSS AND OBESITY MANAGEMENT MARKET: BY COUNTRY (2021 & 2029)
FIGURE 22 ASIA-PACIFIC WEIGHT LOSS AND OBESITY MANAGEMENT MARKET: BY PRODUCT TYPE (2022-2029)
FIGURE 23 ASIA-PACIFIC WEIGHT LOSS AND OBESITY MANAGEMENT MARKET: COMPANY SHARE 2021 (%)
Asia Pacific Weight Loss And Obesity Management Market, Supply Chain Analysis and Ecosystem Framework
To support market growth and help clients navigate the impact of geopolitical shifts, DBMR has integrated in-depth supply chain analysis into its Asia Pacific Weight Loss And Obesity Management Market research reports. This addition empowers clients to respond effectively to global changes affecting their industries. The supply chain analysis section includes detailed insights such as Asia Pacific Weight Loss And Obesity Management Market consumption and production by country, price trend analysis, the impact of tariffs and geopolitical developments, and import and export trends by country and HSN code. It also highlights major suppliers with data on production capacity and company profiles, as well as key importers and exporters. In addition to research, DBMR offers specialized supply chain consulting services backed by over a decade of experience, providing solutions like supplier discovery, supplier risk assessment, price trend analysis, impact evaluation of inflation and trade route changes, and comprehensive market trend analysis.
Data collection and base year analysis are done using data collection modules with large sample sizes. The stage includes obtaining market information or related data through various sources and strategies. It includes examining and planning all the data acquired from the past in advance. It likewise envelops the examination of information inconsistencies seen across different information sources. The market data is analysed and estimated using market statistical and coherent models. Also, market share analysis and key trend analysis are the major success factors in the market report. To know more, please request an analyst call or drop down your inquiry.
The key research methodology used by DBMR research team is data triangulation which involves data mining, analysis of the impact of data variables on the market and primary (industry expert) validation. Data models include Vendor Positioning Grid, Market Time Line Analysis, Market Overview and Guide, Company Positioning Grid, Patent Analysis, Pricing Analysis, Company Market Share Analysis, Standards of Measurement, Global versus Regional and Vendor Share Analysis. To know more about the research methodology, drop in an inquiry to speak to our industry experts.
Data Bridge Market Research is a leader in advanced formative research. We take pride in servicing our existing and new customers with data and analysis that match and suits their goal. The report can be customized to include price trend analysis of target brands understanding the market for additional countries (ask for the list of countries), clinical trial results data, literature review, refurbished market and product base analysis. Market analysis of target competitors can be analyzed from technology-based analysis to market portfolio strategies. We can add as many competitors that you require data about in the format and data style you are looking for. Our team of analysts can also provide you data in crude raw excel files pivot tables (Fact book) or can assist you in creating presentations from the data sets available in the report.


