
Benelux Construction Market
Market Size in USD Billion
 USD
111.03 Billion
USD
152.60 Billion
2024
2032
USD
111.03 Billion
USD
152.60 Billion
2024
2032
| 2025 - 2032 | |
| USD 111.03 Billion | |
| USD 152.60 Billion | |
| % | |
Construction Market Size
- The Benelux construction market was valued at USD 111.03 Billion in 2024 and is expected to reach USD 152.60 Billion by 2032
- During the forecast period of 2025 to 2032, the construction market is projected to grow steadily at a CAGR of 4.2%, driven primarily by rising infrastructure investments, urbanization, and the demand for sustainable, energy-efficient building solutions across both residential and commercial sectors
- This growth is supported by factors such as government-led smart city initiatives, increased adoption of green building materials, advancements in construction technology, and a shift toward modular and prefabricated construction to reduce timelines, costs, and environmental impact
Construction Market Analysis
- Belgium’s construction sector is witnessing robust activity driven by increased investments in infrastructure, residential, and industrial segments. The government's emphasis on sustainability and green initiatives continues to influence project planning and development across key urban regions
- The Netherlands’ construction market is currently challenged by rising interest rates and reduced investor confidence. However, growth is expected to resume as sustainability-driven urban development and housing demand start regaining momentum from 2025 onward
- Infrastructure projects such as the Hollands Kust Noord Wind Farm and Rotterdam Biofuels Plant are shaping the Netherlands’ transition to a greener economy. These initiatives are boosting demand for construction services and reflecting a long-term policy shift toward climate resilience
- For instance, Belgium’s construction sector in 2025 faces pressure to deliver 375,000 new homes, amid four years of stagnant growth. Digitization through BIM, drones, and 3D printing is driving future efficiency and transformation
- Benelux is under pressure to meet surging housing demand, with a shortfall requiring immediate attention. Construction activity is accelerating in response, as policymakers and developers focus on delivering affordable and sustainable housing to prevent a future housing crisis
Report Scope and Construction Market Segmentation
|
Attributes |
Construction Market Insights |
|
Segments Covered |
|
|
Country Covered |
Netherlands, Belgium, and Luxembourg |
|
Key Market Players |
|
|
Market Opportunities |
|
|
Value Added Data Infosets |
In addition to the insights on market scenarios such as market value, growth rate, segmentation, geographical coverage, and major players, the market reports curated by the Data Bridge Market Research also include import export analysis, production capacity overview, production consumption analysis, price trend analysis, climate change scenario, supply chain analysis, value chain analysis, raw material/consumables overview, vendor selection criteria, PESTLE Analysis, Porter Analysis, and regulatory framework. |
Benelux Construction Market Trends
“Sustainable and Digitized Construction Shaping Benelux Market”
- The Benelux construction market is being transformed by an urgent demand for energy-efficient and environmentally responsible infrastructure
- Driven by EU green mandates and urban sustainability goals, developers are increasingly adopting low-carbon materials, green roofs, and circular construction models to align with regional climate objectives and consumer expectations
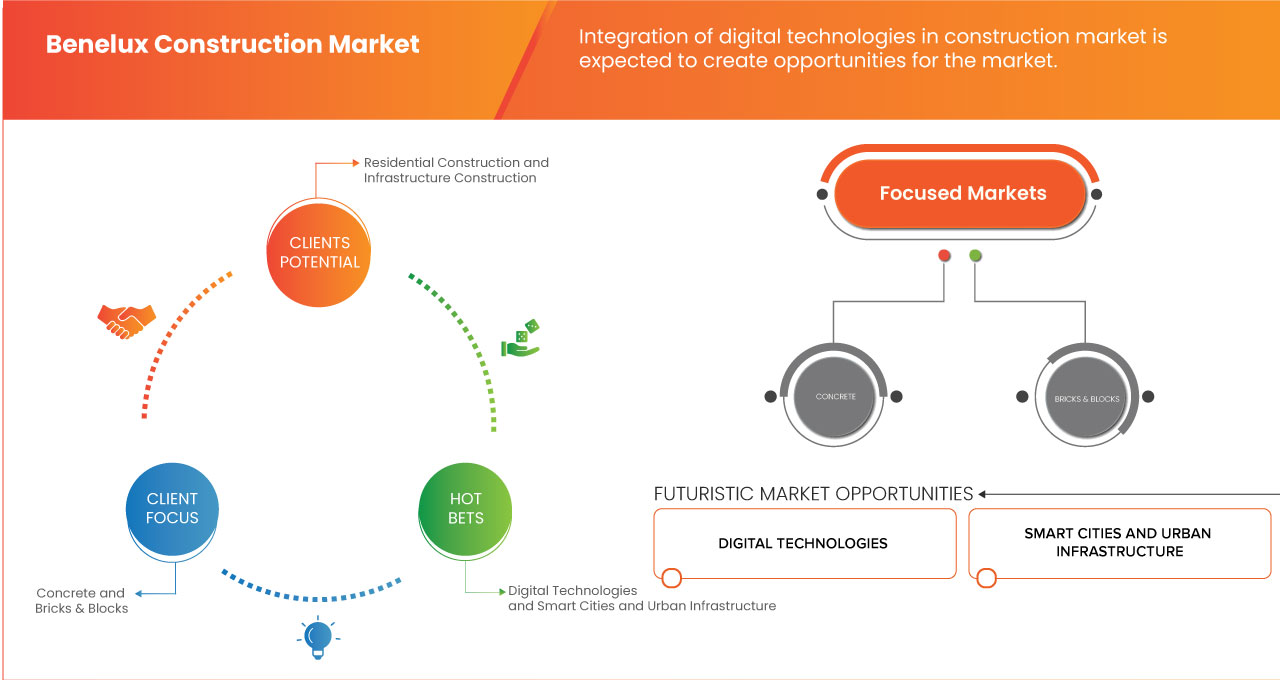
- Technology is reshaping the Benelux construction landscape, with increasing integration of digital tools like Building Information Modeling (BIM), drones, and 3D printing
- These innovations are improving project planning, reducing waste, and accelerating timelines—crucial factors in meeting growing housing demands and infrastructure deadlines in dense urban regions
- The region is experiencing renewed momentum in residential construction, spurred by acute housing shortages, particularly in Belgium and the Netherlands
- Developers are under pressure to deliver affordable and sustainable homes while navigating land scarcity, regulatory constraints, and shifting demographic needs such as aging populations and smaller households
- For instance, the Netherlands is prioritizing large-scale infrastructure projects like offshore wind farms and biofuel plants, reflecting a broader shift toward green construction and signaling opportunities for contractors specializing in sustainable, high-tech developments
Major players are investing in modular and prefabricated construction techniques, enhancing speed and cost-efficiency while reducing environmental impact. Combined with smart building systems and renewable energy integration, these approaches support long-term resilience and growth across the Benelux construction sector.
Construction Market Dynamics
Driver
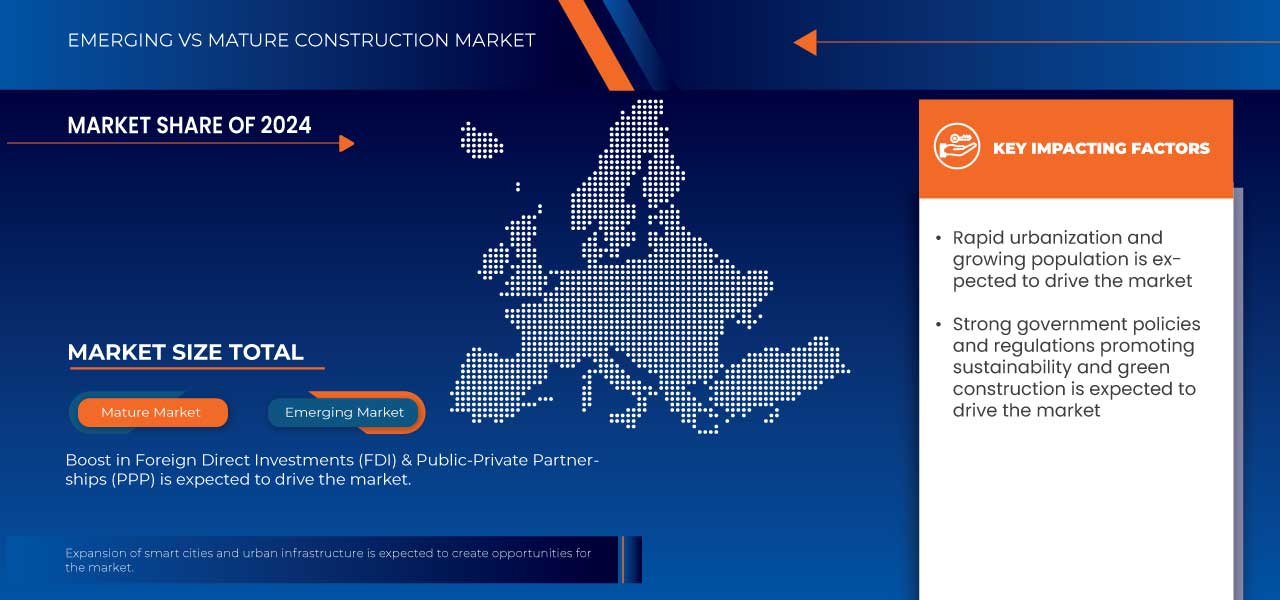
“Rapid Urbanization and Growing Population”
- Cities in the Benelux region are expanding fast, and more people are moving in every year. With a growing population, there’s a rising need for new homes, offices, roads, and public infrastructure
- Urbanization is also changing how cities are built. There’s a greater focus on smart buildings, green spaces, and sustainable construction to support modern lifestyles
- Governments and private developers are investing in projects that make cities more livable, efficient, and environmentally friendly
- At the same time, rising populations increase the need for better infrastructure, from bridges to energy-efficient buildings
- Large-scale developments, including residential and commercial spaces, are being built to accommodate this growth
- The push for sustainable and high-tech construction methods is also gaining momentum, making urban expansion more efficient and future-ready
For instance,
- In December 2020, as per an article published by the European Commission, the Netherlands experienced a 41.9% rise in housing prices from 2015 to 2020, driven by an 8.2% increase in households and declining mortgage rates, highlighting the growing demand for housing and infrastructure due to rapid urbanization
- As per a blog published by Nextimmo Sàrl in September 2024, urban densification in Luxembourg has led to rising property prices in central areas, prompting expansion into suburban regions where housing is more affordable and space is readily available
Rapid urbanization and population growth in the Benelux region are driving demand for housing, infrastructure, and sustainable construction. Cities are expanding with smart buildings, green spaces, and large-scale developments. Governments and private developers invest in modern, efficient, and eco-friendly projects to support growing urban needs and future-ready infrastructure.
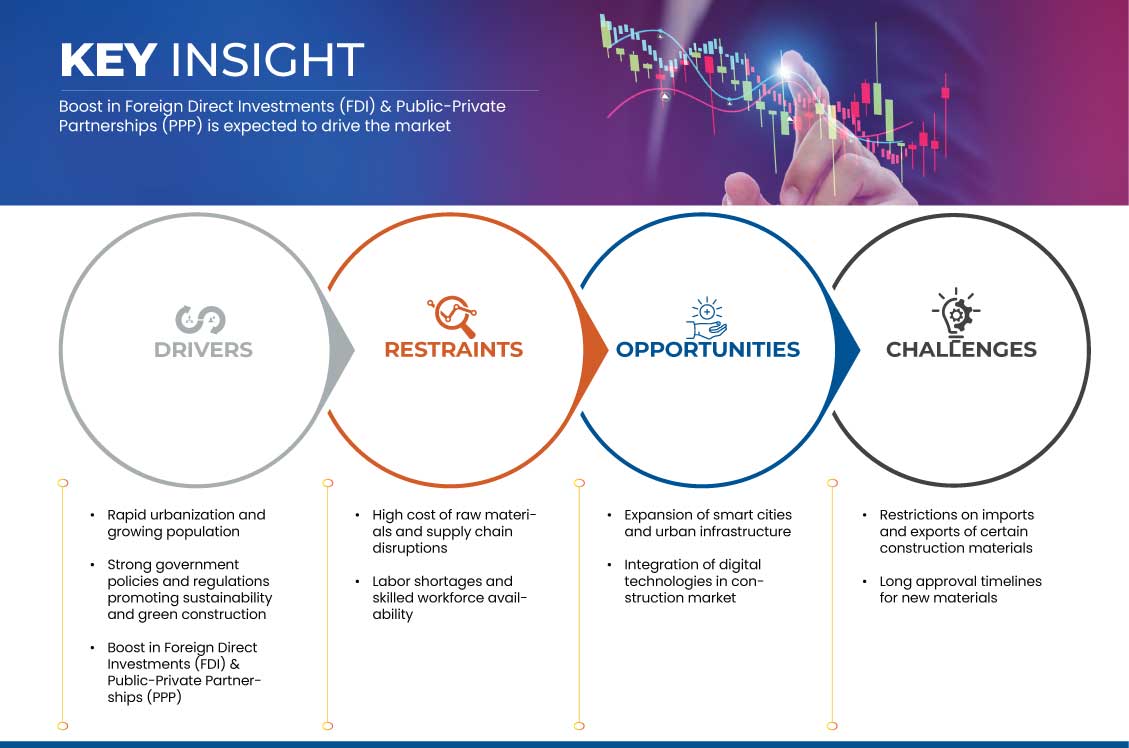
Opportunities
“Expansion of Smart Cities and Urban Infrastructure”
- Governments and private investors are prioritizing sustainable, tech-driven cities that enhance connectivity, efficiency, and quality of life
- Smart cities integrate advanced technologies like IoT, AI, and automation to optimize urban spaces. This includes energy-efficient buildings, smart transportation networks, intelligent lighting, and digital infrastructure. Construction companies are increasingly focusing on eco-friendly materials, smart building designs, and innovative urban planning to meet the growing demand for sustainable development
- The push for modern urban infrastructure is also driving large-scale investments in roads, bridges, public spaces, and utilities. Public-private partnerships (PPPs) are playing a crucial role in funding and executing these projects, ensuring high-quality, future-ready infrastructure. These developments not only improve city living but also boost economic growth and create job opportunities
- With governments emphasizing sustainability and digital transformation, construction firms that embrace smart technologies and green building solutions will gain a competitive advantage. The future of urban development in Benelux is centered on smart, efficient, and sustainable cities
For instance,
- In February 2023, the Benelux region is seeing significant investment in smart cities, with the EU funding sustainable urban projects. Belgium receives Euro 400M for green initiatives, Luxembourg invests Euro 30.5M in EV charging, and the Netherlands allocates Euro 506M for digital transformation. These efforts drive eco-friendly and tech-driven urban development
The expansion of smart cities and urban infrastructure is revolutionizing the construction market, driving demand for sustainable materials, advanced technologies, and efficient design. This shift is fostering innovation, improving urban livability, and creating long-term growth opportunities for developers, contractors, and tech-integrated solutions across both residential and commercial construction segments.
Restraint/Challenge
“High Cost of Raw Materials and Supply Chain Disruptions”
- The construction industry in Benelux is facing rising costs due to expensive raw materials and supply chain disruptions. Essential materials like steel, cement, wood, and glass have become costly, making it harder for builders to stay within budget. These price hikes directly impact housing, commercial projects, and infrastructure development, slowing down progress
- Another major challenge is supply chain instability. Delays in getting materials on time lead to stalled projects, increased costs, and missed deadlines
- Global trade issues, transportation problems, and shortages of key materials create bottlenecks, making it difficult for builders to plan efficiently
- Fuel price increases and labor shortages add to the issue, making logistics and transportation even more expensive
For instance,
- In September 2024, the Netherlands' construction cost index reached a record high of 120.30 points, up from 62.90 points in March 2000. For comparison, in September 2024, Bulgaria recorded 170.00 points, Romania 141.50 points, and Germany 118.80 points. These figures indicate significant variations in construction costs across Europe
Benelux’s construction sector faces rising raw material costs and supply chain disruptions, delaying projects and increasing expenses. Builders struggle with shortages and high transportation costs.
Construction Market Scope
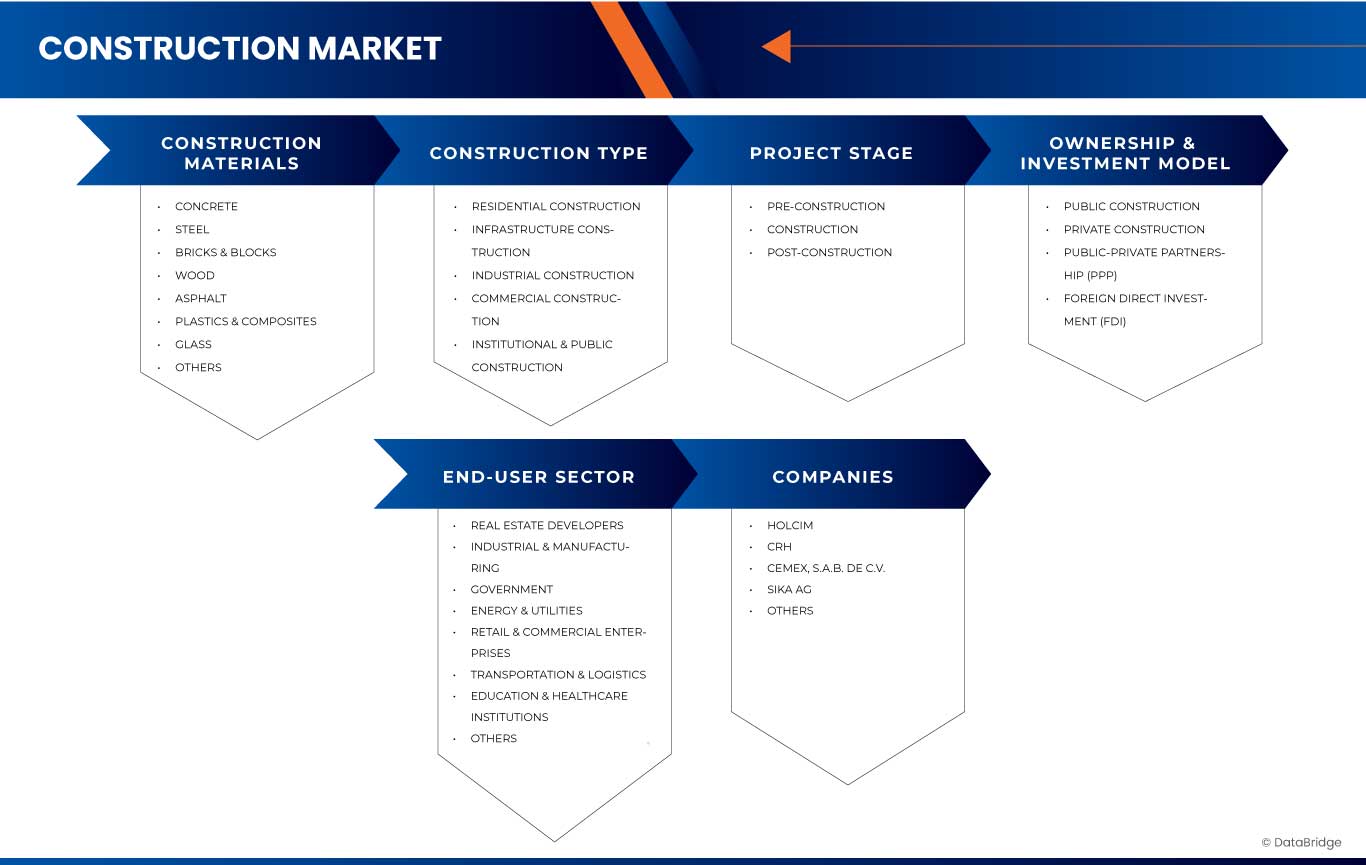
The market is segmented on the basis of construction materials, construction type, project stage, ownership & investment model, end-user sector.
|
Segmentation |
Sub-Segmentation |
|
By Construction Materials |
|
|
By Construction Type |
|
|
By Project Stage |
|
|
By Ownership & Investment Model |
|
|
By End-User Sector |
|
Benelux Construction Market Regional Analysis
“Netherlands is the dominant Country in the Benelux Construction Market”
- Netherlands is expected to dominate the market due to its strong emphasis on sustainable construction, advanced infrastructure development, and smart city initiatives. Government support, technological innovation, and a robust regulatory framework are driving growth, making the country a hub for eco-friendly, efficient, and future-ready construction solutions in Europe
“Netherlands is Projected to Register the Highest Growth Rate”
- Netherlands is projected to register the highest growth rate due to its focus on green building practices, rising demand for affordable housing, and integration of digital technologies like BIM and modular construction, which enhance efficiency and sustainability across urban development projects.
Construction Market Share
The market competitive landscape provides details by competitor. Details included are company overview, company financials, revenue generated, market potential, investment in research and development, new market initiatives, country presence, production sites and facilities, production capacities, company strengths and weaknesses, product launch, product width and breadth, application dominance. The above data points provided are only related to the companies' focus related to market.
Construction Market Leaders Operating in the Market Are:
- CRH (U.S.)
- Cemex, S.A.B. de C.V. (Mexico)
- Sika AG (Switzerland)
- HOLCIM (Switzerland)
- Cementir Holding N.V. (Netherlands)
- Aditya Birla Management Corporation PVT. LTD. (India)
- Buzzi S.P.A. (Germany)
Latest Developments in Construction Market
- In October 2022, CRH and Shell signed a memorandum of understanding to collaborate on developing and implementing decarbonization solutions. Their partnership focuses on reducing emissions across transport, operations, and materials by exploring vehicle electrification, low-carbon fuels, renewable electricity, and sustainable asphalt solutions. This initiative aims to accelerate progress toward net zero emissions across Europe, North America, and Asia-Pacific
- In October 2024, Cemex expanded its electric mixer fleet to Mexico as part of its strategy to decarbonize operations under the Future in Action program, targeting net-zero CO₂ emissions by 2050. These mixers offer full-load capacity and day-long operation, with previous deployments in Germany and Dubai and planned expansions in France, Spain, Poland, and the Czech Republic
- In May 2024, Cemex was recognized as the top-ranking company in the World Benchmarking Alliance’s Climate and Energy Benchmark for the cement industry. This achievement highlights Cemex’s commitment to reducing carbon emissions and becoming a net-zero CO₂ company by 2050. The ranking assessed 91 global aluminum, cement, and steel companies based on climate targets and transition efforts
- In December 2024, Holcim has announced a partnership with Pritzker Prize-winning architect Alejandro Aravena and his Chilean architectural practice, Elemental, to launch a groundbreaking housing project at the 2025 Venice Biennale of Architecture. The initiative aims to create resilient, carbon-neutral housing, blending Elemental’s expertise in affordable and sustainable housing with Holcim’s innovative ECOPact concrete solutions. This collaborative project will be featured in the Time Space Existence exhibition, organized by the European cultural centre
- In March 2024, Dyckerhoff “catch4climate" project, led by four European cement manufacturers, is advancing CO2 capture in Mergelstetten with a USD 129.89 million investments. Using the pure oxyfuel process, a new rotary kiln was installed in March 2024, with commissioning set for early 2025, followed by three years of research development
SKU-

- Interactive Data Analysis Dashboard
- Company Analysis Dashboard for high growth potential opportunities
- Research Analyst Access for customization & queries
- Competitor Analysis with Interactive dashboard
- Latest News, Updates & Trend analysis
- Harness the Power of Benchmark Analysis for Comprehensive Competitor Tracking
Table of Content
1 INTRODUCTION
1.1 OBJECTIVES OF THE STUDY
1.2 MARKET DEFINITION
1.3 OVERVIEW
1.4 LIMITATIONS
1.5 MARKETS COVERED
2 MARKET SEGMENTATION
2.1 MARKETS COVERED
2.2 GEOGRAPHICAL SCOPE
2.3 YEARS CONSIDERED FOR THE STUDY
2.4 CURRENCY AND PRICING
2.5 DBMR TRIPOD DATA VALIDATION MODEL
2.6 MULTIVARIATE MODELING
2.7 PRIMARY INTERVIEWS WITH KEY OPINION LEADERS
2.8 DBMR MARKET POSITION GRID
2.9 DBMR VENDOR SHARE ANALYSIS
2.1 MARKET END-USER SECTOR COVERAGE GRID
2.11 SECONDARY SOURCES
2.12 ASSUMPTIONS
3 EXECUTIVE SUMMARY
4 PREMIUM INSIGHTS
4.1 PESTEL ANALYSIS
4.1.1 POLITICAL FACTORS
4.1.2 ECONOMIC FACTORS
4.1.3 SOCIAL FACTORS
4.1.4 TECHNOLOGICAL FACTORS
4.1.5 ENVIRONMENTAL FACTORS
4.1.6 LEGAL FACTORS
4.2 PORTER’S FIVE FORCES
4.2.1 THREAT OF NEW ENTRANTS
4.2.2 BARGAINING POWER OF SUPPLIERS
4.2.3 BARGAINING POWER OF BUYERS
4.2.4 THREAT OF SUBSTITUTES
4.2.5 INDUSTRY RIVALRY
4.3 TECHNOLOGICAL ADVANCEMENTS IN THE BENELUX CONSTRUCTION MARKET
5 REGULATORY COVERAGE
6 MARKET OVERVIEW
6.1 DRIVERS
6.1.1 RAPID URBANIZATION AND GROWING POPULATION
6.1.2 STRONG GOVERNMENT POLICIES AND REGULATIONS PROMOTING SUSTAINABILITY AND GREEN CONSTRUCTION
6.1.3 BOOST IN FOREIGN DIRECT INVESTMENTS (FDI) & PUBLIC-PRIVATE PARTNERSHIPS (PPP)
6.2 RESTRAINTS
6.2.1 HIGH COST OF RAW MATERIALS AND SUPPLY CHAIN DISRUPTIONS
6.2.2 LABOR SHORTAGES AND SKILLED WORKFORCE AVAILABILITY
6.3 OPPORTUNITIES
6.3.1 EXPANSION OF SMART CITIES AND URBAN INFRASTRUCTURE
6.3.2 INTEGRATION OF DIGITAL TECHNOLOGIES IN CONSTRUCTION MARKET
6.4 CHALLENGES
6.4.1 RESTRICTIONS ON IMPORTS AND EXPORTS OF CERTAIN CONSTRUCTION MATERIALS
6.4.2 LONG APPROVAL TIMELINES FOR NEW MATERIALS
7 BENELUX CONSTRUCTION MARKET, BY CONSTRUCTION MATERIALS
7.1 OVERVIEW
7.2 CONCRETE
7.3 STEEL
7.4 BRICKS & BLOCKS
7.5 WOOD
7.6 ASPHALT
7.7 PLASTICS & COMPOSITES
7.8 GLASS
7.9 OTHERS
8 BENELUX CONSTRUCTION MARKET, BY CONSTRUCTION TYPE
8.1 OVERVIEW
8.2 RESIDENTIAL CONSTRUCTION
8.2.1 RESIDENTIAL CONSTRUCTION, BY CONSTRUCTION TYPE
8.3 INFRASTRUCTURE CONSTRUCTION
8.3.1 INFRASTRUCTURE CONSTRUCTION, BY CONSTRUCTION TYPE
8.4 INDUSTRIAL CONSTRUCTION
8.4.1 INDUSTRIAL CONSTRUCTION, BY CONSTRUCTION TYPE
8.5 COMMERCIAL CONSTRUCTION
8.5.1 COMMERCIAL CONSTRUCTION, BY CONSTRUCTION TYPE
8.6 INSTITUTIONAL & PUBLIC CONSTRUCTION
8.6.1 INSTITUTIONAL & PUBLIC CONSTRUCTION, BY CONSTRUCTION TYPE
9 BENELUX CONSTRUCTION MARKET, BY PROJECT STAGE
9.1 OVERVIEW
9.2 PRE-CONSTRUCTION
9.3 CONSTRUCTION
9.4 POST-CONSTRUCTION
10 BENELUX CONSTRUCTION MARKET, BY OWNERSHIP & INVESTMENT MODEL
10.1 OVERVIEW
10.2 PUBLIC CONSTRUCTION
10.3 PRIVATE CONSTRUCTION
10.4 PUBLIC-PRIVATE PARTNERSHIP (PPP)
10.5 FOREIGN DIRECT INVESTMENT (FDI)
11 BENELUX CONSTRUCTION MARKET, BY END-USER SECTOR
11.1 OVERVIEW
11.2 REAL ESTATE DEVELOPERS
11.3 INDUSTRIAL & MANUFACTURING
11.4 GOVERNMENT
11.5 ENERGY & UTILITIES
11.6 RETAIL & COMMERCIAL ENTERPRISES
11.7 TRANSPORTATION & LOGISTICS
11.8 EDUCATION & HEALTHCARE INSTITUTIONS
11.9 OTHERS
12 BENELUX CONSTRUCTION MARKET BY COUNTRIES
12.1 BENELUX
12.1.1 NETHERLANDS
12.1.2 BELGIUM
12.1.3 LUXEMBOURG
13 BENELUX CONSTRUCTION MARKET: COMPANY LANDSCAPE
13.1 COMPANY SHARE ANALYSIS: EUROPE
14 SWOT ANALYSIS
15 COMPANY PROFILES
15.1 HOLCIM
15.1.1 COMPANY SNAPSHOT
15.1.2 REVENUE ANALYSIS
15.1.3 PRODUCT PORTFOLIO
15.1.4 RECENT DEVELOPMENTS/NEWS
15.2 CRH
15.2.1 COMPANY SNAPSHOT
15.2.2 REVENUE ANALYSIS
15.2.3 PRODUCT PORTFOLIO
15.2.4 RECENT DEVELOPMENT
15.3 CEMEX, S.A.B. DE C.V.
15.3.1 COMPANY SNAPSHOT
15.3.2 REVENUE ANALYSIS
15.3.3 PRODUCT PORTFOLIO
15.3.4 RECENT DEVELOPMENTS/NEWS
15.4 SIKA AG
15.4.1 COMPANY SNAPSHOT
15.4.2 REVENUE ANALYSIS
15.4.3 PRODUCT PORTFOLIO
15.4.4 RECENT DEVELOPMENTS/NEWS
15.5 CEMENTIR HOLDING N.V.
15.5.1 COMPANY SNAPSHOT
15.5.2 REVENUE ANALYSIS
15.5.3 PRODUCT PORTFOLIO
15.5.4 RECENT DEVELOPMENT
15.6 ADITYA BIRLA MANAGEMENT CORPORATION PVT. LTD.
15.6.1 COMPANY SNAPSHOT
15.6.2 BUSINESS PORTFOLIO
15.6.3 RECENT DEVELOPMENT
15.7 BUZZI S.P.A.
15.7.1 COMPANY SNAPSHOT
15.7.2 PRODUCT PORTFOLIO
15.7.3 RECENT DEVELOPMENTS/NEWS
16 QUESTIONNAIRE
17 RELATED REPORTS
List of Table
TABLE 1 REGULATORY COVERAGE
TABLE 2 BENELUX CONSTRUCTION MARKET, BY CONSTRUCTION MATERIALS, 2018-2032 (USD THOUSAND)
TABLE 3 BENELUX CONSTRUCTION MARKET, BY CONSTRUCTION TYPE, 2018-2032 (USD THOUSAND)
TABLE 4 BENELUX RESIDENTIAL CONSTRUCTION IN CONSTRUCTION MARKET, BY CONSTRUCTION TYPE, 2018-2032 (USD THOUSAND)
TABLE 5 BENELUX INFRASTRUCTURE CONSTRUCTION IN CONSTRUCTION MARKET, BY CONSTRUCTION TYPE, 2018-2032 (USD THOUSAND)
TABLE 6 BENELUX INDUSTRIAL CONSTRUCTION IN CONSTRUCTION MARKET, BY CONSTRUCTION TYPE, 2018-2032 (USD THOUSAND)
TABLE 7 BENELUX COMMERCIAL CONSTRUCTION IN CONSTRUCTION MARKET, BY CONSTRUCTION TYPE, 2018-2032 (USD THOUSAND)
TABLE 8 BENELUX INSTITUTIONAL & PUBLIC CONSTRUCTION IN CONSTRUCTION MARKET, BY CONSTRUCTION TYPE, 2018-2032 (USD THOUSAND)
TABLE 9 BENELUX CONSTRUCTION MARKET, BY PROJECT STAGE, 2018-2032 (USD THOUSAND)
TABLE 10 BENELUX CONSTRUCTION MARKET, BY OWNERSHIP & INVESTMENT MODEL, 2018-2032 (USD THOUSAND)
TABLE 11 BENELUX CONSTRUCTION MARKET, BY END-USER SECTOR, 2018-2032 (USD THOUSAND)
TABLE 12 BENELUX CONSTRUCTION MARKET, BY COUNTRY, 2018-2032 (USD THOUSAND)
TABLE 13 NETHERLANDS CONSTRUCTION MARKET, BY CONSTRUCTION MATERIALS, 2018-2032 (USD THOUSAND)
TABLE 14 NETHERLANDS CONSTRUCTION MARKET, BY CONSTRUCTION TYPE, 2018-2032 (USD THOUSAND)
TABLE 15 NETHERLANDS RESIDENTIAL CONSTRUCTION IN CONSTRUCTION MARKET, BY CONSTRUCTION TYPE, 2018-2032 (USD THOUSAND)
TABLE 16 NETHERLANDS INFRASTRUCTURE CONSTRUCTION IN CONSTRUCTION MARKET, BY CONSTRUCTION TYPE, 2018-2032 (USD THOUSAND)
TABLE 17 NETHERLANDS INDUSTRIAL CONSTRUCTION IN CONSTRUCTION MARKET, BY CONSTRUCTION TYPE, 2018-2032 (USD THOUSAND)
TABLE 18 NETHERLANDS COMMERCIAL CONSTRUCTION IN CONSTRUCTION MARKET, BY CONSTRUCTION TYPE, 2018-2032 (USD THOUSAND)
TABLE 19 NETHERLANDS INSTITUTIONAL & PUBLIC CONSTRUCTION IN CONSTRUCTION MARKET, BY CONSTRUCTION TYPE, 2018-2032 (USD THOUSAND)
TABLE 20 NETHERLANDS CONSTRUCTION MARKET, BY PROJECT STAGE, 2018-2032 (USD THOUSAND)
TABLE 21 NETHERLANDS CONSTRUCTION MARKET, BY OWNERSHIP & INVESTMENT MODEL, 2018-2032 (USD THOUSAND)
TABLE 22 NETHERLANDS CONSTRUCTION MARKET, BY END-USER SECTOR, 2018-2032 (USD THOUSAND)
TABLE 23 BELGIUM CONSTRUCTION MARKET, BY CONSTRUCTION MATERIALS, 2018-2032 (USD THOUSAND)
TABLE 24 BELGIUM CONSTRUCTION MARKET, BY CONSTRUCTION TYPE, 2018-2032 (USD THOUSAND)
TABLE 25 BELGIUM RESIDENTIAL CONSTRUCTION IN CONSTRUCTION MARKET, BY CONSTRUCTION TYPE, 2018-2032 (USD THOUSAND)
TABLE 26 BELGIUM INFRASTRUCTURE CONSTRUCTION IN CONSTRUCTION MARKET, BY CONSTRUCTION TYPE, 2018-2032 (USD THOUSAND)
TABLE 27 BELGIUM INDUSTRIAL CONSTRUCTION IN CONSTRUCTION MARKET, BY CONSTRUCTION TYPE, 2018-2032 (USD THOUSAND)
TABLE 28 BELGIUM COMMERCIAL CONSTRUCTION IN CONSTRUCTION MARKET, BY CONSTRUCTION TYPE, 2018-2032 (USD THOUSAND)
TABLE 29 BELGIUM INSTITUTIONAL & PUBLIC CONSTRUCTION IN CONSTRUCTION MARKET, BY CONSTRUCTION TYPE, 2018-2032 (USD THOUSAND)
TABLE 30 BELGIUM CONSTRUCTION MARKET, BY PROJECT STAGE, 2018-2032 (USD THOUSAND)
TABLE 31 BELGIUM CONSTRUCTION MARKET, BY OWNERSHIP & INVESTMENT MODEL, 2018-2032 (USD THOUSAND)
TABLE 32 BELGIUM CONSTRUCTION MARKET, BY END-USER SECTOR, 2018-2032 (USD THOUSAND)
TABLE 33 LUXEMBOURG CONSTRUCTION MARKET, BY CONSTRUCTION MATERIALS, 2018-2032 (USD THOUSAND)
TABLE 34 LUXEMBOURG CONSTRUCTION MARKET, BY CONSTRUCTION TYPE, 2018-2032 (USD THOUSAND)
TABLE 35 LUXEMBOURG RESIDENTIAL CONSTRUCTION IN CONSTRUCTION MARKET, BY CONSTRUCTION TYPE, 2018-2032 (USD THOUSAND)
TABLE 36 LUXEMBOURG INFRASTRUCTURE CONSTRUCTION IN CONSTRUCTION MARKET, BY CONSTRUCTION TYPE, 2018-2032 (USD THOUSAND)
TABLE 37 LUXEMBOURG INDUSTRIAL CONSTRUCTION IN CONSTRUCTION MARKET, BY CONSTRUCTION TYPE, 2018-2032 (USD THOUSAND)
TABLE 38 LUXEMBOURG COMMERCIAL CONSTRUCTION IN CONSTRUCTION MARKET, BY CONSTRUCTION TYPE, 2018-2032 (USD THOUSAND)
TABLE 39 LUXEMBOURG INSTITUTIONAL & PUBLIC CONSTRUCTION IN CONSTRUCTION MARKET, BY CONSTRUCTION TYPE, 2018-2032 (USD THOUSAND)
TABLE 40 LUXEMBOURG CONSTRUCTION MARKET, BY PROJECT STAGE, 2018-2032 (USD THOUSAND)
TABLE 41 LUXEMBOURG CONSTRUCTION MARKET, BY OWNERSHIP & INVESTMENT MODEL, 2018-2032 (USD THOUSAND)
TABLE 42 LUXEMBOURG CONSTRUCTION MARKET, BY END-USER SECTOR, 2018-2032 (USD THOUSAND)
List of Figure
FIGURE 1 BENELUX CONSTRUCTION MARKET
FIGURE 2 BENELUX CONSTRUCTION MARKET: DATA TRIANGULATION
FIGURE 3 BENELUX CONSTRUCTION MARKET: DROC ANALYSIS
FIGURE 4 BENELUX CONSTRUCTION MARKET: COUNTRY-WISE MARKET ANALYSIS
FIGURE 5 BENELUX CONSTRUCTION MARKET: COMPANY RESEARCH ANALYSIS
FIGURE 6 BENELUX CONSTRUCTION MARKET: MULTIVARIATE MODELLING
FIGURE 7 BENELUX CONSTRUCTION MARKET: INTERVIEW DEMOGRAPHICS
FIGURE 8 BENELUX CONSTRUCTION MARKET: DBMR MARKET POSITION GRID
FIGURE 9 BENELUX CONSTRUCTION MARKET: VENDOR SHARE ANALYSIS
FIGURE 10 BENELUX CONSTRUCTION MARKET: END-USER SECTOR COVERAGE GRID
FIGURE 11 BENELUX CONSTRUCTION MARKET: SEGMENTATION
FIGURE 12 EIGHT SEGMENTS COMPRISE THE BENELUX CONSTRUCTION MARKET, BY CONSTRUCTION MATERIALS (2024)
FIGURE 13 EXECUTIVE SUMMARY
FIGURE 14 STRATEGIC DECISIONS
FIGURE 15 RAPID URBANIZATION AND GROWING POPULATIONS ARE EXPECTED TO DRIVE THE BENELUX CONSTRUCTION MARKET IN THE FORECAST PERIOD
FIGURE 16 THE CONCRETE SEGMENT IS EXPECTED TO ACCOUNT FOR THE LARGEST SHARE OF THE BENELUX CONSTRUCTION MARKET IN 2025 AND 2032
FIGURE 17 PESTEL ANALYSIS
FIGURE 18 PORTER’S FIVE FORCES
FIGURE 19 DRIVERS, RESTRAINTS, OPPORTUNITIES AND CHALLENGES OF BENELUX CONSTRUCTION MARKET
FIGURE 20 BENELUX CONSTRUCTION MARKET: BY CONSTRUCTION MATERIALS, 2024
FIGURE 21 BENELUX CONSTRUCTION MARKET, BY CONSTRUCTION TYPE, 2024
FIGURE 22 BENELUX CONSTRUCTION MARKET, BY PROJECT STAGE, 2024
FIGURE 23 BENELUX CONSTRUCTION MARKET: BY OWNERSHIP & INVESTMENT MODEL, 2024
FIGURE 24 BENELUX CONSTRUCTION MARKET, BY END-USE SECTOR, 2024
FIGURE 25 BENELUX CONSTRUCTION MARKET: COMPANY SHARE 2024 (%)
Benelux Construction Market, Supply Chain Analysis and Ecosystem Framework
To support market growth and help clients navigate the impact of geopolitical shifts, DBMR has integrated in-depth supply chain analysis into its Benelux Construction Market research reports. This addition empowers clients to respond effectively to global changes affecting their industries. The supply chain analysis section includes detailed insights such as Benelux Construction Market consumption and production by country, price trend analysis, the impact of tariffs and geopolitical developments, and import and export trends by country and HSN code. It also highlights major suppliers with data on production capacity and company profiles, as well as key importers and exporters. In addition to research, DBMR offers specialized supply chain consulting services backed by over a decade of experience, providing solutions like supplier discovery, supplier risk assessment, price trend analysis, impact evaluation of inflation and trade route changes, and comprehensive market trend analysis.
Data collection and base year analysis are done using data collection modules with large sample sizes. The stage includes obtaining market information or related data through various sources and strategies. It includes examining and planning all the data acquired from the past in advance. It likewise envelops the examination of information inconsistencies seen across different information sources. The market data is analysed and estimated using market statistical and coherent models. Also, market share analysis and key trend analysis are the major success factors in the market report. To know more, please request an analyst call or drop down your inquiry.
The key research methodology used by DBMR research team is data triangulation which involves data mining, analysis of the impact of data variables on the market and primary (industry expert) validation. Data models include Vendor Positioning Grid, Market Time Line Analysis, Market Overview and Guide, Company Positioning Grid, Patent Analysis, Pricing Analysis, Company Market Share Analysis, Standards of Measurement, Global versus Regional and Vendor Share Analysis. To know more about the research methodology, drop in an inquiry to speak to our industry experts.
Data Bridge Market Research is a leader in advanced formative research. We take pride in servicing our existing and new customers with data and analysis that match and suits their goal. The report can be customized to include price trend analysis of target brands understanding the market for additional countries (ask for the list of countries), clinical trial results data, literature review, refurbished market and product base analysis. Market analysis of target competitors can be analyzed from technology-based analysis to market portfolio strategies. We can add as many competitors that you require data about in the format and data style you are looking for. Our team of analysts can also provide you data in crude raw excel files pivot tables (Fact book) or can assist you in creating presentations from the data sets available in the report.


