
Brazil Peracetic Acid Market
Market Size in USD Million
 USD
34.44 Million
USD
60.77 Million
2025
2033
USD
34.44 Million
USD
60.77 Million
2025
2033
| 2026 - 2033 | |
| USD 34.44 Million | |
| USD 60.77 Million | |
| % | |
|
Brazil Peracetic Acid Market Overview
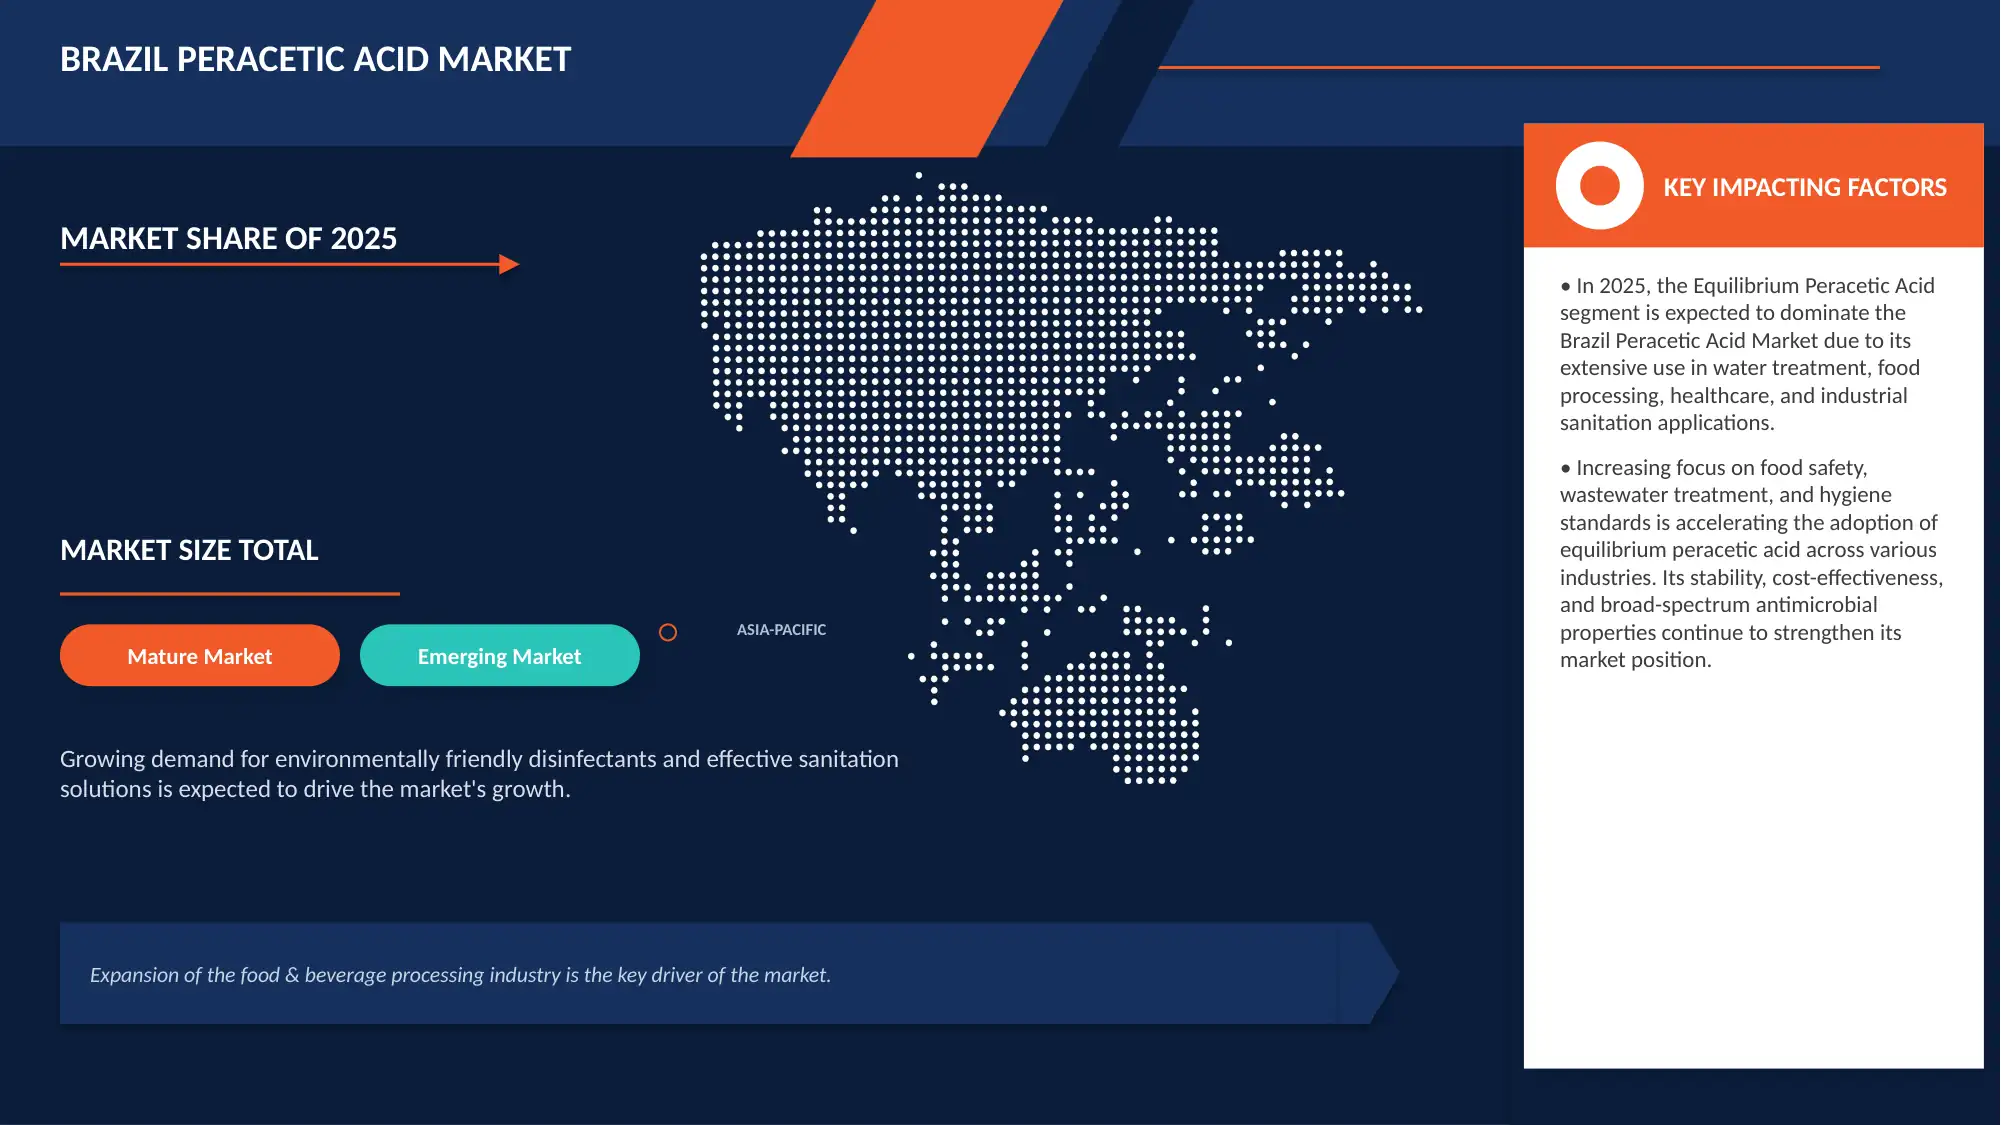
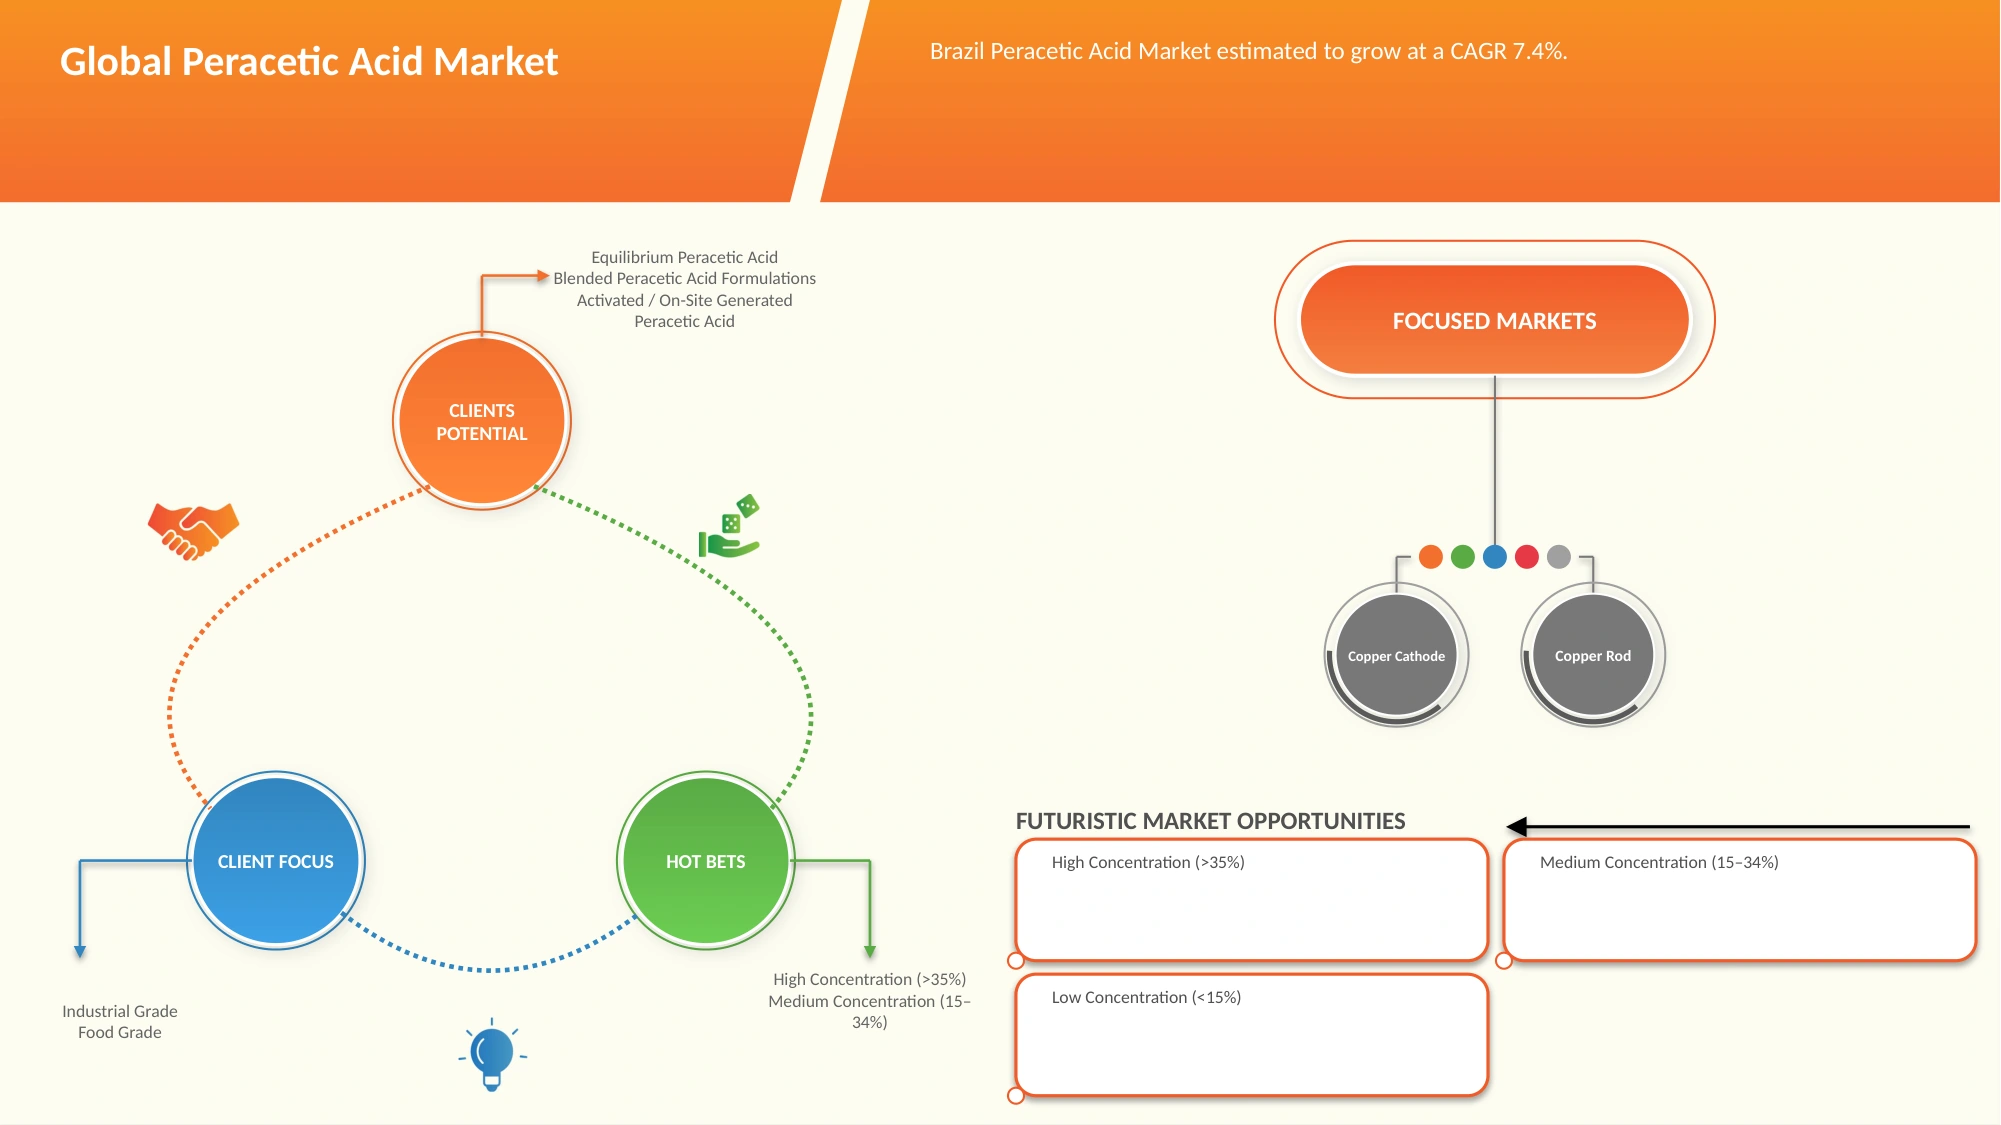
The Brazil peracetic acid market was valued at USD 34.44 million in 2025 and is projected to reach USD 60.77 million by 2033, growing at a CAGR of 7.4% from 2026 to 2033. The market is witnessing steady growth due to increasing demand for effective disinfection and sterilization solutions across food & beverage processing, healthcare, water treatment, and industrial applications. Rising awareness regarding hygiene standards, stringent regulations related to food safety, and the growing adoption of environmentally friendly antimicrobial agents are significantly driving market expansion in Brazil.
The increasing focus on controlling microbial contamination, coupled with the need for sustainable and efficient disinfectants, is encouraging industries to adopt peracetic acid-based solutions. In Brazil, the expanding food processing industry, rising wastewater treatment initiatives, and growing healthcare infrastructure are creating strong demand for peracetic acid as a powerful oxidizing agent with broad-spectrum antimicrobial properties. Additionally, advancements in formulation technologies and increased preference for low-residue disinfectants are supporting the adoption of peracetic acid across various end-use sectors.
Key Market Trends & Insights
- In 2026, Equilibrium Peracetic Acid segment is expected to dominate with a 68.26% market share due to its established commercial availability, consistent formulation quality, and wide acceptance across food processing, water treatment, healthcare, and industrial sanitation applications. Equilibrium PAA offers reliable antimicrobial performance, easier storage, and standardized concentration control, making it preferred by end users.
- The Activated / On-Site Generated Peracetic Acid segment is expected to be the fastest-growing product type in the Brazil peracetic acid market, expanding at a CAGR of 8.1% from 2026 to 2033. The growth of this segment is driven by increasing demand for cost-effective, sustainable, and highly efficient disinfection solutions across industries such as food processing, healthcare, wastewater treatment, and agriculture. On-site generation technology allows end users to produce peracetic acid as needed, reducing transportation, storage risks, and chemical handling requirements.
- In 2026, Industrial Grade segment is expected to dominate the market with a 58.66% market share due to its widespread usage across water treatment, industrial cleaning, sanitation, agriculture, pulp and paper, and manufacturing applications. Industrial-grade peracetic acid provides effective oxidation and antimicrobial performance at a cost-effective price point, making it suitable for large-volume consumption
- The Pharmaceutical / High Concentration Grade segment is expected to be fastest growing with a CAGR of 8.4% due to increasing demand for high-purity disinfectants in pharmaceutical manufacturing, healthcare facilities, and sterile processing environments. The growing emphasis on stringent hygiene standards, regulatory compliance, contamination control, and the need for advanced sterilization solutions is driving adoption of high-concentration peracetic acid formulations.
- In 2026, High Concentration (≥35%) segment is expected to dominate the market with a 45.35% market share due to its higher active ingredient content, strong oxidation capability, and effectiveness in demanding industrial applications. High-concentration peracetic acid is preferred in pharmaceutical manufacturing, water treatment, food processing, and specialized sanitation processes where efficient microbial control and reduced chemical usage are required.
Market Size & Forecast
- Market Value (2025): USD 34.44 million
- Expected Market Value (2033): USD 60.77 million
- Forecast CAGR (2026–2033): 7.4%
Report Scope and Brazil Peracetic Acid Market Segmentation
|
Attributes |
Peracetic Acid Key Market Insights |
|
Segments Covered |
|
|
Countries Covered |
· Brazil |
|
Key Market Players |
· Solvay S.A. (Belgium) · Evonik Industries (Germany) · Ecolab Inc. (United States) · Lanxess (Germany) · Solenis LLC (United States) · Kersia Group (France) · Mitsubishi Gas Chemical Company, Inc. (Japan) · Start Quimica (Brazil) · B. Braun (Germany) · LIMSEPT DO BRASIL INDÚSTRIA QUÍMICA LTDA (Brazil) · Rioquímica S.A. (Brazil) · Higex (Brazil) · Grow Química e Farmacêutica (Brazil) · AQUATOP (Brazil) · Christeyns N.V. (Belgium) · Arxada AG (Switzerland) · AEB Group (Italy) · Mercotech (Brazil) · Itaquímica Indústria e Comércio S/A (Brazil) · VIC Pharma (Brazil) · SPARTAN DO BRASIL LTDA. (Brazil) · ABC Química (Brazil) · Alloxy Especialidades Químicas (Brazil) · Nippon Chemical (Japan) · Ecoper Química Ltda. (Brazil) · Ecomaster (Brazil) · Ares Clean (Brazil) · OLEAK (Brazil) · BELLTYPE (Brazil) · Mundial Química do Brasil (Brazil) · Newdrop Química Ltda. (Brazil) · Mustang Pluron Química Ltda. (Brazil) · Sandet Química Industrial (Brazil) · INNOVA CORPORATE (Brazil) |
|
Market Opportunities |
· Rise in demand for High-Purity Peracetic Acid from Pharmaceutical and Healthcare sector · Expansion of Green Biosecurity Practices Across Agriculture and Aquaculture Industries |
|
Value Added Data Infosets |
In addition to the insights on market scenarios such as market value, growth rate, segmentation, geographical coverage, and major players, the market reports curated by the Data Bridge Market Research also include in-depth expert analysis, geographically represented company-wise production and capacity, network layouts of distributors and partners, detailed and updated price trend analysis and deficit analysis of supply chain and demand. |
Brazil Peracetic Acid Market Trends
Trend: Rising Adoption of Sustainable Disinfection Solutions
Industries across Brazil are increasingly adopting peracetic acid-based disinfection solutions due to growing emphasis on food safety, hygiene standards, and environmentally sustainable chemical alternatives. Food and beverage processors, healthcare facilities, and water treatment operators are shifting toward peracetic acid because of its strong antimicrobial effectiveness, rapid action, and ability to break down into environmentally friendly by-products such as water, oxygen, and acetic acid. The rising implementation of strict sanitation regulations and increasing awareness regarding chemical residue reduction are further supporting the use of peracetic acid as a preferred disinfectant across multiple end-use sectors.
Brazil Peracetic Acid Market Dynamics
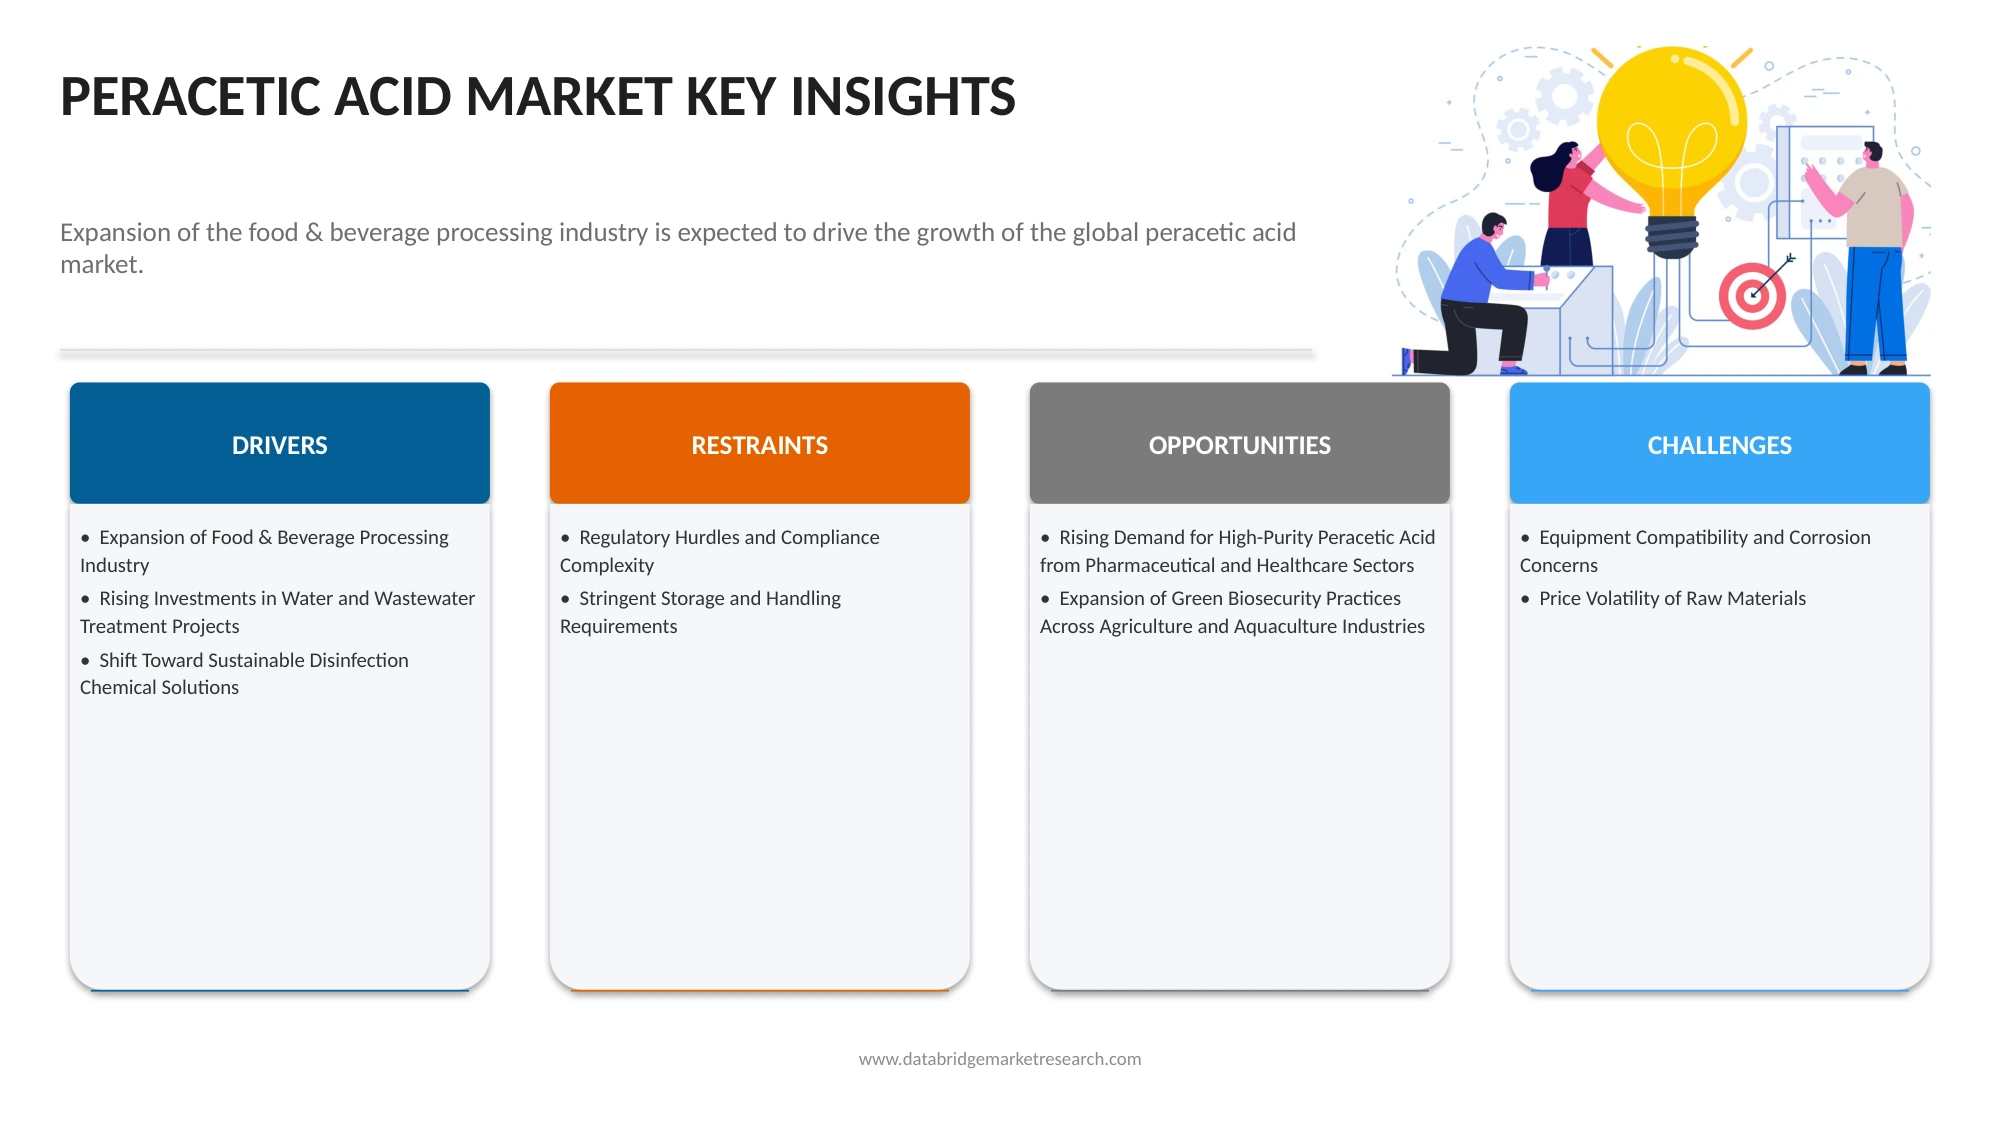
Key Market Driver: Expansion of food & beverage processing industry
The Brazil Peracetic Acid Market is growing because industries are increasingly looking for effective and environmentally friendly disinfection solutions. The expansion of the food and beverage processing industry is creating strong demand for peracetic acid, as manufacturers need reliable sanitation products to maintain food safety and meet export quality standards. At the same time, investments in water and wastewater treatment projects are increasing across Brazil, supporting the use of peracetic acid for water disinfection and pathogen control. Another important factor is the shift toward sustainable disinfection chemicals. Peracetic acid is gaining popularity because it breaks down into environmentally safe substances and leaves minimal harmful residues compared to some traditional disinfectants. Growing awareness of hygiene, stricter safety requirements, and the need for sustainable industrial practices are encouraging companies and public utilities to adopt peracetic acid solutions. As industries continue to modernize their operations and focus on safety, efficiency, and environmental responsibility, the demand for peracetic acid is expected to remain strong across multiple sectors in Brazil.
In May 2024, Nestlé announced an investment of approximately USD 196.5 million in Brazil through 2026 to expand its Nescafé production capacity and strengthen its presence in the growing coffee market. The company expects coffee sales in Brazil to increase by up to 15% annually, reflecting rising consumer demand and continued expansion of the food and beverage processing sector. This growth is expected to increase the need for effective sanitation and hygiene solutions, creating opportunities for greater adoption of peracetic acid in food processing and manufacturing facilities.
Key Restraint/Challenge: Stringent storage and handling requirements
Stringent storage and handling requirements are a significant restraint for the Brazil Peracetic Acid Market. Peracetic acid is a highly effective disinfectant, but it is also a reactive and corrosive chemical that requires careful management throughout its lifecycle. To ensure safety, companies must follow strict guidelines for storage, transportation, packaging, and usage. Specialized storage tanks, corrosion-resistant equipment, proper ventilation systems, and trained personnel are often required to handle the chemical safely. Brazilian regulations related to workplace safety, environmental protection, and hazardous chemical management require businesses to implement strict operational procedures. Failure to follow these requirements can result in safety risks, product degradation, environmental incidents, or regulatory penalties. As a result, companies often need to invest additional resources in employee training, safety equipment, monitoring systems, and infrastructure upgrades. These requirements can be particularly challenging for small and medium-sized businesses that may have limited financial and technical capabilities. In addition, transportation and distribution of peracetic acid require compliance with hazardous material regulations, which can increase logistics costs. Although these measures are necessary to protect workers and the environment, they can increase operational complexity and limit wider adoption of peracetic acid across some industries in Brazil.
In September 2024 – Brazil’s Ministry of Labor and Employment continued enforcement of NR-26 workplace safety regulations, requiring companies to provide worker training, hazard labeling, protective equipment, and controlled storage conditions for dangerous chemicals. These requirements increase operational complexity for chemical users
Key Market Opportunity: Rise in demand for high-purity peracetic acid from pharmaceutical and healthcare sector
The rising demand for high-purity peracetic acid from the pharmaceutical and healthcare sector is creating a significant opportunity for the Brazil Peracetic Acid Market. Brazil has one of the largest healthcare systems in Latin America and continues to invest in hospitals, pharmaceutical manufacturing, biotechnology facilities, and medical research centers. As healthcare providers and drug manufacturers focus on maintaining strict hygiene and contamination control standards, the need for effective sterilization and disinfection solutions is increasing.
High-purity peracetic acid is widely used for disinfecting medical equipment, cleanrooms, pharmaceutical production areas, and water systems because it is highly effective against bacteria, viruses, fungi, and spores. It is also valued for leaving minimal harmful residues after use, making it suitable for sensitive healthcare and pharmaceutical environments.
In recent years, Brazil has seen growing investments in healthcare infrastructure, local pharmaceutical production, and advanced medical services. Regulatory agencies and healthcare institutions are placing greater emphasis on infection prevention and quality control, further supporting the use of reliable sterilization technologies. As pharmaceutical manufacturing and healthcare services continue to expand across the country, the demand for high-purity peracetic acid is expected to increase, creating new growth opportunities for suppliers and manufacturers operating in Brazil.
Brazil Peracetic Acid Market Scope
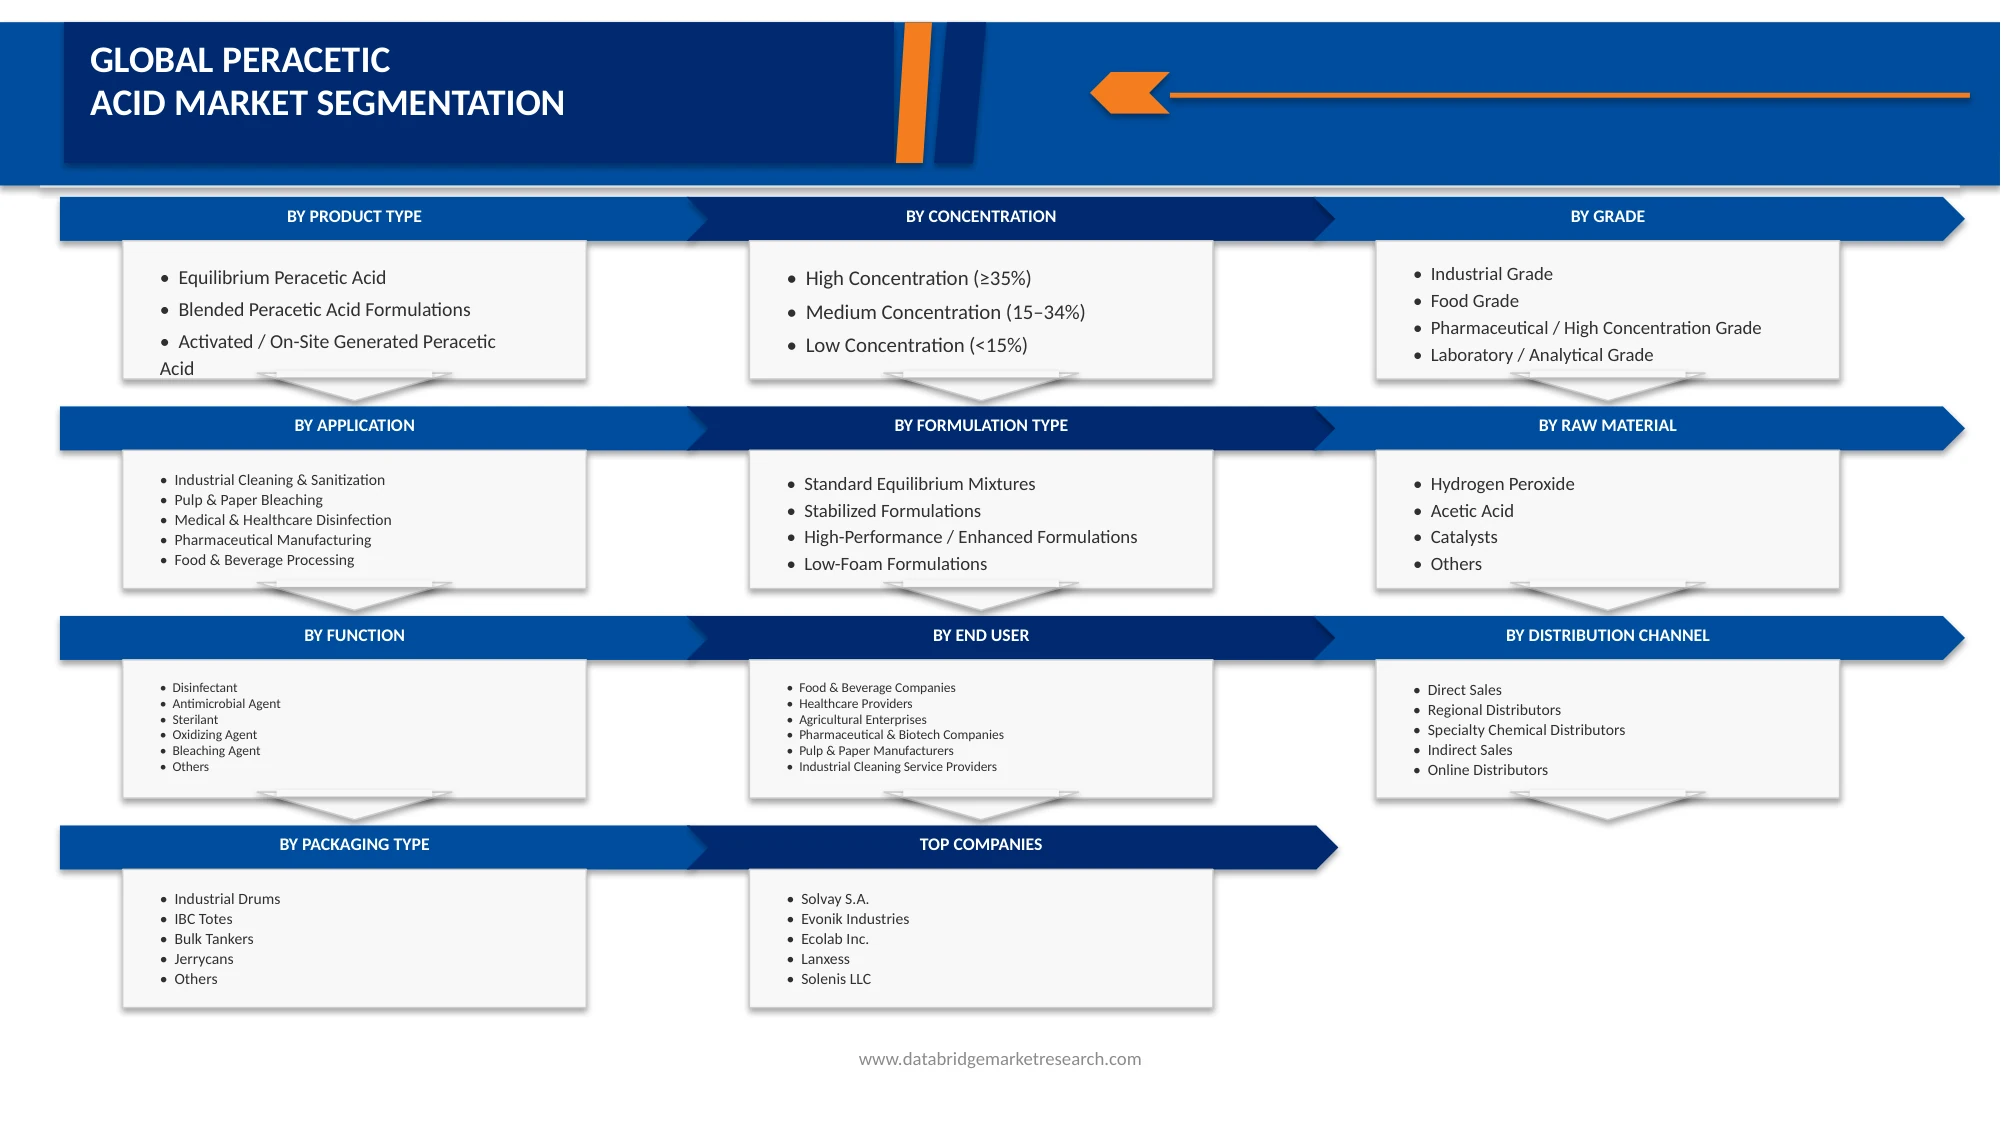
Brazil Peracetic acid market is categorized into ten notable segments which are based on product type, grade, concentration, formulation type, raw material, function, application, end user, distribution channel, and packaging type.
- By Product Type
On the basis of product type, the market is segmented into Equilibrium Peracetic Acid, Blended Peracetic Acid Formulations, Activated / On-Site Generated Peracetic Acid. In 2026, Equilibrium Peracetic Acid segment is expected to dominate with a 68.26% market share. It is expected to reach USD 40,877.19 thousand by 2033, due to its established commercial availability, consistent formulation quality, and wide acceptance across food processing, water treatment, healthcare, and industrial sanitation applications. Equilibrium PAA offers reliable antimicrobial performance, easier storage, and standardized concentration control, making it preferred by end users. Additionally, its compatibility with existing disinfection systems and availability through established chemical distribution networks support its leading market position.
The Activated / On-Site Generated Peracetic Acid segment is expected to be the fastest growing with a CAGR of 8.1%, due to increasing demand for cost-effective and sustainable disinfection solutions, growing preference for on-demand chemical generation to reduce storage and transportation risks, and rising adoption in applications requiring fresh and highly active antimicrobial solutions. On-site generation systems help minimize chemical waste, improve operational safety, and provide better control over concentration and dosing, supporting their increasing use across water treatment, food processing, healthcare, and industrial sanitation sectors.
- By Grade
On the basis of grade, the market is segmented into Industrial Grade, Food Grade, Pharmaceutical / High Concentration Grade, Laboratory / Analytical Grade Country. In 2026, Industrial Grade segment is expected to dominate the market with a 58.66% market share. It is expected to reach USD 35,052.23 thousand by 2033, due to its widespread usage across water treatment, industrial cleaning, sanitation, agriculture, pulp and paper, and manufacturing applications. Industrial-grade peracetic acid provides effective oxidation and antimicrobial performance at a cost-effective price point, making it suitable for large-volume consumption. Additionally, increasing demand for industrial hygiene, wastewater treatment, and sustainable disinfection solutions supports the strong adoption of industrial-grade formulations across Brazil.
The Pharmaceutical / High Concentration Grade segment is expected to be fastest growing with a CAGR of 8.4% due to increasing demand for high-purity disinfectants in pharmaceutical manufacturing, healthcare facilities, and sterile processing environments. The growing emphasis on stringent hygiene standards, regulatory compliance, contamination control, and the need for advanced sterilization solutions is driving adoption of high-concentration peracetic acid formulations. Additionally, rising pharmaceutical production activities and expansion of biopharmaceutical and medical device manufacturing facilities are supporting the growth of this segment across Brazil.
- By Concentration
On the basis of concentration, the market is segmented into High Concentration (≥35%), Medium Concentration (15–34%), Low Concentration (<15%). In 2026, High Concentration (≥35%) segment is expected to dominate the market with a 45.35% market share. It is expected to reach USD 28,167.93 thousand by 2033, due to its higher active ingredient content, strong oxidation capability, and effectiveness in demanding industrial applications. High-concentration peracetic acid is preferred in pharmaceutical manufacturing, water treatment, food processing, and specialized sanitation processes where efficient microbial control and reduced chemical usage are required. Additionally, its ability to be diluted according to specific application requirements provides operational flexibility, supporting greater adoption among industrial users.
The High concentration segment is expected to be fastest growing with a CAGR of 7.7% due to increasing demand for highly effective and concentrated disinfection solutions across pharmaceutical, food processing, healthcare, and industrial applications. The rising focus on reducing chemical consumption, improving operational efficiency, and achieving stronger microbial control with lower application volumes is driving the adoption of high-concentration formulations. Additionally, growing investments in advanced sanitation systems and stringent hygiene requirements across end-use industries are supporting the rapid growth of this segment.
- By Formulation Type
On the basis of formulation type, the market is segmented into Standard Equilibrium Mixtures, Stabilized Formulations, High-Performance / Enhanced Formulations, Low-Foam Formulations. In 2026, Standard Equilibrium Mixtures segment is expected to dominate the market with a 42.73% market share, due to its widespread commercial availability, cost-effectiveness, and established usage across multiple industries. These formulations provide a reliable balance of peracetic acid, hydrogen peroxide, acetic acid, and water, ensuring consistent antimicrobial performance for food processing, water treatment, and industrial sanitation applications. Their compatibility with existing disinfection systems, ease of handling, and broad acceptance among end users support their leading position in the Brazil peracetic acid market.
The High-Performance / Enhanced Formulations segment is expected to be fastest growing with a CAGR of 8.1% due to increasing demand for advanced disinfection solutions offering improved antimicrobial efficiency, faster reaction rates, and enhanced performance under challenging operating conditions. These formulations are designed to provide superior stability, optimized active ingredient delivery, and better effectiveness against a broad range of microorganisms, supporting their adoption in pharmaceutical, food processing, healthcare, and industrial applications. Additionally, the growing focus on high-quality sanitation standards and advanced treatment technologies is accelerating the demand for enhanced peracetic acid formulations across Brazil.
- By Raw Material
On the basis of raw material, the market is segmented into Hydrogen Peroxide, Acetic Acid, Catalysts, Others. The Catalysts segment is further sub segmented into Sulfuric Acid-Based, and Other Catalysts. In 2026, Hydrogen Peroxide is expected to dominate the market with a 48.82% market share and is fastest growing with a CAGR of 7.7%, due to its essential role as the primary oxidizing component in peracetic acid production. Hydrogen peroxide directly reacts with acetic acid to generate peracetic acid, making it a critical raw material across commercial formulations. Increasing demand for effective disinfection solutions in food processing, water treatment, healthcare, and industrial sanitation applications is supporting higher consumption of hydrogen peroxide-based formulations. Additionally, its availability through established chemical supply chains strengthens its leading position.
- By Function
On the basis of function, the market is segmented into Disinfectant, Antimicrobial Agent, Sterilant, Oxidizing Agent, Bleaching Agent, Others. In 2026, Disinfectant segment is expected to dominate the market with a 34.20% market share, due to the extensive use of peracetic acid as a broad-spectrum disinfectant across food processing, water treatment, healthcare, and industrial sanitation applications. Its ability to effectively eliminate bacteria, viruses, fungi, and other microorganisms, along with rapid action and low harmful residue formation, supports its increasing adoption. Additionally, growing hygiene standards, infection control requirements, and demand for sustainable disinfection solutions are driving the dominance of this segment in Brazil.
The Sterilant segment is expected to be fastest growing with a CAGR of 8.2% due to increasing demand for high-level sterilization solutions in pharmaceutical manufacturing, healthcare facilities, medical device processing, and other critical applications requiring effective elimination of microorganisms. Peracetic acid provides strong sporicidal activity, rapid sterilization performance, and minimal toxic residues compared with conventional sterilants, making it suitable for sensitive environments. Additionally, rising regulatory focus on contamination control, sterile production practices, and advanced infection prevention measures is supporting the rapid growth of the sterilant segment in Brazil.
- By Application
On the basis of application, the market is segmented into Food & Beverage Processing, Water Treatment, Industrial Cleaning & Sanitization, Pulp & Paper Bleaching, Medical & Healthcare Disinfection, Pharmaceutical Manufacturing, Agriculture, Other Industrial Applications. In 2026, Food & Beverage Processing segment is expected to dominate the market with a 30.32% market share, due to the extensive use of peracetic acid as an effective sanitizer for meat and poultry processing, dairy operations, beverage production, and food-contact surfaces. Its rapid antimicrobial action, ability to control pathogens, and minimal harmful residues make it preferred by food manufacturers. Additionally, increasing food safety standards, hygiene requirements, and demand for chemical solutions supporting export-quality processing are driving adoption across Brazil’s food and beverage industry.
The Water Treatment segment is expected to be fastest growing segment with a CAGR of 8.4% due to increasing demand for effective and environmentally friendly water disinfection solutions across municipal, industrial, and wastewater treatment applications. Peracetic acid is gaining preference due to its strong oxidation capability, rapid microbial inactivation, effectiveness at low concentrations, and minimal formation of harmful disinfection by-products compared with traditional chemicals. Additionally, rising concerns regarding water quality, stricter wastewater regulations, and growing investments in sustainable water management infrastructure are supporting the rapid growth of this segment in Brazil.
- By End User
On the basis of end user, the market is segmented into Food & Beverage Companies, Water Utilities, Healthcare Providers, Agricultural Enterprises, Pharmaceutical & Biotech Companies, Pulp & Paper Manufacturers, Industrial Cleaning Service Providers, Laboratories & Research Institutes, Others. In 2026, Food & Beverage Companies segment is expected to dominate the market with a 31.48% market share, due to the extensive requirement for effective sanitation solutions across food processing operations, including meat and poultry processing, dairy production, and beverage manufacturing. Peracetic acid is widely preferred for its strong antimicrobial activity, rapid disinfection capability, and low residue formation, supporting food safety compliance. Additionally, Brazil’s large food processing industry and increasing hygiene standards are driving higher adoption of peracetic acid among food and beverage manufacturers.
The Water Utilities segment is expected to be fastest growing with a CAGR of 8.6% due to increasing demand for efficient and sustainable water disinfection solutions across municipal water supply, wastewater treatment, and industrial water management applications. Peracetic acid is gaining adoption among water utilities due to its rapid microbial inactivation, strong oxidation performance, effectiveness against a broad range of pathogens, and lower formation of harmful disinfection by-products compared with traditional disinfectants. Additionally, growing concerns regarding water quality, stricter environmental regulations, and investments in wastewater treatment infrastructure are supporting the rapid growth of this segment in Brazil.
- By Distribution Channel
On the basis of distribution channel, the market is segmented into Direct Sales, Regional Distributors, Specialty Chemical Distributors, Indirect Sales, Online Distributors. In 2026, Direct Sales segment is expected to dominate the market with a 42.83% market share, due to the preference of large industrial users for direct procurement from manufacturers to ensure consistent product quality, technical support, and reliable supply availability. Direct sales enable peracetic acid suppliers to provide customized solutions, application guidance, bulk pricing benefits, and stronger customer relationships with end users such as food processors, water utilities, pharmaceutical companies, and healthcare facilities. Additionally, direct supply agreements help manufacturers improve supply chain control and reduce dependency on intermediaries.
The Online Distributors segment is expected to be the fastest growing segment with a CAGR of 8.1% due to increasing digitalization of chemical procurement processes, growing adoption of online B2B platforms, and rising preference for convenient purchasing channels among small and medium-sized end users. Online distributors provide easier product comparison, wider supplier accessibility, faster ordering processes, and improved supply chain transparency. Additionally, the expansion of e-commerce platforms for industrial chemicals and the growing need for efficient procurement solutions are supporting the rapid growth of this segment in Brazil.
- By Packaging Type
On the basis of packaging type, the market is segmented into Industrial Drums, IBC Totes, Bulk Tankers, Jerrycans, Others. In 2026, Industrial Drums segment is expected to dominate the market with a 41.62% market share, due to its widespread use for safe storage, transportation, and handling of peracetic acid across industrial applications. Industrial drums, particularly chemical-resistant HDPE drums, provide effective protection against product degradation, leakage, and contamination while meeting hazardous chemical handling requirements. Their suitability for medium-volume distribution makes them highly preferred by food processing facilities, water treatment operators, healthcare providers, and industrial users. Additionally, established supply chains and compatibility with existing storage systems support the continued dominance of industrial drums in Brazil.
The IBC Totes segment is expected to be fastest growing segment with a CAGR of 8.1% due to increasing demand for efficient bulk chemical storage and transportation solutions across industrial and commercial applications. IBC totes offer advantages such as higher storage capacity, reduced handling requirements, improved logistics efficiency, and cost savings compared with smaller packaging formats. Their durable construction, space-efficient design, and suitability for large-volume peracetic acid handling are driving adoption among food processing companies, water utilities, pharmaceutical manufacturers, and industrial users. Additionally, the focus on safer chemical transportation and optimized supply chain operations is supporting the growth of this segment in Brazil.
Brazil Peracetic Acid Market Share
The driving simulators industry is primarily led by well-established companies, including:
- Solvay S.A. (Belgium)
- Evonik Industries (Germany)
- Ecolab Inc. (United States)
- Lanxess (Germany)
- Solenis LLC (United States)
- Kersia Group (France)
- Mitsubishi Gas Chemical Company, Inc. (Japan)
- Start Quimica (Brazil)
- Braun (Germany)
- LIMSEPT DO BRASIL INDÚSTRIA QUÍMICA LTDA (Brazil)
- Rioquímica S.A. (Brazil)
- Higex (Brazil)
- Grow Química e Farmacêutica (Brazil)
- AQUATOP (Brazil)
- Christeyns N.V. (Belgium)
- Arxada AG (Switzerland)
- AEB Group (Italy)
- Mercotech (Brazil)
- Itaquímica Indústria e Comércio S/A (Brazil)
- VIC Pharma (Brazil)
- SPARTAN DO BRASIL LTDA. (Brazil)
- ABC Química (Brazil)
- Alloxy Especialidades Químicas (Brazil)
- Nippon Chemical (Japan)
- Ecoper Química Ltda. (Brazil)
- Ecomaster (Brazil)
- Ares Clean (Brazil)
- OLEAK (Brazil)
- BELLTYPE (Brazil)
- Mundial Química do Brasil (Brazil)
- Newdrop Química Ltda. (Brazil)
- Mustang Pluron Química Ltda. (Brazil)
- Sandet Química Industrial (Brazil)
- INNOVA CORPORATE (Brazil)
Latest Developments in Brazil Peracetic Acid Market
- In October, Solvay, through its joint venture Peróxidos do Brasil, announced the construction of a new myH₂O₂ satellite hydrogen peroxide plant in Inocência, Brazil, to support Arauco’s Sucuriú Project, one of the world’s largest upcoming pulp mills. The on-site facility will have an annual production capacity of 25,000 tons and will supply hydrogen peroxide used in pulp bleaching and water treatment, while reducing transportation requirements and environmental impact through localized production. The project is expected to enhance operational efficiency, supply reliability, and sustainability for Arauco’s US 4.6 billion pulp mill investment.
- In March, EVONIK INDUSTRIES AG expanded its strategic distribution partnership with IMCD for VISIOMER Specialty Methacrylates in the U.S., extending an existing collaboration and enhancing customer access to specialty methacrylate solutions across the North American market.
- In November, Ecolab Life Sciences launched Klercide Rapid Sporicide, a new peracetic acid and hydrogen peroxide–based disinfectant designed for pharmaceutical cleanroom environments. The product improves microbial control by targeting resistant spores while reducing odor, residue, and equipment corrosion, enabling faster and more efficient cleanroom disinfection cycles. This strengthens Ecolab’s position in high-value pharma contamination control by improving operational efficiency, reducing downtime, and increasing adoption in regulated sterile manufacturing facilities.
- In May, LANXESS confirmed its full-year EBITDA guidance of EUR 450–550 million and highlighted positive market momentum since March, supported by improved customer demand and strengthened supply-chain reliability across key business segments.
- In June 2024, Solenis announced the acquisition of Aqua ChemPacs, a U.S.-based manufacturer of pre-portioned, concentrated cleaning and disinfection chemical packs. The acquisition expands Solenis’ Diversey portfolio with innovative, low-carbon-footprint cleaning pod technology that enables on-site production of cleaning solutions while reducing plastic waste, transportation costs, and storage requirements. Aqua ChemPacs’ dissolvable and environmentally friendly products are widely used across restaurants, retail outlets, healthcare facilities, educational institutions, and event venues worldwide. This acquisition strengthens Solenis’ sustainable cleaning solutions portfolio and enhances its ability to serve institutional customers with environmentally responsible and cost-efficient hygiene products.
SKU-

- Interactive Data Analysis Dashboard
- Company Analysis Dashboard for high growth potential opportunities
- Research Analyst Access for customization & queries
- Competitor Analysis with Interactive dashboard
- Latest News, Updates & Trend analysis
- Harness the Power of Benchmark Analysis for Comprehensive Competitor Tracking
Table of Content
1 INTRODUCTION
1.1 OBJECTIVES OF THE STUDY
1.2 MARKET DEFINITION
1.3 OVERVIEW
1.4 LIMITATIONS
1.5 MARKETS COVERED
2 MARKET SEGMENTATION
2.1 MARKETS COVERED
2.2 GEOGRAPHICAL SCOPE
2.3 YEARS CONSIDERED FOR THE STUDY
2.4 CURRENCY AND PRICING
2.5 DBMR TRIPOD DATA VALIDATION MODEL
2.6 MULTIVARIATE MODELING
2.7 PRIMARY INTERVIEWS WITH KEY OPINION LEADERS
2.8 DBMR MARKET POSITION GRID
2.9 MARKET APPLICATION COVERAGE GRID
2.1 DBMR VENDOR SHARE ANALYSIS
2.11 SECONDARY SOURCES
2.12 ASSUMPTIONS
3 EXECUTIVE SUMMARY
4 PREMIUM INSIGHTS
4.1 PESTLE ANALYSIS
4.1.1 POLITICAL FACTOR:
4.1.1.1 GOVERNMENT REGULATIONS SUPPORTING DISINFECTION AND HYGIENE STANDARDS
4.1.1.2 PUBLIC INVESTMENTS IN WATER AND WASTEWATER INFRASTRUCTURE
4.1.1.3 TRADE POLICIES AND INDUSTRIAL DEVELOPMENT SUPPORT
4.1.1.4 ENVIRONMENTAL AND PUBLIC HEALTH POLICY INITIATIVES
4.1.2 ECONOMICS FACTOR:
4.1.2.1 ECONOMIC GROWTH AND INDUSTRIAL EXPANSION
4.1.2.2 RISING INVESTMENTS IN WATER AND WASTEWATER INFRASTRUCTURE
4.1.2.3 INFLATION AND INTEREST RATE PRESSURE
4.1.2.4 GROWTH IN FOOD PROCESSING AND HEALTHCARE INDUSTRIES
4.1.2.5 PRIVATE SECTOR PARTICIPATION AND INFRASTRUCTURE FUNDING
4.1.3 SOCIAL FACTORS:
4.1.3.1 RISING AWARENESS ABOUT HYGIENE AND PUBLIC HEALTH
4.1.3.2 GROWING FOCUS ON FOOD SAFETY
4.1.3.3 INCREASING DEMAND FOR CLEAN WATER AND BETTER SANITATION
4.1.4 TECHNOLOGICAL FACTOR:
4.1.4.1 ADOPTION OF ADVANCED DISINFECTION TECHNOLOGIES
4.1.4.2 GROWTH OF AUTOMATED DOSING AND MONITORING SYSTEMS
4.1.4.3 DEVELOPMENT OF IMPROVED AND ECO-FRIENDLY FORMULATIONS
4.1.5 LEGAL FACTORS:
4.1.5.1 STRICT ANVISA REGULATIONS FOR DISINFECTANTS AND SANITIZING PRODUCTS
4.1.5.2 WORKPLACE SAFETY AND CHEMICAL HANDLING LAWS
4.1.5.3 ENVIRONMENTAL COMPLIANCE AND CHEMICAL REPORTING REQUIREMENTS
4.1.6 ENVIRONMENTAL FACTORS:
4.1.6.1 INCREASING FOCUS ON SUSTAINABLE AND ECO-FRIENDLY DISINFECTION SOLUTIONS
4.1.6.2 EXPANSION OF WASTEWATER TREATMENT AND WATER REUSE PROJECTS
4.1.6.3 STRICT ENVIRONMENTAL COMPLIANCE FOR CHEMICAL MANUFACTURING
4.1.7 CONCLUSION:
4.2 PORTER’S FIVE FORCES ANALYSIS
4.2.1 INTRODUCTION
4.2.2 INTENSITY OF COMPETITIVE RIVALRY (HIGH)
4.2.3 BARGAINING POWER OF BUYERS – HIGH
4.2.4 THREAT OF NEW ENTRANTS – MODERATE TO LOW
4.2.5 THREAT OF SUBSTITUTE – MODERATE
4.2.6 BARGAINING POWER OF SUPPLIERS – MODERATE
4.2.7 CONCLUSION
4.3 SUPPLY CHAIN ANALYSIS –
4.3.1 INTRODUCTION
4.3.2 RAW MATERIAL SUPPLIERS
4.3.3 PERACETIC ACID MANUFACTURERS (PRODUCTION, FORMULATION & BLENDING)
4.3.4 PACKAGING, STORAGE & DISTRIBUTION PROVIDERS
4.3.5 END-USE INDUSTRIES (WATER & WASTEWATER TREATMENT, FOOD & BEVERAGE PROCESSING, HEALTHCARE, PULP & PAPER, AGRICULTURE)
4.3.6 CONCLUSION
4.4 VALUE CHAIN ANALYSIS
4.4.1 RAW MATERIAL SUPPLIERS (42%)
4.4.2 PERACETIC ACID MANUFACTURERS (25%)
4.4.3 FORMULATORS & BLENDERS (10%)
4.4.4 DISTRIBUTORS & LOGISTICS PROVIDERS (8%)
4.4.5 END-USE INDUSTRIES - FOOD & BEVERAGE, WATER TREATMENT, HEALTHCARE, PULP & PAPER, AGRICULTURE (12%)
4.4.6 CONCLUSION
4.5 COST ANALYSIS BREAKDOWN
4.5.1 RAW MATERIAL COSTS (45–55% OF TOTAL PRODUCT COST)
4.5.2 MANUFACTURING AND PROCESSING COSTS (12–18% OF TOTAL PRODUCT COST)
4.5.3 PACKAGING AND CONTAINER COSTS (8–12% OF TOTAL PRODUCT COST)
4.5.4 LOGISTICS, TRANSPORTATION, AND STORAGE COSTS (10–15% OF TOTAL PRODUCT COST)
4.5.5 REGULATORY COMPLIANCE AND SAFETY COSTS (5–8% OF TOTAL PRODUCT COST)
4.5.6 DISTRIBUTOR MARGIN, SALES, AND ADMINISTRATIVE COSTS (10–15% OF TOTAL PRODUCT COST)
4.6 PATENT ANALYSIS
4.6.1 GLOBAL PATENT FILING LANDSCAPE
4.6.2 COMPETITIVE PATENT POSITIONING OF LEADING COMPANIES
4.6.3 TECHNOLOGICAL INNOVATION TRENDS AND PATENT CLASSIFICATIONS
4.6.4 PATENT PUBLICATION TRENDS AND FUTURE INNOVATION OUTLOOK
4.7 PRICING ANALYSIS
4.8 PROFIT MARGINS SCENARIO
4.8.1 MANUFACTURER GROSS PROFIT MARGIN (20–30%)
4.8.2 OPERATING PROFIT MARGIN SCENARIO (10–18%)
4.8.3 DISTRIBUTOR AND CHANNEL PARTNER MARGINS (8–15%)
4.8.4 HIGHER MARGIN POTENTIAL FOR SPECIALTY AND HIGH-PURITY FORMULATIONS (25–35%)
4.8.5 MARGIN PRESSURE FROM RAW MATERIAL PRICE VOLATILITY
4.8.6 LONG-TERM MARGIN EXPANSION DRIVEN BY VALUE-ADDED APPLICATIONS
4.9 RAW MATERIAL COVERAGE
4.9.1 INTRODUCTION
4.9.2 HYDROGEN PEROXIDE
4.9.2.1 BRAZIL SUPPLY CHAIN DYNAMICS FOR HYDROGEN PEROXIDE
4.9.2.2 IMPACT ON PRODUCT QUALITY AND MARKET SEGMENTATION
4.9.2.3 SUSTAINABILITY AND FUTURE OUTLOOK
4.9.2.4 KEY FACTORS EVALUATED DURING HYDROGEN PEROXIDE PROCUREMENT
4.9.3 ACETIC ACID
4.9.3.1 BRAZIL'S ACETIC ACID SUPPLY CHAIN LANDSCAPE
4.9.3.2 ROLE OF ACETIC ACID IN PRODUCT QUALITY AND MANUFACTURING EFFICIENCY
4.9.3.3 COST STRUCTURE AND ECONOMIC IMPACT
4.9.3.4 ACETIC ACID DEMAND ACROSS KEY END-USE APPLICATIONS
4.9.3.5 SUSTAINABILITY AND ENVIRONMENTAL CONSIDERATIONS
4.9.3.6 KEY PROCUREMENT CRITERIA FOR ACETIC ACID
4.9.4 CATALYSTS
4.9.4.1 CATALYSTS ARE ESSENTIAL IN PERACETIC ACID MANUFACTURING
4.9.4.2 SULFURIC ACID-BASED CATALYSTS
4.9.4.2.1 AVAILABILITY AND SUPPLY DYNAMICS IN BRAZIL
4.9.4.2.2 INFLUENCE ON MANUFACTURING EFFICIENCY AND PRODUCTION ECONOMICS
4.9.4.2.3 PRODUCT STABILITY AND QUALITY CONSIDERATIONS
4.9.4.2.4 REGULATORY AND SAFETY CONSIDERATIONS
4.9.4.2.5 KEY ADVANTAGES OF SULFURIC ACID-BASED CATALYSTS
4.9.4.3 OTHER CATALYSTS
4.9.4.3.1 TYPES OF ALTERNATIVE CATALYSTS USED IN PERACETIC ACID MANUFACTURING
4.9.4.3.2 IMPORTANCE IN PHARMACEUTICAL AND HEALTHCARE APPLICATIONS
4.9.4.3.3 IMPACT ON PRODUCT STABILITY AND SHELF LIFE
4.9.4.3.4 CONTRIBUTION TO MANUFACTURING EFFICIENCY AND YIELD OPTIMIZATION
4.9.4.3.5 CHALLENGES LIMITING WIDESPREAD ADOPTION
4.9.4.3.6 KEY ADVANTAGES OF ALTERNATIVE CATALYSTS
4.9.5 OTHERS
4.9.5.1 STABILIZERS
4.9.5.2 CHELATING AGENTS
4.9.5.3 CORROSION INHIBITORS
4.9.5.4 LOW-FOAM ADDITIVES
4.9.5.5 OVERALL STRATEGIC IMPORTANCE OF AUXILIARY RAW MATERIALS
4.9.6 CONCLUSION
4.1 BRAND OUTLOOK
4.10.1 INTRODUCTION
4.10.2 BRAND COMPARATIVE ANALYSIS
4.10.3 COMPANY-WISE COMPETITIVE ASSESSMENT
4.10.3.1 SOLVAY S.A.
4.10.3.2 ALLOXY ESPECIALIDADES QUÍMICAS
4.10.3.3 CHRISTEYNS NV
4.10.3.4 DINÂMICA QUÍMICA CONTEMPORÂNEA
4.10.3.5 ECOLAB INC.
4.10.4 KEY MARKET INSIGHTS
4.10.4.1 PRODUCT-BASED INSIGHTS
4.10.4.2 APPLICATION-BASED INSIGHTS
4.10.4.3 COMPETITIVE INSIGHTS
4.10.4.4 FUTURE GROWTH INDICATORS
4.10.5 CONCLUSION
4.11 CONSUMER BUYING BEHAVIOR
4.11.1 INTRODUCTION
4.11.2 FOOD & BEVERAGE PROCESSORS
4.11.3 WATER TREATMENT COMPANIES
4.11.4 HEALTHCARE AND PHARMACEUTICAL FACILITIES
4.11.5 PULP AND PAPER MANUFACTURERS
4.11.6 INDUSTRIAL CLEANING AND SANITATION SERVICE PROVIDERS
4.11.7 AGRICULTURAL AND LIVESTOCK OPERATIONS
4.11.8 EMERGING CONSUMER BUYING TRENDS
4.11.9 CONCLUSION
4.12 VENDOR SELECTION CRITERIA
4.12.1 INTRODUCTION
4.12.2 PRODUCT QUALITY AND CONCENTRATION CONSISTENCY
4.12.3 REGULATORY COMPLIANCE AND CERTIFICATION STRENGTH
4.12.4 MANUFACTURING CAPABILITY AND RAW MATERIAL INTEGRATION
4.12.5 SUPPLY CHAIN AND DISTRIBUTION NETWORK STRENGTH
4.12.6 TECHNICAL SERVICE AND APPLICATION SUPPORT
4.12.7 SAFETY, HANDLING, AND RISK MANAGEMENT CAPABILITIES
4.12.8 SUSTAINABILITY AND ENVIRONMENTAL PERFORMANCE
4.12.9 COMMERCIAL COMPETITIVENESS AND TOTAL COST OF OWNERSHIP (TCO)
4.12.10 CONCLUSION
4.13 TECHNOLOGICAL ADVANCEMENTS
4.13.1 INTRODUCTION
4.13.2 ON-SITE GENERATION SYSTEMS
4.13.3 STABILIZED PERACETIC ACID FORMULATIONS
4.13.4 ACTIVATED PERACETIC ACID SYSTEMS
4.13.5 AUTOMATED DOSING & CLEAN-IN-PLACE (CIP) INTEGRATION
4.13.6 SMART SENSOR-BASED MONITORING SYSTEMS
4.13.7 CONCLUSION
4.14 CLIMATE CHANGE SCENARIO
4.14.1 INTRODUCTION
4.14.2 ENVIRONMENTAL CONCERNS
4.14.3 INDUSTRY RESPONSE
4.14.4 GOVERNMENT’S ROLE
4.14.5 ANALYST RECOMMENDATIONS
4.14.6 CONCLUSION
5 INNOVATION TRACKER AND STRATEGIC ANALYSIS
5.1 MAJOR DEALS AND STRATEGIC ALLIANCES ANALYSIS
5.1.1 JOINT VENTURES
5.1.2 MERGERS AND ACQUISITIONS
5.1.3 LICENSING AND PARTNERSHIP
5.1.4 TECHNOLOGY COLLABORATIONS
5.1.5 STRATEGIC DIVESTMENTS
5.2 NUMBER OF PRODUCTS IN DEVELOPMENT
5.3 STAGE OF DEVELOPMENT
5.4 TIMELINES AND MILESTONES
5.5 INNOVATION STRATEGIES AND METHODOLOGIES
5.6 RISK ASSESSMENT AND MITIGATION
5.7 FUTURE OUTLOOK
5.8 YEARLY NUMBER OF DEALS, COMPANIES
6 IMPACT OF WAR ON SUPPLY CHAIN, GEOGRAPHIC FOOTPRINT & STRUCTURAL SHIFTS AND ADAPTIVE STRATEGIES
6.1 INTRODUCTION
6.2 SUPPLY CHAIN RESILIENCE
6.2.1 STRATEGIC DECISIONS
6.2.1.1 DIVERSIFICATION OF RAW MATERIAL AND COMPONENT SOURCING ACROSS MULTIPLE GEOGRAPHIC REGIONS
6.2.1.2 REDUCTION OF DEPENDENCY ON SINGLE-COUNTRY SUPPLIERS FOR CRITICAL INPUTS AND COMMODITIES
6.2.1.3 STRATEGIC PARTNERSHIPS WITH REGIONAL AND GLOBAL SUPPLIERS TO ENSURE STABLE SUPPLY CONTINUITY
6.2.1.4 DEVELOPMENT OF ALTERNATIVE LOGISTICS ROUTES AND TRANSPORTATION CORRIDORS TO MITIGATE SHIPPING DISRUPTIONS
6.2.1.5 EXPANSION OF REGIONAL MANUFACTURING, PROCESSING, AND STORAGE FACILITIES TO STRENGTHEN SUPPLY SECURITY
6.2.1.6 STRENGTHENING SUPPLIER NETWORKS AND INCREASING SAFETY STOCK LEVELS FOR CRITICAL INPUTS
6.3 ENERGY & OPERATIONAL COST RISK
6.3.1 STRATEGIC DECISIONS
6.3.1.1 VOLATILITY IN FUEL, ELECTRICITY, AND NATURAL GAS PRICES IMPACTING PRODUCTION AND PROCESSING COSTS
6.3.1.2 INCREASED OPERATIONAL EXPENSES FOR ENERGY-INTENSIVE MANUFACTURING AND INDUSTRIAL OPERATIONS
6.3.1.3 LONG-TERM ENERGY PROCUREMENT AGREEMENTS TO STABILIZE PRODUCTION AND OPERATIONAL COSTS
6.3.1.4 OPTIMIZATION OF PRODUCTION PROCESSES TO REDUCE ENERGY CONSUMPTION AND IMPROVE EFFICIENCY
6.3.1.5 INVESTMENT IN ENERGY-EFFICIENT TECHNOLOGIES, EQUIPMENT, AND PROCESS IMPROVEMENTS
6.3.1.6 INTEGRATION OF RENEWABLE AND ALTERNATIVE ENERGY SOURCES INTO INDUSTRIAL OPERATIONS
6.4 GEOGRAPHIC FOOTPRINT REASSESSMENT
6.4.1 STRATEGIC DECISIONS
6.4.1.1 EXPANSION OF PRODUCTION AND MANUFACTURING FACILITIES IN POLITICALLY STABLE REGIONS
6.4.1.2 RELOCATION OF MANUFACTURING CLOSER TO RAW MATERIAL SOURCES AND KEY END-USE MARKETS
6.4.1.3 DIVERSIFICATION OF GLOBAL PRODUCTION HUBS
6.4.1.4 DEVELOPMENT OF REGIONAL SUPPLY AND DISTRIBUTION HUBS TO REDUCE CROSS-BORDER DEPENDENCY
6.4.1.5 ADOPTION OF DECENTRALIZED MANUFACTURING STRATEGIES TO REDUCE GEOPOLITICAL AND TRADE RISKS
6.5 SCENARIO PLANNING & RISK MANAGEMENT
6.5.1 STRATEGIC DECISIONS
6.5.1.1 CREATION OF STRATEGIC RESERVES FOR CRITICAL RAW MATERIALS, COMMODITIES, AND INDUSTRIAL INPUTS
6.5.1.2 IMPLEMENTATION OF REAL-TIME SUPPLY CHAIN MONITORING AND RISK ASSESSMENT SYSTEMS
6.5.1.3 MULTI-SOURCE PROCUREMENT STRATEGIES FOR KEY PRODUCTION INPUTS AND MATERIALS
6.5.1.4 DEVELOPMENT OF CONTINGENCY LOGISTICS PLANS TO ADDRESS TRANSPORTATION AND TRADE DISRUPTIONS
6.5.1.5 STRENGTHENING REGULATORY COMPLIANCE, SAFETY PROTOCOLS, AND OPERATIONAL RISK MANAGEMENT FRAMEWORKS
6.6 CASH & FINANCIAL PROTECTION
6.6.1 STRATEGIC DECISIONS
6.6.1.1 HEDGING STRATEGIES TO MITIGATE VOLATILITY IN COMMODITY, RAW MATERIAL, AND ENERGY PRICES
6.6.1.2 DIVERSIFICATION OF REVENUE STREAMS ACROSS MULTIPLE MARKETS AND END-USE INDUSTRIES
6.6.1.3 COST OPTIMIZATION THROUGH AUTOMATION, OPERATIONAL EFFICIENCY, AND DIGITALIZATION INITIATIVES
6.6.1.4 LONG-TERM SUPPLY AGREEMENTS WITH KEY CUSTOMERS AND STRATEGIC PARTNERS
6.6.1.5 IMPROVED WORKING CAPITAL MANAGEMENT AND INVENTORY OPTIMIZATION STRATEGIES
6.7 TECHNOLOGY ADOPTION & INDUSTRIAL AUTOMATION
6.7.1 STRATEGIC DECISIONS
6.7.1.1 ADOPTION OF AUTOMATION TECHNOLOGIES TO IMPROVE EFFICIENCY IN MANUFACTURING, PROCESSING, AND PRODUCTION OPERATIONS
6.7.1.2 INTEGRATION OF SMART MANUFACTURING SYSTEMS AND INDUSTRIAL IOT (IIOT) FOR REAL-TIME MONITORING AND OPERATIONAL CONTROL
6.7.1.3 IMPLEMENTATION OF ADVANCED PROCESS CONTROL SYSTEMS TO ENHANCE PRODUCTIVITY AND REDUCE DOWNTIME
6.7.1.4 DEPLOYMENT OF ROBOTICS AND AUTOMATED HANDLING SYSTEMS IN MANUFACTURING PLANTS, WAREHOUSES, AND DISTRIBUTION CENTERS
6.7.1.5 INVESTMENT IN PREDICTIVE MAINTENANCE TECHNOLOGIES TO IMPROVE EQUIPMENT RELIABILITY AND REDUCE OPERATIONAL DISRUPTIONS
6.7.1.6 DIGITAL INTEGRATION OF SUPPLY CHAIN, PRODUCTION, AND LOGISTICS OPERATIONS THROUGH CENTRALIZED MANAGEMENT PLATFORMS
6.7.1.7 IMPLEMENTATION OF DIGITAL TWIN TECHNOLOGIES TO SIMULATE PRODUCTION PROCESSES AND OPTIMIZE OPERATIONAL PERFORMANCE
6.7.1.8 ADOPTION OF AI-DRIVEN QUALITY CONTROL AND INSPECTION SYSTEMS TO IMPROVE PRODUCT CONSISTENCY AND REDUCE DEFECTS
6.7.1.9 INTEGRATION OF AUTOMATED WAREHOUSE MANAGEMENT AND SMART LOGISTICS SYSTEMS TO ENHANCE DISTRIBUTION EFFICIENCY
6.8 NEW BUSINESS & EMERGING REVENUE OPPORTUNITIES & FUTURE OUTLOOK
6.8.1 GROWTH IN REGIONAL MANUFACTURING ECOSYSTEMS AND LOCALIZED SUPPLY CHAINS
6.8.2 EXPANSION OF SUSTAINABLE AND LOW-CARBON PRODUCTION TECHNOLOGIES
6.8.3 RISING DEMAND FOR RESOURCE-EFFICIENT PRODUCTS, MATERIALS, AND INDUSTRIAL SOLUTIONS
6.8.4 INCREASED INVESTMENT IN RECYCLING TECHNOLOGIES AND CIRCULAR ECONOMY INITIATIVES
6.8.5 DEVELOPMENT OF ALTERNATIVE RAW MATERIALS AND NEXT-GENERATION INDUSTRIAL PRODUCTS
6.8.6 GROWING DEMAND DRIVEN BY INFRASTRUCTURE DEVELOPMENT, ENERGY TRANSITION, AND INDUSTRIAL MODERNIZATION
6.9 CONCLUSION
7 TARIFFS & IMPACT ON THE MARKET
7.1 CURRENT TARIFF RATE(S) IN BRAZIL
7.2 OUTLOOK: LOCAL PRODUCTION VS IMPORT RELIANCE
7.3 VENDOR SELECTION CRITERIA DYNAMICS
7.4 RAW MATERIAL PROCUREMENT
7.4.1 MANUFACTURING AND PRODUCTION
7.4.2 LOGISTICS AND DISTRIBUTION
7.4.3 PRICE POSITIONING AND MARKET COMPETITIVENESS
7.5 SUPPLY CHAIN OPTIMIZATION
7.5.1 JOINT VENTURE ESTABLISHMENTS
7.6 IMPACT ON PRICES
7.7 GEOPOLITICAL SITUATION
7.7.1 TRADE PARTNERSHIPS BETWEEN COUNTRIES
7.7.1.1 FREE TRADE AGREEMENTS
7.7.1.2 INCENTIVE SCHEMES TO BOOST PRODUCTION OUTPUTS
8 MARKET OVERVIEW
8.1 DRIVERS
8.1.1 EXPANSION OF FOOD & BEVERAGE PROCESSING INDUSTRY
8.1.2 RISING INVESTMENTS IN WATER AND WASTEWATER TREATMENT PROJECTS
8.1.3 SHIFT TOWARD SUSTAINABLE DISINFECTION CHEMICAL SOLUTIONS
8.2 RESTRAINTS
8.2.1 REGULATORY HURDLES AND COMPLIANCE COMPLEXITY
8.2.2 STRINGENT STORAGE AND HANDLING REQUIREMENTS
8.3 OPPORTUNITIES
8.3.1 RISE IN DEMAND FOR HIGH-PURITY PERACETIC ACID FROM PHARMACEUTICAL AND HEALTHCARE SECTOR
8.3.2 EXPANSION OF GREEN BIOSECURITY PRACTICES ACROSS AGRICULTURE AND AQUACULTURE INDUSTRIES
8.4 CHALLENGES
8.4.1 EQUIPMENT COMPATIBILITY AND CORROSION CONCERNS
8.4.2 PRICE VOLATILITY OF RAW MATERIALS
9 BRAZIL PERACETIC ACID MARKET , BY PRODUCT TYPE
9.1 OVERVIEW
9.2 BRAZIL PERACETIC ACID MARKET, BY PRODUCT TYPE, 2018-2033 (USD THOUSAND)
9.2.1 EQUILIBRIUM PERACETIC ACID
9.2.2 BLENDED PERACETIC ACID FORMULATIONS
9.2.3 ACTIVATED / ON-SITE GENERATED PERACETIC ACID
9.3 BRAZIL PERACETIC ACID MARKET, BY PRODUCT TYPE, 2018-2033 (TONS)
9.3.1 EQUILIBRIUM PERACETIC ACID
9.3.2 BLENDED PERACETIC ACID FORMULATIONS
9.3.3 ACTIVATED / ON-SITE GENERATED PERACETIC ACID
10 BRAZIL PERACETIC ACID MARKET , BY GRADE
10.1 OVERVIEW
10.2 BRAZIL PERACETIC ACID MARKET, BY GRADE, 2018-2033 (USD THOUSAND)
10.2.1 INDUSTRIAL GRADE
10.2.2 FOOD GRADE
10.2.3 PHARMACEUTICAL / HIGH CONCENTRATION GRADE
10.2.4 LABORATORY / ANALYTICAL GRADE
11 BRAZIL PERACETIC ACID MARKET , BY CONCENTRATION
11.1 OVERVIEW
11.2 BRAZIL PERACETIC ACID MARKET, BY CONCENTRATION, 2018-2033 (USD THOUSAND)
11.2.1 HIGH CONCENTRATION (≥35%)
11.2.2 MEDIUM CONCENTRATION (15–34%)
11.2.3 LOW CONCENTRATION (<15%)
12 BRAZIL PERACETIC ACID MARKET, BY FORMULATION TYPE
12.1 OVERVIEW
12.2 BRAZIL PERACETIC ACID MARKET, BY FORMULATION TYPE, 2018-2033 (USD THOUSAND)
12.2.1 STANDARD EQUILIBRIUM MIXTURES
12.2.2 STABILIZED FORMULATIONS
12.2.3 HIGH-PERFORMANCE / ENHANCED FORMULATIONS
12.2.4 LOW-FOAM FORMULATIONS
13 BRAZIL PERACETIC ACID MARKET, BY RAW MATERIAL
13.1 OVERVIEW
13.2 BRAZIL PERACETIC ACID MARKET, BY RAW MATERIAL, 2018-2033 (USD THOUSAND)
13.2.1 HYDROGEN PEROXIDE
13.2.2 ACETIC ACID
13.2.3 CATALYSTS
13.2.4 OTHERS
13.3 BRAZIL CATALYSTS IN PERACETIC ACID MARKET, BY TYPE, 2018-2033 (USD THOUSAND)
13.3.1 SULFURIC ACID-BASED
13.3.2 OTHER CATALYSTS
14 BRAZIL PERACETIC ACID MARKET, BY FUNCTION
14.1 OVERVIEW
14.2 BRAZIL PERACETIC ACID MARKET, BY FUNCTION, 2018-2033 (USD THOUSAND)
14.2.1 DISINFECTANT
14.2.2 ANTIMICROBIAL AGENT
14.2.3 STERILANT
14.2.4 OXIDIZING AGENT
14.2.5 BLEACHING AGENT
14.2.6 OTHERS
15 BRAZIL PERACETIC ACID MARKET , BY APPLICATION
15.1 OVERVIEW
15.2 BRAZIL PERACETIC ACID MARKET, BY APPLICATION, 2018-2033 (USD THOUSAND)
15.2.1 FOOD & BEVERAGE PROCESSING
15.2.2 WATER TREATMENT
15.2.3 INDUSTRIAL CLEANING & SANITIZATION
15.2.4 PULP & PAPER BLEACHING
15.2.5 MEDICAL & HEALTHCARE DISINFECTION
15.2.6 PHARMACEUTICAL MANUFACTURING
15.2.7 AGRICULTURE
15.2.8 OTHER INDUSTRIAL APPLICATIONS
15.3 BRAZIL FOOD & BEVERAGE PROCESSING IN PERACETIC ACID MARKET, BY TYPE, 2018-2033 (USD THOUSAND)
15.3.1 MEAT & POULTRY PROCESSING
15.3.2 DAIRY PROCESSING
15.3.3 BEVERAGE PRODUCTION
15.4 BRAZIL WATER TREATMENT IN PERACETIC ACID MARKET, BY TYPE, 2018-2033 (USD THOUSAND)
15.4.1 INDUSTRIAL WASTEWATER
15.4.2 MUNICIPAL WASTEWATER
15.4.3 DRINKING WATER
15.4.4 COOLING WATER SYSTEMS
15.5 BRAZIL INDUSTRIAL CLEANING & SANITIZATION IN PERACETIC ACID MARKET, BY TYPE, 2018-2033 (USD THOUSAND)
15.5.1 SURFACE SANITIZATION
15.5.2 EQUIPMENT SANITIZATION
15.5.3 CLEAN-IN-PLACE (CIP) SYSTEMS
15.6 BRAZIL MEDICAL & HEALTHCARE DISINFECTION IN PERACETIC ACID MARKET, BY TYPE, 2018-2033 (USD THOUSAND)
15.6.1 HOSPITAL SURFACES
15.6.2 SURGICAL INSTRUMENTS
15.6.3 ENDOSCOPE REPROCESSING
15.6.4 DIALYSIS EQUIPMENT
15.7 BRAZIL PHARMACEUTICAL MANUFACTURING IN PERACETIC ACID MARKET, BY TYPE, 2018-2033 (USD THOUSAND)
15.7.1 ASEPTIC PROCESSING
15.7.2 OTHERS
15.8 BRAZIL AGRICULTURE IN PERACETIC ACID MARKET, BY TYPE, 2018-2033 (USD THOUSAND)
15.8.1 IRRIGATION WATER TREATMENT
15.8.2 POST-HARVEST SANITIZATION
15.8.3 CROP TREATMENT
16 BRAZIL PERACETIC ACID MARKET, BY END USER
16.1 OVERVIEW
16.2 BRAZIL PERACETIC ACID MARKET, BY END USER, 2018-2033 (USD THOUSAND)
16.2.1 FOOD & BEVERAGE COMPANIES
16.2.2 WATER UTILITIES
16.2.3 HEALTHCARE PROVIDERS
16.2.4 AGRICULTURAL ENTERPRISES
16.2.5 PHARMACEUTICAL & BIOTECH COMPANIES
16.2.6 PULP & PAPER MANUFACTURERS
16.2.7 INDUSTRIAL CLEANING SERVICE PROVIDERS
16.2.8 LABORATORIES & RESEARCH INSTITUTES
16.2.9 OTHERS
16.3 BRAZIL FOOD & BEVERAGE COMPANIES IN PERACETIC ACID MARKET, BY CONCENTRATION, 2018-2033 (USD THOUSAND)
16.3.1 MEDIUM CONCENTRATION (15–34%)
16.3.2 HIGH CONCENTRATION (≥35%)
16.3.3 LOW CONCENTRATION (<15%)
16.4 BRAZIL WATER UTILITIES IN PERACETIC ACID MARKET, BY CONCENTRATION, 2018-2033 (USD THOUSAND)
16.4.1 HIGH CONCENTRATION (≥35%)
16.4.2 MEDIUM CONCENTRATION (15–34%)
16.4.3 LOW CONCENTRATION (<15%)
16.5 BRAZIL HEALTHCARE PROVIDERS IN PERACETIC ACID MARKET, BY CONCENTRATION, 2018-2033 (USD THOUSAND)
16.5.1 HIGH CONCENTRATION (≥35%)
16.5.2 MEDIUM CONCENTRATION (15–34%)
16.5.3 LOW CONCENTRATION (<15%)
16.6 BRAZIL AGRICULTURAL ENTERPRISES IN PERACETIC ACID MARKET, BY CONCENTRATION, 2018-2033 (USD THOUSAND)
16.6.1 HIGH CONCENTRATION (≥35%)
16.6.2 MEDIUM CONCENTRATION (15–34%)
16.6.3 LOW CONCENTRATION (<15%)
16.7 BRAZIL PHARMACEUTICAL & BIOTECH COMPANIES IN PERACETIC ACID MARKET, BY CONCENTRATION, 2018-2033 (USD THOUSAND)
16.7.1 HIGH CONCENTRATION (≥35%)
16.7.2 MEDIUM CONCENTRATION (15–34%)
16.7.3 LOW CONCENTRATION (<15%)
16.8 BRAZIL PULP & PAPER MANUFACTURERS IN PERACETIC ACID MARKET, BY CONCENTRATION, 2018-2033 (USD THOUSAND)
16.8.1 MEDIUM CONCENTRATION (15–34%)
16.8.2 HIGH CONCENTRATION (≥35%)
16.8.3 LOW CONCENTRATION (<15%)
16.9 BRAZIL INDUSTRIAL CLEANING SERVICE PROVIDERS IN PERACETIC ACID MARKET, BY CONCENTRATION, 2018-2033 (USD THOUSAND)
16.9.1 HIGH CONCENTRATION (≥35%)
16.9.2 MEDIUM CONCENTRATION (15–34%)
16.9.3 LOW CONCENTRATION (<15%)
16.1 BRAZIL LABORATORIES & RESEARCH INSTITUTES IN PERACETIC ACID MARKET, BY CONCENTRATION, 2018-2033 (USD THOUSAND)
16.10.1 HIGH CONCENTRATION (≥35%)
16.10.2 MEDIUM CONCENTRATION (15–34%)
16.10.3 LOW CONCENTRATION (<15%)
16.11 BRAZIL OTHERS IN PERACETIC ACID MARKET, BY CONCENTRATION, 2018-2033 (USD THOUSAND)
16.11.1 MEDIUM CONCENTRATION (15–34%)
16.11.2 HIGH CONCENTRATION (≥35%)
16.11.3 LOW CONCENTRATION (<15%)
17 BRAZIL PERACETIC ACID MARKET, BY DISTRIBUTION CHANNEL
17.1 OVERVIEW
17.2 BRAZIL PERACETIC ACID MARKET, BY DISTRIBUTION CHANNEL, 2018-2033 (USD THOUSAND)
17.2.1 DIRECT SALES
17.2.2 REGIONAL DISTRIBUTORS
17.2.3 SPECIALTY CHEMICAL DISTRIBUTORS
17.2.4 INDIRECT SALES
17.2.5 ONLINE DISTRIBUTORS
18 BRAZIL PERACETIC ACID MARKET, BY PACKAGING TYPE
18.1 OVERVIEW
18.2 BRAZIL PERACETIC ACID MARKET, BY PACKAGING TYPE, 2018-2033 (USD THOUSAND)
18.2.1 INDUSTRIAL DRUMS
18.2.2 IBC TOTES
18.2.3 BULK TANKERS
18.2.4 JERRYCANS
18.2.5 OTHERS
19 BRAZIL PERACETIC ACID MARKET
19.1 COMPANY SHARE ANALYSIS: BRAZIL
20 SWOT ANALYSIS
21 COMPANY PROFILES
21.1 SOLVAY
21.1.1 COMPANY SNAPSHOTS
21.1.2 REVENUE ANALYSIS
21.1.3 PRODUCT PORTFOLIO
21.1.4 RECENT UPDATE AND DEVELOPMENT
21.2 EVONIK INDUSTRIES AG
21.2.1 COMPANY SNAPSHOTS
21.2.2 REVENUE ANALYSIS
21.2.3 PRODUCT PORTFOLIO
21.2.4 RECENT UPDATE
21.3 ECOLAB INC.
21.3.1 COMPANY SNAPSHOT
21.3.2 REVENUE ANALYSIS
21.3.3 PRODUCT PORTFOLIO
21.3.4 RECENT DEVELOPMENT
21.4 LANXESS
21.4.1 COMPANY PROFILES
21.4.2 REVENUE ANALYSIS
21.4.3 PRODUCT PORTFOLIO
21.4.4 RECENT UPDATE
21.5 SOLENIS LLC
21.5.1 COMPANY SNAPSHOTS
21.5.2 PRODUCT PORTFOLIO
21.5.3 RECENT DEVELOPMENTS AND UPDATES
21.6 ABC QUÍMICA
21.6.1 COMPANY SNAPSHOT
21.6.2 PRODUCT PORTFOLIO
21.6.3 RECENT DEVELOPMENT
21.7 AEB GROUP SPA
21.7.1 COMPANY SNAPSHOT
21.7.2 PRODUCT PORTFOLIO
21.7.3 RECENT DEVELOPMENT
21.8 AGUATOP
21.8.1 COMPANY SNAPSHOT
21.8.2 PRODUCT PORTFOLIO
21.8.3 RECENT DEVELOPMENT
21.9 ALLOXY CHEMICAL SPECIALTIES
21.9.1 COMPANY SNAPSHOT
21.9.2 PRODUCT PORTFOLIO
21.9.3 RECENT DEVELOPMENT
21.1 ALLOXY ESPECIALIDADES QUÍMICAS
21.10.1 COMPANY SNAPSHOTS
21.10.2 PRODUCT PORTFOLIO
21.10.3 RECENT UPDATE
21.11 ARESCLEAN
21.11.1 COMPANY PROFILES
21.11.2 PRODUCT PORTFOLIO
21.11.3 RECENT UPDATE AND DEVELOPMENT
21.12 ARXADA (ENVIRO TECH CHEMICAL SERVICES, INC..)
21.12.1 COMPANY SNAPSHOT
21.12.2 PRODUCT PORTFOLIO
21.12.3 RECENT DEVELOPMENT
21.13 BELLTYPE
21.13.1 COMPANY SNAPSHOT
21.13.2 PRODUCT PORTFOLIO
21.13.3 RECENT DEVELOPMENT
21.14 B BRAUN SE
21.14.1 COMPANY SNAPSHOT
21.14.2 REVENUE ANALYSIS
21.14.3 PRODUCT PORTFOLIO
21.14.4 RECENT DEVELOPMENT
21.15 ECOMASTER QUIMICA
21.15.1 COMPANY SNAPSHOT
21.15.2 PRODUCT PORTFOLIO
21.15.3 RECENT DEVELOPMENT
21.16 ECOPER QUIMICA
21.16.1 COMPANY SNAPSHOTS
21.16.2 PRODUCT PORTFOLIO
21.16.3 RECENT DEVELOPMENTS
21.17 GROW QUIMICA E FARMACEUTICA
21.17.1 COMPANY SNAPSHOTS
21.17.2 PRODUCT PORTFOLIO
21.17.3 RECENT UPDATE AND DEVELOPMENT
21.18 HIGEX
21.18.1 COMPANY SNAPSHOT
21.18.2 PRODUCT PORTFOLIO
21.18.3 RECENT DEVELOPMENT
21.19 INNOVACORP INDIA PVT LTD
21.19.1 COMPANY SNAPSHOT
21.19.2 PRODUCT PORTFOLIO
21.19.3 RECENT DEVELOPMENT
21.2 ITAQUÍMICA INDÚSTRIA E COMÉRCIO S/A
21.20.1 COMPANY SNAPSHOT
21.20.2 PRODUCT PORTFOLIO
21.20.3 RECENT DEVELOPMENT
21.21 KERSIA GROUP
21.21.1 COMPANY SNAPSHOTS
21.21.2 PRODUCT PORTFOLIO
21.21.3 RECENT UPDATES
21.22 LIMSEPT DO BRASIL
21.22.1 COMPANY SNAPSHOTS
21.22.2 PRODUCT PORTFOLIO
21.22.3 RECENT UPDATE AND DEVELOPMENT
21.23 MERCOTECH
21.23.1 COMPANY SNAPSHOT
21.23.2 PRODUCT PORTFOLIO
21.23.3 RECENT DEVELOPMENT
21.24 MITSUBISHI GAS CHEMICAL COMPANY, INC.
21.24.1 COMPANY SNAPSHOT
21.24.2 REVENUE ANALYSIS
21.24.3 PRODUCT PORTFOLIO
21.24.4 RECENT DEVELOPMENT
21.25 MUNDIAL QUÍMICA DO BRASIL
21.25.1 COMPANY SNAPSHOT
21.25.2 PRODUCT PORTFOLIO
21.25.3 RECENT DEVELOPMENT
21.26 MUSTANG PLURON
21.26.1 COMPANY SNAPSHOT
21.26.2 PRODUCT PORTFOLIO
21.26.3 RECENT DEVELOPMENT
21.27 NEWDROP QUÍMICA
21.27.1 COMPANY SNAPSHOT
21.27.2 PRODUCT PORTFOLIO
21.27.3 RECENT DEVELOPMENT
21.28 NIPPON CHEMICAL.
21.28.1 COMPANY SNAPSHOT
21.28.2 PRODUCT PORTFOLIO
21.28.3 RECENT DEVELOPMENT
21.29 OLEAK INDÚSTRIA E COMÉRCIO LTDA
21.29.1 COMPANY SNAPSHOT
21.29.2 PRODUCT PORTFOLIO
21.29.3 RECENT DEVELOPMENT
21.3 RIOQUÍMICA
21.30.1 COMPANY SNAPSHOT
21.30.2 PRODUCT PORTFOLIO
21.30.3 RECENT DEVELOPMENT
21.31 SANDET QUÍMICA LTDA
21.31.1 COMPANY SNAPSHOT
21.31.2 PRODUCT PORTFOLIO
21.31.3 4.4 RECENT DEVELOPMENT
21.32 SPARTAN BRASIL
21.32.1 COMPANY SNAPSHOT
21.32.2 PRODUCT PORTFOLIO
21.32.3 RECENT DEVELOPMENT
21.33 START QUIMICA
21.33.1 COMPANY SNAPSHOT
21.33.2 PRODUCT PORTFOLIO
21.33.3 RECENT DEVELOPMENT
21.34 VIC PHARMA
21.34.1 COMPANY SNAPSHOT
21.34.2 PRODUCT PORTFOLIO
21.34.3 RECENT DEVELOPMENT
22 QUESTIONNAIRE
23 RELATED REPORTS
List of Table
TABLE 1 BRAND COMPARATIVE ANALYSIS
TABLE 2 CONSUMER BUYING BEHAVIOUR MATRIX
TABLE 3 INFLUENCE OF MAJOR COMPANIES ON CONSUMER BUYING BEHAVIOUR
TABLE 4 STRATEGIC VENDOR EVALUATION PARAMETERS IN THE BRAZIL PERACETIC ACID MARKET
TABLE 5 TECHNOLOGICAL ADVANCEMENTS IN BRAZIL PERACETIC ACID MARKET
TABLE 6 BRAZIL PERACETIC ACID MARKET, BY PRODUCT TYPE, 2018-2033 (USD THOUSAND)
TABLE 7 BRAZIL PERACETIC ACID MARKET, BY PRODUCT TYPE, 2018-2033 (TONS)
TABLE 8 BRAZIL PERACETIC ACID MARKET, BY GRADE, 2018-2033 (USD THOUSAND)
TABLE 9 BRAZIL PERACETIC ACID MARKET, BY CONCENTRATION, 2018-2033 (USD THOUSAND)
TABLE 10 BRAZIL PERACETIC ACID MARKET, BY FORMULATION TYPE, 2018-2033 (USD THOUSAND)
TABLE 11 BRAZIL PERACETIC ACID MARKET, BY RAW MATERIAL, 2018-2033 (USD THOUSAND)
TABLE 12 BRAZIL CATALYSTS IN PERACETIC ACID MARKET, BY TYPE, 2018-2033 (USD THOUSAND)
TABLE 13 BRAZIL PERACETIC ACID MARKET, BY FUNCTION, 2018-2033 (USD THOUSAND)
TABLE 14 BRAZIL PERACETIC ACID MARKET, BY APPLICATION, 2018-2033 (USD THOUSAND)
TABLE 15 BRAZIL FOOD & BEVERAGE PROCESSING IN PERACETIC ACID MARKET, BY TYPE, 2018-2033 (USD THOUSAND)
TABLE 16 BRAZIL WATER TREATMENT IN PERACETIC ACID MARKET, BY TYPE, 2018-2033 (USD THOUSAND)
TABLE 17 BRAZIL INDUSTRIAL CLEANING & SANITIZATION IN PERACETIC ACID MARKET, BY TYPE, 2018-2033 (USD THOUSAND)
TABLE 18 BRAZIL MEDICAL & HEALTHCARE DISINFECTION IN PERACETIC ACID MARKET, BY TYPE, 2018-2033 (USD THOUSAND)
TABLE 19 BRAZIL PHARMACEUTICAL MANUFACTURING IN PERACETIC ACID MARKET, BY TYPE, 2018-2033 (USD THOUSAND)
TABLE 20 BRAZIL AGRICULTURE IN PERACETIC ACID MARKET, BY TYPE, 2018-2033 (USD THOUSAND)
TABLE 21 BRAZIL PERACETIC ACID MARKET, BY END USER, 2018-2033 (USD THOUSAND)
TABLE 22 BRAZIL FOOD & BEVERAGE COMPANIES IN PERACETIC ACID MARKET, BY CONCENTRATION, 2018-2033 (USD THOUSAND)
TABLE 23 BRAZIL WATER UTILITIES IN PERACETIC ACID MARKET, BY CONCENTRATION, 2018-2033 (USD THOUSAND)
TABLE 24 BRAZIL HEALTHCARE PROVIDERS IN PERACETIC ACID MARKET, BY CONCENTRATION, 2018-2033 (USD THOUSAND)
TABLE 25 BRAZIL AGRICULTURAL ENTERPRISES IN PERACETIC ACID MARKET, BY CONCENTRATION, 2018-2033 (USD THOUSAND)
TABLE 26 BRAZIL PHARMACEUTICAL & BIOTECH COMPANIES IN PERACETIC ACID MARKET, BY CONCENTRATION, 2018-2033 (USD THOUSAND)
TABLE 27 BRAZIL PULP & PAPER MANUFACTURERS IN PERACETIC ACID MARKET, BY CONCENTRATION, 2018-2033 (USD THOUSAND)
TABLE 28 BRAZIL INDUSTRIAL CLEANING SERVICE PROVIDERS IN PERACETIC ACID MARKET, BY CONCENTRATION, 2018-2033 (USD THOUSAND)
TABLE 29 BRAZIL LABORATORIES & RESEARCH INSTITUTES IN PERACETIC ACID MARKET, BY CONCENTRATION, 2018-2033 (USD THOUSAND)
TABLE 30 BRAZIL OTHERS IN PERACETIC ACID MARKET, BY CONCENTRATION, 2018-2033 (USD THOUSAND)
TABLE 31 BRAZIL PERACETIC ACID MARKET, BY DISTRIBUTION CHANNEL, 2018-2033 (USD THOUSAND)
TABLE 32 BRAZIL PERACETIC ACID MARKET, BY PACKAGING TYPE, 2018-2033 (USD THOUSAND)
List of Figure
FIGURE 1 BRAZIL PERACETIC ACID MARKET
FIGURE 2 BRAZIL PERACETIC ACID MARKET: DATA TRIANGULATION
FIGURE 3 BRAZIL PERACETIC ACID MARKET: DROC ANALYSIS
FIGURE 4 BRAZIL PERACETIC ACID MARKET: BRAZILVS STATE MARKET ANALYSIS
FIGURE 5 BRAZIL PERACETIC ACID MARKET: COMPANY RESEARCH ANALYSIS
FIGURE 6 BRAZIL PERACETIC ACID MARKET: MULTIVARIATE MODELLING
FIGURE 7 BRAZIL PERACETIC ACID MARKET: INTERVIEW DEMOGRAPHICS
FIGURE 8 BRAZIL PERACETIC ACID MARKET: DBMR MARKET POSITION GRID
FIGURE 9 BRAZIL PERACETIC ACID MARKET: MARKET APPLICATION COVERAGE GRID
FIGURE 10 BRAZIL PERACETIC ACID MARKET: VENDOR SHARE ANALYSIS
FIGURE 11 BRAZIL PERACETIC ACID MARKET: SEGMENTATION
FIGURE 12 EXPANSION OF FOOD & BEVERAGE PROCESSING INDUSTRY IN BRAZILIS EXPECTED TO DRIVE THE BRAZIL PERACETIC ACID MARKET IN THE FORECAST PERIOD
FIGURE 13 THE EQUILIBRIUM PERACETIC ACID IS EXPECTED TO ACCOUNT FOR THE LARGEST SHARE OF THE BRAZIL PERACETIC ACID MARKET IN 2026 AND 2033
FIGURE 14 THREE SEGMENTS COMPRISE THE BRAZIL PERACETIC ACID MARKET, BY PRODUCT TYPE (2025)
FIGURE 15 STRATEGIC DECISIONS
FIGURE 16 EXECUTIVE SUMMARY
FIGURE 17 SUPPLY CHAIN ANALYSIS
FIGURE 18 VALUE CHAIN ANALYSIS
FIGURE 19 GLOBAL PATENT LANDSCAPE FOR PERACETIC ACID
FIGURE 20 COMPETITIVE PATENT POSITIONING OF LEADING COMPANIES
FIGURE 21 PATENT CLASSIFICATIONS AS PER IPC CODE
FIGURE 22 ANNUAL PATENT PUBLICATIONS
FIGURE 23 BRAZIL PERACETIC ACID MARKET, 2025-2033, AVERAGE SELLING PRICE (USD/KG)
FIGURE 24 DROC ANALYSIS
FIGURE 25 BRAZIL PERACETIC ACID MARKET : BY PRODUCT TYPE, 2025
FIGURE 26 BRAZIL PERACETIC ACID MARKET : BY GRADE, 2025
FIGURE 27 BRAZIL PERACETIC ACID MARKET : BY CONCENTRATION, 2025
FIGURE 28 BRAZIL PERACETIC ACID MARKET: BY FORMULATION TYPE, 2025
FIGURE 29 BRAZIL PERACETIC ACID MARKET : BY RAW MATERIAL, 2025
FIGURE 30 BRAZIL PERACETIC ACID MARKET : BY FUNCTION, 2025
FIGURE 31 BRAZIL PERACETIC ACID MARKET : BY APPLICATION, 2025
FIGURE 32 BRAZIL PERACETIC ACID MARKET : BY END USER, 2025
FIGURE 33 BRAZIL PERACETIC ACID MARKET : BY DISTRIBUTION CHANNEL, 2025
FIGURE 34 BRAZIL PERACETIC ACID MARKET : BY PACKAGING TYPE, 2025
FIGURE 35 BRAZIL PERACETIC ACID MARKET: COMPANY SHARE 2025 (%)
Brazil Peracetic Acid Market, Supply Chain Analysis and Ecosystem Framework
To support market growth and help clients navigate the impact of geopolitical shifts, DBMR has integrated in-depth supply chain analysis into its Brazil Peracetic Acid Market research reports. This addition empowers clients to respond effectively to global changes affecting their industries. The supply chain analysis section includes detailed insights such as Brazil Peracetic Acid Market consumption and production by country, price trend analysis, the impact of tariffs and geopolitical developments, and import and export trends by country and HSN code. It also highlights major suppliers with data on production capacity and company profiles, as well as key importers and exporters. In addition to research, DBMR offers specialized supply chain consulting services backed by over a decade of experience, providing solutions like supplier discovery, supplier risk assessment, price trend analysis, impact evaluation of inflation and trade route changes, and comprehensive market trend analysis.
Data collection and base year analysis are done using data collection modules with large sample sizes. The stage includes obtaining market information or related data through various sources and strategies. It includes examining and planning all the data acquired from the past in advance. It likewise envelops the examination of information inconsistencies seen across different information sources. The market data is analysed and estimated using market statistical and coherent models. Also, market share analysis and key trend analysis are the major success factors in the market report. To know more, please request an analyst call or drop down your inquiry.
The key research methodology used by DBMR research team is data triangulation which involves data mining, analysis of the impact of data variables on the market and primary (industry expert) validation. Data models include Vendor Positioning Grid, Market Time Line Analysis, Market Overview and Guide, Company Positioning Grid, Patent Analysis, Pricing Analysis, Company Market Share Analysis, Standards of Measurement, Global versus Regional and Vendor Share Analysis. To know more about the research methodology, drop in an inquiry to speak to our industry experts.
Data Bridge Market Research is a leader in advanced formative research. We take pride in servicing our existing and new customers with data and analysis that match and suits their goal. The report can be customized to include price trend analysis of target brands understanding the market for additional countries (ask for the list of countries), clinical trial results data, literature review, refurbished market and product base analysis. Market analysis of target competitors can be analyzed from technology-based analysis to market portfolio strategies. We can add as many competitors that you require data about in the format and data style you are looking for. Our team of analysts can also provide you data in crude raw excel files pivot tables (Fact book) or can assist you in creating presentations from the data sets available in the report.


