
China, Taiwan, Hong Kong, Vietnam, Japan, and Korea Food Shelf Life Testing Market Analysis and Size
A product's shelf life is the period during when it remains effective and free of deterioration, and thus sellable, without becoming unfit for use, consumption, or sale. Shelf life testing is done in a laboratory to determine the expected shelf life of a food product and when it should be consumed. This test ensures that the product is microbiologically safe. Shelf life testing lowers the likelihood of product recalls. It also identifies the causes of decreased shelf life and contributes to the improvement of products, processes, and, ultimately, profitability. Therefore, the increased demand for packaged and convenience foods and an increasing prevalence of foodborne disease outbreaks will boost the growth of the market. Whereas the lack of organization and sophistication in the food systems of developing economies is likely to restrict the growth of the market in the region.
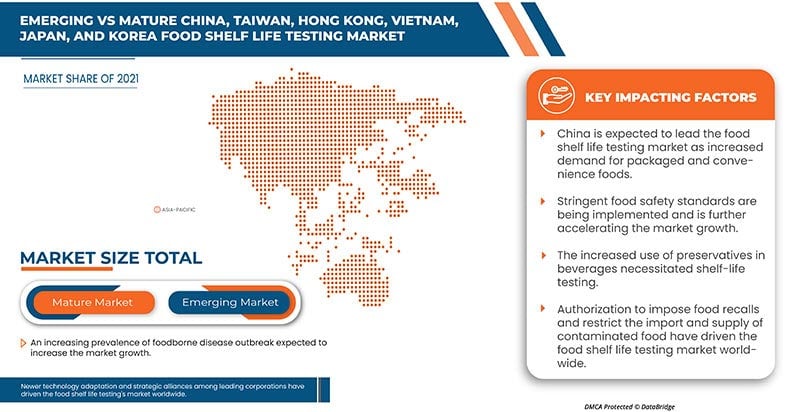
Data Bridge Market Research analyses that the China, Taiwan, Hong Kong, Vietnam, Japan, and Korea food shelf life testing market is expected to reach the value of USD 1,036.12 million by the year 2029, and will grow at a CAGR of 4.2% during the forecast period of 2022 to 2029.
|
Report Metric |
Details |
|
Forecast Period |
2022 to 2029 |
|
Base Year |
2021 |
|
Historic Years |
2020 (Customizable to 2019 - 2015) |
|
Quantitative Units |
Revenue in USD Million, Pricing in USD |
|
Segments Covered |
By Type (Devices, Reagents & Kits, and Services), Parameter (Micro-organism, Nutrient Stability, Organoleptic Properties, Water Activity, Label Claims, Total Viable Count (TVC), Moisture Content, Acidity Levels, PH, Fat Rancidity, and Others), Method (Real-Time Shelf Life Testing, and Accelerated Shelf Life Testing), Testing Technology (Equipment- & Kit-Based, and Manual Test), Condition (Frozen (-15°C to -20°C), Refrigerated (2°C to 8°C), Ambient (25°C/60%RH), Intermediate (30°C/65%RH), Accelerated (40°C/75%RH), Tropical (30°C/75%RH), and Others), Food Tested (Food, and Beverages) |
|
Regions Covered |
China, Taiwan, Hong Kong, Vietnam, Japan, and Korea. |
|
Market Players Covered |
Intertek Group plc, Mérieux NutriSciences Corporation, TÜV SÜD, SGS Société Générale de Surveillance SA, Xian LIB Environmental Simulation Industry, ANRESCO., and DKSH Holding Ltd. |
Market Definition
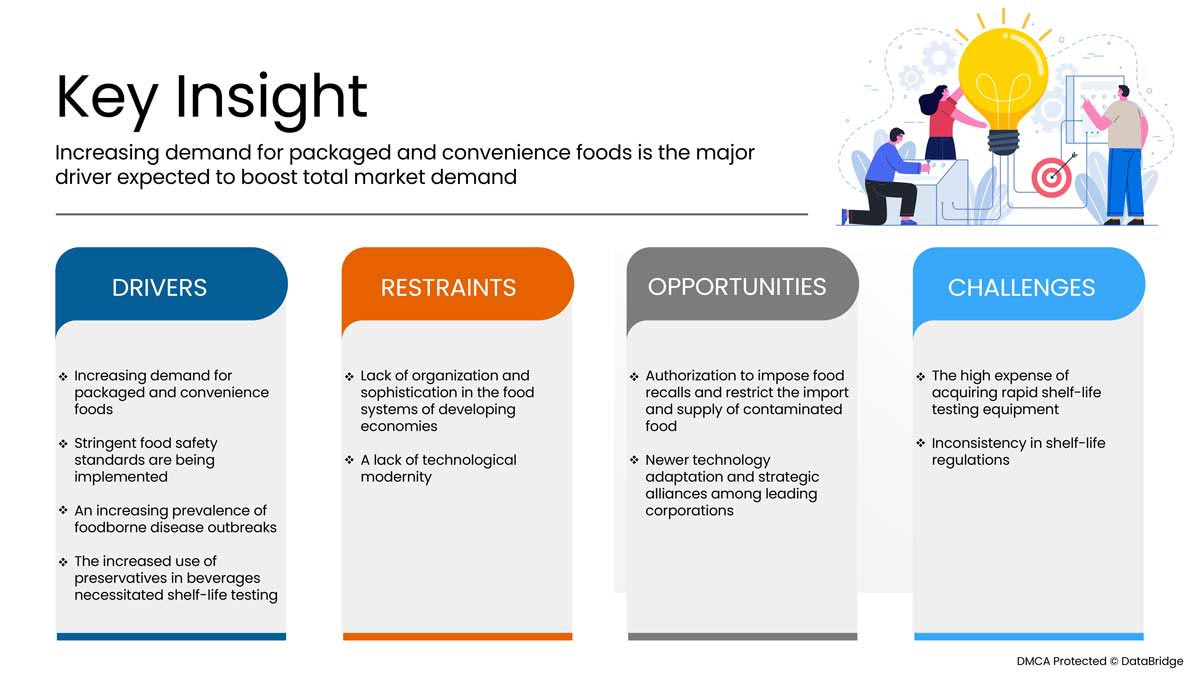
Increased demand for packaged and convenience foods is an important driver for the China, Taiwan, Hong Kong, Vietnam, Japan, and Korea food shelf life testing market. Stringent food safety standards are being implemented and are accelerating market growth. An increasing prevalence of foodborne disease outbreaks accelerates the growth of the market. The increased use of preservatives in beverages necessitated shelf-life testing to drive the growth of the market. The major restraints that may negatively impact the China, Taiwan, Hong Kong, Vietnam, Japan, and Korea food shelf life testing market are a lack of organization and sophistication in the food systems of developing economies and a lack of technological modernity. Authorization to impose food recalls and restrict the import and supply of contaminated food and newer technology adaptation and strategic alliances among leading corporations are expected to provide the China, Taiwan, Hong Kong, Vietnam, Japan, and Korea food shelf life testing market opportunity. However, the high expense of acquiring rapid shelf-life testing equipment and inconsistency in shelf-life regulations is projected to challenge the China, Taiwan, Hong Kong, Vietnam, Japan, and Korea food shelf life testing market.
China, Taiwan, Hong Kong, Vietnam, Japan, and Korea Food Shelf Life Testing Market Dynamics
This section deals with understanding the market drivers, opportunities, restraints, and challenges. All of this is discussed in detail as below:
Drivers
-
Increasing demand for packaged and convenience foods
Increased consumption and demand for processed, ready-to-eat packaged food and convenience food items are predicted to contribute to the growth of the food shelf-life testing market. Furthermore, when disposable earnings rise, working professionals and students are more inclined to spend more money on packaged and convenience foods. Thus, packaged food products must be of excellent quality, high in nutritional content, free of contamination, and must not cause foodborne disease to customers based on their shelf-life term. Shelf-life testing is very critical in this case. A shelf life assessment evaluates the quality and hygiene of a food product through a chemical, physical, and microbiological study. It provides food makers and producers with confidence in their product's shelf life. Keep their brand and their customers protected.
For instance,
- The food shelf life testing service provided by TÜV SD Vietnam includes detailed reviews of foodborne micro-organisms, the total number of living micro-organisms, challenge test, water activity test, acid content, food pH, oh sour, structure change, damage caused by micro-organisms, chemical browning, and enzyme browning. This helps firms reduce the threat of product recalls while also strengthening their brand's image.
-
Stringent food safety standards are being implemented
The increased complexity and number of supply chain partners have made it challenging for businesses to follow hygienic and sanitized manufacturing processes uniformly. As a result of these circumstances, the frequency of food contamination incidents has increased, pushing governments in Asia-Pacific nations such as China, Taiwan, Hong Kong, Vietnam, Japan, and Korea to enact and further strengthen severe food safety legislation. Diverse regulatory organizations such as the Vietnam Food Administration (VFA), China Food and Drug Administration (CFDA), Food Sanitation Act (FSA), Taiwan Food and Drug Administration (TFDA), and South Korea’s Ministry of Food and Drug Safety (MFDS), this has spurred the expansion of the food shelf life testing market.
For instance,
-
In June 2022, according to Food Safety magazine, The China National Strategy for Food Safety (CNSFS) was proposed in 2016. The newly released timeline and roadmap build on it by establishing a strict, efficient, and socially regulated food safety governance system by 2027, fundamental modernization of food safety governance and food chain oversight by 2035, and full modernization of food safety governance throughout China by 2050.
Opportunities
Authorization to impose food recalls and restrict the import and supply of contaminated food
A food recall is the removal of goods from sale, distribution, and consumption that may represent a safety concern to people. A food recall may be initiated in response to a report or complaint received from a variety of sources, including producers, distributors, retailers, government agencies, and consumers. It might also happen as a result of internal testing and/or auditing at a food company. Food companies perform recalls to ensure that potentially harmful or unhealthy items are not ingested. Food recalls can be authorized after consultation between state and territorial government officials and a sponsor, who is generally the product's provider, such as the manufacturer or importer.
- Newer technology adaptation and strategic alliances among leading corporations
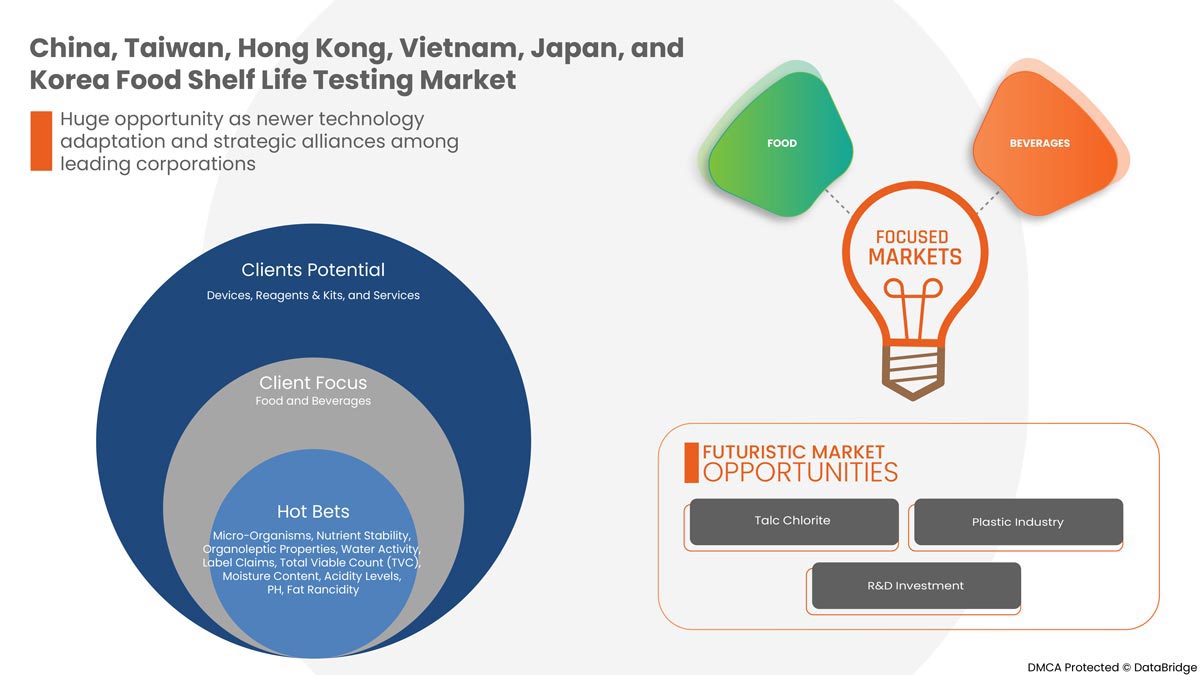
The emphasis on minimizing lead time, sample usage, testing costs, and disadvantages associated with various technologies has led to technical advances and the creation of new technologies such as spectrometry, imaging, chemical analysis, and temperature monitoring. Increased use of these technologies, aided by government funding, provides a chance for medium- and small-scale laboratories to increase their service offerings and compete with significant market players in the sector.
Restraints/Challenges
- Lack of organization and sophistication in the food systems of developing economies
The food business in developing nations is still extremely fragmented, dominated by small and disorganized firms that may not have implemented basic food testing and shelf-life testing processes, increasing the risk of contamination. Food and beverage product testing, including packaged foods, dairy products, beverages, and meat products, among other samples, need appropriate enforcement mechanisms, coordination among market parties, and supporting infrastructure. However, many nations designated as emerging economies, such as China, Vietnam, Taiwan, and others, lack these criteria, posing a challenge to the shelf-life testing business.
- A lack of technological modernity
Businesses today recognize that technology is an enabler and utilize it to compete in the marketplace, but as businesses expand and adapt, so must their use of technology. Food shelf life testing systems and the software that they employ lag behind changing business realities. Furthermore, because technology is a rapidly aging commodity, organizations frequently feel the need for technology modernization. Technology modernization decisions require significant money and resource expenditures and have an impact on how employees operate in the firm. This means that any technology modernization decisions for corporations will be difficult. Organizations must use dependable technology to meet today's and tomorrow's business demands in order to remain relevant and competitive.
- The high expense of acquiring rapid shelf-life testing equipment
The purpose of shelf life testing is to offer an objective measure of the quality criteria that characterize the product and the point at which failure occurs. This failure occurs when the meal exhibits physical, chemical, microbiological, or sensory properties that the customer finds unsatisfactory. Food shelf-life testing may be a complex, intimidating, and costly process. High-end methods, such as chromatography and spectrometry, need expensive instruments and consumables for successful shelf-life assessment of food samples. If the technology is outdated and requires constant maintenance, this adds to the expense.
- Inconsistency in shelf-life regulations
The rising number of national standards for food shelf-life management has created uncertainty, and there is a need for these shelf-life standards to be harmonized. Leading food companies have increasingly realized the costs and inefficiencies associated with the establishment of numerous shelf-life standards.
Food fraud can take numerous forms. However, it is usually classified into two types. Either the meal itself is tainted, or the information accompanying it is incorrect. The last form is expiry date fraud. The aim for expiry date fraud is most typically to extend the period that food may be sold rather than discarded. The reason is economic, like with any food fraud. There is a financial incentive to retain and sell food over its expiration date in expiry date fraud. Expiry date fraud happens at all levels of the business and affects food in both large-scale, well-organized operations and smaller companies. Because of inconsistency and laziness in completing food shelf-life tests, frozen packaged food, notably seafood and meat, is typically affected, but other foods may also be affected. Thus, shelf-life testing regulations must be strictly followed, and the consistency of the regulations aids in the abolition of food fraud.
Recent Developments
- In July 2021, the Group acquired JLA Brasil Laboratório de Análises de Alimentos S.A. ('JLA'), a market-leading independent provider of Food, Agriculture, and Environmental testing solutions based in Brazil. The acquisition of JLA presents a compelling opportunity to enter the fast-growing and highly attractive food testing sector in Brazil, which is one of the largest markets globally in terms of agri-food and beverage production value. This acquisition helps the company to focus on more productivity and increase its market share.
- In July 2022, DKSH Business Unit Consumer Goods, a leading partner for FMCG companies seeking to grow their business in Asia and beyond, announced its expanded partnership in Malaysia with Oatly Asia, a Sweden-based food and beverage company that markets the world’s original and largest oat drink company Oatly. This will provide market expansion services.
China, Taiwan, Hong Kong, Vietnam, Japan, and Korea Food Shelf Life Testing Market Scope
China, Taiwan, Hong Kong, Vietnam, Japan, and Korea food shelf life testing market is segmented based on type, parameter, method, testing technology, condition, and food tested. The growth amongst these segments will help you analyze major growth segments in the industries and provide the users with a valuable market overview and market insights to make strategic decisions to identify core market applications.
Type
- Devices
- Reagents & Kits
- Services
On the basis of type, China, Taiwan, Hong Kong, Vietnam, Japan, and Korea food shelf life testing market is segmented into devices, reagents & kits, and services.
Parameter
- Micro-organisms
- Nutrient stability
- Organoleptic Properties
- Water Activity
- Label Claims
- Total Viable Count (TVC)
- Moisture Content
- Acidity Levels
- PH
- Fat Rancidity
- Others
On the basis of parameters, China, Taiwan, Hong Kong, Vietnam, Japan, and Korea food shelf life testing market is segmented into micro-organisms, nutrient stability, organoleptic properties, water activity, label claims, total viable count (TVC), moisture content, acidity levels, PH, fat rancidity, and others.
Method
- Real-time shelf life testing
- Accelerated shelf life testing
On the basis of the method, China, Taiwan, Hong Kong, Vietnam, Japan, and Korea food shelf life testing market is segmented into real-time shelf life testing and accelerated shelf life testing.
Testing Technology
- Equipment & kit-based
- Manual test
On the basis of testing technology, China, Taiwan, Hong Kong, Vietnam, Japan, and Korea food shelf life testing market is segmented into equipment & kit-based, and manual tests.
Condition
- Frozen (-15°C to -20°C)
- Refrigerated (2°C to 8°C)
- Ambient (25°C/60%RH)
- Intermediate (30°C/65%RH)
- Accelerated (40°C/75%RH)
- Tropical (30°C/75%RH)
- Others
On the basis of condition, China, Taiwan, Hong Kong, Vietnam, Japan, and Korea food shelf life testing market is segmented into Frozen (-15°C to -20°C), Refrigerated (2°C to 8°C), Ambient (25°C/60%RH), Intermediate (30°C/65%RH), Accelerated (40°C/75%RH), Tropical (30°C/75%RH), and Others.
Food Tested
- Food
- Beverages
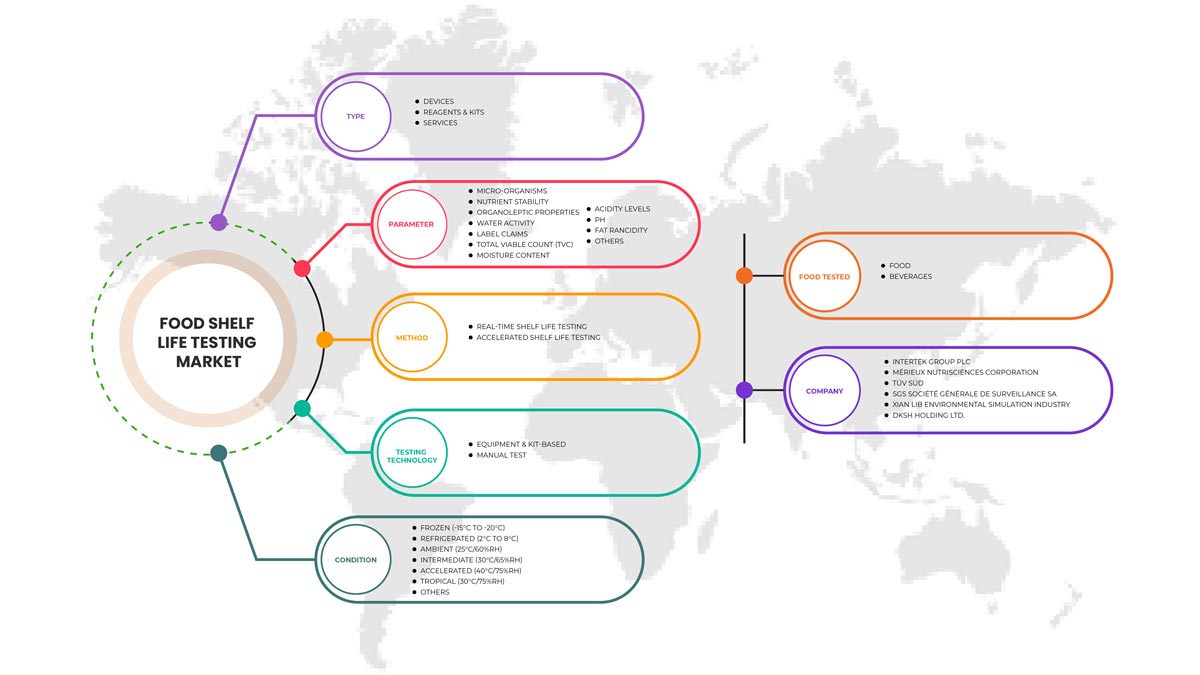
On the basis of food tested, China, Taiwan, Hong Kong, Vietnam, Japan, and Korea food shelf life testing market is segmented into food and beverages.
China, Taiwan, Hong Kong, Vietnam, Japan, and Korea Food Shelf Life Testing Market Regional Analysis/Insights
China, Taiwan, Hong Kong, Vietnam, Japan, and Korea food shelf life testing market are analyzed, and market size insights and trends are provided by country, type, parameter, method, testing technology, condition, and food tested, as referenced above.
The countries covered in the China, Taiwan, Hong Kong, Vietnam, Japan, and Korea food shelf life testing report are China, Taiwan, Hong Kong, Vietnam, Japan, and Korea.
China is expected to dominate the China, Taiwan, Hong Kong, Vietnam, Japan, and Korea food shelf life testing market in terms of market share and revenue. It is estimated to maintain its dominance during the forecast period due to strong market players and high demand for packaged and convenience food regions.
The region section of the report also provides individual market-impacting factors and changes in regulations in the market that impact the current and future trends of the market. Data points, such as new and replacement sales, country demographics, disease epidemiology, and import-export tariffs, are some of the major pointers used to forecast the market scenario for individual countries. In addition, the presence and availability of China, Taiwan, Hong Kong, Vietnam, Japan, and Korea brands and their challenges faced due to high competition from local and domestic brands and the impact of sales channels are considered while providing forecast analysis of the country data.
Competitive Landscape and China, Taiwan, Hong Kong, Vietnam, Japan, and Korea Food Shelf Life Testing Market Share Analysis
Competitive China, Taiwan, Hong Kong, Vietnam, Japan, and Korea food shelf life testing market provides details about the competitors. Details include company overview, company financials, revenue generated, market potential, investment in research and development, new market initiatives, Asia-Pacific presence, production sites and facilities, production capacities, company strengths and weaknesses, product launch, product width and breadth, and application dominance. The above data points are only related to the companies focus on the China, Taiwan, Hong Kong, Vietnam, Japan, and Korea food shelf life testing market.
Some of the major players operating in the China, Taiwan, Hong Kong, Vietnam, Japan, and Korea food shelf life testing market are Intertek Group plc, Mérieux NutriSciences Corporation, TÜV SÜD, SGS Société Générale de Surveillance SA, Xian LIB Environmental Simulation Industry, ANRESCO and DKSH Holding Ltd.
Research Methodology
Data collection and base year analysis are done using data collection modules with large sample sizes. The market data is analyzed and estimated using market statistical and coherent models. In addition, market share analysis and key trend analysis are the major success factors in the market report. The key research methodology used by the DBMR research team is data triangulation which involves data mining, analysis of the impact of data variables on the market, and primary (industry expert) validation. Apart from this, data models include vendor positioning grids, market timeline analysis, market overview and guide, company positioning grid, company market share analysis, standards of measurement, and vendor share analysis. Please request an analyst call in case of further inquiry.
SKU-

- Interactive Data Analysis Dashboard
- Company Analysis Dashboard for high growth potential opportunities
- Research Analyst Access for customization & queries
- Competitor Analysis with Interactive dashboard
- Latest News, Updates & Trend analysis
- Harness the Power of Benchmark Analysis for Comprehensive Competitor Tracking
Table of Content
1 INTRODUCTION
1.1 OBJECTIVES OF THE STUDY
1.2 MARKET DEFINITION
1.3 OVERVIEW OF CHINA, TAIWAN, HONG KONG, VIETNAM, JAPAN, AND KOREA FOOD SHELF LIFE TESTING MARKET
1.4 LIMITATIONS
1.5 MARKETS COVERED
2 MARKET SEGMENTATION
2.1 MARKETS COVERED
2.2 GEOGRAPHICAL SCOPE
2.3 YEARS CONSIDERED FOR THE STUDY
2.4 CURRENCY AND PRICING
2.5 DBMR TRIPOD DATA VALIDATION MODEL
2.6 MULTIVARIATE MODELLING
2.7 TYPE LIFELINE CURVE
2.8 PRIMARY INTERVIEWS WITH KEY OPINION LEADERS
2.9 DBMR MARKET POSITION GRID
2.1 MARKET APPLICATION COVERAGE GRID
2.11 DBMR MARKET CHALLENGE MATRIX
2.12 VENDOR SHARE ANALYSIS
2.13 SECONDARY SOURCES
2.14 ASSUMPTIONS
3 EXECUTIVE SUMMARY
4 PREMIUM INSIGHTS
4.1 PORTER’S FIVE FORCES:
4.2 GROWTH STRATEGIES ADOPTED BY KEY MARKET PLAYERS OF THE CHINA, TAIWAN, HONG KONG, VIETNAM, JAPAN, AND KOREA FOOD SHELF-LIFE TESTING MARKET
4.3 SUPPLY CHAIN ANALYSIS
4.3.1 RAW MATERIAL PROCUREMENT
4.3.2 MANUFACTURING
4.3.3 MARKETING AND DISTRIBUTION
4.3.4 END USERS
4.4 VALUE CHAIN ANALYSIS
4.5 FACTORS INFLUENCING PURCHASING DECISION OF END USER
4.6 IMPACT OF ECONOMIC SLOWDOWN ON MARKET
4.7 IMPORT AND EXPORT ANALYSIS
4.8 INDUSTRY TRENDS AND FUTURE PERSPECTIVE
4.9 OVERVIEW OF TECHNOLOGICAL INNOVATIONS
4.1 RAW MATERIAL AND OBLIQUE SUPPLIER COVERAGE
4.11 REGULATORY FRAMEWORK AND GUIDELINES
5 MARKET OVERVIEW
5.1 DRIVERS
5.1.1 INCREASING DEMAND FOR PACKAGED AND CONVENIENCE FOODS
5.1.2 STRINGENT FOOD SAFETY STANDARDS ARE BEING IMPLEMENTED
5.1.3 AN INCREASING PREVALENCE OF FOODBORNE DISEASE OUTBREAKS
5.1.4 THE INCREASED USE OF PRESERVATIVES IN BEVERAGES NECESSITATED SHELF-LIFE TESTING
5.2 RESTRAINTS
5.2.1 LACK OF ORGANIZATION AND SOPHISTICATION IN THE FOOD SYSTEMS OF DEVELOPING ECONOMIES
5.2.2 A LACK OF TECHNOLOGICAL MODERNITY
5.3 OPPORTUNITIES
5.3.1 AUTHORIZATION TO IMPOSE FOOD RECALLS AND RESTRICT THE IMPORT AND SUPPLY OF CONTAMINATED FOOD
5.3.2 NEWER TECHNOLOGY ADAPTATION AND STRATEGIC ALLIANCES AMONG LEADING CORPORATIONS
5.4 CHALLENGES
5.4.1 THE HIGH EXPENSE OF ACQUIRING RAPID SHELF-LIFE TESTING EQUIPMENT
5.4.2 INCONSISTENCY IN SHELF-LIFE REGULATIONS
6 CHINA, TAIWAN, HONG KONG, VIETNAM, JAPAN, AND KOREA FOOD SHELF LIFE TESTING MARKET, BY TYPE
6.1 OVERVIEW
6.2 DEVICES
6.3 REAGENTS & KITS
6.4 SERVICES
7 CHINA, TAIWAN, HONG KONG, VIETNAM, JAPAN, AND KOREA FOOD SHELF LIFE TESTING MARKET, BY PARAMETER
7.1 OVERVIEW
7.2 MICRO-ORGANISMS
7.2.1 CLOSTRIDIUM PERFRINGENS
7.2.2 YEAST
7.2.3 ANAEROBIC PLATE COUNT
7.2.4 TOTAL COLIFORMS AND E. COLI
7.2.5 MESOPHILIC AND THERMOPHILIC SPORE FORMERS
7.2.6 SALMONELLA
7.2.7 LACTIC ACID BACTERIA
7.2.8 ALICYCLOBACILUS
7.2.9 STAPHYLOBACILLUS AUREUS
7.2.10 LISTERIA
7.2.11 ENTEROBACTEIRACEAE
7.2.12 CAMPYLOBACTER
7.2.13 BACILLUS CEREUS
7.2.14 SHIGELLA SPP
7.2.15 VIBRIO SPP
7.2.16 PSEUDOMONAS AERUGINOSA
7.2.17 OTHERS
7.2.18 EQUIPMENT & KIT-BASED
7.2.19 MANUAL TEST
7.3 NUTRIENT STABILITY
7.3.1 EQUIPMENT & KIT-BASED
7.3.2 MANUAL TEST
7.4 ORGANOLEPTIC PROPERTIES
7.4.1 EQUIPMENT & KIT-BASED
7.4.2 MANUAL TEST
7.5 WATER ACTIVITY
7.5.1 EQUIPMENT & KIT-BASED
7.5.2 MANUAL TEST
7.6 LABEL CLAIMS
7.6.1 EQUIPMENT & KIT-BASED
7.6.2 MANUAL TEST
7.7 TOTAL VIABLE COUNT (TVC)
7.7.1 EQUIPMENT & KIT-BASED
7.7.2 MANUAL TEST
7.8 MOISTURE CONTENT
7.8.1 EQUIPMENT & KIT-BASED
7.8.2 MANUAL TEST
7.9 ACIDITY LEVELS
7.9.1 EQUIPMENT & KIT-BASED
7.9.2 MANUAL TEST
7.1 PH
7.10.1 EQUIPMENT & KIT-BASED
7.10.2 MANUAL TEST
7.11 FAT RANCIDITY
7.11.1 EQUIPMENT & KIT-BASED
7.11.2 MANUAL TEST
7.12 OTHERS
7.12.1 EQUIPMENT & KIT-BASED
7.12.2 MANUAL TEST
8 CHINA, TAIWAN, HONG KONG, VIETNAM, JAPAN, AND KOREA FOOD SHELF LIFE TESTING MARKET, BY METHOD
8.1 OVERVIEW
8.2 REAL-TIME SHELF LIFE TESTING
8.3 ACCELERATED SHELF LIFE TESTING
9 CHINA, TAIWAN, HONG KONG, VIETNAM, JAPAN, AND KOREA FOOD SHELF LIFE TESTING MARKET, BY TESTING TECHNOLOGY
9.1 OVERVIEW
9.2 EQUIPMENT & KIT-BASED
9.2.1 CULTURE BASED
9.2.2 CHROMATOGRAPHY & SPECTROSCOPY
9.2.3 ENZYME-LINKED IMMUNOSORBENT ASSAY (ELISA)
9.2.4 POLYMERASE CHAIN REACTION (PCR)
9.3 MANUAL TEST
10 CHINA, TAIWAN, HONG KONG, VIETNAM, JAPAN, AND KOREA FOOD SHELF LIFE TESTING MARKET, BY CONDITION
10.1 OVERVIEW
10.2 FROZEN (-15°C TO -20°C)
10.3 REFRIGERATED (2°C TO 8°C)
10.4 AMBIENT (25°C/60%RH)
10.5 INTERMEDIATE (30°C/65%RH)
10.6 ACCELERATED (40°C/75%RH)
10.7 TROPICAL (30°C/75%RH)
10.8 OTHERS
11 CHINA, TAIWAN, HONG KONG, VIETNAM, JAPAN, AND KOREA FOOD SHELF LIFE TESTING MARKET, BY FOOD TESTED
11.1 OVERVIEW
11.2 FOOD
11.2.1 DAIRY & DIARY PRODUCTS
11.2.1.1 ICE-CREAM
11.2.1.2 YOGURT
11.2.1.3 CHEESE
11.2.1.4 MILK DESSERT
11.2.1.5 PUDDING
11.2.1.6 PROCESSED CHEESES
11.2.1.7 CUSTARD
11.2.1.8 CHEESE BASED DESSERT
11.2.1.8.1 CHEESE CAKE
11.2.1.8.2 CHEESE PUDDING
11.2.1.8.3 CHEESE CREAMS
11.2.1.8.4 OTHERS
11.2.2 BAKERY & CONFECTIONERY PRODUCTS
11.2.2.1 CANDY BAR
11.2.2.2 CANDIES
11.2.2.3 JAMS AND JELLIES
11.2.2.4 BREAD
11.2.2.5 COOKIES & CRACKERS
11.2.2.6 BISCUITS
11.2.2.7 MUFFIN & PIE
11.2.2.8 OTHERS
11.2.3 MEAT & MEAT PRODUCTS
11.2.3.1 BEEF
11.2.3.2 PORK
11.2.3.3 SEAFOOD
11.2.3.4 LAMB
11.2.3.5 OTHERS
11.2.4 SPICES
11.2.5 EDIBLE OIL
11.2.5.1 OLIVE OIL
11.2.5.2 COCONUT OIL
11.2.5.3 PEANUT OIL
11.2.5.4 SOYBEAN OIL
11.2.5.5 SUNFLOWER OIL
11.2.5.6 OTHERS
11.2.6 PACKAGED FOODS
11.2.7 PROCESSED FRUITS & VEGETABLES
11.2.7.1 CANNED FRUITS & VEGETABLES
11.2.7.2 FRUITS & VEGETABLES PUREE
11.2.7.3 DRIED FRUITS & VEGETABLES
11.2.7.4 PICKLES
11.2.7.5 OTHERS
11.2.8 INFANT FORMULA
11.2.8.1 FIRST INFANT FORMULA
11.2.8.2 ANTI-REFLUX (STAY DOWN) FORMULA
11.2.8.3 COMFORT FORMULA
11.2.8.4 HYPOALLERGENIC FORMULA
11.2.8.5 FOLLOW-ON FORMULA
11.2.8.6 OTHERS
11.2.9 NUTS
11.2.9.1 ALMOND
11.2.9.2 CASHEWNUT
11.2.9.3 WALNUT
11.2.9.4 BRAZIL NUT
11.2.9.5 MACADAMIA NUTS
11.2.9.6 OTHERS
11.2.10 OTHERS
11.2.11 EQUIPMENT & KIT-BASED
11.2.12 MANUAL TEST
11.2.13 MICRO-ORGANISMS
11.2.14 NUTRIENT STABILITY
11.2.15 ORGANOLEPTIC PROPERTIES
11.2.16 WATER ACTIVITY
11.2.17 LABEL CLAIMS
11.2.18 TOTAL VIABLE COUNT (TVC)
11.2.19 MOISTURE CONTENT
11.2.20 ACIDITY LEVELS
11.2.21 PH
11.2.22 FAT RANCIDITY
11.2.23 OTHERS
11.3 BEVERAGES
11.3.1 ALCOHOILIC
11.3.1.1 WHISKEY
11.3.1.2 BRANDY
11.3.1.3 BEER
11.3.1.4 WINE
11.3.1.5 VODKA
11.3.1.6 GIN
11.3.1.7 TEQUILA
11.3.1.8 OTHERS
11.3.2 NON-ALCOHOLIC
11.3.2.1 NUTRITIONAL DRINKS
11.3.2.2 JUICES
11.3.2.3 SPORTS DRINKS
11.3.2.4 CARBONATED DRINKS
11.3.2.5 MINERAL WATER
11.3.2.6 SMOOTHIES
11.3.2.7 TEA
11.3.2.8 COFFEE
11.3.2.9 PLAN-BASED MILK
11.3.2.10 OTHERS
11.3.3 EQUIPMENT & KIT-BASED
11.3.4 MANUAL TEST
11.3.5 MICRO-ORGANISM
11.3.6 NUTRIENT STABILITY
11.3.7 ORGANOLEPTIC PROPERTIES
11.3.8 WATER ACTIVITY
11.3.9 LABEL CLAIMS
11.3.10 TOTAL VIABLE COUNT (TVC)
11.3.11 MOISTURE CONTENT
11.3.12 ACIDITY LEVELS
11.3.13 PH
11.3.14 FAT RANCIDITY
11.3.15 OTHERS
12 CHINA, TAIWAN, HONG KONG, VIETNAM, JAPAN, KOREA FOOD SHELF LIFE TESTING MARKET, BY COUNTRY
12.1 CHINA
12.2 TAIWAN
12.3 HONG KONG
12.4 JAPAN
12.5 KOREA
12.6 VIETNAM
13 CHINA, TAIWAN, HONG KONG, VIETNAM, JAPAN, AND KOREA FOOD SHELF LIFE TESTING MARKET, COMPANY LANDSCAPE
13.1 COMPANY SHARE ANALYSIS: CHINA, TAIWAN, HONG KONG, VIETNAM, JAPAN, AND KOREA
13.2 CERTIFICATIONS
13.3 ACQUISITION
14 SWOT ANALYSIS
15 COMPANY PROFILES
15.1 INTERTEK GROUP PLC
15.1.1 COMPANY SNAPSHOT
15.1.2 REVENUE ANALYSIS
15.1.3 PRODUCT PORTFOLIO
15.1.4 RECENT DEVELOPMENT
15.2 TÜV SÜD
15.2.1 COMPANY SNAPSHOT
15.2.2 REVENUE ANALYSIS
15.2.3 PRODUCT PORTFOLIO
15.2.4 RECENT DEVELOPMENT
15.3 SGS SOCIÉTÉ GÉNÉRALE DE SURVEILLANCE SA
15.3.1 COMPANY SNAPSHOT
15.3.2 REVENUE ANALYSIS
15.3.3 PRODUCT PORTFOLIO
15.3.4 RECENT DEVELOPMENT
15.4 DKSH HOLDING LTD.
15.4.1 COMPANY SNAPSHOT
15.4.2 REVENUE ANALYSIS
15.4.3 PRODUCT PORTFOLIO
15.4.4 RECENT DEVELOPMENT
15.5 MÉRIEUX NUTRISCIENCES CORPORATION
15.5.1 COMPANY SNAPSHOT
15.5.2 PRODUCT PORTFOLIO
15.5.3 RECENT DEVELOPMENTS
15.6 ANRESCO.
15.6.1 COMPANY SNAPSHOT
15.6.2 PRODUCT PORTFOLIO
15.6.3 RECENT DEVELOPMENT
15.7 XIAN LIB ENVIRONMENTAL SIMULATION INDUSTRY
15.7.1 COMPANY SNAPSHOT
15.7.2 PRODUCT PORTFOLIO
15.7.3 RECENT DEVELOPMENT
16 QUESTIONNAIRE
17 RELATED REPORTS
List of Table
TABLE 1 REGULATORY FRAMEWORK
TABLE 2 CHINA, TAIWAN, HONG KONG, VIETNAM, JAPAN, AND KOREA FOOD SHELF LIFE TESTING MARKET, BY TYPE, 2020-2029 (USD MILLION)
TABLE 3 CHINA, TAIWAN, HONG KONG, VIETNAM, JAPAN, AND KOREA FOOD SHELF LIFE TESTING MARKET, BY PARAMETER, 2020-2029 (USD MILLION)
TABLE 4 CHINA, TAIWAN, HONG KONG, VIETNAM, JAPAN, AND KOREA MICRO-ORGANISMS IN FOOD SHELF LIFE TESTING MARKET, BY TYPE, 2020-2029 (USD MILLION)
TABLE 5 CHINA, TAIWAN, HONG KONG, VIETNAM, JAPAN, AND KOREA MICRO-ORGANISMS IN FOOD SHELF LIFE TESTING MARKET, BY TESTING TECHNOLOGY, 2020-2029 (USD MILLION)
TABLE 6 CHINA, TAIWAN, HONG KONG, VIETNAM, JAPAN, AND KOREA NUTRIENT STABILITY IN FOOD SHELF LIFE TESTING MARKET, BY TESTING TECHNOLOGY, 2020-2029 (USD MILLION)
TABLE 7 CHINA, TAIWAN, HONG KONG, VIETNAM, JAPAN, AND KOREA ORGANOLEPTIC PROPERTIES IN FOOD SHELF LIFE TESTING MARKET, BY TESTING TECHNOLOGY, 2020-2029 (USD MILLION)
TABLE 8 CHINA, TAIWAN, HONG KONG, VIETNAM, JAPAN, AND KOREA WATER ACTIVITY IN FOOD SHELF LIFE TESTING MARKET, BY TESTING TECHNOLOGY, 2020-2029 (USD MILLION)
TABLE 9 CHINA, TAIWAN, HONG KONG, VIETNAM, JAPAN, AND KOREA LABEL CLAIMS IN FOOD SHELF LIFE TESTING MARKET, BY TESTING TECHNOLOGY, 2020-2029 (USD MILLION)
TABLE 10 CHINA, TAIWAN, HONG KONG, VIETNAM, JAPAN, AND KOREA TOTAL VIABLE COUNT (TVC) IN FOOD SHELF LIFE TESTING MARKET, BY TESTING TECHNOLOGY, 2020-2029 (USD MILLION)
TABLE 11 CHINA, TAIWAN, HONG KONG, VIETNAM, JAPAN, AND KOREA MOISTURE CONTENT IN FOOD SHELF LIFE TESTING MARKET, BY TESTING TECHNOLOGY, 2020-2029 (USD MILLION)
TABLE 12 CHINA, TAIWAN, HONG KONG, VIETNAM, JAPAN, AND KOREA ACIDITY LEVELS IN FOOD SHELF LIFE TESTING MARKET, BY TESTING TECHNOLOGY, 2020-2029 (USD MILLION)
TABLE 13 CHINA, TAIWAN, HONG KONG, VIETNAM, JAPAN, AND KOREA PH IN FOOD SHELF LIFE TESTING MARKET, BY TESTING TECHNOLOGY, 2020-2029 (USD MILLION)
TABLE 14 CHINA, TAIWAN, HONG KONG, VIETNAM, JAPAN, AND KOREA FAT RANCIDITY IN FOOD SHELF LIFE TESTING MARKET, BY TESTING TECHNOLOGY, 2020-2029 (USD MILLION)
TABLE 15 CHINA, TAIWAN, HONG KONG, VIETNAM, JAPAN, AND KOREA OTHERS IN FOOD SHELF LIFE TESTING MARKET, BY TESTING TECHNOLOGY, 2020-2029 (USD MILLION)
TABLE 16 CHINA, TAIWAN, HONG KONG, VIETNAM, JAPAN, AND KOREA FOOD SHELF LIFE TESTING MARKET, BY METHOD, 2020-2029 (USD MILLION)
TABLE 17 CHINA, TAIWAN, HONG KONG, VIETNAM, JAPAN, AND KOREA FOOD SHELF LIFE TESTING MARKET, BY TESTING TECHNOLOGY, 2020-2029 (USD MILLION)
TABLE 18 CHINA, TAIWAN, HONG KONG, VIETNAM, JAPAN, AND KOREA EQUIPMENT & KIT-BASED IN FOOD SHELF LIFE TESTING MARKET, BY TYPE, 2020-2029 (USD MILLION)
TABLE 19 CHINA, TAIWAN, HONG KONG, VIETNAM, JAPAN, AND KOREA FOOD SHELF LIFE TESTING MARKET, BY CONDITION, 2020-2029 (USD MILLION)
TABLE 20 CHINA, TAIWAN, HONG KONG, VIETNAM, JAPAN, AND KOREA FOOD SHELF LIFE TESTING MARKET, BY FOOD TESTED, 2020-2029 (USD MILLION)
TABLE 21 CHINA, TAIWAN, HONG KONG, VIETNAM, JAPAN, AND KOREA FOOD IN FOOD SHELF LIFE TESTING MARKET, BY TYPE, 2020-2029 (USD MILLION)
TABLE 22 CHINA, TAIWAN, HONG KONG, VIETNAM, JAPAN, AND KOREA DAIRY & DAIRY PRODUCTS IN FOOD SHELF LIFE TESTING MARKET, BY TYPE, 2020-2029 (USD MILLION)
TABLE 23 CHINA, TAIWAN, HONG KONG, VIETNAM, JAPAN, AND KOREA CHEESE BASED DESSERT IN FOOD SHELF LIFE TESTING MARKET, BY TYPE, 2020-2029 (USD MILLION)
TABLE 24 CHINA, TAIWAN, HONG KONG, VIETNAM, JAPAN, AND KOREA BAKERY & CONFECTIONERY PRODUCTS IN FOOD SHELF LIFE TESTING MARKET, BY TYPE, 2020-2029 (USD MILLION)
TABLE 25 CHINA, TAIWAN, HONG KONG, VIETNAM, JAPAN, AND KOREA MEAT & MEAT PRODUCTS IN FOOD SHELF LIFE TESTING MARKET, BY TYPE, 2020-2029 (USD MILLION)
TABLE 26 CHINA, TAIWAN, HONG KONG, VIETNAM, JAPAN, AND KOREA EDIBLE OIL IN FOOD SHELF LIFE TESTING MARKET, BY TYPE, 2020-2029 (USD MILLION)
TABLE 27 CHINA, TAIWAN, HONG KONG, VIETNAM, JAPAN, AND KOREA PROCESSED FRUITS & VEGETABLES IN FOOD SHELF LIFE TESTING MARKET, BY TYPE, 2020-2029 (USD MILLION)
TABLE 28 CHINA, TAIWAN, HONG KONG, VIETNAM, JAPAN, AND KOREA INFANT FORMULA IN FOOD SHELF LIFE TESTING MARKET, BY TYPE, 2020-2029 (USD MILLION)
TABLE 29 CHINA, TAIWAN, HONG KONG, VIETNAM, JAPAN, AND KOREA NUTS IN FOOD SHELF LIFE TESTING MARKET, BY TYPE, 2020-2029 (USD MILLION)
TABLE 30 CHINA, TAIWAN, HONG KONG, VIETNAM, JAPAN, AND KOREA FOOD IN FOOD SHELF LIFE TESTING MARKET, BY TESTING TECHNOLOGY, 2020-2029 (USD MILLION)
TABLE 31 CHINA, TAIWAN, HONG KONG, VIETNAM, JAPAN, AND KOREA FOOD IN FOOD SHELF LIFE TESTING MARKET, BY PARAMETER, 2020-2029 (USD MILLION)
TABLE 32 CHINA, TAIWAN, HONG KONG, VIETNAM, JAPAN, AND KOREA BEVERAGES IN FOOD SHELF LIFE TESTING MARKET, BY TYPE, 2020-2029 (USD MILLION)
TABLE 33 CHINA, TAIWAN, HONG KONG, VIETNAM, JAPAN, AND KOREA BEVERAGES ALCOHOLIC IN FOOD SHELF LIFE TESTING MARKET, BY TYPE, 2020-2029 (USD MILLION)
TABLE 34 CHINA, TAIWAN, HONG KONG, VIETNAM, JAPAN, AND KOREA NON-ALCOHOLIC IN FOOD SHELF LIFE TESTING MARKET, BY TYPE, 2020-2029 (USD MILLION)
TABLE 35 CHINA, TAIWAN, HONG KONG, VIETNAM, JAPAN, AND KOREA BEVERAGES IN FOOD SHELF LIFE TESTING MARKET, BY TESTING TECHNOLOGY, 2020-2029 (USD MILLION)
TABLE 36 CHINA, TAIWAN, HONG KONG, VIETNAM, JAPAN, AND KOREA BEVERAGES IN FOOD SHELF LIFE TESTING MARKET, BY PARAMETER, 2020-2029 (USD MILLION)
TABLE 37 CHINA, TAIWAN, HONG KONG, VIETNAM, JAPAN, KOREA FOOD SHELF LIFE TESTING MARKET, BY COUNTRY, 2020-2029 (USD MILLION)
TABLE 38 CHINA FOOD SHELF LIFE TESTING MARKET, BY TYPE, 2020-2029 (USD MILLION)
TABLE 39 CHINA FOOD SHELF LIFE TESTING MARKET, BY PARAMETER, 2020-2029 (USD MILLION)
TABLE 40 CHINA MICRO-ORGANISMS IN FOOD SHELF LIFE TESTING MARKET, BY TYPE, 2020-2029 (USD MILLION)
TABLE 41 CHINA MICRO-ORGANISMS IN FOOD SHELF LIFE TESTING MARKET, BY TESTING TECHNOLOGY, 2020-2029 (USD MILLION)
TABLE 42 CHINA NUTRIENT STABILITY IN FOOD SHELF LIFE TESTING MARKET, BY TESTING TECHNOLOGY, 2020-2029 (USD MILLION)
TABLE 43 CHINA ORGANOLEPTIC PROPERTIES IN FOOD SHELF LIFE TESTING MARKET, BY TESTING TECHNOLOGY, 2020-2029 (USD MILLION)
TABLE 44 CHINA WATER ACTIVITY IN FOOD SHELF LIFE TESTING MARKET, BY TESTING TECHNOLOGY, 2020-2029 (USD MILLION)
TABLE 45 CHINA LABEL CLAIMS IN FOOD SHELF LIFE TESTING MARKET, BY TESTING TECHNOLOGY, 2020-2029 (USD MILLION)
TABLE 46 CHINA TOTAL VIABLE COUNT (TVC) IN FOOD SHELF LIFE TESTING MARKET, BY TESTING TECHNOLOGY, 2020-2029 (USD MILLION)
TABLE 47 CHINA MOISTURE CONTENT IN FOOD SHELF LIFE TESTING MARKET, BY TESTING TECHNOLOGY, 2020-2029 (USD MILLION)
TABLE 48 CHINA ACIDITY LEVELS IN FOOD SHELF LIFE TESTING MARKET, BY TESTING TECHNOLOGY, 2020-2029 (USD MILLION)
TABLE 49 CHINA PH IN FOOD SHELF LIFE TESTING MARKET, BY TESTING TECHNOLOGY, 2020-2029 (USD MILLION)
TABLE 50 CHINA FAT RANCIDITY IN FOOD SHELF LIFE TESTING MARKET, BY TESTING TECHNOLOGY, 2020-2029 (USD MILLION)
TABLE 51 CHINA OTHERS IN FOOD SHELF LIFE TESTING MARKET, BY TESTING TECHNOLOGY, 2020-2029 (USD MILLION)
TABLE 52 CHINA FOOD SHELF LIFE TESTING MARKET, BY METHOD, 2020-2029 (USD MILLION)
TABLE 53 CHINA FOOD SHELF LIFE TESTING MARKET, BY TESTING TECHNOLOGY, 2020-2029 (USD MILLION)
TABLE 54 CHINA EQUIPMENT & KIT-BASED IN FOOD SHELF LIFE TESTING MARKET, BY TYPE, 2020-2029 (USD MILLION)
TABLE 55 CHINA FOOD SHELF LIFE TESTING MARKET, BY CONDITION, 2020-2029 (USD MILLION)
TABLE 56 CHINA FOOD SHELF LIFE TESTING MARKET, BY FOOD TESTED, 2020-2029 (USD MILLION)
TABLE 57 CHINA FOOD IN FOOD SHELF LIFE TESTING MARKET, BY TYPE, 2020-2029 (USD MILLION)
TABLE 58 CHINA DAIRY & DAIRY PRODUCTS IN FOOD SHELF LIFE TESTING MARKET, BY TYPE, 2020-2029 (USD MILLION)
TABLE 59 CHINA CHEESE BASED DESSERT IN FOOD SHELF LIFE TESTING MARKET, BY TYPE, 2020-2029 (USD MILLION)
TABLE 60 CHINA BAKERY & CONFECTIONERY PRODUCTS IN FOOD SHELF LIFE TESTING MARKET, BY TYPE, 2020-2029 (USD MILLION)
TABLE 61 CHINA MEAT & MEAT PRODUCTS IN FOOD SHELF LIFE TESTING MARKET, BY TYPE, 2020-2029 (USD MILLION)
TABLE 62 CHINA EDIBLE OIL IN FOOD SHELF LIFE TESTING MARKET, BY TYPE, 2020-2029 (USD MILLION)
TABLE 63 CHINA PROCESSED FRUITS & VEGETABLES IN FOOD SHELF LIFE TESTING MARKET, BY TYPE, 2020-2029 (USD MILLION)
TABLE 64 CHINA INFANT FORMULA IN FOOD SHELF LIFE TESTING MARKET, BY TYPE, 2020-2029 (USD MILLION)
TABLE 65 CHINA NUTS IN FOOD SHELF LIFE TESTING MARKET, BY TYPE, 2020-2029 (USD MILLION)
TABLE 66 CHINA FOOD IN FOOD SHELF LIFE TESTING MARKET, BY TESTING TECHNOLOGY, 2020-2029 (USD MILLION)
TABLE 67 CHINA FOOD IN FOOD SHELF LIFE TESTING MARKET, BY PARAMETER, 2020-2029 (USD MILLION)
TABLE 68 CHINA BEVERAGES IN FOOD SHELF LIFE TESTING MARKET, BY TYPE, 2020-2029 (USD MILLION)
TABLE 69 CHINA ALCOHOLIC IN FOOD SHELF LIFE TESTING MARKET, BY TYPE, 2020-2029 (USD MILLION)
TABLE 70 CHINA NON-ALCOHOLIC IN FOOD SHELF LIFE TESTING MARKET, BY TYPE, 2020-2029 (USD MILLION)
TABLE 71 CHINA BEVERAGES IN FOOD SHELF LIFE TESTING MARKET, BY TESTING TECHNOLOGY, 2020-2029 (USD MILLION)
TABLE 72 CHINA BEVERAGES IN FOOD SHELF LIFE TESTING MARKET, BY PARAMETER, 2020-2029 (USD MILLION)
TABLE 73 TAIWAN FOOD SHELF LIFE TESTING MARKET, BY TYPE, 2020-2029 (USD MILLION)
TABLE 74 TAIWAN FOOD SHELF LIFE TESTING MARKET, BY PARAMETER, 2020-2029 (USD MILLION)
TABLE 75 TAIWAN MICRO-ORGANISMS IN FOOD SHELF LIFE TESTING MARKET, BY TYPE, 2020-2029 (USD MILLION)
TABLE 76 TAIWAN MICRO-ORGANISMS IN FOOD SHELF LIFE TESTING MARKET, BY TESTING TECHNOLOGY, 2020-2029 (USD MILLION)
TABLE 77 TAIWAN NUTRIENT STABILITY IN FOOD SHELF LIFE TESTING MARKET, BY TESTING TECHNOLOGY, 2020-2029 (USD MILLION)
TABLE 78 TAIWAN ORGANOLEPTIC PROPERTIES IN FOOD SHELF LIFE TESTING MARKET, BY TESTING TECHNOLOGY, 2020-2029 (USD MILLION)
TABLE 79 TAIWAN WATER ACTIVITY IN FOOD SHELF LIFE TESTING MARKET, BY TESTING TECHNOLOGY, 2020-2029 (USD MILLION)
TABLE 80 TAIWAN LABEL CLAIMS IN FOOD SHELF LIFE TESTING MARKET, BY TESTING TECHNOLOGY, 2020-2029 (USD MILLION)
TABLE 81 TAIWAN TOTAL VIABLE COUNT (TVC) IN FOOD SHELF LIFE TESTING MARKET, BY TESTING TECHNOLOGY, 2020-2029 (USD MILLION)
TABLE 82 TAIWAN MOISTURE CONTENT IN FOOD SHELF LIFE TESTING MARKET, BY TESTING TECHNOLOGY, 2020-2029 (USD MILLION)
TABLE 83 TAIWAN ACIDITY LEVELS IN FOOD SHELF LIFE TESTING MARKET, BY TESTING TECHNOLOGY, 2020-2029 (USD MILLION)
TABLE 84 TAIWAN PH IN FOOD SHELF LIFE TESTING MARKET, BY TESTING TECHNOLOGY, 2020-2029 (USD MILLION)
TABLE 85 TAIWAN FAT RANCIDITY IN FOOD SHELF LIFE TESTING MARKET, BY TESTING TECHNOLOGY, 2020-2029 (USD MILLION)
TABLE 86 TAIWAN OTHERS IN FOOD SHELF LIFE TESTING MARKET, BY TESTING TECHNOLOGY, 2020-2029 (USD MILLION)
TABLE 87 TAIWAN FOOD SHELF LIFE TESTING MARKET, BY METHOD, 2020-2029 (USD MILLION)
TABLE 88 TAIWAN FOOD SHELF LIFE TESTING MARKET, BY TESTING TECHNOLOGY, 2020-2029 (USD MILLION)
TABLE 89 TAIWAN EQUIPMENT & KIT-BASED IN FOOD SHELF LIFE TESTING MARKET, BY TYPE, 2020-2029 (USD MILLION)
TABLE 90 TAIWAN FOOD SHELF LIFE TESTING MARKET, BY CONDITION, 2020-2029 (USD MILLION)
TABLE 91 TAIWAN FOOD SHELF LIFE TESTING MARKET, BY FOOD TESTED, 2020-2029 (USD MILLION)
TABLE 92 TAIWAN FOOD IN FOOD SHELF LIFE TESTING MARKET, BY TYPE, 2020-2029 (USD MILLION)
TABLE 93 TAIWAN DAIRY & DAIRY PRODUCTS IN FOOD SHELF LIFE TESTING MARKET, BY TYPE, 2020-2029 (USD MILLION)
TABLE 94 TAIWAN CHEESE BASED DESSERT IN FOOD SHELF LIFE TESTING MARKET, BY TYPE, 2020-2029 (USD MILLION)
TABLE 95 TAIWAN BAKERY & CONFECTIONERY PRODUCTS IN FOOD SHELF LIFE TESTING MARKET, BY TYPE, 2020-2029 (USD MILLION)
TABLE 96 TAIWAN MEAT & MEAT PRODUCTS IN FOOD SHELF LIFE TESTING MARKET, BY TYPE, 2020-2029 (USD MILLION)
TABLE 97 TAIWAN EDIBLE OIL IN FOOD SHELF LIFE TESTING MARKET, BY TYPE, 2020-2029 (USD MILLION)
TABLE 98 TAIWAN PROCESSED FRUITS & VEGETABLES IN FOOD SHELF LIFE TESTING MARKET, BY TYPE, 2020-2029 (USD MILLION)
TABLE 99 TAIWAN INFANT FORMULA IN FOOD SHELF LIFE TESTING MARKET, BY TYPE, 2020-2029 (USD MILLION)
TABLE 100 TAIWAN NUTS IN FOOD SHELF LIFE TESTING MARKET, BY TYPE, 2020-2029 (USD MILLION)
TABLE 101 TAIWAN FOOD IN FOOD SHELF LIFE TESTING MARKET, BY TESTING TECHNOLOGY, 2020-2029 (USD MILLION)
TABLE 102 TAIWAN FOOD IN FOOD SHELF LIFE TESTING MARKET, BY PARAMETER, 2020-2029 (USD MILLION)
TABLE 103 TAIWAN BEVERAGES IN FOOD SHELF LIFE TESTING MARKET, BY TYPE, 2020-2029 (USD MILLION)
TABLE 104 TAIWAN ALCOHOLIC IN FOOD SHELF LIFE TESTING MARKET, BY TYPE, 2020-2029 (USD MILLION)
TABLE 105 TAIWAN NON-ALCOHOLIC IN FOOD SHELF LIFE TESTING MARKET, BY TYPE, 2020-2029 (USD MILLION)
TABLE 106 TAIWAN BEVERAGES IN FOOD SHELF LIFE TESTING MARKET, BY TESTING TECHNOLOGY, 2020-2029 (USD MILLION)
TABLE 107 TAIWAN BEVERAGES IN FOOD SHELF LIFE TESTING MARKET, BY PARAMETER, 2020-2029 (USD MILLION)
TABLE 108 HONG KONG FOOD SHELF LIFE TESTING MARKET, BY TYPE, 2020-2029 (USD MILLION)
TABLE 109 HONG KONG FOOD SHELF LIFE TESTING MARKET, BY PARAMETER, 2020-2029 (USD MILLION)
TABLE 110 HONG KONG MICRO-ORGANISMS IN FOOD SHELF LIFE TESTING MARKET, BY TYPE, 2020-2029 (USD MILLION)
TABLE 111 HONG KONG MICRO-ORGANISMS IN FOOD SHELF LIFE TESTING MARKET, BY TESTING TECHNOLOGY, 2020-2029 (USD MILLION)
TABLE 112 HONG KONG NUTRIENT STABILITY IN FOOD SHELF LIFE TESTING MARKET, BY TESTING TECHNOLOGY, 2020-2029 (USD MILLION)
TABLE 113 HONG KONG ORGANOLEPTIC PROPERTIES IN FOOD SHELF LIFE TESTING MARKET, BY TESTING TECHNOLOGY, 2020-2029 (USD MILLION)
TABLE 114 HONG KONG WATER ACTIVITY IN FOOD SHELF LIFE TESTING MARKET, BY TESTING TECHNOLOGY, 2020-2029 (USD MILLION)
TABLE 115 HONG KONG LABEL CLAIMS IN FOOD SHELF LIFE TESTING MARKET, BY TESTING TECHNOLOGY, 2020-2029 (USD MILLION)
TABLE 116 HONG KONG TOTAL VIABLE COUNT (TVC) IN FOOD SHELF LIFE TESTING MARKET, BY TESTING TECHNOLOGY, 2020-2029 (USD MILLION)
TABLE 117 HONG KONG MOISTURE CONTENT IN FOOD SHELF LIFE TESTING MARKET, BY TESTING TECHNOLOGY, 2020-2029 (USD MILLION)
TABLE 118 HONG KONG ACIDITY LEVELS IN FOOD SHELF LIFE TESTING MARKET, BY TESTING TECHNOLOGY, 2020-2029 (USD MILLION)
TABLE 119 HONG KONG PH IN FOOD SHELF LIFE TESTING MARKET, BY TESTING TECHNOLOGY, 2020-2029 (USD MILLION)
TABLE 120 HONG KONG FAT RANCIDITY IN FOOD SHELF LIFE TESTING MARKET, BY TESTING TECHNOLOGY, 2020-2029 (USD MILLION)
TABLE 121 HONG KONG OTHERS IN FOOD SHELF LIFE TESTING MARKET, BY TESTING TECHNOLOGY, 2020-2029 (USD MILLION)
TABLE 122 HONG KONG FOOD SHELF LIFE TESTING MARKET, BY METHOD, 2020-2029 (USD MILLION)
TABLE 123 HONG KONG FOOD SHELF LIFE TESTING MARKET, BY TESTING TECHNOLOGY, 2020-2029 (USD MILLION)
TABLE 124 HONG KONG EQUIPMENT & KIT-BASED IN FOOD SHELF LIFE TESTING MARKET, BY TYPE, 2020-2029 (USD MILLION)
TABLE 125 HONG KONG FOOD SHELF LIFE TESTING MARKET, BY CONDITION, 2020-2029 (USD MILLION)
TABLE 126 HONG KONG IN FOOD SHELF LIFE TESTING MARKET, BY FOOD TESTED, 2020-2029 (USD MILLION)
TABLE 127 HONG KONG FOOD IN TESTED FOOD SHELF LIFE TESTING MARKET, BY TYPE, 2020-2029 (USD MILLION)
TABLE 128 HONG KONG DAIRY & DAIRY PRODUCTS IN FOOD SHELF LIFE TESTING MARKET, BY TYPE, 2020-2029 (USD MILLION)
TABLE 129 HONG KONG CHEESE BASED DESSERT IN FOOD SHELF LIFE TESTING MARKET, BY TYPE, 2020-2029 (USD MILLION)
TABLE 130 HONG KONG BAKERY & CONFECTIONERY PRODUCTS IN FOOD SHELF LIFE TESTING MARKET, BY TYPE, 2020-2029 (USD MILLION)
TABLE 131 HONG KONG MEAT & MEAT PRODUCTS IN FOOD SHELF LIFE TESTING MARKET, BY TYPE, 2020-2029 (USD MILLION)
TABLE 132 HONG KONG EDIBLE OIL IN FOOD SHELF LIFE TESTING MARKET, BY TYPE, 2020-2029 (USD MILLION)
TABLE 133 HONG KONG PROCESSED FRUITS & VEGETABLES IN FOOD SHELF LIFE TESTING MARKET, BY TYPE, 2020-2029 (USD MILLION)
TABLE 134 HONG KONG INFANT FORMULA IN FOOD SHELF LIFE TESTING MARKET, BY TYPE, 2020-2029 (USD MILLION)
TABLE 135 HONG KONG NUTS IN FOOD SHELF LIFE TESTING MARKET, BY TYPE, 2020-2029 (USD MILLION)
TABLE 136 HONG KONG FOOD IN FOOD SHELF LIFE TESTING MARKET, BY TESTING TECHNOLOGY, 2020-2029 (USD MILLION)
TABLE 137 HONG KONG FOOD IN FOOD SHELF LIFE TESTING MARKET, BY PARAMETER, 2020-2029 (USD MILLION)
TABLE 138 HONG KONG BEVERAGES IN FOOD SHELF LIFE TESTING MARKET, BY TYPE, 2020-2029 (USD MILLION)
TABLE 139 HONG KONG ALCOHOLIC IN FOOD SHELF LIFE TESTING MARKET, BY TYPE, 2020-2029 (USD MILLION)
TABLE 140 HONG KONG NON-ALCOHOLIC IN FOOD SHELF LIFE TESTING MARKET, BY TYPE, 2020-2029 (USD MILLION)
TABLE 141 HONG KONG BEVERAGES IN FOOD SHELF LIFE TESTING MARKET, BY TESTING TECHNOLOGY, 2020-2029 (USD MILLION)
TABLE 142 HONG KONG BEVERAGES IN FOOD SHELF LIFE TESTING MARKET, BY PARAMETER, 2020-2029 (USD MILLION)
TABLE 143 JAPAN FOOD SHELF LIFE TESTING MARKET, BY TYPE, 2020-2029 (USD MILLION)
TABLE 144 JAPAN FOOD SHELF LIFE TESTING MARKET, BY PARAMETER, 2020-2029 (USD MILLION)
TABLE 145 JAPAN MICRO-ORGANISMS IN FOOD SHELF LIFE TESTING MARKET, BY TYPE, 2020-2029 (USD MILLION)
TABLE 146 JAPAN MICRO-ORGANISMS IN FOOD SHELF LIFE TESTING MARKET, BY TESTING TECHNOLOGY, 2020-2029 (USD MILLION)
TABLE 147 JAPAN NUTRIENT STABILITY IN FOOD SHELF LIFE TESTING MARKET, BY TESTING TECHNOLOGY, 2020-2029 (USD MILLION)
TABLE 148 JAPAN ORGANOLEPTIC PROPERTIES IN FOOD SHELF LIFE TESTING MARKET, BY TESTING TECHNOLOGY, 2020-2029 (USD MILLION)
TABLE 149 JAPAN WATER ACTIVITY IN FOOD SHELF LIFE TESTING MARKET, BY TESTING TECHNOLOGY, 2020-2029 (USD MILLION)
TABLE 150 JAPAN LABEL CLAIMS IN FOOD SHELF LIFE TESTING MARKET, BY TESTING TECHNOLOGY, 2020-2029 (USD MILLION)
TABLE 151 JAPAN TOTAL VIABLE COUNT (TVC) FOOD SHELF LIFE TESTING MARKET, BY TESTING TECHNOLOGY, 2020-2029 (USD MILLION)
TABLE 152 JAPAN MOISTURE CONTENT IN FOOD SHELF LIFE TESTING MARKET, BY TESTING TECHNOLOGY, 2020-2029 (USD MILLION)
TABLE 153 JAPAN ACIDITY LEVELS IN FOOD SHELF LIFE TESTING MARKET, BY TESTING TECHNOLOGY, 2020-2029 (USD MILLION)
TABLE 154 JAPAN PH IN FOOD SHELF LIFE TESTING MARKET, BY TESTING TECHNOLOGY, 2020-2029 (USD MILLION)
TABLE 155 JAPAN FAT RANCIDITY IN FOOD SHELF LIFE TESTING MARKET, BY TESTING TECHNOLOGY, 2020-2029 (USD MILLION)
TABLE 156 JAPAN OTHERS IN FOOD SHELF LIFE TESTING MARKET, BY TESTING TECHNOLOGY, 2020-2029 (USD MILLION)
TABLE 157 JAPAN FOOD SHELF LIFE TESTING MARKET, BY METHOD, 2020-2029 (USD MILLION)
TABLE 158 JAPAN FOOD SHELF LIFE TESTING MARKET, BY TESTING TECHNOLOGY, 2020-2029 (USD MILLION)
TABLE 159 JAPAN EQUIPMENT & KIT-BASED IN FOOD SHELF LIFE TESTING MARKET, BY TYPE, 2020-2029 (USD MILLION)
TABLE 160 JAPAN FOOD SHELF LIFE TESTING MARKET, BY CONDITION, 2020-2029 (USD MILLION)
TABLE 161 JAPAN FOOD SHELF LIFE TESTING MARKET, BY FOOD TESTED, 2020-2029 (USD MILLION)
TABLE 162 JAPAN FOOD IN FOOD SHELF LIFE TESTING MARKET, BY TYPE, 2020-2029 (USD MILLION)
TABLE 163 JAPAN DAIRY & DAIRY PRODUCTS, FOOD SHELF LIFE TESTING MARKET, BY TYPE, 2020-2029 (USD MILLION)
TABLE 164 JAPAN CHEESE BASED DESSERT IN FOOD SHELF LIFE TESTING MARKET, BY TYPE, 2020-2029 (USD MILLION)
TABLE 165 JAPAN BAKERY & CONFECTIONERY PRODUCTS IN FOOD SHELF LIFE TESTING MARKET, BY TYPE, 2020-2029 (USD MILLION)
TABLE 166 JAPAN MEAT & MEAT PRODUCTS IN FOOD SHELF LIFE TESTING MARKET, BY TYPE, 2020-2029 (USD MILLION)
TABLE 167 JAPAN EDIBLE OIL IN FOOD SHELF LIFE TESTING MARKET, BY TYPE, 2020-2029 (USD MILLION)
TABLE 168 JAPAN PROCESSED FRUITS & VEGETABLES IN FOOD SHELF LIFE TESTING MARKET, BY TYPE, 2020-2029 (USD MILLION)
TABLE 169 JAPAN INFANT FORMULA IN FOOD SHELF LIFE TESTING MARKET, BY TYPE, 2020-2029 (USD MILLION)
TABLE 170 JAPAN NUTS IN FOOD SHELF LIFE TESTING MARKET, BY TYPE, 2020-2029 (USD MILLION)
TABLE 171 JAPAN FOOD IN FOOD SHELF LIFE TESTING MARKET, BY TESTING TECHNOLOGY, 2020-2029 (USD MILLION)
TABLE 172 JAPAN FOOD IN FOOD SHELF LIFE TESTING MARKET, BY PARAMETER, 2020-2029 (USD MILLION)
TABLE 173 JAPAN BEVERAGES IN FOOD SHELF LIFE TESTING MARKET, BY TYPE, 2020-2029 (USD MILLION)
TABLE 174 JAPAN ALCOHOLIC IN FOOD SHELF LIFE TESTING MARKET, BY TYPE, 2020-2029 (USD MILLION)
TABLE 175 JAPAN NON-ALCOHOLIC IN FOOD SHELF LIFE TESTING MARKET, BY TYPE, 2020-2029 (USD MILLION)
TABLE 176 JAPAN BEVERAGES IN FOOD SHELF LIFE TESTING MARKET, BY TESTING TECHNOLOGY, 2020-2029 (USD MILLION)
TABLE 177 JAPAN BEVERAGES IN FOOD SHELF LIFE TESTING MARKET, BY PARAMETER, 2020-2029 (USD MILLION)
TABLE 178 KOREA FOOD SHELF LIFE TESTING MARKET, BY TYPE, 2020-2029 (USD MILLION)
TABLE 179 KOREA FOOD SHELF LIFE TESTING MARKET, BY PARAMETER, 2020-2029 (USD MILLION)
TABLE 180 KOREA MICRO-ORGANISMS IN FOOD SHELF LIFE TESTING MARKET, BY TYPE, 2020-2029 (USD MILLION)
TABLE 181 KOREA MICRO-ORGANISMS IN FOOD SHELF LIFE TESTING MARKET, BY TESTING TECHNOLOGY, 2020-2029 (USD MILLION)
TABLE 182 KOREA NUTRIENT STABILITY IN FOOD SHELF LIFE TESTING MARKET, BY TESTING TECHNOLOGY, 2020-2029 (USD MILLION)
TABLE 183 KOREA ORGANOLEPTIC PROPERTIES IN FOOD SHELF LIFE TESTING MARKET, BY TESTING TECHNOLOGY, 2020-2029 (USD MILLION)
TABLE 184 KOREA WATER ACTIVITY IN FOOD SHELF LIFE TESTING MARKET, BY TESTING TECHNOLOGY, 2020-2029 (USD MILLION)
TABLE 185 KOREA LABEL CLAIMS IN FOOD SHELF LIFE TESTING MARKET, BY TESTING TECHNOLOGY, 2020-2029 (USD MILLION)
TABLE 186 KOREA TOTAL VIABLE COUNT (TVC) IN FOOD SHELF LIFE TESTING MARKET, BY TESTING TECHNOLOGY, 2020-2029 (USD MILLION)
TABLE 187 KOREA MOISTURE CONTENT IN FOOD SHELF LIFE TESTING MARKET, BY TESTING TECHNOLOGY, 2020-2029 (USD MILLION)
TABLE 188 KOREA ACIDITY LEVELS IN FOOD SHELF LIFE TESTING MARKET, BY TESTING TECHNOLOGY, 2020-2029 (USD MILLION)
TABLE 189 KOREA PH IN FOOD SHELF LIFE TESTING MARKET, BY TESTING TECHNOLOGY, 2020-2029 (USD MILLION)
TABLE 190 KOREA FAT RANCIDITY IN FOOD SHELF LIFE TESTING MARKET, BY TESTING TECHNOLOGY, 2020-2029 (USD MILLION)
TABLE 191 KOREA OTHERS IN FOOD SHELF LIFE TESTING MARKET, BY TESTING TECHNOLOGY, 2020-2029 (USD MILLION)
TABLE 192 KOREA FOOD SHELF LIFE TESTING MARKET, BY METHOD, 2020-2029 (USD MILLION)
TABLE 193 KOREA FOOD SHELF LIFE TESTING MARKET, BY TESTING TECHNOLOGY, 2020-2029 (USD MILLION)
TABLE 194 KOREA EQUIPMENT & KIT-BASED IN FOOD SHELF LIFE TESTING MARKET, BY TYPE, 2020-2029 (USD MILLION)
TABLE 195 KOREA FOOD SHELF LIFE TESTING MARKET, BY CONDITION, 2020-2029 (USD MILLION)
TABLE 196 KOREA FOOD SHELF LIFE TESTING MARKET, BY FOOD TESTED, 2020-2029 (USD MILLION)
TABLE 197 KOREA FOOD IN FOOD SHELF LIFE TESTING MARKET, BY TYPE, 2020-2029 (USD MILLION)
TABLE 198 KOREA DAIRY & DAIRY PRODUCTS IN FOOD SHELF LIFE TESTING MARKET, BY TYPE, 2020-2029 (USD MILLION)
TABLE 199 KOREA CHEESE BASED DESSERT IN FOOD SHELF LIFE TESTING MARKET, BY TYPE, 2020-2029 (USD MILLION)
TABLE 200 KOREA BAKERY & CONFECTIONERY PRODUCTS IN FOOD SHELF LIFE TESTING MARKET, BY TYPE, 2020-2029 (USD MILLION)
TABLE 201 KOREA MEAT & MEAT PRODUCTS IN FOOD SHELF LIFE TESTING MARKET, BY TYPE, 2020-2029 (USD MILLION)
TABLE 202 KOREA EDIBLE OIL IN FOOD SHELF LIFE TESTING MARKET, BY TYPE, 2020-2029 (USD MILLION)
TABLE 203 KOREA PROCESSED FRUITS & VEGETABLES IN FOOD SHELF LIFE TESTING MARKET, BY TYPE, 2020-2029 (USD MILLION)
TABLE 204 KOREA INFANT FORMULA IN FOOD SHELF LIFE TESTING MARKET, BY TYPE, 2020-2029 (USD MILLION)
TABLE 205 KOREA NUTS IN FOOD SHELF LIFE TESTING MARKET, BY TYPE, 2020-2029 (USD MILLION)
TABLE 206 KOREA FOOD IN FOOD SHELF LIFE TESTING MARKET, BY TESTING TECHNOLOGY, 2020-2029 (USD MILLION)
TABLE 207 KOREA FOOD IN FOOD SHELF LIFE TESTING MARKET, BY PARAMETER, 2020-2029 (USD MILLION)
TABLE 208 KOREA BEVERAGES IN FOOD SHELF LIFE TESTING MARKET, BY TYPE, 2020-2029 (USD MILLION)
TABLE 209 KOREA ALCOHOLIC IN FOOD SHELF LIFE TESTING MARKET, BY TYPE, 2020-2029 (USD MILLION)
TABLE 210 KOREA NON-ALCOHOLIC IN FOOD SHELF LIFE TESTING MARKET, BY TYPE, 2020-2029 (USD MILLION)
TABLE 211 KOREA BEVERAGES IN FOOD SHELF LIFE TESTING MARKET, BY TESTING TECHNOLOGY, 2020-2029 (USD MILLION)
TABLE 212 KOREA BEVERAGES IN FOOD SHELF LIFE TESTING MARKET, BY PARAMETER, 2020-2029 (USD MILLION)
TABLE 213 VIETNAM FOOD SHELF LIFE TESTING MARKET, BY TYPE, 2020-2029 (USD MILLION)
TABLE 214 VIETNAM FOOD SHELF LIFE TESTING MARKET, BY PARAMETER, 2020-2029 (USD MILLION)
TABLE 215 VIETNAM MICRO-ORGANISMS IN FOOD SHELF LIFE TESTING MARKET, BY TYPE, 2020-2029 (USD MILLION)
TABLE 216 VIETNAM MICRO-ORGANISMS IN FOOD SHELF LIFE TESTING MARKET, BY TESTING TECHNOLOGY, 2020-2029 (USD MILLION)
TABLE 217 VIETNAM NUTRIENT STABILITY IN FOOD SHELF LIFE TESTING MARKET, BY TESTING TECHNOLOGY, 2020-2029 (USD MILLION)
TABLE 218 VIETNAM ORGANOLEPTIC PROPERTIES IN FOOD SHELF LIFE TESTING MARKET, BY TESTING TECHNOLOGY, 2020-2029 (USD MILLION)
TABLE 219 VIETNAM WATER ACTIVITY IN FOOD SHELF LIFE TESTING MARKET, BY TESTING TECHNOLOGY, 2020-2029 (USD MILLION)
TABLE 220 VIETNAM LABEL CLAIMS IN FOOD SHELF LIFE TESTING MARKET, BY TESTING TECHNOLOGY, 2020-2029 (USD MILLION)
TABLE 221 VIETNAM TOTAL VIABLE COUNT (TVC) IN FOOD SHELF LIFE TESTING MARKET, BY TESTING TECHNOLOGY, 2020-2029 (USD MILLION)
TABLE 222 VIETNAM MOISTURE CONTENT IN FOOD SHELF LIFE TESTING MARKET, BY TESTING TECHNOLOGY, 2020-2029 (USD MILLION)
TABLE 223 VIETNAM ACIDITY LEVELS IN FOOD SHELF LIFE TESTING MARKET, BY TESTING TECHNOLOGY, 2020-2029 (USD MILLION)
TABLE 224 VIETNAM PH IN FOOD SHELF LIFE TESTING MARKET, BY TESTING TECHNOLOGY, 2020-2029 (USD MILLION)
TABLE 225 VIETNAM FAT RANCIDITY IN FOOD SHELF LIFE TESTING MARKET, BY TESTING TECHNOLOGY, 2020-2029 (USD MILLION)
TABLE 226 VIETNAM OTHERS IN FOOD SHELF LIFE TESTING MARKET, BY TESTING TECHNOLOGY, 2020-2029 (USD MILLION)
TABLE 227 VIETNAM FOOD SHELF LIFE TESTING MARKET, BY METHOD, 2020-2029 (USD MILLION)
TABLE 228 VIETNAM FOOD SHELF LIFE TESTING MARKET, BY TESTING TECHNOLOGY, 2020-2029 (USD MILLION)
TABLE 229 VIETNAM EQUIPMENT & KIT-BASED IN FOOD SHELF LIFE TESTING MARKET, BY TYPE, 2020-2029 (USD MILLION)
TABLE 230 VIETNAM FOOD SHELF LIFE TESTING MARKET, BY CONDITION, 2020-2029 (USD MILLION)
TABLE 231 VIETNAM FOOD SHELF LIFE TESTING MARKET, BY FOOD TESTED, 2020-2029 (USD MILLION)
TABLE 232 VIETNAM FOOD IN FOOD SHELF LIFE TESTING MARKET, BY TYPE, 2020-2029 (USD MILLION)
TABLE 233 VIETNAM DAIRY & DAIRY PRODUCTS IN FOOD SHELF LIFE TESTING MARKET, BY TYPE, 2020-2029 (USD MILLION)
TABLE 234 VIETNAM CHEESE BASED DESSERT IN FOOD SHELF LIFE TESTING MARKET, BY TYPE, 2020-2029 (USD MILLION)
TABLE 235 VIETNAM BAKERY & CONFECTIONERY PRODUCTS IN FOOD SHELF LIFE TESTING MARKET, BY TYPE, 2020-2029 (USD MILLION)
TABLE 236 VIETNAM MEAT & MEAT PRODUCTS IN FOOD SHELF LIFE TESTING MARKET, BY TYPE, 2020-2029 (USD MILLION)
TABLE 237 VIETNAM EDIBLE OIL IN FOOD SHELF LIFE TESTING MARKET, BY TYPE, 2020-2029 (USD MILLION)
TABLE 238 VIETNAM PROCESSED FRUITS & VEGETABLES IN FOOD SHELF LIFE TESTING MARKET, BY TYPE, 2020-2029 (USD MILLION)
TABLE 239 VIETNAM INFANT FORMULA IN FOOD SHELF LIFE TESTING MARKET, BY TYPE, 2020-2029 (USD MILLION)
TABLE 240 VIETNAM NUTS IN FOOD SHELF LIFE TESTING MARKET, BY TYPE, 2020-2029 (USD MILLION)
TABLE 241 VIETNAM FOOD IN FOOD SHELF LIFE TESTING MARKET, BY TESTING TECHNOLOGY, 2020-2029 (USD MILLION)
TABLE 242 VIETNAM FOOD IN FOOD SHELF LIFE TESTING MARKET, BY PARAMETER, 2020-2029 (USD MILLION)
TABLE 243 VIETNAM BEVERAGES IN FOOD SHELF LIFE TESTING MARKET, BY TYPE, 2020-2029 (USD MILLION)
TABLE 244 VIETNAM ALCOHOLIC IN FOOD SHELF LIFE TESTING MARKET, BY TYPE, 2020-2029 (USD MILLION)
TABLE 245 VIETNAM NON-ALCOHOLIC IN FOOD SHELF LIFE TESTING MARKET, BY TYPE, 2020-2029 (USD MILLION)
TABLE 246 VIETNAM BEVERAGES IN FOOD SHELF LIFE TESTING MARKET, BY TESTING TECHNOLOGY, 2020-2029 (USD MILLION)
TABLE 247 VIETNAM BEVERAGES IN FOOD SHELF LIFE TESTING MARKET, BY PARAMETER, 2020-2029 (USD MILLION)
List of Figure
FIGURE 1 CHINA, TAIWAN, HONG KONG, VIETNAM, JAPAN, AND KOREA FOOD SHELF LIFE TESTING MARKET: SEGMENTATION
FIGURE 2 CHINA, TAIWAN, HONG KONG, VIETNAM, JAPAN, AND KOREA FOOD SHELF LIFE TESTING MARKET: DATA TRIANGULATION
FIGURE 3 CHINA, TAIWAN, HONG KONG, VIETNAM, JAPAN, AND KOREA FOOD SHELF LIFE TESTING MARKET: DROC ANALYSIS
FIGURE 4 CHINA, TAIWAN, HONG KONG, VIETNAM, JAPAN, AND KOREA FOOD SHELF LIFE TESTING MARKET: GLOBAL VS REGIONAL MARKET ANALYSIS
FIGURE 5 CHINA, TAIWAN, HONG KONG, VIETNAM, JAPAN, KOREA FOOD SHELF LIFE TESTING MARKET: COMPANY RESEARCH ANALYSIS
FIGURE 6 CHINA, TAIWAN, HONG KONG, VIETNAM, JAPAN, AND KOREA FOOD SHELF LIFE TESTING MARKET: THE DISTRIBUTION CHANNEL LIFE LINE CURVE
FIGURE 7 CHINA, TAIWAN, HONG KONG, VIETNAM, JAPAN, AND KOREA FOOD SHELF LIFE TESTING MARKET: INTERVIEW DEMOGRAPHICS
FIGURE 8 CHINA, TAIWAN, HONG KONG, VIETNAM, JAPAN, AND KOREA FOOD SHELF LIFE TESTING MARKET: DBMR MARKET POSITION GRID
FIGURE 9 CHINA, TAIWAN, HONG KONG, VIETNAM, JAPAN, AND KOREA FOOD SHELF LIFE TESTING MARKET: MARKET APPLICATION COVERAGE GRID
FIGURE 10 CHINA, TAIWAN, HONG KONG, VIETNAM, JAPAN, AND KOREA FOOD SHELF LIFE TESTING MARKET: THE MARKET CHALLENGE MATRIX
FIGURE 11 CHINA, TAIWAN, HONG KONG, VIETNAM, JAPAN, AND KOREA FOOD SHELF LIFE TESTING MARKET: VENDOR SHARE ANALYSIS
FIGURE 12 CHINA, TAIWAN, HONG KONG, VIETNAM, JAPAN, AND KOREA FOOD SHELF LIFE TESTING MARKET: SEGMENTATION
FIGURE 13 NEWER TECHNOLOGY ADAPTATION AND STRATEGIC ALLIANCES AMONG LEADING CORPORATIONS ARE EXPECTED TO DRIVE THE CHINA, TAIWAN, HONG KONG, VIETNAM, JAPAN, AND KOREA FOOD SHELF LIFE TESTING MARKET IN THE FORECAST PERIOD OF 2022 TO 2029
FIGURE 14 THE SERVICES SEGMENT IS EXPECTED TO ACCOUNT FOR THE LARGEST SHARE OF THE CHINA, TAIWAN, HONG KONG, VIETNAM, JAPAN, AND KOREA FOOD SHELF LIFE TESTING MARKET IN 2022 & 2029
FIGURE 15 MARKETING STRATEGIES ADOPTED BY MARKET PLAYERS
FIGURE 16 SUPPLY CHAIN ANALYSIS- CHINA, TAIWAN, HONG KONG, VIETNAM, JAPAN, AND KOREA FOOD SHELF LIFE TESTING MARKET
FIGURE 17 VALUE CHAIN OF CHINA, TAIWAN, HONG KONG, VIETNAM, JAPAN, AND KOREA FOOD SHELF LIFE TESTING MARKET
FIGURE 18 DRIVERS, RESTRAINTS, OPPORTUNITIES, AND CHALLENGES OF CHINA, TAIWAN, HONG KONG, VIETNAM, JAPAN, AND KOREA FOOD SHELF-LIFE TESTING MARKET
FIGURE 19 CHINA, TAIWAN, HONG KONG, VIETNAM, JAPAN, AND KOREA FOOD SHELF LIFE TESTING MARKET: BY TYPE, 2021
FIGURE 20 CHINA, TAIWAN, HONG KONG, VIETNAM, JAPAN, AND KOREA FOOD SHELF LIFE TESTING MARKET: BY PARAMETER, 2021
FIGURE 21 CHINA, TAIWAN, HONG KONG, VIETNAM, JAPAN, AND KOREA FOOD SHELF LIFE TESTING MARKET: BY METHOD, 2021
FIGURE 22 CHINA, TAIWAN, HONG KONG, VIETNAM, JAPAN, AND KOREA FOOD SHELF LIFE TESTING MARKET: BY TESTING TECHNOLOGY, 2021
FIGURE 23 CHINA, TAIWAN, HONG KONG, VIETNAM, JAPAN, AND KOREA FOOD SHELF LIFE TESTING MARKET: BY CONDITION, 2021
FIGURE 24 CHINA, TAIWAN, HONG KONG, VIETNAM, JAPAN, AND KOREA FOOD SHELF LIFE TESTING MARKET: BY FOOD TESTED, 2021
FIGURE 25 CHINA, TAIWAN, HONG KONG, VIETNAM, JAPAN, KOREA FOOD SHELF LIFE TESTING MARKET: SNAPSHOT (2021)
FIGURE 26 CHINA, TAIWAN, HONG KONG, VIETNAM, JAPAN, KOREA FOOD SHELF LIFE TESTING MARKET: BY COUNTRY (2021)
FIGURE 27 CHINA, TAIWAN, HONG KONG, VIETNAM, JAPAN, KOREA FOOD SHELF LIFE TESTING MARKET: BY COUNTRY (2022 & 2029)
FIGURE 28 CHINA, TAIWAN, HONG KONG, VIETNAM, JAPAN, KOREA FOOD SHELF LIFE TESTING MARKET: BY COUNTRY (2021 & 2029)
FIGURE 29 CHINA, TAIWAN, HONG KONG, VIETNAM, JAPAN, KOREA FOOD SHELF LIFE TESTING MARKET: BY TYPE (2022-2029) OVERALL
FIGURE 30 CHINA, TAIWAN, HONG KONG, VIETNAM, JAPAN, AND KOREA FOOD SHELF LIFE TESTING MARKET: COMPANY SHARE 2021 (%)
China Taiwan Hong Kong Vietnam Japan And Korea Food Shelf Life Testing Market, Supply Chain Analysis and Ecosystem Framework
To support market growth and help clients navigate the impact of geopolitical shifts, DBMR has integrated in-depth supply chain analysis into its China Taiwan Hong Kong Vietnam Japan And Korea Food Shelf Life Testing Market research reports. This addition empowers clients to respond effectively to global changes affecting their industries. The supply chain analysis section includes detailed insights such as China Taiwan Hong Kong Vietnam Japan And Korea Food Shelf Life Testing Market consumption and production by country, price trend analysis, the impact of tariffs and geopolitical developments, and import and export trends by country and HSN code. It also highlights major suppliers with data on production capacity and company profiles, as well as key importers and exporters. In addition to research, DBMR offers specialized supply chain consulting services backed by over a decade of experience, providing solutions like supplier discovery, supplier risk assessment, price trend analysis, impact evaluation of inflation and trade route changes, and comprehensive market trend analysis.
Data collection and base year analysis are done using data collection modules with large sample sizes. The stage includes obtaining market information or related data through various sources and strategies. It includes examining and planning all the data acquired from the past in advance. It likewise envelops the examination of information inconsistencies seen across different information sources. The market data is analysed and estimated using market statistical and coherent models. Also, market share analysis and key trend analysis are the major success factors in the market report. To know more, please request an analyst call or drop down your inquiry.
The key research methodology used by DBMR research team is data triangulation which involves data mining, analysis of the impact of data variables on the market and primary (industry expert) validation. Data models include Vendor Positioning Grid, Market Time Line Analysis, Market Overview and Guide, Company Positioning Grid, Patent Analysis, Pricing Analysis, Company Market Share Analysis, Standards of Measurement, Global versus Regional and Vendor Share Analysis. To know more about the research methodology, drop in an inquiry to speak to our industry experts.
Data Bridge Market Research is a leader in advanced formative research. We take pride in servicing our existing and new customers with data and analysis that match and suits their goal. The report can be customized to include price trend analysis of target brands understanding the market for additional countries (ask for the list of countries), clinical trial results data, literature review, refurbished market and product base analysis. Market analysis of target competitors can be analyzed from technology-based analysis to market portfolio strategies. We can add as many competitors that you require data about in the format and data style you are looking for. Our team of analysts can also provide you data in crude raw excel files pivot tables (Fact book) or can assist you in creating presentations from the data sets available in the report.


