
Europe 3d Display Market
Market Size in USD Billion
 USD
10.78 Billion
USD
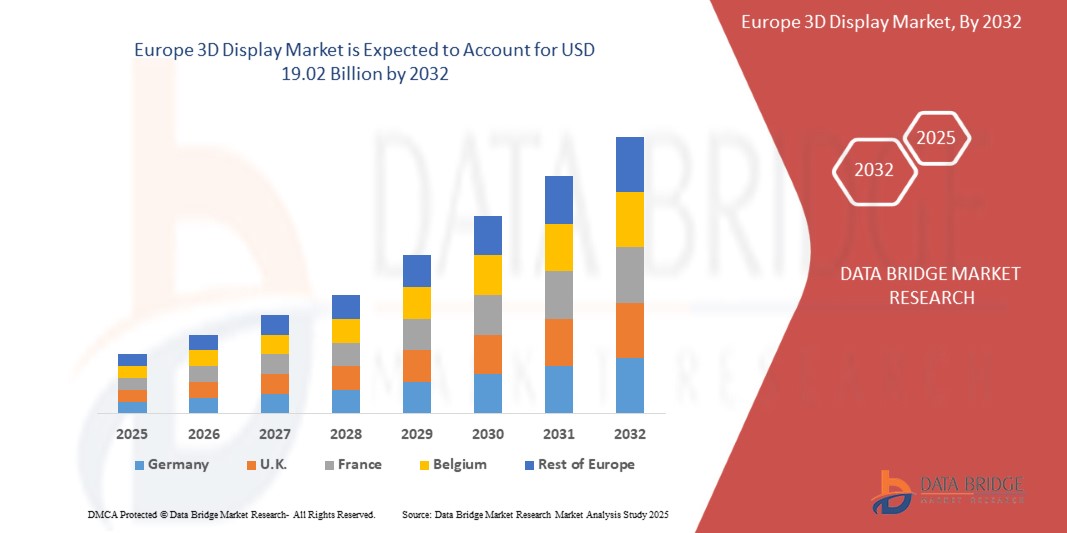
19.02 Billion
2024
2032
USD
10.78 Billion
USD
19.02 Billion
2024
2032
| 2025 - 2032 | |
| USD 10.78 Billion | |
| USD 19.02 Billion | |
| % | |
3D Display Market Analysis
The 3D display market is expanding rapidly, driven by surging demand across gaming, entertainment, healthcare, and automotive sectors. Consumers seek immersive experiences, fueling innovation in stereoscopic and autostereoscopic technologies. Advancements in augmented and virtual reality (AR/VR), alongside increasing adoption of 3D displays in medical imaging and advertising, further propel market growth. Asia-Pacific leads, supported by robust electronics manufacturing and rising tech adoption. Despite challenges like high production costs and limited content availability, ongoing R&D and falling hardware prices are enhancing accessibility. With evolving consumer expectations and technological progress, the 3D display market is poised for sustained Europe growth.
3D Display Market Size
Europe 3D display market is expected to reach USD 19.02 billion by 2032 from USD 10.78 billion in 2024, growing with a substantial CAGR of 7.56% in the forecast period of 2025 to 2032. In addition to the insights on market scenarios such as market value, growth rate, segmentation, geographical coverage, and major players, the market reports curated by the Data Bridge Market Research also include import export analysis, production capacity overview, production consumption analysis, price trend analysis, climate change scenario, supply chain analysis, value chain analysis, raw material/consumables overview, vendor selection criteria, PESTLE Analysis, Porter Analysis, and regulatory framework.
3D Display Market
“Integration of AI and IoT in 3D displays”
The integration of AI and IoT in 3D displays is revolutionizing user experiences across industries. AI enhances real-time image processing, enabling smarter, adaptive 3D visuals with improved depth perception and interactive capabilities. IoT connectivity allows seamless data exchange, optimizing display performance in smart homes, healthcare, automotive, and gaming. AI-powered analytics enhance content personalization, while IoT ensures real-time monitoring and remote management of 3D displays. In healthcare, AI-driven 3D imaging improves diagnostics and surgical precision. In automotive, it enables advanced HUDs. Together, AI and IoT are driving innovations, making 3D displays more intelligent, efficient, and user-centric.
Report Scope and Market Segmentation
|
Attributes |
3D Display Ingredients Key Market Insights |
|
Segments Covered |
|
|
Countries Covered |
Germany, France, Italy, Spain, U.K., Russia, Switzerland, Turkey, Belgium, Netherlands, Norway, Sweden, Poland, Luxemburg, and Rest of Europe |
|
Key Market Players |
Samsung Electronics Co., Ltd. (South Korea), LG Electronics Inc (South Korea), Leia Inc. (U.S.), Light Field Lab, Inc (U.S), AU Optronics Corporation (Taiwan), Himax Technologies, Inc (Taiwan), Sharp Corporation (Japan), Koninklijke Philips N.V (Netherlands), Holochip Corporation (U.S.), Holoxica Ltd (U.K), Avalon Holographics Inc (Canada), HYPERVSN (U.K.), Sony Electronics Inc (U.S.), Barco NV (Belgium), Vanguard LED Displays (U.S.), NanoLumens, Inc (U.S.), Magnetic 3D (U.S.), HOLOCO GmbH (Germany), Shenzhen MUXWAVE Technology Co., Ltd (China), Planar3D (Finland), and Fujifilm Holdings Corporation (Japan) |
|
Market Opportunities |
|
|
Value Added Data Infosets |
In addition to the insights on market scenarios such as market value, growth rate, segmentation, geographical coverage, and major players, the market reports curated by the Data Bridge Market Research also include import export analysis, production capacity overview, production consumption analysis, price trend analysis, climate change scenario, supply chain analysis, value chain analysis, raw material/consumables overview, vendor selection criteria, PESTLE Analysis, Porter Analysis, and regulatory framework. |
3D Display Market Definition
3D displays create depth perception by projecting two slightly offset images to each eye, mimicking natural vision. They enhance visual experiences across industries, from lifelike gaming to precise medical imaging, making content more dynamic and engaging. The integration of AI and IoT is revolutionizing 3D displays, enabling smarter content adaptation, real-time data visualization, and personalized experiences. AI optimizes rendering efficiency, while IoT connectivity enhances interactivity, making 3D displays more versatile across industries.
3D Display Market Dynamics
Drivers
- Growing Demand for 3D Content and Entertainment
The increasing demand for immersive and interactive experiences in the entertainment industry is a significant driver propelling the growth of the Europe 3D display market. Consumers today seek more engaging visual content in movies, gaming, and virtual reality (VR), pushing content creators and technology providers to innovate continuously.
The film industry has witnessed a surge in 3D movie production, driven by advancements in cinematography and digital effects. Major Hollywood studios and international filmmakers continue to invest in high-quality 3D content to enhance audience engagement. Moreover, the rise of streaming platforms such as Netflix, Disney+, and Amazon Prime has created new avenues for 3D content distribution. These platforms are increasingly integrating 3D and VR-compatible content, further fueling the need for advanced 3D displays.
The gaming industry is another major contributor to the rising demand for 3D displays. The increasing popularity of 3D gaming, augmented reality (AR), and virtual reality (VR) has led to higher adoption of high-resolution 3D screens in gaming consoles, PCs, and mobile devices. Leading game developers are incorporating realistic 3D graphics, depth perception, and interactive environments, enhancing the overall gaming experience. As competitive gaming (eSports) and cloud gaming continue to gain traction, the need for next-generation 3D display technologies is expected to grow significantly.
The expansion of VR and AR applications in entertainment is further driving market growth. VR headsets, AR smart glasses, and holographic displays rely on 3D visualization for enhanced realism and depth perception. Industries such as live concerts, theme parks, and immersive storytelling experiences are leveraging 3D projection mapping and interactive 3D displays to create dynamic and engaging experiences for audiences. Consumers increasingly prefer 4K, 8K, and 3D-capable televisions, projectors, and home theater systems for a more immersive experience. The trend towards glasses-free 3D displays and autostereoscopic screens is further boosting the adoption of 3D technology in entertainment and media.
For Instance,
- In August 2023, according to an article published by Ranking Articles, 3D content is becoming more immersive, interactive, and accessible. Advancements in AI, real-time rendering, and cloud computing drive innovation, expanding applications across industries. From virtual training to digital marketing, 3D content enhances visualization, engagement, and decision-making, shaping the future of digital interaction and immersive experiences.
- In November 2021, according to an article published by Datafloq, 3D entertainment technology is revolutionizing movies, TV, and gaming by enhancing realism and immersion. Advances in digital imaging, 3D glasses, and autostereoscopic displays enable more accessible and high-quality experiences. While challenges like content production costs remain, innovations in VR, 3D modeling, and display technology continue to shape the future of entertainment.
- In April 2024, according to an article published by Prolific Studio Best Animation Studio, 3D cartoon animation revolutionizes entertainment, marketing, and education with immersive visuals and storytelling. Iconic films like Toy Story and Frozen showcase its impact. As technology advances, 3D animation drives industry growth, offering limitless creative potential.
The rising demand for 3D content in movies, gaming, and virtual reality is driving advancements in 3D display technology, shaping the future of the entertainment industry. As content creation and distribution channels expand, the Europe 3D display market is poised for substantial growth.
- Advancements and Innovations in Display Technologies
The continuous advancements and innovations in display technologies are significantly driving the growth of the Europe 3D display market. As manufacturers and researchers push the boundaries of visual display capabilities, improvements in resolution, refresh rates, brightness, and viewing angles are enhancing the adoption of 3D displays across multiple industries, including entertainment, gaming, healthcare, and education.
One of the most significant innovations in the 3D display industry is autostereoscopic technology, which eliminates the need for special 3D glasses. This technology, used in products such as lenticular displays and parallax barrier screens, enhances user convenience and drives consumer adoption. Autostereoscopic 3D displays are increasingly being integrated into smartphones, tablets, laptops, and gaming consoles, offering an improved viewing experience without external accessories.
The introduction of Organic Light-Emitting Diode (OLED) and Micro-LED displays has revolutionized the 3D display market by offering superior contrast ratios, deeper blacks, and higher brightness levels. These advancements enable more lifelike and immersive 3D visuals, particularly in gaming and cinematic applications. OLED technology is also making its way into flexible and foldable displays, creating new possibilities for portable 3D viewing experiences. Holographic and light field display technologies are paving the way for the future of true 3D visualization. Unlike traditional 3D displays that rely on two perspectives, light field displays create multiple viewpoints, allowing users to experience depth perception from different angles naturally. This technology is being explored in medical imaging, military simulations, and augmented reality (AR) applications, further expanding the scope of the 3D display market.
Modern 3D displays are incorporating higher refresh rates (120Hz and beyond) and advanced image processing techniques to eliminate motion blur and reduce ghosting effects, ensuring a smoother and more comfortable viewing experience. AI-driven upscaling and real-time rendering technologies are also enhancing the quality of 3D content, making it more appealing for consumers and professionals alike.
For Instance,
- In January 2025, according to an article published by Essential Designs, The display technology landscape is evolving with innovations like RGB LED backlighting, massive 100-inch screens, and eye-friendly E Ink displays. These advancements enhance clarity, color accuracy, and energy efficiency across devices. As demand for immersive experiences grows, the future of display technology promises even greater visual and interactive possibilities.
- According to an article published by Holoware Computers Pvt. Ltd., Display technology has evolved from bulky CRTs to cutting-edge OLEDs, QLEDs, and microLEDs, enhancing clarity, efficiency, and immersive experiences. As innovations like holographic and flexible displays emerge, the future promises seamless integration of digital and physical worlds, revolutionizing how we interact with visual content across industries and daily life.
- In August 2024, according to an article published by Science X Network, Researchers developed a double-layer dry transfer printing technology to enhance ultrahigh-definition displays for AR and VR. This innovation boosts quantum dot efficiency to 23.3%, enabling high-resolution pixel patterning and mass production. The breakthrough promises brighter, more immersive visuals with improved color accuracy for next-generation wearable and smart display devices.
The Europe 3D display market is being fueled by rapid advancements in autostereoscopic, OLED, Micro-LED, holographic, and AI-enhanced display technologies. As these innovations continue to improve image quality, affordability, and accessibility, the adoption of 3D displays is expected to rise across various sectors, shaping the future of digital visualization.
Opportunities
- Rising Adoption of 3D Displays in Education and Training
The increasing adoption of 3D display technology in education and training presents a significant opportunity for market growth. As educational institutions and corporate training programs seek immersive, interactive, and engaging learning experiences, 3D displays are becoming essential tools for enhanced visualization, hands-on learning, and skill development across various sectors.
Traditional teaching methods often rely on textbooks, diagrams, and 2D visuals, which can limit comprehension, especially for complex subjects like medicine, engineering, and architecture. 3D displays provide lifelike representations of anatomical structures, mechanical designs, and historical artifacts, making learning more engaging and effective. These technologies allow students to interact with 3D models, improving retention and understanding. Industries such as healthcare, aviation, and manufacturing increasingly incorporate 3D displays into training simulations to provide hands-on experience without real-world risks. For instance, medical students use 3D visualization for surgical training, while pilots practice on flight simulators with realistic 3D cockpit displays. This reduces training costs, enhances skill development, and improves safety.
The combination of 3D display technology with augmented reality (AR) and virtual reality (VR) is revolutionizing corporate training, skill development, and e-learning platforms. Businesses use 3D-enabled virtual classrooms and training modules to enhance employee education, improve onboarding processes, and offer remote learning solutions. AR-powered 3D training in fields like military defense and industrial machinery is also gaining traction. As digital education expands, schools and universities are investing in 3D display-equipped smart classrooms to create a more engaging learning environment. In addition, online learning platforms are integrating 3D content to support remote education, enabling students to explore complex subjects through interactive 3D models and animations.
For Instance,
- In 2021, according to an article published by ScienceDirect, rising adoption of 3D displays in education and training is evident from a scoping review of 31 articles examining 3D environments, images, holograms, and prints in healthcare education. In contexts such as anatomy teaching, these technologies significantly enhance skills, knowledge, and student satisfaction, yielding improved learning outcomes and positive perceptions.
- In January 2024, according to an article published by Kantipur Themes, 3D holographic displays revolutionize education by creating immersive, multisensory learning environments that transform traditional classrooms. By enabling interactive exploration of complex subjects—ranging from anatomy to historical reenactments—these displays enhance comprehension, engagement, and retention. Customizable holographic content bridges theory and practice, significantly preparing students for future challenges in a technology-driven world.
- According to an article published by Atomic Pixels SL., 3D in education transforms teaching by integrating interactive tools like 3D printing, modeling, AR, and VR. These technologies foster hands-on, immersive learning, enhancing creativity, spatial reasoning, and collaboration. Platforms such as RealityMAX enable cloud-based, remote 3D project development, democratizing advanced design skills and effectively preparing students for future professional challenges
The rising adoption of 3D displays in education and training presents a major opportunity for market expansion. As demand for interactive and immersive learning experiences continues to grow, 3D display technology will play a crucial role in transforming education and professional training across industries.
- Expansion of 3D displays in Consumer Electronics and Automotive Industry
The increasing integration of 3D display technology in consumer electronics and the automotive industry presents a significant opportunity for market expansion. As advancements in holographic, autostereoscopic, and augmented reality (AR) displays continue, demand for immersive and interactive 3D experiences is rising across smartphones, televisions, gaming devices, and automobiles.
In the consumer electronics sector, 3D displays are becoming more prevalent in smartphones, tablets, laptops, and televisions, enhancing user experiences in entertainment, gaming, and virtual communication. The development of glasses-free 3D technology has made 3D content more accessible, eliminating the need for external accessories. Gaming consoles and monitors featuring high-resolution 3D graphics offer a more immersive experience, appealing to professional and casual gamers alike. Streaming platforms and home entertainment systems are also incorporating 3D content, driving demand for next-generation smart TVs with enhanced 3D capabilities. The growing adoption of AR-powered mobile applications in photography, social media, and virtual shopping further contributes to the rising demand for 3D display-enabled smartphones and tablets.
In the automotive industry, 3D displays are transforming dashboard interfaces, infotainment systems, and heads-up displays (HUDs). Automakers are integrating holographic navigation systems and digital dashboards that provide drivers with real-time data visualization, enhancing safety and user convenience. 3D HUDs project critical information such as speed, navigation, and traffic alerts directly onto the windshield, reducing distractions and improving driver awareness. In addition, depth-enhanced 3D displays assist with blind-spot detection, parking assistance, and object recognition, making driving safer and more intuitive.
Luxury car manufacturers have already begun implementing 3D digital instrument clusters and interactive infotainment systems, setting new standards for in-vehicle experiences. As autonomous vehicles gain traction, 3D displays will play a crucial role in enhancing human-machine interaction, providing drivers and passengers with engaging visual feedback and entertainment options.
For Instance,
- According to an article published by LUXMAGE, expansion of 3D displays in consumer electronics and automotive sectors revolutionizes visual experiences. Advanced 3D technologies enable immersive content on smartphones, TVs, and car dashboards, enhancing interactivity and safety. Manufacturers integrate cutting-edge 3D solutions to meet consumer demands, boost brand differentiation, and redefine user engagement in an increasingly competitive market.
- In May 2021, according to an article published by SpecialChem, smart and flexible displays are revolutionizing consumer electronics and automotive applications, driven by emerging technologies such as IoT, AR, AI, and advanced materials. These innovations enable interactive, durable, and cost-effective solutions, transforming user experiences with ultra-thin, foldable, and transparent screens that enhance connectivity, safety, and overall device performance, Europely acclaimed.
With continuous advancements in display resolution, refresh rates, and AI-driven image processing, the expansion of 3D displays in consumer electronics and the automotive sector is poised to grow significantly. As manufacturers invest in next-generation 3D visualization solutions, the demand for smart, interactive, and immersive display technology will continue to rise, shaping the future of digital experiences in both industries.
Restraints/Challenges
- Limited Content Availability and Compatibility Issues
Despite advancements in 3D display technology, the market faces a significant challenge due to limited content availability and compatibility issues. The lack of widespread 3D-optimized content, standardized formats, and seamless integration with existing devices restricts the growth and adoption of 3D displays across various sectors, including entertainment, gaming, education, and healthcare.
One of the primary barriers to market growth is the lack of sufficient 3D content. While 3D movies and gaming experiences have gained popularity, the availability of native 3D content for televisions, streaming services, and educational applications remains limited. Content creators face challenges in producing high-resolution, immersive 3D visuals, leading to slower adoption among consumers.
The absence of industry-wide standards for 3D display technology creates compatibility challenges. Different 3D formats, such as side-by-side, top-bottom, and frame-packing, require specific display hardware and decoding mechanisms. This lack of uniformity leads to inconsistencies in content playback across devices, discouraging both content creators and end-users from fully adopting 3D display systems. Unlike traditional 2D content, 3D media requires higher bandwidth and processing power, making seamless streaming difficult. Many streaming platforms and broadcasters lack the infrastructure to support 3D content, limiting accessibility. In addition, the decline in 3D television production by major manufacturers has further reduced the motivation for broadcasters to invest in 3D content distribution.
While gaming and virtual reality (VR) & augmented reality (AR) applications rely on 3D graphics, not all games and applications are optimized for 3D displays. The lack of developer support and cross-platform compatibility makes it difficult for consumers to fully utilize 3D display capabilities, slowing adoption in the gaming and metaverse sectors. Due to content limitations and compatibility hurdles, businesses and consumers hesitate to invest in expensive 3D display solutions. Without a strong ecosystem of available content and seamless device integration, the market struggles to achieve widespread adoption.
For Instance,
- In April 2024, according to an article published by antipur Themes, Despite their potential, 3D holograms face challenges like limited content availability and compatibility issues. Creating high-quality holographic content requires advanced technology and expertise, restricting widespread adoption. In addition, existing display systems and software may not support all holographic formats, leading to integration difficulties across industries, slowing mainstream implementation and accessibility.
- According to an article published by Built with love by LEDSINO, Limited content availability and compatibility issues hinder the effectiveness of hologram 3D LED fans. Despite their captivating 3D visuals, these systems suffer from a scarcity of native, high-quality 3D content and encounter integration challenges with standard media formats. Such constraints impede adoption and restrict their practical use in diverse settings.
The limited availability of native 3D content, lack of standardization, and compatibility issues remain significant restraints for the Europe 3D display market. The scarcity of optimized 3D media, inconsistencies in format support, and challenges in seamless device integration hinder widespread adoption across entertainment, gaming, education, and healthcare sectors. These limitations reduce consumer interest and business investment, slowing the overall growth of the 3D display industry.
- High Power Consumption and Hardware Limitations
One of the significant challenges in the Europe 3D display market is the high power consumption and hardware limitations associated with advanced display technologies. As 3D displays require more processing power, higher refresh rates, and complex rendering techniques, they consume significantly more energy than traditional 2D displays. This increased power demand affects device efficiency, battery life, and overall performance, limiting their widespread adoption in consumer electronics, automotive applications, and industrial sectors.
The energy-intensive nature of 3D displays makes them less practical for portable devices such as smartphones, tablets, and laptops, where battery life is a critical factor. The need for high-performance GPUs, depth sensors, and real-time image processing further adds to the power requirements, making it challenging for manufacturers to create energy-efficient and lightweight 3D-enabled devices. This limitation discourages many consumers from adopting 3D technology, as excessive power consumption leads to overheating issues, shorter battery cycles, and increased electricity costs.
In addition, hardware limitations in terms of processing capability, storage, and display refresh rates hinder the seamless integration of 3D visualization in gaming, virtual reality (VR), and augmented reality (AR) applications. Many existing devices struggle to handle the high data bandwidth and complex computational tasks required for real-time 3D rendering, leading to latency issues, frame rate drops, and reduced visual quality. As a result, users often experience motion sickness, eye strain, or discomfort, further limiting mass adoption. Another challenge is the cost and complexity of upgrading hardware to support high-performance 3D displays. Businesses and consumers must invest in powerful GPUs, high-resolution screens, and enhanced processing units, which increases the overall cost of adoption. This makes 3D display technology less attractive for budget-conscious consumers and businesses with limited infrastructure to support advanced display systems.
For Instance,
- In January 2025, according to an article published by Shenzhen Linsn LED Co.,Ltd., The article highlights the high power consumption challenges of LED displays. It details how maximum, black level, and standby consumption are heavily influenced by factors such as screen size, brightness, resolution, and content. Calculation methods show that inefficient settings and outdated panels can drastically escalate operational costs and energy waste.
- In June 2021, according to an article published by Elsevier, Additive manufacturing faces high power consumption challenges, particularly with low-cost desktop 3D printers. Measured energy usage ranged from 24.8–85.7 kJ/cm³ for fused filament fabrication and 10.8–21.5 kJ/cm³ for vat polymerisation. Semi-empirical equations now accurately predict energy use based on simple 3D printing metrics. Findings underscore urgent optimization for enhanced efficiency.
- According to an article published by Refresh LED., This article explains how LED display power consumption affects operational costs. It defines maximum, black level, and standby power use, and discusses factors like screen size, brightness, and resolution. Two calculation methods illustrate how inefficient settings and high brightness can drive up consumption, significantly impacting ROI and overall energy expenses.
The challenge of high power consumption and hardware inefficiencies remains a major hurdle in the widespread adoption of 3D display technology. Until energy-efficient solutions and optimized hardware become more accessible, the expansion of 3D displays in consumer electronics, automotive applications, and industrial sectors may face slow adoption and limited scalability.
Impact and Current Market Scenario of Raw Material Shortage and Shipping Delays
Data Bridge Market Research offers a high-level analysis of the market and delivers information by keeping in account the impact and current market environment of raw material shortage and shipping delays. This translates into assessing strategic possibilities, creating effective action plans, and assisting businesses in making important decisions.
Apart from the standard report, we also offer in-depth analysis of the procurement level from forecasted shipping delays, distributor mapping by region, commodity analysis, production analysis, price mapping trends, sourcing, category performance analysis, supply chain risk management solutions, advanced benchmarking, and other services for procurement and strategic support.
Expected Impact of Economic Slowdown on the Pricing and Availability of Products
When economic activity slows, industries begin to suffer. The forecasted effects of the economic downturn on the pricing and accessibility of the products are taken into account in the market insight reports and intelligence services provided by DBMR. With this, our clients can typically keep one step ahead of their competitors, project their sales and revenue, and estimate their profit and loss expenditures.
Europe 3D Display Market Scope
The Europe 3D display market is segmented into seven segments based on technology, type, access methodology, organization size, application, industry, and sales channel. The growth amongst these segments will help you analyze meagre growth segments in the industries and provide the users with a valuable market overview and market insights to help them make strategic decisions for identifying core market applications.
Technology
- OLED
- LED
- PDP
- DLP RPTV
Type
- Stereoscopic
- HMD
- Volumetric Display
Access Methodology
- Screen Based Display
- Micro Display
Organization Size
- Large Scale Organizations
- Medium Scale Organizations
- Small Scale Organizations
Application
- Televisions
- Televisions, By Technology
- OLED
- LED
- PDP
- DLP RPTV
- Televisions, By Technology
- Smartphones
- Smartphones, By Technology
- OLED
- LED
- PDP
- DLP RPTV
- Smartphones, By Technology
- Monitors
- Monitors, By Technology
- OLED
- LED
- PDP
- DLP RPTV
- Monitors, By Technology
- Mobile Computing Displays
- Mobile Computing Displays, By Technology
- OLED
- LED
- PDP
- DLP RPTV
- Mobile Computing Displays, By Technology
- Projectors
- Projectors, By Technology
- OLED
- LED
- PDP
- DLP RPTV
- Projectors, By Technology
- HMD
- HMD, By Technology
- OLED
- LED
- PDP
- DLP RPTV
- HMD, By Technology
- Others
- Others, By Technology
- OLED
- LED
- PDP
- DLP RPTV
- Others, By Technology
Industry
- Entertainment and Media
- Entertainment and Media, By Type
- Stereoscopic
- HMD
- Volumetric Display
- Entertainment and Media, By Type
- Advertising and Retail
- Advertising and Retail, By Type
- Stereoscopic
- HMD
- Volumetric Display
- Advertising and Retail, By Type
- Consumer Electronics
- Consumer Electronics, By Type
- Stereoscopic
- HMD
- Volumetric Display
- Consumer Electronics, By Type
- Healthcare and Medical
- Healthcare and Medical, By Type
- Stereoscopic
- HMD
- Volumetric Display
- Healthcare and Medical, By Type
- Automotive
- Automotive, By Type
- Stereoscopic
- HMD
- Volumetric Display
- Automotive, By Type
- Industrial and Scientific
- Industrial and Scientific, By Type
- Stereoscopic
- HMD
- Volumetric Display
- Industrial and Scientific, By Type
- Aerospace and Defense
- Aerospace and Defense, By Type
- Stereoscopic
- HMD
- Volumetric Display
- Aerospace and Defense, By Type
- Others
- Others, By Type
- Stereoscopic
- HMD
- Volumetric Display
- Others, By Type
Sales Channel
- OEM
- Aftermarket
Europe 3D Display Market Regional Analysis
The market is analyzed and market size insights and trends are based on country, technology, type, access methodology, organization size, application, industry, and sales channel as referenced above.
The countries covered in the market are Germany, France, Italy, Spain, U.K., Russia, Switzerland, Turkey, Belgium, Netherlands, Norway, Sweden, Poland, Luxemburg, and rest of Europe.
Germany is expected to dominate the European 3D display market due to its strong automotive, healthcare, and consumer electronics industries, advanced R&D, government support, and leading manufacturers driving innovation in display technologies.
Germany is expected to be fastest growing region in Europe's 3D display market due to rising adoption in automotive, healthcare, and entertainment sectors, strong R&D investments, technological advancements, and increasing demand for AR/VR applications.
The country section of the report also provides individual market impacting factors and changes in regulation in the market domestically that impacts the current and future trends of the market. Data points like down-stream and upstream value chain analysis, technical trends and porter's five forces analysis, case studies are some of the pointers used to forecast the market scenario for individual countries. Also, the presence and availability of Europe brands and their challenges faced due to large or scarce competition from local and domestic brands, impact of domestic tariffs and trade routes are considered while providing forecast analysis of the country data.
Europe 3D Display Market Share
The market competitive landscape provides details by competitors. Details included are company overview, company financials, revenue generated, market potential, investment in research and development, new market initiatives, Europe presence, production sites and facilities, production capacities, company strengths and weaknesses, product launch, product width and breadth, application dominance. The above data points provided are only related to the companies' focus related to market.
Europe 3D Display Market Leaders Operating in the Market Are:
- Samsung Electronics Co., Ltd. (South Korea)
- LG Electronics Inc (South Korea)
- Leia Inc. (U.S.)
- Light Field Lab, Inc (U.S)
- AU Optronics Corporation (Taiwan)
- Himax Technologies, Inc (Taiwan)
- Sharp Corporation (Japan)
- Koninklijke Philips N.V (Netherlands)
- Holochip Corporation (U.S.)
- Holoxica Ltd (U.K)
- Avalon Holographics Inc (Canada)
- HYPERVSN (U.K.)
- Sony Electronics Inc (U.S.)
- Barco NV (Belgium)
- Vanguard LED Displays (U.S.)
- NanoLumens, Inc (U.S.)
- Magnetic 3D (U.S.)
- HOLOCO GmbH (Germany)
- Shenzhen MUXWAVE Technology Co., Ltd (China)
- Planar3D (Finland)
- Fujifilm Holdings Corporation (Japan)
Latest Developments in Europe 3D Display Market
- In August 2024, Samsung unveiled its glasses-free Odyssey 3D monitor at Gamescom, redefining immersive gaming. This innovative display offers an unparalleled 3D experience through Eye Tracking and View Mapping technology, delivering stunning graphics without glasses. It enhances gaming immersion by making virtual environments feel more lifelike. With this advancement, Samsung is pushing the boundaries of gaming technology and elevating player experiences to new heights. The monitor was showcased alongside a partnership with KRAFTON for exclusive game previews, further reinforcing its potential to revolutionize 3D gaming
- In February 2025, LG Electronics opened its first virtual production studio to enhance content creation. This cutting-edge facility integrates real-time 3D rendering, LED wall technology, and advanced tools for film and media production. By utilizing this studio, creators can produce high-quality content faster and more efficiently, offering substantial benefits for industries like filmmaking, gaming, and virtual reality. The studio allows for immersive, realistic visuals and streamlines post-production processes, significantly reducing costs and time
- In October 2024, SHARP CORPORATION announced the launch of its flagship smartphone, the AQUOS R9 pro, featuring a 50.3 MP Vario-Summicron camera system developed with Leica. This model boasts a powerful Snapdragon 8s Gen 3 CPU, 12 GB RAM, and an advanced heat dissipation system. It supports 240 Hz Pro IGZO OLED displays and has a generative AI Phone Assistant. Scheduled for release in Japan in December 2024, it offers enhanced performance for users, particularly in photography, gaming, and multitasking. The device’s AI and camera features aim to improve user experience and content creation
- In October 2024, Avalon Holographics received USD 1.02 million in provincial funding from the Government of Newfoundland and Labrador to enhance the portability of its NOVAC holographic display table. This funding will help redesign the table for easier transport and shipping, enabling Europe deployment. The improvements will also streamline assembly, optimize shipping, and improve the user experience, positioning Avalon as a Europe leader in holographic display technology. The project aims for completion by May 2025 and is expected to boost Avalon’s competitiveness, while contributing to Newfoundland and Labrador's economic growth through technological innovation
- In May 2024, Leia Inc. launched the Immersity AI platform, a new tool designed to convert 2D images and videos into immersive 3D content. Powered by advanced Neural Depth Mapping technology, it enables quick and high-quality 3D conversions. The platform benefits creators by offering an easy, user-friendly interface and supports various XR devices. This tool empowers users to transform digital content into captivating 3D visuals, enhancing engagement across multiple industries such as travel, digital art, and branding
SKU-

- Interactive Data Analysis Dashboard
- Company Analysis Dashboard for high growth potential opportunities
- Research Analyst Access for customization & queries
- Competitor Analysis with Interactive dashboard
- Latest News, Updates & Trend analysis
- Harness the Power of Benchmark Analysis for Comprehensive Competitor Tracking
Table of Content
1 INTRODUCTION
1.1 OBJECTIVES OF THE STUDY
1.2 MARKET DEFINITION
1.3 OVERVIEW
1.4 LIMITATIONS
1.5 MARKETS COVERED
2 MARKET SEGMENTATION
2.1 MARKETS COVERED
2.2 GEOGRAPHICAL SCOPE
2.3 YEARS CONSIDERED FOR THE STUDY
2.4 CURRENCY AND PRICING
2.5 DBMR TRIPOD DATA VALIDATION MODEL
2.6 MULTIVARIATE MODELING
2.7 PRIMARY INTERVIEWS WITH KEY OPINION LEADERS
2.8 DBMR MARKET POSITION GRID
2.9 DBMR VENDOR SHARE ANALYSIS
2.1 MARKET APPLICATION COVERAGE GRID
2.11 SECONDARY SOURCES
2.12 ASSUMPTIONS
3 EXECUTIVE SUMMARY
4 PREMIUM INSIGHTS
4.1 PORTER’S FIVE FORCES
4.1.1 THREAT OF NEW ENTRANTS
4.1.2 THREAT OF SUBSTITUTES
4.1.3 BARGAINING POWER OF BUYERS
4.1.4 BARGAINING POWER OF SUPPLIERS
4.1.5 COMPETITIVE RIVALRY
4.2 A COMPARATIVE ANALYSIS OF NAKED EYE AND NON-NAKED EYE 3D DISPLAY TECHNOLOGIES
4.2.1 USER EXPERIENCE
4.2.2 TECHNOLOGICAL APPROCHES
4.2.2.1 STEREOSCOPIC 3D
4.2.2.2 ACTIVE SHUTTER GLASSES
4.2.2.3 POLARIZED GLASSES
4.2.3 APPLICATIONS
4.2.4 CHALLENGES
4.2.5 CONCLUSION
4.3 COMPANY COMPARATIVE ANALYSIS
4.4 COMPANY SERVICE PLATFORM MATRIX
4.5 EUROPEAN INDUSTRY ANALYSIS & FUTURISTIC SCENARIO
4.5.1 REGIONAL ADOPTION AND TRENDS
4.5.2 TECHNOLOGICAL INNOVATIONS IN EUROPE
4.5.3 CONSUMER TRENDS AND BEHAVIORAL INSIGHTS
4.5.4 REGULATORY ENVIRONMENT & STANDARDIZATION
4.5.5 FUTURE TRENDS AND PROJECTIONS
4.6 EVOLUTION OF 3D DISPLAY IN MARKET
4.7 IN-HOUSE VS. OUTSOURCED (THIRD-PARTY) IMPLEMENTATION
4.7.1 IN-HOUSE IMPLEMENTATION
4.7.1.1 CUSTOMER BASE
4.7.1.2 SERVICE POSITIONING
4.7.1.3 CUSTOMER FEEDBACK/RATING
4.7.1.4 APPLICATION REACH
4.7.1.5 SERVICE PLATFORM MATRIX
4.8 OUTSOURCED (THIRD-PARTY) IMPLEMENTATION
4.8.1.1 CUSTOMER BASE
4.8.1.2 SERVICE POSITIONING
4.8.1.3 CUSTOMER FEEDBACK/RATING
4.8.1.4 APPLICATION REACH
4.8.1.5 SERVICE PLATFORM MATRIX
4.8.2 STRATEGIC CONSIDERATIONS
4.9 NEW BUSINESS AND EMERGING BUSINESS'S REVENUE OPPORTUNITIES
4.1 PATENT ANALYSIS
4.10.1 CATEGORIES OF 3D DISPLAY PATENTS
4.10.1.1 STEREOSCOPIC AND AUTOSTEREOSCOPIC DISPLAYS
4.10.1.2 HOLOGRAPHIC AND LIGHT-FIELD 3D DISPLAYS
4.10.1.3 AR/VR-BASED 3D DISPLAY INNOVATIONS
4.10.1.4 GESTURE-CONTROLLED AND AI-DRIVEN 3D DISPLAYS
4.10.2 TRENDS IN PATENT FILINGS AND MARKET IMPLICATIONS
4.10.3 LEGAL CHALLENGES AND PATENT DISPUTES
4.10.4 CONCLUSION
4.11 PENETRATION AND GROWTH PROSPECT MAPPING
4.11.1 MARKET PENETRATION ANALYSIS
4.11.1.1 REGIONAL PENETRATION AND MARKET SHARE
4.11.1.1.1 NORTH AMERICA (HIGH PENETRATION, MODERATE GROWTH)
4.11.1.1.2 ASIA-PACIFIC (MODERATE PENETRATION, HIGH GROWTH)
4.11.1.1.3 EUROPE (MODERATE PENETRATION, MODERATE GROWTH)
4.11.1.1.4 SOUTH AMERICA & THE MIDDLE EAST AND AFRICA (LOW PENETRATION, HIGH GROWTH POTENTIAL)
4.11.1.2 INDUSTRY-SPECIFIC PENETRATION
4.11.1.2.1 GAMING & ENTERTAINMENT (HIGH PENETRATION, HIGH GROWTH)
4.11.1.2.2 HEALTHCARE & MEDICAL IMAGING (MODERATE PENETRATION, HIGH GROWTH)
4.11.1.2.3 AUTOMOTIVE (MODERATE PENETRATION, HIGH GROWTH)
4.11.1.2.4 RETAIL & ADVERTISING (LOW PENETRATION, HIGH GROWTH)
4.11.1.2.5 EDUCATION & TRAINING (LOW PENETRATION, HIGH GROWTH)
4.11.2 GROWTH PROSPECT MAPPING
4.11.2.1 KEY GROWTH DRIVERS
4.11.2.2 CHALLENGES AND MARKET BARRIERS
4.11.2.3 FUTURE GROWTH OPPORTUNITIES
4.11.3 CONCLUSION
4.12 TECHNOLOGY MATRIX
4.13 TECHNOLOGY TREND ANALYSIS (2020-2024)
4.13.1 INTRODUCTION
4.13.1.1 ROLE OF TECHNOLOGY IN SHAPING THE INDUSTRY AND CONSUMER EXPERIENCE
4.13.2 KEY TECHNOLOGICAL DEVELOPMENTS (2020-2024)
4.13.2.1 BREAKTHROUGHS IN 3D DISPLAY TECHNOLOGY
4.13.2.2 INTEGRATION OF 3D INTO NEW DEVICES (AR/VR, AUTOMOTIVE, WEARABLES)
4.13.2.3 ENHANCED VIEWING EXPERIENCE
4.13.3 AUTOSTEREOSCOPIC 3D DISPLAYS
4.13.3.1 EVOLUTION OF GLASSES-FREE 3D
4.13.3.2 NEW TECHNIQUES FOR IMPROVED VIEWING ANGLES AND DEPTH PERCEPTION
4.13.3.3 CONSUMER ADOPTION & MARKET TRENDS
4.13.4 MINI-LED & OLED TECHNOLOGIES
4.13.4.1 IMPACT OF MINI-LED AND OLED FOR ENHANCED 3D QUALITY
4.13.4.2 BENEFITS IN CONTRAST, BRIGHTNESS, AND COLOR REPRODUCTION
4.13.5 AI & MACHINE LEARNING IN 3D DISPLAYS
4.13.5.1 AI/ML APPLICATIONS IN RENDERING & OPTIMIZATION
4.13.5.2 PERSONALIZED VIEWING EXPERIENCES
4.13.5.3 SOLUTIONS FOR MOTION SICKNESS AND COMFORT
4.13.6 FUTURE TRENDS AND PREDICTIONS (2023-2025)
4.13.6.1 EMERGING TECHNOLOGIES FOR 3D DISPLAYS
4.13.6.2 MARKET GROWTH PREDICTIONS
4.13.6.3 3D DISPLAYS IN CONSUMER ELECTRONICS, GAMING, & MORE
4.13.7 CHALLENGES
4.13.8 CONCLUSION
4.14 USED CASE ANALYSIS
5 REGULATORY STANDARDS
5.1 KEY REGULATORY BODIES AND STANDARDS
5.1.1 INTERNATIONAL STANDARDS ORGANIZATIONS
5.1.2 REGIONAL REGULATORY BODIES
5.2 SAFETY AND HEALTH REGULATIONS FOR 3D DISPLAYS
5.2.1 EYE SAFETY AND VIEWING COMFORT
5.2.2 HEALTH CONCERNS RELATED TO 3D VIEWING
5.2.3 ELECTROMAGNETIC RADIATION AND EMISSIONS
5.3 ENVIRONMENTAL AND SUSTAINABILITY STANDARDS
5.3.1 ENERGY EFFICIENCY AND ECO-FRIENDLY DESIGN
5.3.2 RESTRICTIONS ON HAZARDOUS MATERIALS
5.4 INTELLECTUAL PROPERTY (IP) AND LICENSING STANDARDS
5.4.1 PATENT AND LICENSING REQUIREMENTS
5.4.2 COPYRIGHT AND CONTENT REGULATIONS
5.5 INDUSTRY-SPECIFIC REGULATIONS AND CERTIFICATIONS
5.5.1 AUTOMOTIVE INDUSTRY
5.5.2 HEALTHCARE AND MEDICAL IMAGING
5.5.3 AVIATION AND MILITARY
5.6 CONCLUSION
6 MARKET OVERVIEW
6.1 DRIVERS
6.1.1 GROWING DEMAND FOR 3D CONTENT AND ENTERTAINMENT
6.1.2 ADVANCEMENTS AND INNOVATIONS IN DISPLAY TECHNOLOGIES
6.1.3 RISING ADOPTION OF 3D DISPLAYS IN HEALTHCARE & MEDICAL IMAGING
6.1.4 GROWING POPULARITY OF METAVERSE AND AR/VR(AUGMENTED REALITY (AR) & VIRTUAL REALITY (VR)) TECHNOLOGIES
6.2 RESTRAINTS
6.2.1 SHIGH COST OF 3D DISPLAY TECHNOLOGIES
6.2.2 LIMITED CONTENT AVAILABILITY AND COMPATIBILITY ISSUES
6.3 OPPORTUNITIES
6.3.1 RISING ADOPTION OF 3D DISPLAYS IN EDUCATION AND TRAINING
6.3.2 INTEGRATION OF AI & IOT IN 3D DISPLAYS
6.3.3 EXPANSION OF 3D DISPLAYS IN CONSUMER ELECTRONICS AND AUTOMOTIVE INDUSTRY
6.4 CHALLENGES
6.4.1 HIGH POWER CONSUMPTION AND HARDWARE LIMITATIONS
6.4.2 SLOW ADOPTION IN TRADITIONAL MARKET SUCH AS IN ADVERTISING AND RETAIL
7 EUROPE 3D DISPLAY MARKET, BY TECHNOLOGY
7.1 OVERVIEW
7.2 OLED
7.3 LED
7.4 PDP
7.5 DLP RPTV
8 EUROPE 3D DISPLAY MARKET, BY TYPE
8.1 OVERVIEW
8.2 STEREOSCOPIC
8.3 HMD
8.4 VOLUMETRIC DISPLAY
9 EUROPE 3D DISPLAY MARKET, BY ACCESS METHODOLOGY
9.1 OVERVIEW
9.2 SCREEN BASED DISPLAY
9.3 MICRO DISPLAY
10 EUROPE 3D DISPLAY MARKET, BY ORGANIZATION SIZE
10.1 OVERVIEW
10.2 LARGE SCALE ORGANIZATIONS
10.3 MEDIUM SCALE ORGANIZATIONS
10.4 SMALL SCALE ORGANIZATIONS
11 EUROPE 3D DISPLAY MARKET, BY APPLICATION
11.1 OVERVIEW
11.2 TELEVISIONS
11.2.1 TELEVISIONS, BY TECHNOLOGY
11.3 SMARTPHONES
11.3.1 SMARTPHONES, BY TECHNOLOGY
11.4 MONITORS
11.4.1 MONITORS, BY TECHNOLOGY
11.5 MOBILE COMPUTING DISPLAYS
11.5.1 MOBILE COMPUTING DISPLAYS, BY TECHNOLOGY
11.6 PROJECTORS
11.6.1 PROJECTORS, BY TECHNOLOGY
11.7 HMD
11.7.1 HMD, BY TECHNOLOGY
11.8 OTHERS
11.8.1 OTHERS, BY TECHNOLOGY
12 EUROPE 3D DISPLAY MARKET, BY INDUSTRY
12.1 OVERVIEW
12.2 ENTERTAINMENT AND MEDIA
12.2.1 ENTERTAINMENT AND MEDIA, BY TYPE
12.3 ADVERTISING AND RETAIL
12.3.1 ADVERTISING AND RETAIL, BY TYPE
12.4 CONSUMER ELECTRONICS
12.4.1 CONSUMER ELECTRONICS, BY TYPE
12.5 HEALTHCARE AND MEDICAL
12.5.1 HEALTHCARE AND MEDICAL, BY TYPE
12.6 AUTOMOTIVE
12.6.1 AUTOMOTIVE, BY TYPE
12.7 INDUSTRIAL AND SCIENTIFIC
12.7.1 INDUSTRIAL AND SCIENTIFIC, BY TYPE
12.8 AEROSPACE AND DEFENSE
12.8.1 AEROSPACE AND DEFENSE, BY TYPE
12.9 OTHERS
12.9.1 OTHERS, BY TYPE
13 EUROPE 3D DISPLAY MARKET, BY SALES CHANNEL
13.1 OVERVIEW
13.2 OEM
13.3 AFTERMARKET
14 EUROPE 3D DISPLAY MARKET, BY REGION
14.1 EUROPE
14.1.1 GERMANY
14.1.2 FRANCE
14.1.3 ITALY
14.1.4 SPAIN
14.1.5 U.K.
14.1.6 RUSSIA
14.1.7 SWITZERLAND
14.1.8 TURKEY
14.1.9 BELGIUM
14.1.10 NETHERLANDS
14.1.11 NORWAY
14.1.12 SWEDEN
14.1.13 POLAND
14.1.14 LUXEMBURG
14.1.15 REST OF EUROPE
15 3D DISPLAY MARKET: COMPANY LANDSCAPE
15.1 COMPANY SHARE ANALYSIS: GLOBAL
16 SWOT ANALYSIS
17 COMPANY PROFILES
17.1 SAMSUNG
17.1.1 COMPANY SNAPSHOT
17.1.2 REVENUE ANALYSIS
17.1.3 COMPANY SHARE ANALYSIS
17.1.4 PRODUCT PORTFOLIO
17.1.5 RECENT DEVELOPMENT
17.2 SONY ELECTRONICS INC.
17.2.1 COMPANY SNAPSHOT
17.2.2 REVENUE ANALYSIS
17.2.3 COMPANY SHARE ANALYSIS
17.2.4 PRODUCT PORTFOLIO
17.2.5 RECENT UPDATES
17.3 LG ELECTRONICS
17.3.1 COMPANY SNAPSHOT
17.3.2 REVENUE ANALYSIS
17.3.3 COMPANY SHARE ANALYSIS
17.3.4 PRODUCT PORTFOLIO
17.3.5 RECENT DEVELOPMENTS
17.4 SHARP CORPORATION
17.4.1 COMPANY SNAPSHOT
17.4.2 REVENUE ANALYSIS
17.4.3 COMPANY SHARE ANALYSIS
17.4.4 PRODUCT PORTFOLIO
17.4.5 RECENT DEVELOPMENTS
17.5 AUO CORPORATION
17.5.1 COMPANY SNAPSHOT
17.5.2 REVENUE ANALYSIS
17.5.3 COMPANY SHARE ANALYSIS
17.5.4 PRODUCT PORTFOLIO
17.5.5 RECENT NEWS
17.6 AVALON HOLOGRAPHICS INC.
17.6.1 COMPANY SNAPSHOT
17.6.2 PRODUCT PORTFOLIO
17.6.3 RECENT DEVELOPMENT
17.7 BARCO
17.7.1 COMPANY SNAPSHOT
17.7.2 REVENUE ANALYSIS
17.7.3 PRODUCT PORTFOLIO
17.7.4 RECENT DEVELOPMENT
17.8 FUJIFILM CORPORATION
17.8.1 COMPANY SNAPSHOT
17.8.2 REVENUE ANALYSIS
17.8.3 PRODUCT PORTFOLIO
17.8.4 RECENT DEVELOPMENT
17.9 HIMAX TECHNOLOGIES, INC
17.9.1 COMPANY SNAPSHOT
17.9.2 REVENUE ANALYSIS
17.9.3 PRODUCT PORTFOLIO
17.9.4 RECENT DEVELOPMENT
17.1 HOLOCHIP CORPORATION
17.10.1 COMPANY SNAPSHOT
17.10.2 PRODUCT PORTFOLIO
17.10.3 RECENT NEWS
17.10.4 RECENT DEVELOPMENTS
17.11 HOLOCO GMBH
17.11.1 COMPANY SNAPSHOT
17.11.2 PRODUCT PORTFOLIO
17.11.3 RECENT DEVELOPMENT
17.12 HOLOXICA LTD
17.12.1 COMPANY SNAPSHOT
17.12.2 PRODUCT PORTFOLIO
17.12.3 RECENT DEVELOPMENT
17.13 HYPERVSN
17.13.1 COMPANY SNAPSHOT
17.13.2 PRODUCT PORTFOLIO
17.13.3 RECENT DEVELOPMENT
17.14 KONINKLIJKE PHILIPS N.V.
17.14.1 COMPANY SNAPSHOT
17.14.2 REVENUE ANALYSIS
17.14.3 PRODUCT PORTFOLIO
17.14.4 RECENT DEVELOPMENT
17.15 LEIA INC.
17.15.1 COMPANY SNAPSHOT
17.15.2 PRODUCT PORTFOLIO
17.15.3 RECENT DEVELOPMENTS
17.16 LIGHT FIELD LAB, INC.
17.16.1 COMPANY SNAPSHOT
17.16.2 PRODUCT PORTFOLIO
17.16.3 RECENT DEVELOPMENT
17.17 MAGNETIC MEDIA HOLDINGS, INC.
17.17.1 COMPANY SNAPSHOT
17.17.2 PRODUCT PORTFOLIO
17.17.3 RECENT DEVELOPMENT
17.18 NANOLUMENS, INC
17.18.1 COMPANY SNAPSHOT
17.18.2 PRODUCT PORTFOLIO
17.18.3 RECENT DEVELOPMENT
17.19 PLANAR3D
17.19.1 COMPANY SNAPSHOT
17.19.2 PRODUCT PORTFOLIO
17.19.3 RECENT DEVELOPMENT
17.2 SHENZHEN MUXWAVE TECHNOLOGY CO., LTD.
17.20.1 COMPANY SNAPSHOT
17.20.2 PRODUCT PORTFOLIO
17.20.3 RECENT DEVELOPMENT
17.21 VANGUARD LED DISPLAYS.
17.21.1 COMPANY SNAPSHOT
17.21.2 PRODUCT PORTFOLIO
17.21.3 RECENT DEVELOPMENT
18 QUESTIONNAIRE
19 RELATED REPORTS
List of Table
TABLE 1 COMPANY COMPARATIVE ANALYSIS
TABLE 2 COMPANY SERVICE PLATFORM MATRIX
TABLE 3 EVOLUTION OF 3D DISPLAY IN MARKET
TABLE 4 TECHNOLOGY MATRIX
TABLE 5 EUROPE 3D DISPLAY MARKET: USED CASE ANALYSIS
TABLE 6 EUROPE 3D DISPLAY MARKET, BY TECHNOLOGY, 2018-2032 (USD THOUSAND)
TABLE 7 EUROPE OLED IN 3D DISPLAY MARKET, BY REGION, 2018-2032 (USD THOUSAND)
TABLE 8 EUROPE LED IN 3D DISPLAY MARKET, BY REGION, 2018-2032 (USD THOUSAND)
TABLE 9 EUROPE PDP IN 3D DISPLAY MARKET, BY REGION, 2018-2032 (USD THOUSAND)
TABLE 10 EUROPE DLP RPTV IN 3D DISPLAY MARKET, BY REGION, 2018-2032 (USD THOUSAND)
TABLE 11 EUROPE 3D DISPLAY MARKET, BY TYPE, 2018-2032 (USD THOUSAND)
TABLE 12 EUROPE STEREOSCOPIC IN 3D DISPLAY MARKET, BY REGION, 2018-2032 (USD THOUSAND)
TABLE 13 EUROPE HMD IN 3D DISPLAY MARKET, BY REGION, 2018-2032 (USD THOUSAND)
TABLE 14 EUROPE VOLUMETRIC DISPLAY IN 3D DISPLAY MARKET, BY REGION, 2018-2032 (USD THOUSAND)
TABLE 15 EUROPE 3D DISPLAY MARKET, BY ACCESS METHODOLOGY, 2018-2032 (USD THOUSAND)
TABLE 16 EUROPE SCREEN BASED DISPLAY IN 3D DISPLAY MARKET, BY REGION, 2018-2032 (USD THOUSAND)
TABLE 17 EUROPE MICRO DISPLAY IN 3D DISPLAY MARKET, BY REGION, 2018-2032 (USD THOUSAND)
TABLE 18 EUROPE 3D DISPLAY MARKET, BY ORGANIZATION SIZE, 2018-2032 (USD THOUSAND)
TABLE 19 EUROPE LARGE SCALE ORGANIZATIONS IN 3D DISPLAY MARKET, BY REGION, 2018-2032 (USD THOUSAND)
TABLE 20 EUROPE MEDIUM SCALE ORGANIZATIONS IN 3D DISPLAY MARKET, BY REGION, 2018-2032 (USD THOUSAND)
TABLE 21 EUROPE SMALL SCALE ORGANIZATIONS IN 3D DISPLAY MARKET, BY REGION, 2018-2032 (USD THOUSAND)
TABLE 22 EUROPE 3D DISPLAY MARKET, BY APPLICATION, 2018-2032 (USD THOUSAND)
TABLE 23 EUROPE TELEVISIONS IN 3D DISPLAY MARKET, BY REGION, 2018-2032 (USD THOUSAND))
TABLE 24 EUROPE TELEVISIONS IN 3D DISPLAY MARKET, BY TECHNOLOGY, 2018-2032 (USD THOUSAND)
TABLE 25 EUROPE SMARTPHONES IN 3D DISPLAY MARKET, BY REGION, 2018-2032 (USD THOUSAND)
TABLE 26 EUROPE SMARTPHONES IN 3D DISPLAY MARKET, BY TECHNOLOGY, 2018-2032 (USD THOUSAND)
TABLE 27 EUROPE MONITORS IN 3D DISPLAY MARKET, BY REGION, 2018-2032 (USD THOUSAND)
TABLE 28 EUROPE MONITORS IN 3D DISPLAY MARKET, BY TECHNOLOGY, 2018-2032 (USD THOUSAND)
TABLE 29 EUROPE MOBILE COMPUTING DISPLAY IN 3D DISPLAY MARKET, BY REGION, 2018-2032 (USD THOUSAND)
TABLE 30 EUROPE MOBILE COMPUTING DISPLAYS IN 3D DISPLAY MARKET, BY TECHNOLOGY, 2018-2032 (USD THOUSAND)
TABLE 31 EUROPE PROJECTORS IN 3D DISPLAY MARKET, BY REGION, 2018-2032 (USD THOUSAND)
TABLE 32 EUROPE PROJECTORS IN 3D DISPLAY MARKET, BY TECHNOLOGY, 2018-2032 (USD THOUSAND)
TABLE 33 EUROPE HMD IN 3D DISPLAY MARKET, BY REGION, 2018-2032 (USD THOUSAND)
TABLE 34 EUROPE HMD IN 3D DISPLAY MARKET, BY TECHNOLOGY, 2018-2032 (USD THOUSAND)
TABLE 35 EUROPE OTHERS IN 3D DISPLAY MARKET, BY REGION, 2018-2032 (USD THOUSAND)
TABLE 36 EUROPE OTHERS IN 3D DISPLAY MARKET, BY TECHNOLOGY, 2018-2032 (USD THOUSAND)
TABLE 37 EUROPE 3D DISPLAY MARKET, BY INDUSTRY, 2018-2032 (USD THOUSAND)
TABLE 38 EUROPE ENTERTAINMENT AND MEDIA IN 3D DISPLAY MARKET, BY REGION, 2018-2032 (USD THOUSAND)
TABLE 39 EUROPE ENTERTAINMENT AND MEDIA IN 3D DISPLAY MARKET, BY TYPE, 2018-2032 (USD THOUSAND)
TABLE 40 EUROPE ADVERTISING AND RETAIL IN 3D DISPLAY MARKET, BY REGION, 2018-2032 (USD THOUSAND)
TABLE 41 EUROPE ADVERTISING AND RETAIL IN 3D DISPLAY MARKET, BY TYPE, 2018-2032 (USD THOUSAND)
TABLE 42 EUROPE CONSUMER ELECTRONICS IN 3D DISPLAY MARKET, BY REGION, 2018-2032 (USD THOUSAND)
TABLE 43 EUROPE CONSUMER ELECTRONICS IN 3D DISPLAY MARKET, BY TYPE, 2018-2032 (USD THOUSAND)
TABLE 44 EUROPE HEALTHCARE AND MEDICAL IN 3D DISPLAY MARKET, BY REGION, 2018-2032 (USD THOUSAND)
TABLE 45 EUROPE HEALTHCARE AND MEDICAL IN 3D DISPLAY MARKET, BY TYPE, 2018-2032 (USD THOUSAND)
TABLE 46 EUROPE AUTOMOTIVE IN 3D DISPLAY MARKET, BY REGION, 2018-2032 (USD THOUSAND)
TABLE 47 EUROPE AUTOMOTIVE IN 3D DISPLAY MARKET, BY TYPE, 2018-2032 (USD THOUSAND)
TABLE 48 EUROPE INDUSTRIAL AND SCIENTIFIC IN 3D DISPLAY MARKET, BY REGION, 2018-2032 (USD THOUSAND)
TABLE 49 EUROPE INDUSTRIAL AND SCIENTIFIC IN 3D DISPLAY MARKET, BY TYPE, 2018-2032 (USD THOUSAND)
TABLE 50 EUROPE AEROSPACE AND DEFENSE IN 3D DISPLAY MARKET, BY REGION, 2018-2032 (USD THOUSAND)
TABLE 51 EUROPE AEROSPACE AND DEFENSE IN 3D DISPLAY MARKET, BY TYPE, 2018-2032 (USD THOUSAND)
TABLE 52 EUROPE OTHERS IN 3D DISPLAY MARKET, BY REGION, 2018-2032 (USD THOUSAND)
TABLE 53 EUROPE OTHERS IN 3D DISPLAY MARKET, BY TYPE, 2018-2032 (USD THOUSAND)
TABLE 54 EUROPE 3D DISPLAY MARKET, BY SALES CHANNEL, 2018-2032 (USD THOUSAND)
TABLE 55 EUROPE OEM IN 3D DISPLAY MARKET, BY REGION, 2018-2032 (USD THOUSAND)
TABLE 56 EUROPE AFTERMARKET IN 3D DISPLAY MARKET, BY REGION, 2018-2032 (USD THOUSAND)
TABLE 57 EUROPE 3D DISPLAY MARKET, BY COUNTRY, 2018-2032 (USD THOUSAND)
TABLE 58 EUROPE 3D DISPLAY MARKET, BY TECHNOLOGY, 2018-2032 (USD THOUSAND)
TABLE 59 EUROPE 3D DISPLAY MARKET, BY TYPE, 2018-2032 (USD THOUSAND)
TABLE 60 EUROPE 3D DISPLAY MARKET, BY ACCESS METHODOLOGY, 2018-2032 (USD THOUSAND)
TABLE 61 EUROPE 3D DISPLAY MARKET, BY ORGANIZATION SIZE, 2018-2032 (USD THOUSAND)
TABLE 62 EUROPE 3D DISPLAY MARKET, BY APPLICATION, 2018-2032 (USD THOUSAND)
TABLE 63 EUROPE TELEVISIONS IN 3D DISPLAY MARKET, BY TECHNOLOGY, 2018-2032 (USD THOUSAND)
TABLE 64 EUROPE SMARTPHONES IN 3D DISPLAY MARKET, BY TECHNOLOGY, 2018-2032 (USD THOUSAND)
TABLE 65 EUROPE MONITORS IN 3D DISPLAY MARKET, BY TECHNOLOGY, 2018-2032 (USD THOUSAND)
TABLE 66 EUROPE MOBILE COMPUTING DISPLAY IN 3D DISPLAY MARKET, BY TECHNOLOGY, 2018-2032 (USD THOUSAND)
TABLE 67 EUROPE PROJECTORS IN 3D DISPLAY MARKET, BY TECHNOLOGY, 2018-2032 (USD THOUSAND)
TABLE 68 EUROPE HMD IN 3D DISPLAY MARKET, BY TECHNOLOGY, 2018-2032 (USD THOUSAND)
TABLE 69 EUROPE OTHERS IN 3D DISPLAY MARKET, BY TECHNOLOGY, 2018-2032 (USD THOUSAND)
TABLE 70 EUROPE 3D DISPLAY MARKET, BY INDUSTRY, 2018-2032 (USD THOUSAND)
TABLE 71 EUROPE ENTERTAINMENT AND MEDIA IN 3D DISPLAY MARKET, BY TYPE, 2018-2032 (USD THOUSAND)
TABLE 72 EUROPE ADVERTISING AND RETAIL IN 3D DISPLAY MARKET, BY TYPE, 2018-2032 (USD THOUSAND)
TABLE 73 EUROPE CONSUMER ELECTRONICS IN 3D DISPLAY MARKET, BY TYPE, 2018-2032 (USD THOUSAND)
TABLE 74 EUROPE HEALTHCARE AND MEDICAL IN 3D DISPLAY MARKET, BY TYPE, 2018-2032 (USD THOUSAND)
TABLE 75 EUROPE AUTOMOTIVE IN 3D DISPLAY MARKET, BY TYPE, 2018-2032 (USD THOUSAND)
TABLE 76 EUROPE INDUSTRIAL AND SCIENTIFIC IN 3D DISPLAY MARKET, BY TYPE, 2018-2032 (USD THOUSAND)
TABLE 77 EUROPE AEROSPACE AND DEFENSE IN 3D DISPLAY MARKET, BY TYPE, 2018-2032 (USD THOUSAND)
TABLE 78 EUROPE OTHERS IN 3D DISPLAY MARKET, BY TYPE, 2018-2032 (USD THOUSAND)
TABLE 79 EUROPE 3D DISPLAY MARKET, BY SALES CHANNEL, 2018-2032 (USD THOUSAND)
TABLE 80 GERMANY 3D DISPLAY MARKET, BY TECHNOLOGY, 2018-2032 (USD THOUSAND)
TABLE 81 GERMANY 3D DISPLAY MARKET, BY TYPE, 2018-2032 (USD THOUSAND)
TABLE 82 GERMANY 3D DISPLAY MARKET, BY ACCESS METHODOLOGY, 2018-2032 (USD THOUSAND)
TABLE 83 GERMANY 3D DISPLAY MARKET, BY ORGANIZATION SIZE, 2018-2032 (USD THOUSAND)
TABLE 84 GERMANY 3D DISPLAY MARKET, BY APPLICATION, 2018-2032 (USD THOUSAND)
TABLE 85 GERMANY TELEVISIONS IN 3D DISPLAY MARKET, BY TECHNOLOGY, 2018-2032 (USD THOUSAND)
TABLE 86 GERMANY SMARTPHONES IN 3D DISPLAY MARKET, BY TECHNOLOGY, 2018-2032 (USD THOUSAND)
TABLE 87 GERMANY MONITORS IN 3D DISPLAY MARKET, BY TECHNOLOGY, 2018-2032 (USD THOUSAND)
TABLE 88 GERMANY MOBILE COMPUTING DISPLAY IN 3D DISPLAY MARKET, BY TECHNOLOGY, 2018-2032 (USD THOUSAND)
TABLE 89 GERMANY PROJECTORS IN 3D DISPLAY MARKET, BY TECHNOLOGY, 2018-2032 (USD THOUSAND)
TABLE 90 GERMANY HMD IN 3D DISPLAY MARKET, BY TECHNOLOGY, 2018-2032 (USD THOUSAND)
TABLE 91 GERMANY OTHERS IN 3D DISPLAY MARKET, BY TECHNOLOGY, 2018-2032 (USD THOUSAND)
TABLE 92 GERMANY 3D DISPLAY MARKET, BY INDUSTRY, 2018-2032 (USD THOUSAND)
TABLE 93 GERMANY ENTERTAINMENT AND MEDIA IN 3D DISPLAY MARKET, BY TYPE, 2018-2032 (USD THOUSAND)
TABLE 94 GERMANY ADVERTISING AND RETAIL IN 3D DISPLAY MARKET, BY TYPE, 2018-2032 (USD THOUSAND)
TABLE 95 GERMANY CONSUMER ELECTRONICS IN 3D DISPLAY MARKET, BY TYPE, 2018-2032 (USD THOUSAND)
TABLE 96 GERMANY HEALTHCARE AND MEDICAL IN 3D DISPLAY MARKET, BY TYPE, 2018-2032 (USD THOUSAND)
TABLE 97 GERMANY AUTOMOTIVE IN 3D DISPLAY MARKET, BY TYPE, 2018-2032 (USD THOUSAND)
TABLE 98 GERMANY INDUSTRIAL AND SCIENTIFIC IN 3D DISPLAY MARKET, BY TYPE, 2018-2032 (USD THOUSAND)
TABLE 99 GERMANY AEROSPACE AND DEFENSE IN 3D DISPLAY MARKET, BY TYPE, 2018-2032 (USD THOUSAND)
TABLE 100 GERMANY OTHERS IN 3D DISPLAY MARKET, BY TYPE, 2018-2032 (USD THOUSAND)
TABLE 101 GERMANY 3D DISPLAY MARKET, BY SALES CHANNEL, 2018-2032 (USD THOUSAND)
TABLE 102 FRANCE 3D DISPLAY MARKET, BY TECHNOLOGY, 2018-2032 (USD THOUSAND)
TABLE 103 FRANCE 3D DISPLAY MARKET, BY TYPE, 2018-2032 (USD THOUSAND)
TABLE 104 FRANCE 3D DISPLAY MARKET, BY ACCESS METHODOLOGY, 2018-2032 (USD THOUSAND)
TABLE 105 FRANCE 3D DISPLAY MARKET, BY ORGANIZATION SIZE, 2018-2032 (USD THOUSAND)
TABLE 106 FRANCE 3D DISPLAY MARKET, BY APPLICATION, 2018-2032 (USD THOUSAND)
TABLE 107 FRANCE TELEVISIONS IN 3D DISPLAY MARKET, BY TECHNOLOGY, 2018-2032 (USD THOUSAND)
TABLE 108 FRANCE SMARTPHONES IN 3D DISPLAY MARKET, BY TECHNOLOGY, 2018-2032 (USD THOUSAND)
TABLE 109 FRANCE MONITORS IN 3D DISPLAY MARKET, BY TECHNOLOGY, 2018-2032 (USD THOUSAND)
TABLE 110 FRANCE MOBILE COMPUTING DISPLAY IN 3D DISPLAY MARKET, BY TECHNOLOGY, 2018-2032 (USD THOUSAND)
TABLE 111 FRANCE PROJECTORS IN 3D DISPLAY MARKET, BY TECHNOLOGY, 2018-2032 (USD THOUSAND)
TABLE 112 FRANCE HMD IN 3D DISPLAY MARKET, BY TECHNOLOGY, 2018-2032 (USD THOUSAND)
TABLE 113 FRANCE OTHERS IN 3D DISPLAY MARKET, BY TECHNOLOGY, 2018-2032 (USD THOUSAND)
TABLE 114 FRANCE 3D DISPLAY MARKET, BY INDUSTRY, 2018-2032 (USD THOUSAND)
TABLE 115 FRANCE ENTERTAINMENT AND MEDIA IN 3D DISPLAY MARKET, BY TYPE, 2018-2032 (USD THOUSAND)
TABLE 116 FRANCE ADVERTISING AND RETAIL IN 3D DISPLAY MARKET, BY TYPE, 2018-2032 (USD THOUSAND)
TABLE 117 FRANCE CONSUMER ELECTRONICS IN 3D DISPLAY MARKET, BY TYPE, 2018-2032 (USD THOUSAND)
TABLE 118 FRANCE HEALTHCARE AND MEDICAL IN 3D DISPLAY MARKET, BY TYPE, 2018-2032 (USD THOUSAND)
TABLE 119 FRANCE AUTOMOTIVE IN 3D DISPLAY MARKET, BY TYPE, 2018-2032 (USD THOUSAND)
TABLE 120 FRANCE INDUSTRIAL AND SCIENTIFIC IN 3D DISPLAY MARKET, BY TYPE, 2018-2032 (USD THOUSAND)
TABLE 121 FRANCE AEROSPACE AND DEFENSE IN 3D DISPLAY MARKET, BY TYPE, 2018-2032 (USD THOUSAND)
TABLE 122 FRANCE OTHERS IN 3D DISPLAY MARKET, BY TYPE, 2018-2032 (USD THOUSAND)
TABLE 123 FRANCE 3D DISPLAY MARKET, BY SALES CHANNEL, 2018-2032 (USD THOUSAND)
TABLE 124 ITALY 3D DISPLAY MARKET, BY TECHNOLOGY, 2018-2032 (USD THOUSAND)
TABLE 125 ITALY 3D DISPLAY MARKET, BY TYPE, 2018-2032 (USD THOUSAND)
TABLE 126 ITALY 3D DISPLAY MARKET, BY ACCESS METHODOLOGY, 2018-2032 (USD THOUSAND)
TABLE 127 ITALY 3D DISPLAY MARKET, BY ORGANIZATION SIZE, 2018-2032 (USD THOUSAND)
TABLE 128 ITALY 3D DISPLAY MARKET, BY APPLICATION, 2018-2032 (USD THOUSAND)
TABLE 129 ITALY TELEVISIONS IN 3D DISPLAY MARKET, BY TECHNOLOGY, 2018-2032 (USD THOUSAND)
TABLE 130 ITALY SMARTPHONES IN 3D DISPLAY MARKET, BY TECHNOLOGY, 2018-2032 (USD THOUSAND)
TABLE 131 ITALY MONITORS IN 3D DISPLAY MARKET, BY TECHNOLOGY, 2018-2032 (USD THOUSAND)
TABLE 132 ITALY MOBILE COMPUTING DISPLAY IN 3D DISPLAY MARKET, BY TECHNOLOGY, 2018-2032 (USD THOUSAND)
TABLE 133 ITALY PROJECTORS IN 3D DISPLAY MARKET, BY TECHNOLOGY, 2018-2032 (USD THOUSAND)
TABLE 134 ITALY HMD IN 3D DISPLAY MARKET, BY TECHNOLOGY, 2018-2032 (USD THOUSAND)
TABLE 135 ITALY OTHERS IN 3D DISPLAY MARKET, BY TECHNOLOGY, 2018-2032 (USD THOUSAND)
TABLE 136 ITALY 3D DISPLAY MARKET, BY INDUSTRY, 2018-2032 (USD THOUSAND)
TABLE 137 ITALY ENTERTAINMENT AND MEDIA IN 3D DISPLAY MARKET, BY TYPE, 2018-2032 (USD THOUSAND)
TABLE 138 ITALY ADVERTISING AND RETAIL IN 3D DISPLAY MARKET, BY TYPE, 2018-2032 (USD THOUSAND)
TABLE 139 ITALY CONSUMER ELECTRONICS IN 3D DISPLAY MARKET, BY TYPE, 2018-2032 (USD THOUSAND)
TABLE 140 ITALY HEALTHCARE AND MEDICAL IN 3D DISPLAY MARKET, BY TYPE, 2018-2032 (USD THOUSAND)
TABLE 141 ITALY AUTOMOTIVE IN 3D DISPLAY MARKET, BY TYPE, 2018-2032 (USD THOUSAND)
TABLE 142 ITALY INDUSTRIAL AND SCIENTIFIC IN 3D DISPLAY MARKET, BY TYPE, 2018-2032 (USD THOUSAND)
TABLE 143 ITALY AEROSPACE AND DEFENSE IN 3D DISPLAY MARKET, BY TYPE, 2018-2032 (USD THOUSAND)
TABLE 144 ITALY OTHERS IN 3D DISPLAY MARKET, BY TYPE, 2018-2032 (USD THOUSAND)
TABLE 145 ITALY 3D DISPLAY MARKET, BY SALES CHANNEL, 2018-2032 (USD THOUSAND)
TABLE 146 SPAIN 3D DISPLAY MARKET, BY TECHNOLOGY, 2018-2032 (USD THOUSAND)
TABLE 147 SPAIN 3D DISPLAY MARKET, BY TYPE, 2018-2032 (USD THOUSAND)
TABLE 148 SPAIN 3D DISPLAY MARKET, BY ACCESS METHODOLOGY, 2018-2032 (USD THOUSAND)
TABLE 149 SPAIN 3D DISPLAY MARKET, BY ORGANIZATION SIZE, 2018-2032 (USD THOUSAND)
TABLE 150 SPAIN 3D DISPLAY MARKET, BY APPLICATION, 2018-2032 (USD THOUSAND)
TABLE 151 SPAIN TELEVISIONS IN 3D DISPLAY MARKET, BY TECHNOLOGY, 2018-2032 (USD THOUSAND)
TABLE 152 SPAIN SMARTPHONES IN 3D DISPLAY MARKET, BY TECHNOLOGY, 2018-2032 (USD THOUSAND)
TABLE 153 SPAIN MONITORS IN 3D DISPLAY MARKET, BY TECHNOLOGY, 2018-2032 (USD THOUSAND)
TABLE 154 SPAIN MOBILE COMPUTING DISPLAY IN 3D DISPLAY MARKET, BY TECHNOLOGY, 2018-2032 (USD THOUSAND)
TABLE 155 SPAIN PROJECTORS IN 3D DISPLAY MARKET, BY TECHNOLOGY, 2018-2032 (USD THOUSAND)
TABLE 156 SPAIN HMD IN 3D DISPLAY MARKET, BY TECHNOLOGY, 2018-2032 (USD THOUSAND)
TABLE 157 SPAIN OTHERS IN 3D DISPLAY MARKET, BY TECHNOLOGY, 2018-2032 (USD THOUSAND)
TABLE 158 SPAIN 3D DISPLAY MARKET, BY INDUSTRY, 2018-2032 (USD THOUSAND)
TABLE 159 SPAIN ENTERTAINMENT AND MEDIA IN 3D DISPLAY MARKET, BY TYPE, 2018-2032 (USD THOUSAND)
TABLE 160 SPAIN ADVERTISING AND RETAIL IN 3D DISPLAY MARKET, BY TYPE, 2018-2032 (USD THOUSAND)
TABLE 161 SPAIN CONSUMER ELECTRONICS IN 3D DISPLAY MARKET, BY TYPE, 2018-2032 (USD THOUSAND)
TABLE 162 SPAIN HEALTHCARE AND MEDICAL IN 3D DISPLAY MARKET, BY TYPE, 2018-2032 (USD THOUSAND)
TABLE 163 SPAIN AUTOMOTIVE IN 3D DISPLAY MARKET, BY TYPE, 2018-2032 (USD THOUSAND)
TABLE 164 SPAIN INDUSTRIAL AND SCIENTIFIC IN 3D DISPLAY MARKET, BY TYPE, 2018-2032 (USD THOUSAND)
TABLE 165 SPAIN AEROSPACE AND DEFENSE IN 3D DISPLAY MARKET, BY TYPE, 2018-2032 (USD THOUSAND)
TABLE 166 SPAIN OTHERS IN 3D DISPLAY MARKET, BY TYPE, 2018-2032 (USD THOUSAND)
TABLE 167 SPAIN 3D DISPLAY MARKET, BY SALES CHANNEL, 2018-2032 (USD THOUSAND)
TABLE 168 U.K. 3D DISPLAY MARKET, BY TECHNOLOGY, 2018-2032 (USD THOUSAND)
TABLE 169 U.K. 3D DISPLAY MARKET, BY TYPE, 2018-2032 (USD THOUSAND)
TABLE 170 U.K. 3D DISPLAY MARKET, BY ACCESS METHODOLOGY, 2018-2032 (USD THOUSAND)
TABLE 171 U.K. 3D DISPLAY MARKET, BY ORGANIZATION SIZE, 2018-2032 (USD THOUSAND)
TABLE 172 U.K. 3D DISPLAY MARKET, BY APPLICATION, 2018-2032 (USD THOUSAND)
TABLE 173 U.K. TELEVISIONS IN 3D DISPLAY MARKET, BY TECHNOLOGY, 2018-2032 (USD THOUSAND)
TABLE 174 U.K. SMARTPHONES IN 3D DISPLAY MARKET, BY TECHNOLOGY, 2018-2032 (USD THOUSAND)
TABLE 175 U.K. MONITORS IN 3D DISPLAY MARKET, BY TECHNOLOGY, 2018-2032 (USD THOUSAND)
TABLE 176 U.K. MOBILE COMPUTING DISPLAY IN 3D DISPLAY MARKET, BY TECHNOLOGY, 2018-2032 (USD THOUSAND)
TABLE 177 U.K. PROJECTORS IN 3D DISPLAY MARKET, BY TECHNOLOGY, 2018-2032 (USD THOUSAND)
TABLE 178 U.K. HMD IN 3D DISPLAY MARKET, BY TECHNOLOGY, 2018-2032 (USD THOUSAND)
TABLE 179 U.K. OTHERS IN 3D DISPLAY MARKET, BY TECHNOLOGY, 2018-2032 (USD THOUSAND)
TABLE 180 U.K. 3D DISPLAY MARKET, BY INDUSTRY, 2018-2032 (USD THOUSAND)
TABLE 181 U.K. ENTERTAINMENT AND MEDIA IN 3D DISPLAY MARKET, BY TYPE, 2018-2032 (USD THOUSAND)
TABLE 182 U.K. ADVERTISING AND RETAIL IN 3D DISPLAY MARKET, BY TYPE, 2018-2032 (USD THOUSAND)
TABLE 183 U.K. CONSUMER ELECTRONICS IN 3D DISPLAY MARKET, BY TYPE, 2018-2032 (USD THOUSAND)
TABLE 184 U.K. HEALTHCARE AND MEDICAL IN 3D DISPLAY MARKET, BY TYPE, 2018-2032 (USD THOUSAND)
TABLE 185 U.K. AUTOMOTIVE IN 3D DISPLAY MARKET, BY TYPE, 2018-2032 (USD THOUSAND)
TABLE 186 U.K. INDUSTRIAL AND SCIENTIFIC IN 3D DISPLAY MARKET, BY TYPE, 2018-2032 (USD THOUSAND)
TABLE 187 U.K. AEROSPACE AND DEFENSE IN 3D DISPLAY MARKET, BY TYPE, 2018-2032 (USD THOUSAND)
TABLE 188 U.K. OTHERS IN 3D DISPLAY MARKET, BY TYPE, 2018-2032 (USD THOUSAND)
TABLE 189 U.K. 3D DISPLAY MARKET, BY SALES CHANNEL, 2018-2032 (USD THOUSAND)
TABLE 190 RUSSIA 3D DISPLAY MARKET, BY TECHNOLOGY, 2018-2032 (USD THOUSAND)
TABLE 191 RUSSIA 3D DISPLAY MARKET, BY TYPE, 2018-2032 (USD THOUSAND)
TABLE 192 RUSSIA 3D DISPLAY MARKET, BY ACCESS METHODOLOGY, 2018-2032 (USD THOUSAND)
TABLE 193 RUSSIA 3D DISPLAY MARKET, BY ORGANIZATION SIZE, 2018-2032 (USD THOUSAND)
TABLE 194 RUSSIA 3D DISPLAY MARKET, BY APPLICATION, 2018-2032 (USD THOUSAND)
TABLE 195 RUSSIA TELEVISIONS IN 3D DISPLAY MARKET, BY TECHNOLOGY, 2018-2032 (USD THOUSAND)
TABLE 196 RUSSIA SMARTPHONES IN 3D DISPLAY MARKET, BY TECHNOLOGY, 2018-2032 (USD THOUSAND)
TABLE 197 RUSSIA MONITORS IN 3D DISPLAY MARKET, BY TECHNOLOGY, 2018-2032 (USD THOUSAND)
TABLE 198 RUSSIA MOBILE COMPUTING DISPLAY IN 3D DISPLAY MARKET, BY TECHNOLOGY, 2018-2032 (USD THOUSAND)
TABLE 199 RUSSIA PROJECTORS IN 3D DISPLAY MARKET, BY TECHNOLOGY, 2018-2032 (USD THOUSAND)
TABLE 200 RUSSIA HMD IN 3D DISPLAY MARKET, BY TECHNOLOGY, 2018-2032 (USD THOUSAND)
TABLE 201 RUSSIA OTHERS IN 3D DISPLAY MARKET, BY TECHNOLOGY, 2018-2032 (USD THOUSAND)
TABLE 202 RUSSIA 3D DISPLAY MARKET, BY INDUSTRY, 2018-2032 (USD THOUSAND)
TABLE 203 RUSSIA ENTERTAINMENT AND MEDIA IN 3D DISPLAY MARKET, BY TYPE, 2018-2032 (USD THOUSAND)
TABLE 204 RUSSIA ADVERTISING AND RETAIL IN 3D DISPLAY MARKET, BY TYPE, 2018-2032 (USD THOUSAND)
TABLE 205 RUSSIA CONSUMER ELECTRONICS IN 3D DISPLAY MARKET, BY TYPE, 2018-2032 (USD THOUSAND)
TABLE 206 RUSSIA HEALTHCARE AND MEDICAL IN 3D DISPLAY MARKET, BY TYPE, 2018-2032 (USD THOUSAND)
TABLE 207 RUSSIA AUTOMOTIVE IN 3D DISPLAY MARKET, BY TYPE, 2018-2032 (USD THOUSAND)
TABLE 208 RUSSIA INDUSTRIAL AND SCIENTIFIC IN 3D DISPLAY MARKET, BY TYPE, 2018-2032 (USD THOUSAND)
TABLE 209 RUSSIA AEROSPACE AND DEFENSE IN 3D DISPLAY MARKET, BY TYPE, 2018-2032 (USD THOUSAND)
TABLE 210 RUSSIA OTHERS IN 3D DISPLAY MARKET, BY TYPE, 2018-2032 (USD THOUSAND)
TABLE 211 RUSSIA 3D DISPLAY MARKET, BY SALES CHANNEL, 2018-2032 (USD THOUSAND)
TABLE 212 SWITZERLAND 3D DISPLAY MARKET, BY TECHNOLOGY, 2018-2032 (USD THOUSAND)
TABLE 213 SWITZERLAND 3D DISPLAY MARKET, BY TYPE, 2018-2032 (USD THOUSAND)
TABLE 214 SWITZERLAND 3D DISPLAY MARKET, BY ACCESS METHODOLOGY, 2018-2032 (USD THOUSAND)
TABLE 215 SWITZERLAND 3D DISPLAY MARKET, BY ORGANIZATION SIZE, 2018-2032 (USD THOUSAND)
TABLE 216 SWITZERLAND 3D DISPLAY MARKET, BY APPLICATION, 2018-2032 (USD THOUSAND)
TABLE 217 SWITZERLAND TELEVISIONS IN 3D DISPLAY MARKET, BY TECHNOLOGY, 2018-2032 (USD THOUSAND)
TABLE 218 SWITZERLAND SMARTPHONES IN 3D DISPLAY MARKET, BY TECHNOLOGY, 2018-2032 (USD THOUSAND)
TABLE 219 SWITZERLAND MONITORS IN 3D DISPLAY MARKET, BY TECHNOLOGY, 2018-2032 (USD THOUSAND)
TABLE 220 SWITZERLAND MOBILE COMPUTING DISPLAY IN 3D DISPLAY MARKET, BY TECHNOLOGY, 2018-2032 (USD THOUSAND)
TABLE 221 SWITZERLAND PROJECTORS IN 3D DISPLAY MARKET, BY TECHNOLOGY, 2018-2032 (USD THOUSAND)
TABLE 222 SWITZERLAND HMD IN 3D DISPLAY MARKET, BY TECHNOLOGY, 2018-2032 (USD THOUSAND)
TABLE 223 SWITZERLAND OTHERS IN 3D DISPLAY MARKET, BY TECHNOLOGY, 2018-2032 (USD THOUSAND)
TABLE 224 SWITZERLAND 3D DISPLAY MARKET, BY INDUSTRY, 2018-2032 (USD THOUSAND)
TABLE 225 SWITZERLAND ENTERTAINMENT AND MEDIA IN 3D DISPLAY MARKET, BY TYPE, 2018-2032 (USD THOUSAND)
TABLE 226 SWITZERLAND ADVERTISING AND RETAIL IN 3D DISPLAY MARKET, BY TYPE, 2018-2032 (USD THOUSAND)
TABLE 227 SWITZERLAND CONSUMER ELECTRONICS IN 3D DISPLAY MARKET, BY TYPE, 2018-2032 (USD THOUSAND)
TABLE 228 SWITZERLAND HEALTHCARE AND MEDICAL IN 3D DISPLAY MARKET, BY TYPE, 2018-2032 (USD THOUSAND)
TABLE 229 SWITZERLAND AUTOMOTIVE IN 3D DISPLAY MARKET, BY TYPE, 2018-2032 (USD THOUSAND)
TABLE 230 SWITZERLAND INDUSTRIAL AND SCIENTIFIC IN 3D DISPLAY MARKET, BY TYPE, 2018-2032 (USD THOUSAND)
TABLE 231 SWITZERLAND AEROSPACE AND DEFENSE IN 3D DISPLAY MARKET, BY TYPE, 2018-2032 (USD THOUSAND)
TABLE 232 SWITZERLAND OTHERS IN 3D DISPLAY MARKET, BY TYPE, 2018-2032 (USD THOUSAND)
TABLE 233 SWITZERLAND 3D DISPLAY MARKET, BY SALES CHANNEL, 2018-2032 (USD THOUSAND)
TABLE 234 TURKEY 3D DISPLAY MARKET, BY TECHNOLOGY, 2018-2032 (USD THOUSAND)
TABLE 235 TURKEY 3D DISPLAY MARKET, BY TYPE, 2018-2032 (USD THOUSAND)
TABLE 236 TURKEY 3D DISPLAY MARKET, BY ACCESS METHODOLOGY, 2018-2032 (USD THOUSAND)
TABLE 237 TURKEY 3D DISPLAY MARKET, BY ORGANIZATION SIZE, 2018-2032 (USD THOUSAND)
TABLE 238 TURKEY 3D DISPLAY MARKET, BY APPLICATION, 2018-2032 (USD THOUSAND)
TABLE 239 TURKEY TELEVISIONS IN 3D DISPLAY MARKET, BY TECHNOLOGY, 2018-2032 (USD THOUSAND)
TABLE 240 TURKEY SMARTPHONES IN 3D DISPLAY MARKET, BY TECHNOLOGY, 2018-2032 (USD THOUSAND)
TABLE 241 TURKEY MONITORS IN 3D DISPLAY MARKET, BY TECHNOLOGY, 2018-2032 (USD THOUSAND)
TABLE 242 TURKEY MOBILE COMPUTING DISPLAY IN 3D DISPLAY MARKET, BY TECHNOLOGY, 2018-2032 (USD THOUSAND)
TABLE 243 TURKEY PROJECTORS IN 3D DISPLAY MARKET, BY TECHNOLOGY, 2018-2032 (USD THOUSAND)
TABLE 244 TURKEY HMD IN 3D DISPLAY MARKET, BY TECHNOLOGY, 2018-2032 (USD THOUSAND)
TABLE 245 TURKEY OTHERS IN 3D DISPLAY MARKET, BY TECHNOLOGY, 2018-2032 (USD THOUSAND)
TABLE 246 TURKEY 3D DISPLAY MARKET, BY INDUSTRY, 2018-2032 (USD THOUSAND)
TABLE 247 TURKEY ENTERTAINMENT AND MEDIA IN 3D DISPLAY MARKET, BY TYPE, 2018-2032 (USD THOUSAND)
TABLE 248 TURKEY ADVERTISING AND RETAIL IN 3D DISPLAY MARKET, BY TYPE, 2018-2032 (USD THOUSAND)
TABLE 249 TURKEY CONSUMER ELECTRONICS IN 3D DISPLAY MARKET, BY TYPE, 2018-2032 (USD THOUSAND)
TABLE 250 TURKEY HEALTHCARE AND MEDICAL IN 3D DISPLAY MARKET, BY TYPE, 2018-2032 (USD THOUSAND)
TABLE 251 TURKEY AUTOMOTIVE IN 3D DISPLAY MARKET, BY TYPE, 2018-2032 (USD THOUSAND)
TABLE 252 TURKEY INDUSTRIAL AND SCIENTIFIC IN 3D DISPLAY MARKET, BY TYPE, 2018-2032 (USD THOUSAND)
TABLE 253 TURKEY AEROSPACE AND DEFENSE IN 3D DISPLAY MARKET, BY TYPE, 2018-2032 (USD THOUSAND)
TABLE 254 TURKEY OTHERS IN 3D DISPLAY MARKET, BY TYPE, 2018-2032 (USD THOUSAND)
TABLE 255 TURKEY 3D DISPLAY MARKET, BY SALES CHANNEL, 2018-2032 (USD THOUSAND)
TABLE 256 BELGIUM 3D DISPLAY MARKET, BY TECHNOLOGY, 2018-2032 (USD THOUSAND)
TABLE 257 BELGIUM 3D DISPLAY MARKET, BY TYPE, 2018-2032 (USD THOUSAND)
TABLE 258 BELGIUM 3D DISPLAY MARKET, BY ACCESS METHODOLOGY, 2018-2032 (USD THOUSAND)
TABLE 259 BELGIUM 3D DISPLAY MARKET, BY ORGANIZATION SIZE, 2018-2032 (USD THOUSAND)
TABLE 260 BELGIUM 3D DISPLAY MARKET, BY APPLICATION, 2018-2032 (USD THOUSAND)
TABLE 261 BELGIUM TELEVISIONS IN 3D DISPLAY MARKET, BY TECHNOLOGY, 2018-2032 (USD THOUSAND)
TABLE 262 BELGIUM SMARTPHONES IN 3D DISPLAY MARKET, BY TECHNOLOGY, 2018-2032 (USD THOUSAND)
TABLE 263 BELGIUM MONITORS IN 3D DISPLAY MARKET, BY TECHNOLOGY, 2018-2032 (USD THOUSAND)
TABLE 264 BELGIUM MOBILE COMPUTING DISPLAY IN 3D DISPLAY MARKET, BY TECHNOLOGY, 2018-2032 (USD THOUSAND)
TABLE 265 BELGIUM PROJECTORS IN 3D DISPLAY MARKET, BY TECHNOLOGY, 2018-2032 (USD THOUSAND)
TABLE 266 BELGIUM HMD IN 3D DISPLAY MARKET, BY TECHNOLOGY, 2018-2032 (USD THOUSAND)
TABLE 267 BELGIUM OTHERS IN 3D DISPLAY MARKET, BY TECHNOLOGY, 2018-2032 (USD THOUSAND)
TABLE 268 BELGIUM 3D DISPLAY MARKET, BY INDUSTRY, 2018-2032 (USD THOUSAND)
TABLE 269 BELGIUM ENTERTAINMENT AND MEDIA IN 3D DISPLAY MARKET, BY TYPE, 2018-2032 (USD THOUSAND)
TABLE 270 BELGIUM ADVERTISING AND RETAIL IN 3D DISPLAY MARKET, BY TYPE, 2018-2032 (USD THOUSAND)
TABLE 271 BELGIUM CONSUMER ELECTRONICS IN 3D DISPLAY MARKET, BY TYPE, 2018-2032 (USD THOUSAND)
TABLE 272 BELGIUM HEALTHCARE AND MEDICAL IN 3D DISPLAY MARKET, BY TYPE, 2018-2032 (USD THOUSAND)
TABLE 273 BELGIUM AUTOMOTIVE IN 3D DISPLAY MARKET, BY TYPE, 2018-2032 (USD THOUSAND)
TABLE 274 BELGIUM INDUSTRIAL AND SCIENTIFIC IN 3D DISPLAY MARKET, BY TYPE, 2018-2032 (USD THOUSAND)
TABLE 275 BELGIUM AEROSPACE AND DEFENSE IN 3D DISPLAY MARKET, BY TYPE, 2018-2032 (USD THOUSAND)
TABLE 276 BELGIUM OTHERS IN 3D DISPLAY MARKET, BY TYPE, 2018-2032 (USD THOUSAND)
TABLE 277 BELGIUM 3D DISPLAY MARKET, BY SALES CHANNEL, 2018-2032 (USD THOUSAND)
TABLE 278 NETHERLANDS 3D DISPLAY MARKET, BY TECHNOLOGY, 2018-2032 (USD THOUSAND)
TABLE 279 NETHERLANDS 3D DISPLAY MARKET, BY TYPE, 2018-2032 (USD THOUSAND)
TABLE 280 NETHERLANDS 3D DISPLAY MARKET, BY ACCESS METHODOLOGY, 2018-2032 (USD THOUSAND)
TABLE 281 NETHERLANDS 3D DISPLAY MARKET, BY ORGANIZATION SIZE, 2018-2032 (USD THOUSAND)
TABLE 282 NETHERLANDS 3D DISPLAY MARKET, BY APPLICATION, 2018-2032 (USD THOUSAND)
TABLE 283 NETHERLANDS TELEVISIONS IN 3D DISPLAY MARKET, BY TECHNOLOGY, 2018-2032 (USD THOUSAND)
TABLE 284 NETHERLANDS SMARTPHONES IN 3D DISPLAY MARKET, BY TECHNOLOGY, 2018-2032 (USD THOUSAND)
TABLE 285 NETHERLANDS MONITORS IN 3D DISPLAY MARKET, BY TECHNOLOGY, 2018-2032 (USD THOUSAND)
TABLE 286 NETHERLANDS MOBILE COMPUTING DISPLAY IN 3D DISPLAY MARKET, BY TECHNOLOGY, 2018-2032 (USD THOUSAND)
TABLE 287 NETHERLANDS PROJECTORS IN 3D DISPLAY MARKET, BY TECHNOLOGY, 2018-2032 (USD THOUSAND)
TABLE 288 NETHERLANDS HMD IN 3D DISPLAY MARKET, BY TECHNOLOGY, 2018-2032 (USD THOUSAND)
TABLE 289 NETHERLANDS OTHERS IN 3D DISPLAY MARKET, BY TECHNOLOGY, 2018-2032 (USD THOUSAND)
TABLE 290 NETHERLANDS 3D DISPLAY MARKET, BY INDUSTRY, 2018-2032 (USD THOUSAND)
TABLE 291 NETHERLANDS ENTERTAINMENT AND MEDIA IN 3D DISPLAY MARKET, BY TYPE, 2018-2032 (USD THOUSAND)
TABLE 292 NETHERLANDS ADVERTISING AND RETAIL IN 3D DISPLAY MARKET, BY TYPE, 2018-2032 (USD THOUSAND)
TABLE 293 NETHERLANDS CONSUMER ELECTRONICS IN 3D DISPLAY MARKET, BY TYPE, 2018-2032 (USD THOUSAND)
TABLE 294 NETHERLANDS HEALTHCARE AND MEDICAL IN 3D DISPLAY MARKET, BY TYPE, 2018-2032 (USD THOUSAND)
TABLE 295 NETHERLANDS AUTOMOTIVE IN 3D DISPLAY MARKET, BY TYPE, 2018-2032 (USD THOUSAND)
TABLE 296 NETHERLANDS INDUSTRIAL AND SCIENTIFIC IN 3D DISPLAY MARKET, BY TYPE, 2018-2032 (USD THOUSAND)
TABLE 297 NETHERLANDS AEROSPACE AND DEFENSE IN 3D DISPLAY MARKET, BY TYPE, 2018-2032 (USD THOUSAND)
TABLE 298 NETHERLANDS OTHERS IN 3D DISPLAY MARKET, BY TYPE, 2018-2032 (USD THOUSAND)
TABLE 299 NETHERLANDS 3D DISPLAY MARKET, BY SALES CHANNEL, 2018-2032 (USD THOUSAND)
TABLE 300 NORWAY 3D DISPLAY MARKET, BY TECHNOLOGY, 2018-2032 (USD THOUSAND)
TABLE 301 NORWAY 3D DISPLAY MARKET, BY TYPE, 2018-2032 (USD THOUSAND)
TABLE 302 NORWAY 3D DISPLAY MARKET, BY ACCESS METHODOLOGY, 2018-2032 (USD THOUSAND)
TABLE 303 NORWAY 3D DISPLAY MARKET, BY ORGANIZATION SIZE, 2018-2032 (USD THOUSAND)
TABLE 304 NORWAY 3D DISPLAY MARKET, BY APPLICATION, 2018-2032 (USD THOUSAND)
TABLE 305 NORWAY TELEVISIONS IN 3D DISPLAY MARKET, BY TECHNOLOGY, 2018-2032 (USD THOUSAND)
TABLE 306 NORWAY SMARTPHONES IN 3D DISPLAY MARKET, BY TECHNOLOGY, 2018-2032 (USD THOUSAND)
TABLE 307 NORWAY MONITORS IN 3D DISPLAY MARKET, BY TECHNOLOGY, 2018-2032 (USD THOUSAND)
TABLE 308 NORWAY MOBILE COMPUTING DISPLAY IN 3D DISPLAY MARKET, BY TECHNOLOGY, 2018-2032 (USD THOUSAND)
TABLE 309 NORWAY PROJECTORS IN 3D DISPLAY MARKET, BY TECHNOLOGY, 2018-2032 (USD THOUSAND)
TABLE 310 NORWAY HMD IN 3D DISPLAY MARKET, BY TECHNOLOGY, 2018-2032 (USD THOUSAND)
TABLE 311 NORWAY OTHERS IN 3D DISPLAY MARKET, BY TECHNOLOGY, 2018-2032 (USD THOUSAND)
TABLE 312 NORWAY 3D DISPLAY MARKET, BY INDUSTRY, 2018-2032 (USD THOUSAND)
TABLE 313 NORWAY ENTERTAINMENT AND MEDIA IN 3D DISPLAY MARKET, BY TYPE, 2018-2032 (USD THOUSAND)
TABLE 314 NORWAY ADVERTISING AND RETAIL IN 3D DISPLAY MARKET, BY TYPE, 2018-2032 (USD THOUSAND)
TABLE 315 NORWAY CONSUMER ELECTRONICS IN 3D DISPLAY MARKET, BY TYPE, 2018-2032 (USD THOUSAND)
TABLE 316 NORWAY HEALTHCARE AND MEDICAL IN 3D DISPLAY MARKET, BY TYPE, 2018-2032 (USD THOUSAND)
TABLE 317 NORWAY AUTOMOTIVE IN 3D DISPLAY MARKET, BY TYPE, 2018-2032 (USD THOUSAND)
TABLE 318 NORWAY INDUSTRIAL AND SCIENTIFIC IN 3D DISPLAY MARKET, BY TYPE, 2018-2032 (USD THOUSAND)
TABLE 319 NORWAY AEROSPACE AND DEFENSE IN 3D DISPLAY MARKET, BY TYPE, 2018-2032 (USD THOUSAND)
TABLE 320 NORWAY OTHERS IN 3D DISPLAY MARKET, BY TYPE, 2018-2032 (USD THOUSAND)
TABLE 321 NORWAY 3D DISPLAY MARKET, BY SALES CHANNEL, 2018-2032 (USD THOUSAND)
TABLE 322 SWEDEN 3D DISPLAY MARKET, BY TECHNOLOGY, 2018-2032 (USD THOUSAND)
TABLE 323 SWEDEN 3D DISPLAY MARKET, BY TYPE, 2018-2032 (USD THOUSAND)
TABLE 324 SWEDEN 3D DISPLAY MARKET, BY ACCESS METHODOLOGY, 2018-2032 (USD THOUSAND)
TABLE 325 SWEDEN 3D DISPLAY MARKET, BY ORGANIZATION SIZE, 2018-2032 (USD THOUSAND)
TABLE 326 SWEDEN 3D DISPLAY MARKET, BY APPLICATION, 2018-2032 (USD THOUSAND)
TABLE 327 SWEDEN TELEVISIONS IN 3D DISPLAY MARKET, BY TECHNOLOGY, 2018-2032 (USD THOUSAND)
TABLE 328 SWEDEN SMARTPHONES IN 3D DISPLAY MARKET, BY TECHNOLOGY, 2018-2032 (USD THOUSAND)
TABLE 329 SWEDEN MONITORS IN 3D DISPLAY MARKET, BY TECHNOLOGY, 2018-2032 (USD THOUSAND)
TABLE 330 SWEDEN MOBILE COMPUTING DISPLAY IN 3D DISPLAY MARKET, BY TECHNOLOGY, 2018-2032 (USD THOUSAND)
TABLE 331 SWEDEN PROJECTORS IN 3D DISPLAY MARKET, BY TECHNOLOGY, 2018-2032 (USD THOUSAND)
TABLE 332 SWEDEN HMD IN 3D DISPLAY MARKET, BY TECHNOLOGY, 2018-2032 (USD THOUSAND)
TABLE 333 SWEDEN OTHERS IN 3D DISPLAY MARKET, BY TECHNOLOGY, 2018-2032 (USD THOUSAND)
TABLE 334 SWEDEN 3D DISPLAY MARKET, BY INDUSTRY, 2018-2032 (USD THOUSAND)
TABLE 335 SWEDEN ENTERTAINMENT AND MEDIA IN 3D DISPLAY MARKET, BY TYPE, 2018-2032 (USD THOUSAND)
TABLE 336 SWEDEN ADVERTISING AND RETAIL IN 3D DISPLAY MARKET, BY TYPE, 2018-2032 (USD THOUSAND)
TABLE 337 SWEDEN CONSUMER ELECTRONICS IN 3D DISPLAY MARKET, BY TYPE, 2018-2032 (USD THOUSAND)
TABLE 338 SWEDEN HEALTHCARE AND MEDICAL IN 3D DISPLAY MARKET, BY TYPE, 2018-2032 (USD THOUSAND)
TABLE 339 SWEDEN AUTOMOTIVE IN 3D DISPLAY MARKET, BY TYPE, 2018-2032 (USD THOUSAND)
TABLE 340 SWEDEN INDUSTRIAL AND SCIENTIFIC IN 3D DISPLAY MARKET, BY TYPE, 2018-2032 (USD THOUSAND)
TABLE 341 SWEDEN AEROSPACE AND DEFENSE IN 3D DISPLAY MARKET, BY TYPE, 2018-2032 (USD THOUSAND)
TABLE 342 SWEDEN OTHERS IN 3D DISPLAY MARKET, BY TYPE, 2018-2032 (USD THOUSAND)
TABLE 343 SWEDEN 3D DISPLAY MARKET, BY SALES CHANNEL, 2018-2032 (USD THOUSAND)
TABLE 344 POLAND 3D DISPLAY MARKET, BY TECHNOLOGY, 2018-2032 (USD THOUSAND)
TABLE 345 POLAND 3D DISPLAY MARKET, BY TYPE, 2018-2032 (USD THOUSAND)
TABLE 346 POLAND 3D DISPLAY MARKET, BY ACCESS METHODOLOGY, 2018-2032 (USD THOUSAND)
TABLE 347 POLAND 3D DISPLAY MARKET, BY ORGANIZATION SIZE, 2018-2032 (USD THOUSAND)
TABLE 348 POLAND 3D DISPLAY MARKET, BY APPLICATION, 2018-2032 (USD THOUSAND)
TABLE 349 POLAND TELEVISIONS IN 3D DISPLAY MARKET, BY TECHNOLOGY, 2018-2032 (USD THOUSAND)
TABLE 350 POLAND SMARTPHONES IN 3D DISPLAY MARKET, BY TECHNOLOGY, 2018-2032 (USD THOUSAND)
TABLE 351 POLAND MONITORS IN 3D DISPLAY MARKET, BY TECHNOLOGY, 2018-2032 (USD THOUSAND)
TABLE 352 POLAND MOBILE COMPUTING DISPLAY IN 3D DISPLAY MARKET, BY TECHNOLOGY, 2018-2032 (USD THOUSAND)
TABLE 353 POLAND PROJECTORS IN 3D DISPLAY MARKET, BY TECHNOLOGY, 2018-2032 (USD THOUSAND)
TABLE 354 POLAND HMD IN 3D DISPLAY MARKET, BY TECHNOLOGY, 2018-2032 (USD THOUSAND)
TABLE 355 POLAND OTHERS IN 3D DISPLAY MARKET, BY TECHNOLOGY, 2018-2032 (USD THOUSAND)
TABLE 356 POLAND 3D DISPLAY MARKET, BY INDUSTRY, 2018-2032 (USD THOUSAND)
TABLE 357 POLAND ENTERTAINMENT AND MEDIA IN 3D DISPLAY MARKET, BY TYPE, 2018-2032 (USD THOUSAND)
TABLE 358 POLAND ADVERTISING AND RETAIL IN 3D DISPLAY MARKET, BY TYPE, 2018-2032 (USD THOUSAND)
TABLE 359 POLAND CONSUMER ELECTRONICS IN 3D DISPLAY MARKET, BY TYPE, 2018-2032 (USD THOUSAND)
TABLE 360 POLAND HEALTHCARE AND MEDICAL IN 3D DISPLAY MARKET, BY TYPE, 2018-2032 (USD THOUSAND)
TABLE 361 POLAND AUTOMOTIVE IN 3D DISPLAY MARKET, BY TYPE, 2018-2032 (USD THOUSAND)
TABLE 362 POLAND INDUSTRIAL AND SCIENTIFIC IN 3D DISPLAY MARKET, BY TYPE, 2018-2032 (USD THOUSAND)
TABLE 363 POLAND AEROSPACE AND DEFENSE IN 3D DISPLAY MARKET, BY TYPE, 2018-2032 (USD THOUSAND)
TABLE 364 POLAND OTHERS IN 3D DISPLAY MARKET, BY TYPE, 2018-2032 (USD THOUSAND)
TABLE 365 POLAND 3D DISPLAY MARKET, BY SALES CHANNEL, 2018-2032 (USD THOUSAND)
TABLE 366 LUXEMBURG 3D DISPLAY MARKET, BY TECHNOLOGY, 2018-2032 (USD THOUSAND)
TABLE 367 LUXEMBURG 3D DISPLAY MARKET, BY TYPE, 2018-2032 (USD THOUSAND)
TABLE 368 LUXEMBURG 3D DISPLAY MARKET, BY ACCESS METHODOLOGY, 2018-2032 (USD THOUSAND)
TABLE 369 LUXEMBURG 3D DISPLAY MARKET, BY ORGANIZATION SIZE, 2018-2032 (USD THOUSAND)
TABLE 370 LUXEMBURG 3D DISPLAY MARKET, BY APPLICATION, 2018-2032 (USD THOUSAND)
TABLE 371 LUXEMBURG TELEVISIONS IN 3D DISPLAY MARKET, BY TECHNOLOGY, 2018-2032 (USD THOUSAND)
TABLE 372 LUXEMBURG SMARTPHONES IN 3D DISPLAY MARKET, BY TECHNOLOGY, 2018-2032 (USD THOUSAND)
TABLE 373 LUXEMBURG MONITORS IN 3D DISPLAY MARKET, BY TECHNOLOGY, 2018-2032 (USD THOUSAND)
TABLE 374 LUXEMBURG MOBILE COMPUTING DISPLAY IN 3D DISPLAY MARKET, BY TECHNOLOGY, 2018-2032 (USD THOUSAND)
TABLE 375 LUXEMBURG PROJECTORS IN 3D DISPLAY MARKET, BY TECHNOLOGY, 2018-2032 (USD THOUSAND)
TABLE 376 LUXEMBURG HMD IN 3D DISPLAY MARKET, BY TECHNOLOGY, 2018-2032 (USD THOUSAND)
TABLE 377 LUXEMBURG OTHERS IN 3D DISPLAY MARKET, BY TECHNOLOGY, 2018-2032 (USD THOUSAND)
TABLE 378 LUXEMBURG 3D DISPLAY MARKET, BY INDUSTRY, 2018-2032 (USD THOUSAND)
TABLE 379 LUXEMBURG ENTERTAINMENT AND MEDIA IN 3D DISPLAY MARKET, BY TYPE, 2018-2032 (USD THOUSAND)
TABLE 380 LUXEMBURG ADVERTISING AND RETAIL IN 3D DISPLAY MARKET, BY TYPE, 2018-2032 (USD THOUSAND)
TABLE 381 LUXEMBURG CONSUMER ELECTRONICS IN 3D DISPLAY MARKET, BY TYPE, 2018-2032 (USD THOUSAND)
TABLE 382 LUXEMBURG HEALTHCARE AND MEDICAL IN 3D DISPLAY MARKET, BY TYPE, 2018-2032 (USD THOUSAND)
TABLE 383 LUXEMBURG AUTOMOTIVE IN 3D DISPLAY MARKET, BY TYPE, 2018-2032 (USD THOUSAND)
TABLE 384 LUXEMBURG INDUSTRIAL AND SCIENTIFIC IN 3D DISPLAY MARKET, BY TYPE, 2018-2032 (USD THOUSAND)
TABLE 385 LUXEMBURG AEROSPACE AND DEFENSE IN 3D DISPLAY MARKET, BY TYPE, 2018-2032 (USD THOUSAND)
TABLE 386 LUXEMBURG OTHERS IN 3D DISPLAY MARKET, BY TYPE, 2018-2032 (USD THOUSAND)
TABLE 387 LUXEMBURG 3D DISPLAY MARKET, BY SALES CHANNEL, 2018-2032 (USD THOUSAND)
TABLE 388 REST OF EUROPE 3D DISPLAY MARKET, BY TECHNOLOGY, 2018-2032 (USD THOUSAND)
List of Figure
FIGURE 1 EUROPE 3D DISPLAY MARKET
FIGURE 2 EUROPE 3D DISPLAY MARKET: DATA TRIANGULATION
FIGURE 3 EUROPE 3D DISPLAY: DROC ANALYSIS
FIGURE 4 EUROPE 3D DISPLAY: REGIONAL MARKET ANALYSIS
FIGURE 5 EUROPE 3D DISPLAY: COMPANY RESEARCH ANALYSIS
FIGURE 6 EUROPE 3D DISPLAY: MULTIVARIATE MODELLING
FIGURE 7 EUROPE 3D DISPLAY: INTERVIEW DEMOGRAPHICS
FIGURE 8 EUROPE 3D DISPLAY MARKET: DBMR MARKET POSITION GRID
FIGURE 9 EUROPE 3D DISPLAY MARKET: VENDOR SHARE ANALYSIS
FIGURE 10 EUROPE 3D DISPLAY MARKET: SEGMENTATION
FIGURE 11 EXECUTIVE SUMMARY
FIGURE 12 STRATEGIC DECISIONS
FIGURE 13 GROWING DEMAND FOR 3D CONTENT AND ENTERTAINMENT IS EXPECTED TO DRIVE THE EUROPE 3D DISPLAY MARKET IN THE FORECAST PERIOD (2025-2032)
FIGURE 14 THE OLED SEGMENT IS EXPECTED TO ACCOUNT FOR THE LARGEST SHARE OF THE EUROPE 3D DISPLAY MARKET IN 2025 AND 2032
FIGURE 15 PORTER’S FIVE FORCES
FIGURE 16 DRIVERS, RESTRAINTS, OPPORTUNITIES AND CHALLENGES OF EUROPE 3D DISPLAY MARKET
FIGURE 17 EUROPE 3D DISPLAY MARKET: BY TECHNOLOGY, 2024
FIGURE 18 EUROPE 3D DISPLAY MARKET, BY TYPE, 2024
FIGURE 19 EUROPE 3D DISPLAY MARKET, BY ACCESS METHODOLOGY, 2024
FIGURE 20 EUROPE 3D DISPLAY MARKET, BY ORGANIZATION SIZE, 2024
FIGURE 21 EUROPE 3D DISPLAY MARKET, BY APPLICATION, 2024
FIGURE 22 EUROPE 3D DISPLAY MARKET, BY INDUSTRY, 2024
FIGURE 23 EUROPE 3D DISPLAY MARKET, BY SALES CHANNEL, 2024
FIGURE 24 EUROPE 3D DISPLAY MARKET: SNAPSHOT (2024)
FIGURE 25 EUROPE 3D DISPLAY MARKET: COMPANY SHARE 2024 (%)
Europe 3d Display Market, Supply Chain Analysis and Ecosystem Framework
To support market growth and help clients navigate the impact of geopolitical shifts, DBMR has integrated in-depth supply chain analysis into its Europe 3d Display Market research reports. This addition empowers clients to respond effectively to global changes affecting their industries. The supply chain analysis section includes detailed insights such as Europe 3d Display Market consumption and production by country, price trend analysis, the impact of tariffs and geopolitical developments, and import and export trends by country and HSN code. It also highlights major suppliers with data on production capacity and company profiles, as well as key importers and exporters. In addition to research, DBMR offers specialized supply chain consulting services backed by over a decade of experience, providing solutions like supplier discovery, supplier risk assessment, price trend analysis, impact evaluation of inflation and trade route changes, and comprehensive market trend analysis.
Data collection and base year analysis are done using data collection modules with large sample sizes. The stage includes obtaining market information or related data through various sources and strategies. It includes examining and planning all the data acquired from the past in advance. It likewise envelops the examination of information inconsistencies seen across different information sources. The market data is analysed and estimated using market statistical and coherent models. Also, market share analysis and key trend analysis are the major success factors in the market report. To know more, please request an analyst call or drop down your inquiry.
The key research methodology used by DBMR research team is data triangulation which involves data mining, analysis of the impact of data variables on the market and primary (industry expert) validation. Data models include Vendor Positioning Grid, Market Time Line Analysis, Market Overview and Guide, Company Positioning Grid, Patent Analysis, Pricing Analysis, Company Market Share Analysis, Standards of Measurement, Global versus Regional and Vendor Share Analysis. To know more about the research methodology, drop in an inquiry to speak to our industry experts.
Data Bridge Market Research is a leader in advanced formative research. We take pride in servicing our existing and new customers with data and analysis that match and suits their goal. The report can be customized to include price trend analysis of target brands understanding the market for additional countries (ask for the list of countries), clinical trial results data, literature review, refurbished market and product base analysis. Market analysis of target competitors can be analyzed from technology-based analysis to market portfolio strategies. We can add as many competitors that you require data about in the format and data style you are looking for. Our team of analysts can also provide you data in crude raw excel files pivot tables (Fact book) or can assist you in creating presentations from the data sets available in the report.


