
Europe And Asia Pacific Anti Money Laundering Market
Market Size in USD Billion
 USD
1.65 Billion
USD
9.28 Billion
2024
2032
USD
1.65 Billion
USD
9.28 Billion
2024
2032
| 2025 - 2032 | |
| USD 1.65 Billion | |
| USD 9.28 Billion | |
| % | |
|
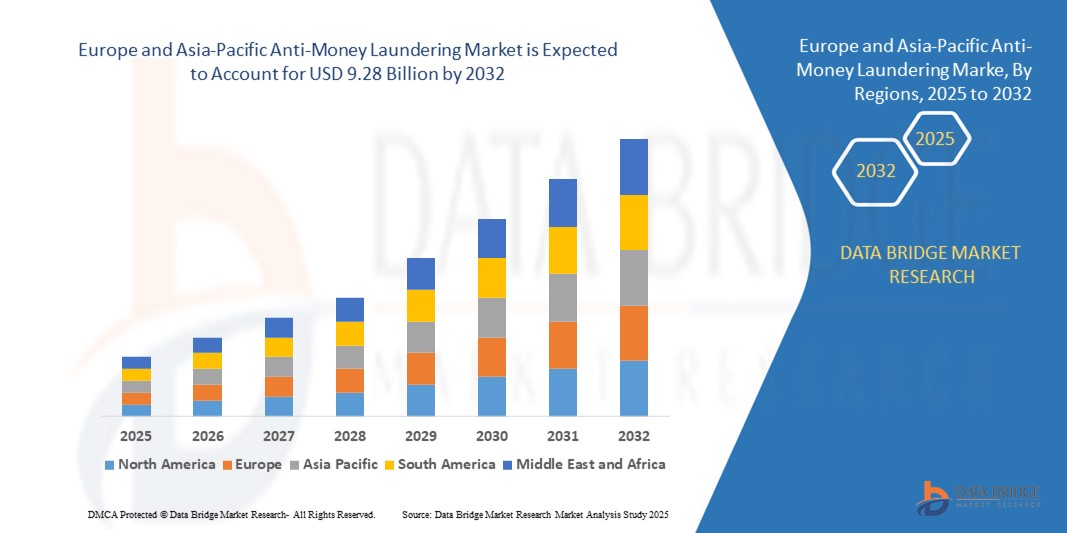
Europe and Asia-Pacific Anti-Money Laundering Market Size
- The Europe and Asia-Pacific anti-money laundering market size was valued at USD 1.65 billion in 2024 and is expected to reach USD 9.28 billion by 2032, at a CAGR of 24.1% during the forecast period
- The market growth is largely fueled by the rising incidence of financial crimes and regulatory pressure to enhance transparency, prompting financial institutions to adopt advanced anti-money laundering solutions for compliance and risk mitigation
- Furthermore, the integration of artificial intelligence, machine learning, and big data analytics into anti-money laundering systems is enabling real-time fraud detection, customer due diligence, and transaction monitoring, significantly strengthening the effectiveness of financial crime prevention strategies
Europe and Asia-Pacific Anti-Money Laundering Market Analysis
- Anti-money laundering solutions are a combination of software and services designed to detect, prevent, and report suspicious financial activities that could be linked to illicit funds or terrorism financing. These solutions assist organizations in complying with regulatory requirements while enhancing operational efficiency
- The growing emphasis on digital banking, cross-border transactions, and fintech expansion has intensified the demand for robust anti-money laundering frameworks capable of real-time risk assessment and adaptive compliance. This shift is driving widespread adoption across banks, insurance companies, and fintech firms
- Europe dominated the anti-money laundering market in 2024, due to strict regulatory mandates across the European Union and heightened enforcement by financial authorities such as the European Banking Authority (EBA) and the Financial Action Task Force (FATF)
- Asia-Pacific is expected to be the fastest growing region in the anti-money laundering market during the forecast period due to rapid digitalization in banking, expanding financial ecosystems, and increasing cross-border transactions in economies such as China, India, and Singapore
- Solution segment dominated the market with a market share of 64% in 2024, due to the growing implementation of integrated platforms that automate the entire anti-money laundering process—from risk assessment and real-time transaction screening to reporting and audit trail generation. Financial institutions are under increasing regulatory scrutiny, prompting them to invest in robust, end-to-end anti-money laundering solutions that reduce human error and operational overhead. These solutions are being enhanced with AI and machine learning capabilities to improve detection of hidden patterns and adaptive risk scoring. Banks are also favoring software with modular architecture that allows for seamless integration with existing core banking systems
Report Scope and Europe and Asia-Pacific Anti-Money Laundering Market Segmentation
|
Attributes |
Europe and Asia-Pacific Anti-Money Laundering Key Market Insights |
|
Segments Covered |
|
|
Countries Covered |
Europe
Asia-Pacific
|
|
Key Market Players |
|
|
Market Opportunities |
|
|
Value Added Data Infosets |
In addition to the market insights such as market value, growth rate, market segments, geographical coverage, market players, and market scenario, the market report curated by the Data Bridge Market Research team includes in-depth expert analysis, import/export analysis, pricing analysis, production consumption analysis, and pestle analysis. |
Europe and Asia-Pacific Anti-Money Laundering Market Trends
Increasing Adoption of Real-Time Transaction Monitoring Systems
- The anti-money laundering market is rapidly advancing as financial institutions embrace real-time transaction monitoring systems, leveraging artificial intelligence (AI), machine learning, and advanced analytics to detect suspicious activities and ensure regulatory compliance
- For instance, industry leaders such as Oracle, SAS Institute, FICO, Experian, and Ondato are developing AI and behavioral analytics-powered transaction monitoring platforms that enable instant detection of unusual patterns across vast volumes of digital payments, drastically reducing both risk and manual investigation burdens
- The proliferation of digital banking, mobile wallets, and cross-border payments drives financial firms to implement scalable, cloud-based monitoring tools capable of handling the complexity and velocity of modern transactions, especially in the wake of surging online fraud
- Integration of APIs and advanced data visualization allows for seamless connectivity between anti-money laundering systems, supporting holistic surveillance, streamlined workflows, and enhanced transparency for compliance teams
- Accelerated adoption of RegTech and compliance automation is minimizing false positives, freeing up investigative resources, and improving reporting accuracy
- Regulatory initiatives, such as those from the Financial Action Task Force (FATF), are actively promoting adoption of real-time, data-centric monitoring as new money laundering typologies emerge with digital assets and decentralized finance
Europe and Asia-Pacific Anti-Money Laundering Market Dynamics
Driver
Rise in Money Laundering Cases Across the Globe
- A global rise in financial crime, estimated to impact 2–5% of the world’s GDP (up to $2 trillion annually), is fueling urgency for more robust anti-money laundering solutions as criminals exploit digital channels, cryptocurrencies, and cross-border networks
- For instance, regulatory fines for banks involved in major money laundering incidents have soared, prompting banks and fintechs worldwide to prioritize investment in modern anti-money laundering frameworks that include automated monitoring, advanced screening, and collaborative risk intelligence sharing
- Sophistication and frequency of financial crime are heightened by the introduction of virtual assets and instant payments, increasing exposure and the demand for rapid-response systems that can adapt to emerging tactics
- High-profile global scandals and increasing penalties from regulators in the US, EU, and Asia have encouraged a compliance-first culture within financial institutions, accelerating adoption of proactive, intelligence-driven anti-money laundering platforms
- Ongoing geopolitical instability and more complex trade flows force companies to strengthen internal controls and expand anti-money laundering protocols to address new vulnerabilities and regulatory expectations
Restraint/Challenge
High Complexity of Anti-Money Laundering Solutions
- The evolving tactics of money launderers, constant regulatory change, and the need for multi-jurisdictional compliance significantly complicate anti-money laundering solution implementation and maintenance for businesses worldwide
- For instance, many organizations struggle with integrating new, AI-driven anti-money laundering technologies into legacy IT landscapes, which often leads to inefficiencies, data silos, and higher operational costs—especially for multinational institutions subject to varying customer privacy and data protection laws
- The frequency and nuance of regulatory amendments, coupled with the proliferation of digital products, increase compliance workloads and training requirements, raising both expertise and budget barriers to effective deployment
- Legacy systems, manual monitoring processes, and fragmented data management risk higher false positives, delay investigations, and consume valuable human resources in handling alerts. Balancing data privacy (such as GDPR or similar regulations) with effective transaction monitoring and regulatory reporting further intensifies the resource and technology demands on firms
- Achieving end-to-end automation, interoperability, and cross-border risk visibility remains an ongoing challenge, requiring continuous investment in innovation, security, and employee upskilling
Europe and Asia-Pacific Anti-Money Laundering Market Scope
The market is segmented on the basis of offering, function, deployment, enterprise size, and end use.
- By Offering
On the basis of offering, the anti-money laundering market is segmented into solution and services. The solution segment dominated the market revenue share of 64% in 2024 due to the growing implementation of integrated platforms that automate the entire anti-money laundering process—from risk assessment and real-time transaction screening to reporting and audit trail generation. Financial institutions are under increasing regulatory scrutiny, prompting them to invest in robust, end-to-end anti-money laundering solutions that reduce human error and operational overhead. These solutions are being enhanced with AI and machine learning capabilities to improve detection of hidden patterns and adaptive risk scoring. Banks are also favoring software with modular architecture that allows for seamless integration with existing core banking systems.
The services segment is expected to grow at the fastest rate from 2025 to 2032, driven by a growing preference for outsourcing compliance functions to third-party providers with deep regulatory expertise. The rapid pace of regulatory changes across regions is prompting institutions to seek advisory and implementation services that ensure adherence to evolving standards such as FATF, FinCEN, and AMLD. Managed services are also in demand for 24/7 monitoring and case management support, especially among small and mid-sized firms lacking internal compliance resources. Consulting services further help institutions assess gaps in their anti-money laundering frameworks, optimize legacy systems, and stay audit-ready.
- By Function
On the basis of function, the market is segmented into compliance management, customer identity management, transaction monitoring, and currency transaction reporting. The transaction monitoring segment held the largest share in 2024, fueled by the need for real-time surveillance of financial activities across accounts, channels, and geographies. With money laundering techniques becoming more sophisticated, financial institutions are investing in advanced analytics systems that can detect unusual behavior, link transactions across networks, and generate automated alerts. Regulatory expectations are also shifting from reactive compliance to proactive detection, pushing firms to adopt AI-powered solutions capable of reducing false positives and escalating high-risk cases efficiently.
The customer identity management segment is projected to grow at the fastest rate through 2032, due to rising pressure on institutions to strengthen KYC, eKYC, and CDD processes during digital onboarding. With increasing use of remote channels, institutions are adopting biometric verification, OCR-based document scanning, and facial recognition technologies to establish customer authenticity in real time. Enhanced identity management supports anti-money laundering compliance and also improves customer trust and operational efficiency. The push for continuous customer due diligence, particularly for high-net-worth and politically exposed individuals, is also driving demand for identity monitoring solutions that update risk scores dynamically.
- By Deployment
On the basis of deployment, the anti-money laundering market is segmented into cloud and on-premise. The cloud segment held the largest share in 2024, primarily due to its flexibility, rapid deployment timelines, and lower upfront infrastructure costs. As regulatory requirements evolve, cloud-based anti-money laundering solutions allow institutions to update rules engines and workflows without major disruptions. These platforms provide secure access to centralized data, support collaboration across compliance teams, and facilitate integration with third-party identity verification, risk scoring, and sanctions screening services. Cloud deployment is also enabling advanced analytics and AI applications that require large datasets and computing power, which would otherwise strain on-premise infrastructure.
The on-premise segment, while traditional, remains significant among financial institutions that require complete control over data storage, processing, and access. This deployment type is particularly relevant for banks operating in jurisdictions with strict data residency laws or internal security mandates that prohibit off-site data hosting. Organizations with legacy IT ecosystems often find it more feasible to integrate anti-money laundering solutions on-premise, especially when dealing with highly customized risk rules or proprietary transaction data. Although the adoption rate is slower, some sectors, such as government-linked financial entities, continue to favor this model for compliance assurance and reduced third-party risk.
- By Enterprise Size
On the basis of enterprise size, the anti-money laundering market is segmented into large enterprises and small & medium enterprises (SMEs). The large enterprises segment captured the dominant market share in 2024, owing to their expansive customer base, international operations, and high exposure to complex financial crime risks. These organizations operate in multiple regulatory environments, necessitating comprehensive anti-money laundering frameworks that include multi-language support, multi-jurisdictional compliance, and scalable analytics infrastructure. Large banks and financial firms typically deploy holistic platforms combining real-time monitoring, case management, and regulatory reporting into one unified interface. They also leverage AI to automate repetitive compliance tasks and improve investigative accuracy.
The SMEs segment is expected to register the fastest CAGR from 2025 to 2032, driven by the increasing availability of cloud-based anti-money laundering solutions that are affordable, easy to deploy, and tailored to the needs of smaller firms. Regulatory bodies are expanding the scope of anti-money laundering obligations to cover smaller institutions and fintech startups, prompting them to adopt compliance frameworks proactively. Vendors are responding with lightweight, subscription-based tools that provide core anti-money laundering functionalities—such as KYC, sanctions screening, and suspicious activity detection—without requiring extensive IT infrastructure. The growing ecosystem of RegTech startups is further enabling SMEs to meet compliance standards at reduced cost.
- By End Use
On the basis of end use, the market is segmented into banks & financial institutions and insurance providers. The banks & financial institutions segment held the largest market share in 2024, as they remain the most scrutinized sector for anti-money laundering compliance worldwide. These institutions face mounting risks from cross-border transactions, correspondent banking relationships, and increasingly complex customer profiles. As a result, they are investing in advanced anti-money laundering suites with capabilities such as behavioral analytics, transaction graphing, and multi-channel data ingestion. Compliance teams in banks require real-time dashboards, automated STR (Suspicious Transaction Report) filing, and centralized case management tools to meet strict audit requirements and reporting timelines.
The insurance providers segment is projected to witness the fastest growth over the forecast period, as regulatory authorities expand anti-money laundering oversight to cover sectors previously considered lower risk. High-value insurance products such as life insurance, annuities, and investment-linked policies are now recognized as potential vehicles for laundering illicit funds. Insurance companies are therefore adopting anti-money laundering systems to assess customer risk during onboarding, monitor large premium payments, and ensure traceability of fund sources. The digitization of the insurance sector, combined with rising use of intermediaries and brokers, is further amplifying the need for automated anti-money laundering tools tailored to the unique transaction patterns of insurance products.
Europe and Asia-Pacific Anti-Money Laundering Market Regional Analysis
- Europe dominated the anti-money laundering market with the largest revenue share in 2024, driven by strict regulatory mandates across the European Union and heightened enforcement by financial authorities such as the European Banking Authority (EBA) and the Financial Action Task Force (FATF)
- Financial institutions in the region are heavily investing in advanced anti-money laundering technologies to comply with directives such as AMLD6 and GDPR, which demand robust identity verification, transaction monitoring, and reporting capabilities
- The presence of a mature banking infrastructure, widespread digitalization, and strong political focus on combating financial crime have led to increased adoption of automated compliance platforms and AI-based monitoring tools across financial institutions
Germany Anti-Money Laundering Market Insight
The Germany anti-money laundering market is projected to grow at a steady pace, supported by rigorous national regulations and close regulatory alignment with EU frameworks. German banks and insurance firms are proactively upgrading legacy anti-money laundering systems to address the evolving complexity of financial crime. The country’s emphasis on data protection and secure financial operations is encouraging the deployment of localized, compliance-focused anti-money laundering solutions. In addition, regulatory bodies are pushing for greater use of artificial intelligence and real-time analytics, further boosting the anti-money laundering technology ecosystem.
U.K. Anti-Money Laundering Market Insight
The U.K. anti-money laundering market accounted for the largest share within Europe in 2024, backed by strong regulatory enforcement and a dynamic fintech sector. With the introduction of the Economic Crime and Corporate Transparency Bill and expansion of anti-money laundering obligations across digital asset platforms, U.K. firms are strengthening their compliance frameworks. Financial institutions are actively adopting AI-driven solutions, eKYC tools, and real-time risk monitoring platforms to detect suspicious transactions and minimize compliance breaches. The post-Brexit focus on maintaining global financial integrity also reinforces anti-money laundering technology investments.
Asia-Pacific Anti-Money Laundering Market Analysis
The Asia-Pacific anti-money laundering market is poised to grow at the fastest CAGR from 2025 to 2032, driven by rapid digitalization in banking, expanding financial ecosystems, and increasing cross-border transactions in economies such as China, India, and Singapore. The rising volume of online payments, mobile wallets, and digital lending is elevating money laundering risks, prompting regional governments and central banks to enforce stricter compliance standards and improve surveillance capabilities. Growing investments in anti-money laundering solutions by both established banks and emerging fintech players, combined with regulatory reforms and regional collaborations such as the Asia/Pacific Group on Money Laundering (APG), are accelerating adoption across the region
China Anti-Money Laundering Market Insight
China accounted for the largest market share in Asia-Pacific in 2024, driven by government crackdowns on financial crimes and a highly digitized economy. Chinese financial institutions are increasingly implementing AI-based transaction monitoring and customer risk profiling to prevent illicit fund flows. Regulatory bodies such as the People’s Bank of China are mandating stricter compliance protocols for traditional banks, digital lenders, and cross-border payment providers. China’s robust domestic technology sector is also facilitating the development and deployment of localized anti-money laundering solutions.
India Anti-Money Laundering Market Insight
India’s anti-money laundering market is expanding rapidly, fueled by increased vigilance from regulatory agencies such as the Reserve Bank of India (RBI) and the Financial Intelligence Unit (FIU-IND). As digital transactions and financial inclusion rise across the country, banks and NBFCs are adopting scalable anti-money laundering platforms to meet regulatory requirements and curb fraudulent activity. The government’s initiatives to strengthen KYC norms, reduce cash-based transactions, and integrate real-time monitoring systems are creating strong demand for compliance technologies, particularly among mid-sized banks and digital financial service providers.
Europe and Asia-Pacific Anti-Money Laundering Market Share
The anti-money laundering industry is primarily led by well-established companies, including:
- Experian Information Solutions, Inc. (U.S.)
- SAS Institute Inc. (U.S.)
- Microsoft (U.S.)
- NICE (Israel)
- Tata Consultancy Services Limited (India)
- Open Text Corporation (Canada)
- BAE Systems (U.K.)
- ACI Worldwide (U.S.)
- Fiserv, Inc. (U.S.)
- Cognizant (U.S.)
- Trulioo (Canada)
- DIXTIOR (Portugal)
- WorkFusion, Inc. (U.S.)
- FIS (U.S.)
- Temenos Headquarters SA (Switzerland)
- Intel Corporation (U.S.)
- IBM Corporation (U.S.)
- Oracle (U.S.)
- Accenture (Ireland)
- FICO (U.S.)
- Comarch SA (Poland)
- Wolters Kluwer N.V. (Netherlands)
- LexisNexis Risk Solutions (U.S.)
- Jumio (U.S.)
- SAIGroup (U.S.)
- GB Group plc (U.K.)
- ComplyAdvantage (U.K.)
- SAP SE (Germany)
Latest Developments in Europe and Asia-Pacific Anti-Money Laundering Market
- In July 2023, ComplyAdvantage launched a new Know Your Business (KYB) solution, significantly enhancing the ability of financial institutions to manage third-party risk exposure. This development marks a critical step in streamlining due diligence processes, allowing companies to onboard business clients more rapidly while maintaining compliance integrity. By automating key KYB tasks, the solution empowers firms to expand their customer base efficiently without compromising on risk oversight—ultimately strengthening the position of ComplyAdvantage in the anti-money laundering technology landscape
- In June 2023, ComplyAdvantage introduced Fraud Detection, a machine learning–driven solution designed to accurately identify and prevent fraudulent transaction activities. The use of AI and pattern recognition in this tool enhances real-time risk detection, enabling financial institutions to react quickly to suspicious behaviors. This advancement further expands ComplyAdvantage’s anti-financial crime portfolio, positioning the company as a comprehensive provider of anti-money laundering and fraud prevention solutions, and reinforcing the market trend toward integrated, AI-powered compliance systems
- In May 2023, FICO and Teradata unveiled jointly developed advanced analytics solutions aimed at real-time payment fraud detection, insurance claims management, and supply chain optimization. This strategic collaboration reduced deployment time for industry-specific solutions, providing joint customers with faster access to risk mitigation and operational improvements. The partnership enhances innovation in the AI-driven compliance space, delivering benefits such as reduced fraud-related losses, improved profitability, and greater customer satisfaction—thereby strengthening both companies' competitive edge in the anti-money laundering and fraud analytics market
- In June 2021, Accenture completed the acquisition of Exton Consulting, bolstering its consulting capabilities across the European financial services sector. This move enabled Accenture to scale its transformation services, particularly in regulatory compliance and digital finance. The acquisition supported clients in navigating complex anti-money laundering regulations more effectively and accelerated time-to-value for transformation projects. As a result, it reinforced Accenture’s leadership in the European market and expanded its influence in shaping anti-money laundering and financial compliance strategies across banks and financial institutions
- In June 2021, Comarch SA entered into a strategic partnership with Mashreq to digitize wealth management services, aiming to elevate client experience through enhanced digital tools. This collaboration diversified both companies' service portfolios and also indirectly contributed to strengthening compliance infrastructure by integrating more secure, transparent, and customer-centric solutions. By modernizing wealth management platforms, the partnership supported better risk visibility and customer verification processes, which are critical components in the broader anti-money laundering and financial crime prevention ecosystem
SKU-

- Interactive Data Analysis Dashboard
- Company Analysis Dashboard for high growth potential opportunities
- Research Analyst Access for customization & queries
- Competitor Analysis with Interactive dashboard
- Latest News, Updates & Trend analysis
- Harness the Power of Benchmark Analysis for Comprehensive Competitor Tracking
Data collection and base year analysis are done using data collection modules with large sample sizes. The stage includes obtaining market information or related data through various sources and strategies. It includes examining and planning all the data acquired from the past in advance. It likewise envelops the examination of information inconsistencies seen across different information sources. The market data is analysed and estimated using market statistical and coherent models. Also, market share analysis and key trend analysis are the major success factors in the market report. To know more, please request an analyst call or drop down your inquiry.
The key research methodology used by DBMR research team is data triangulation which involves data mining, analysis of the impact of data variables on the market and primary (industry expert) validation. Data models include Vendor Positioning Grid, Market Time Line Analysis, Market Overview and Guide, Company Positioning Grid, Patent Analysis, Pricing Analysis, Company Market Share Analysis, Standards of Measurement, Global versus Regional and Vendor Share Analysis. To know more about the research methodology, drop in an inquiry to speak to our industry experts.
Data Bridge Market Research is a leader in advanced formative research. We take pride in servicing our existing and new customers with data and analysis that match and suits their goal. The report can be customized to include price trend analysis of target brands understanding the market for additional countries (ask for the list of countries), clinical trial results data, literature review, refurbished market and product base analysis. Market analysis of target competitors can be analyzed from technology-based analysis to market portfolio strategies. We can add as many competitors that you require data about in the format and data style you are looking for. Our team of analysts can also provide you data in crude raw excel files pivot tables (Fact book) or can assist you in creating presentations from the data sets available in the report.


