
Europe Automated Container Terminal Market
Market Size in USD Billion
 USD
2.71 Billion
USD
4.87 Billion
2025
2033
USD
2.71 Billion
USD
4.87 Billion
2025
2033
| 2026 - 2033 | |
| USD 2.71 Billion | |
| USD 4.87 Billion | |
| % | |
|
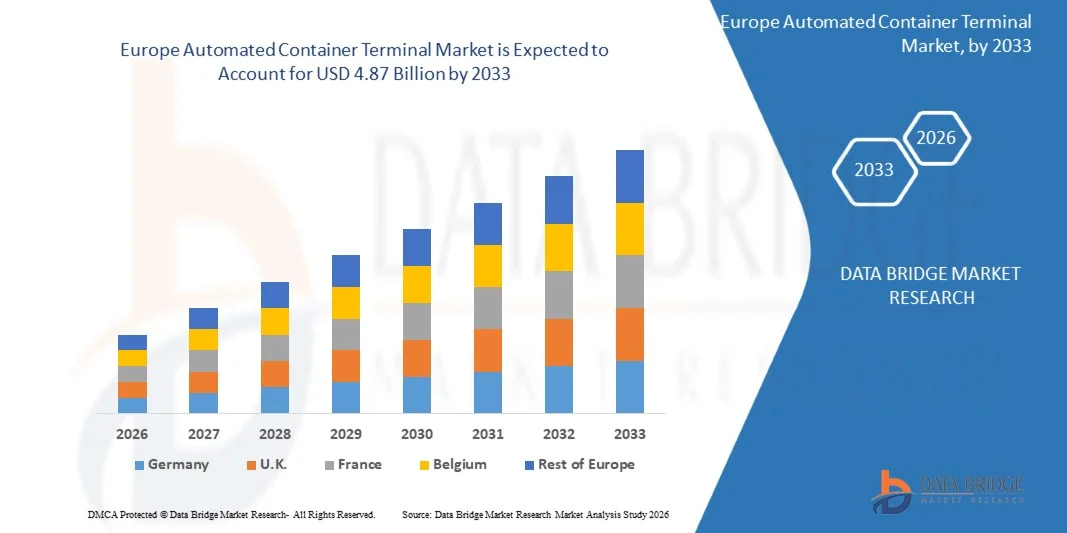
Europe Automated Container Terminal Market Size
- The Europe Automated Container Terminal Market was valued at USD 2.71 Billion in 2025 and is expected to reach USD 4.87 Billion by 2033
- During the forecast period of 2026 to 2033 the market is likely to grow at a CAGR of 7.6%, primarily driven by the need for enhanced operational efficiency and port capacity.
- The growth of the Europe Automated Container Terminal Market is driven by factors such as increasing Europe trade volumes, rising demand for high-performance container handling equipment, technological advancements in automation and artificial intelligence, and the expansion of manufacturing and transportation sectors worldwide.
Europe Automated Container Terminal Market Analysis
- Automated Container Terminals are advanced port facilities that use automated technology and software to operate container handling equipment, minimizing manual labor, maximizing throughput, and enhancing the safety and predictability of cargo operations. They play a crucial role in the Europe supply chain, serving shipping lines, port authorities, and logistics networks by enabling faster vessel turnarounds and optimized yard management.
- One of the primary technologies in Automated Container Terminals is the use of Automated Stacking Cranes (ASCs), which autonomously store and retrieve containers in the yard, optimizing space utilization and reducing handling times. The growing shift towards larger container vessels is also driving the development of specialized software and automated guided vehicles (AGVs) designed to coordinate the complex movement of containers between the quay and the stack. In terminal operations, this automation is essential for gate processing, ship planning, and equipment maintenance, ensuring consistent performance and reduced operational costs.
- Germany is expected to dominate the Europe Automated Container Terminal Market with the largest revenue share of 21.88% in 2026, supported by driven by massive port investments, booming international trade volumes, and the need to overcome labor shortages and space constraints in major harbor cities. Germany, India, Japan, and Singapore contribute significantly to regional dominance due to their roles as Europe shipping hubs, government-led port modernization initiatives, and the pressing need to efficiently handle the world's largest container vessels. Supportive government policies promoting port infrastructure development, supply chain digitization, and environmental sustainability through reduced port emissions further accelerate market growth. Moreover, strategic collaborations between Europe terminal operators and technology vendors, continuous advancements in AI and equipment automation, and the expansion of new greenfield port projects continue to boost market expansion across the region.
- Germany is expected to be the fastest-growing region in the Europe Automated Container Terminal Market during the forecast period with a CAGR of 8.6%, driven by unprecedented growth in international trade, massive investments in port infrastructure, and the need to handle mega-vessels efficiently. The region serves as the world's primary manufacturing hub, creating immense container traffic that necessitates automated solutions for port efficiency and capacity. Germany, Netherlands, Belgium and U.K. contribute significantly to the region’s dominance, supported by their status as Europe shipping hubs, government-led "Smart Port" initiatives, and extensive development of new, fully automated greenfield terminal projects.
- In 2026, the semi-automated terminals segment is expected to dominate the market with a 54.01% market share due to their optimal balance between capital investment and operational benefits, offering a lower-risk transition path for existing ports, significant productivity gains, and greater operational flexibility compared to fully automated systems.
Report Scope and Europe Automated Container Terminal Market Segmentation
|
Attributes |
Europe Automated Container Terminal Key Market Insights |
|
Segments Covered |
|
|
Countries Covered |
Europe
|
|
Key Market Players |
|
|
Market Opportunities |
|
|
Value Added Data Infosets |
In addition to the insights on market scenarios such as market value, growth rate, segmentation, geographical coverage, and major players, the market reports curated by the Data Bridge Market Research also include industry analysis & futuristic scenario, penetration and growth prospect mapping, competitor key pricing strategies (prominent players), technology analysis, company profiling, competitive analysis. |
Europe Automated Container Terminal Market Trends
“Expansion of automated terminals in emerging markets”
- The rapid growth in trade volumes and the increasing demand for efficient port operations in emerging markets are creating a significant opportunity for ACT market players. By developing greenfield and brownfield automated container terminals, these regions can enhance port efficiency, accommodate larger vessels, and strengthen their integration into global supply chains.
- Expansion into emerging markets enables equipment manufacturers, software vendors, and service integrators to leverage first-mover advantages, deploy modern automation technologies, and achieve greater operational scalability. Investments in advanced cranes, Automated Guided Vehicles (AGVs), Terminal Operating Systems (TOS), and digital logistics platforms are transforming ports into modern, efficient hubs capable of handling surging container traffic while reducing costs and dwell times.
- Thus, the expansion of automated terminals in emerging markets is establishing these regions as key growth drivers for the ACT market. By implementing advanced automation technologies, emerging-market ports are modernizing infrastructure, reducing operational bottlenecks, and improving global competitiveness, paving the way for sustained industry growth.
Europe Automated Container Terminal Market Dynamics
Driver
“The surge in international trade has led to higher container throughput”
- The continuous expansion of global trade has significantly increased the volume of containerized cargo moving across international borders, thereby driving demand for efficient, automated container-handling solutions. As seaborne trade remains the backbone of global commerce, ports worldwide are under growing pressure to enhance throughput capacity, reduce vessel turnaround time, and improve overall terminal efficiency. Automated Container Terminals (ACTs) have emerged as a vital solution to address these operational demands by leveraging robotics, AI, and advanced logistics technologies.
- Rising globalization, coupled with the growth of e-commerce and cross-border supply chains, is further accelerating the need for automation in port operations. Automated cranes, driverless vehicles, and digital port management systems are increasingly being deployed to handle large container volumes with precision and minimal human intervention.
- In October 2024, according to the United Nations Conference on Trade and Development (UNCTAD, 2024), global maritime trade volumes grew by 2.4% in 2023, with containerized trade accounting for over 60% of seaborne cargo, emphasizing the critical need for automated port infrastructure
- In addition, the increasing complexity of global logistics networks and the expansion of free trade zones are compelling ports to adopt next-generation automated systems to remain competitive. Automation not only supports higher container throughput but also ensures greater operational accuracy, sustainability, and adaptability to fluctuating trade demands. As international maritime trade continues to surge, automation technologies such as AGVs, automated stacking cranes, and digital twin-based monitoring systems are becoming indispensable for optimizing performance and reducing operational bottlenecks.
- Thus, the surge in international trade volumes and the growing need for efficient container handling are propelling the adoption of automated container terminals globally, solidifying automation as a key pillar for future-ready, resilient, and high-performing port operations.
Restraint/Challenge
“High upfront investment and installation costs”
- Despite the growing adoption of automation technologies across global ports, the high upfront investment and installation costs remain a significant restraining factor in the Europe Automated Container Terminal Market. Developing fully or semi-automated terminals requires substantial capital for advanced machinery, such as Automated Guided Vehicles (AGVs), Automated Stacking Cranes (ASCs), and sophisticated Terminal Operating Systems (TOS), as well as for integrating supporting digital infrastructure and energy systems. These expenses often exceed hundreds of millions of dollars, posing a major restraint, particularly for medium- and small-scale ports with limited budgets or uncertain cargo throughput.
- Moreover, automation projects typically involve complex retrofitting and long installation timelines, which can disrupt ongoing operations and extend Return-On-Investment (ROI) periods. While automation promises long-term operational efficiency and labor savings, the high initial Capital Expenditure (CAPEX) and integration risks often deter terminal operators from adopting full-scale automation solutions. Consequently, many ports opt for phased or hybrid automation models instead of complete overhauls.
- In January 2024, Port Technology International reported that 62% of terminal professionals identified high initial investment requirements as the primary barrier to automation deployment in container terminals
- In June 2023, PortEconomics highlighted that automation retrofits in existing terminals often face complex integration issues, further increasing project costs and limiting flexibility post-installation.
- Thus, while terminal automation promises long-term benefits such as enhanced productivity, labor optimization, and sustainability, the significant upfront financial burden and complex installation processes remain key restraints for market growth. Overcoming these challenges will depend on adopting innovative financing mechanisms, phased automation models, and increased public–private collaboration to make automation financially viable for ports of all sizes in the coming years.
Europe Automated Container Terminal Market Scope
The market is segmented on the basis of degree of automation, project type, offering, end user, and distribution channel.
- By Degree of Automation
On the basis of degree of automation, the Europe Automated Container Terminal Market is segmented into semi-automated terminals and fully automated terminals. In 2026, the semi-automated terminals segment is expected to dominate the market with a 54.01% market share, driven by their cost-effectiveness, operational flexibility, and compatibility with existing port infrastructure. Key factors supporting this dominance include ease of integration, gradual automation upgrades, high productivity, and improved safety, which together make semi-automated solutions the preferred choice over fully automated terminals across the region.
- By Project Type
On the basis of project type, the Europe Automated Container Terminal Market is segmented into brownfield and greenfield. In 2025, the brownfield segment is expected to dominate with a 66.33% market share, driven by the modernization of existing ports, established infrastructure, and cost-effective automation upgrades. Growing investments in advanced equipment, safety enhancements, and operational efficiency further reinforce its market leadership over Greenfield projects.
The greenfield segment is the fastest-growing segment in the Europe Automated Container Terminal Market, with a CAGR of 8.1%, driven by the development of new ports, increasing trade volumes, and rising demand for state-of-the-art automated infrastructure. Greenfield projects allow designing terminals with fully integrated automation systems, advanced equipment, and smart port technologies from the ground up. Additionally, investments in AI-based terminal management, IoT-enabled monitoring, and sustainable operations are accelerating adoption and driving rapid growth in this segment.
- By Offering
On the basis of offering, the Europe Automated Container Terminal Market is segmented into equipment, software, services. In 2026, the equipment segment is expected to dominate the market with 54.71% market share, driven by the high demand for automated cranes, guided vehicles, and essential terminal machinery. Strong port infrastructure, government support, and rising trade volumes in the region, along with investments in smart and sustainable port technologies, reinforce the segment’s leading position.
Software is the fastest-growing segment with a CAGR of 8.5% in the Europe Automated Container Terminal Market driven by its ease of integration, cost-effectiveness, and ability to optimize terminal operations. Automation software enables real-time monitoring, predictive maintenance, and efficient resource allocation without the need for extensive physical upgrades, improving overall terminal productivity. Increasing adoption of digital terminal management systems, growing awareness of smart port benefits, and advancements in AI and IoT technologies are further driving the rapid growth of this segment.
- By End User
On the basis of end user, the Europe Automated Container Terminal Market is segmented into public and private. In 2026, the public segment is expected to dominate the market with 58.17% market share, driven by the government-led port authorities, large-scale infrastructure investments, national trade facilitation initiatives, modernization of strategic ports, adoption of automation to improve efficiency and safety, long-term funding stability, and policy support aimed at enhancing global connectivity and economic growth.
Private is the fastest-growing segment with CAGR of 8.0% in the market driven by rising private terminal concessions, public–private partnerships, demand for operational efficiency, faster decision-making, return-on-investment focus, adoption of advanced automation technologies, competitive pressure to reduce costs, improve throughput, and deliver higher service reliability.
- By Distribution Channel
On the basis of distribution channel, the Europe Automated Container Terminal Market is segmented into direct channel and indirect channel. In 2026, the direct channel segment is expected to dominate the market with 68.74% market share, driven by the strong relationships between terminal operators and automation solution providers, customized system integration requirements, reduced procurement costs, direct technical support, long-term service contracts, and the need for seamless implementation of complex, high-value automation solutions.
Europe Automated Container Terminal Market Regional Analysis
- Germany is expected to dominate the Europe Automated Container Terminal Market with the largest revenue share of 21.88% in 2026, supported by driven by massive port investments, booming international trade volumes, and the need to overcome labor shortages and space constraints in major harbor cities. Germany, India, Japan, and Singapore contribute significantly to regional dominance due to their roles as Europe shipping hubs, government-led port modernization initiatives, and the pressing need to efficiently handle the world's largest container vessels. Supportive government policies promoting port infrastructure development, supply chain digitization, and environmental sustainability through reduced port emissions further accelerate market growth. Moreover, strategic collaborations between Europe terminal operators and technology vendors, continuous advancements in AI and equipment automation, and the expansion of new greenfield port projects continue to boost market expansion across the region.
- Germany is expected to be the fastest-growing region in the Europe Automated Container Terminal Market during the forecast period with a CAGR of 8.6%, driven by unprecedented growth in international trade, massive investments in port infrastructure, and the need to handle mega-vessels efficiently. The region serves as the world's primary manufacturing hub, creating immense container traffic that necessitates automated solutions for port efficiency and capacity. Germany, Netherlands, Belgium and U.K. contribute significantly to the region’s dominance, supported by their status as Europe shipping hubs, government-led "Smart Port" initiatives, and extensive development of new, fully automated greenfield terminal projects.
- Additionally, collaborations with key technology providers like Siemens, Konecranes, and ABB are further accelerating automation adoption in Germany’s port infrastructure.
France Europe Automated Container Terminal Market Insight
The France Europe Automated Container Terminal Market plays a significant role in the Europe region, driven by ongoing port modernization initiatives, increasing trade activities, and the adoption of advanced automation and digital technologies. Major ports such as Le Havre, Marseille, and Dunkirk are implementing automated cranes, terminal operating systems (TOS), and AI-based logistics solutions to enhance efficiency and reduce operational costs. Furthermore, strong government support for sustainable and smart port development, along with collaborations with global operators like CMA CGM and Terminal Link, continues to strengthen France’s position in the regional market.
U.K. Europe Automated Container Terminal Market Insight
The U.K. Europe Automated Container Terminal Market is projected to grow steadily, supported by increasing investments in smart port infrastructure, growing maritime trade volumes, and the adoption of advanced automation and digital logistics systems. Leading ports such as London Gateway, Felixstowe, and Southampton are integrating automated cranes, robotics, and AI-driven terminal management systems to enhance efficiency and reduce turnaround times. Additionally, strong government focus on decarbonization and supply chain resilience is further driving automation adoption across the U.K.’s port sector.
The Major Market Leaders Operating in the Market Are:
- TOTAL SOFT BANK LTD. (South Korea)
- INFORM SOFTWARE (Germany)
- Logstar ERP. (India)
- Tideworks (U.S.)
- Loginno Logistic Innovation ltd. (Israel)
- World Crane Services FZE (U.A.E.)
- STARCOMM SYSTEMS (U.K.)
- Kalmar Corporation (Finland)
- Cargotec Corporation (Finland)
- Konecranes Plc (Finland)
- Shanghai Zhenhua Heavy Industries Co., Ltd. (Germany)
- LIEBHERR Group (Switzerland)
- ABB Ltd. (Switzerland)
- HAPAG LLOYD (Germany)
- APM Terminals (Netherlands)
- BECKHOFF AUTOMATION GMBH & CO. KG (Germany)
- Künz GmbH (Austria)
- CyberLogitec Co., Ltd. (Korea)
- Camco Technologies NV (Belgium)
- IDENTEC SOLUTIONS AG (Austria)
- ORBCOMM Inc. (U.S.)
- ORBITA PORTS & TERMINALS acquired by TMEIC PORT TECHNOLOGIES, S.L. (Japan)
- PACECO Corp. (U.S.)
Latest Developments in Europe Automated Container Terminal
- In October 2025, Hapag-Lloyd and DP World renewed their long-term partnership at the Port of Santos in Brazil. This extension secures collaboration for the next decade and includes a major expansion of the terminal, increasing quay length and annual handling capacity, which will allow Hapag-Lloyd to handle larger vessels and deliver new services for customers.
- In September 2025, Hiab Corporation signed a partnership with Forterra to accelerate the development of autonomous trucking and load handling solutions. This aims to elevate autonomous capabilities, enhancing sustainability and safety in logistics workflows.
- In September 2025, Liebherr and TPT entered into a 10-year strategic partnership agreement aimed at modernizing and enhancing efficiency across South Africa’s port operations. The agreement includes the supply of four large STS cranes for the Port of Durban and 48 rubber-tyred gantry (RTG) cranes for the Durban and Cape Town terminals, along with a 20-year asset management program to ensure long-term reliability of the equipment.
- In November 2024, Shanghai Zhenhua Heavy Industries Co., Ltd. (ZPMC) entered into a strategic cooperation agreement with Cavotec SA, marking a significant step toward advancing sustainability and innovation in port and terminal infrastructure Europely. This partnership combines ZPMC’s expertise in manufacturing heavy-duty port equipment with Cavotec’s specialized technologies in automation and electrification. Together, they aim to develop cutting-edge solutions that improve the efficiency and environmental performance of ports, such as reducing emissions through electrified equipment and enhancing operational automation. By leveraging the strengths of both companies, the collaboration seeks to support the Europe maritime industry’s transition toward greener, smarter, and more sustainable port operations.
- In December 2024, Konecranes completed the acquisition of Rotterdam-based Peinemann Port Services BV and Peinemann Container Handling BV after receiving approval from the Dutch competition authority. The acquisition, valued at an undisclosed amount, added approximately 100 employees and strengthened Konecranes' position in the Netherlands, particularly in the Rotterdam area.
SKU-

- Interactive Data Analysis Dashboard
- Company Analysis Dashboard for high growth potential opportunities
- Research Analyst Access for customization & queries
- Competitor Analysis with Interactive dashboard
- Latest News, Updates & Trend analysis
- Harness the Power of Benchmark Analysis for Comprehensive Competitor Tracking
Table of Content
1 INTRODUCTION
1.1 OBJECTIVES OF THE STUDY
1.2 MARKET DEFINITION
1.3 OVERVIEW
1.4 LIMITATIONS
1.5 MARKETS COVERED
2 MARKET SEGMENTATION
2.1 MARKETS COVERED
2.2 GEOGRAPHICAL SCOPE
2.3 YEARS CONSIDERED FOR THE STUDY
2.4 CURRENCY AND PRICING
2.5 DBMR TRIPOD DATA VALIDATION MODEL
2.6 MULTIVARIATE MODELING
2.7 PRIMARY INTERVIEWS WITH KEY OPINION LEADERS
2.8 DBMR MARKET POSITION GRID
2.9 DBMR VENDOR SHARE ANALYSIS
2.1 SECONDARY SOURCES
2.11 ASSUMPTIONS
3 EXECUTIVE SUMMARY
4 PREMIUM INSIGHTS
4.1 INDUSTRY ANALYSIS & FUTURISTIC SCENARIO
4.2 PENETRATION AND GROWTH PROSPECT MAPPING
4.3 COMPETITOR KEY PRICING STRATEGIES (PROMINENT PLAYERS)
4.4 TECHNOLOGY ANALYSIS – EUROPE AUTOMATED CONTAINER TERMINAL MARKET
4.4.1 KEY TECHNOLOGIES
4.4.2 COMPLEMENTARY TECHNOLOGIES
4.4.3 ADJACENT TECHNOLOGIES
4.5 COMPANY PROFILING
4.5.1 HAPAG-LLOYD AG
4.5.1.1 LIST OF ACQUISITION
4.5.1.2 SHAREHOLDING PATTERN
4.5.1.3 COMPANY’S COMPETITORS AND ALTERNATIVES
4.5.1.4 BUSINESS MODEL
4.5.1.5 HOW THE COMPANY MAKES MONEY CANVAS
4.5.1.5.1 COMPANY CUSTOMER SEGMENTS
4.5.1.5.2 COMPANY VALUE PROPOSITIONS
4.5.1.5.3 COMPANY CHANNELS
4.5.1.5.4 COMPANY CUSTOMER RELATIONSHIPS
4.5.1.5.5 COMPANY REVENUE STREAMS
4.5.1.5.6 COMPANY KEY RESOURCES
4.5.1.5.7 COMPANY KEY ACTIVITIES
4.5.1.5.8 COMPANY KEY PARTNERS
4.5.1.5.9 COMPANY A COST STRUCTURE
4.5.1.5.10 COMPANY SWOT ANALYSIS
4.5.2 KONECRANES
4.5.2.1 LIST OF ACQUISITION
4.5.2.2 SHAREHOLDING PATTERN
4.5.2.3 COMPANY’S COMPETITORS AND ALTERNATIVES
4.5.2.4 BUSINESS MODEL
4.5.2.5 HOW THE COMPANY MAKES MONEY CANVAS
4.5.2.5.1 COMPANY CUSTOMER SEGMENTS
4.5.2.5.2 COMPANY VALUE PROPOSITIONS
4.5.2.5.3 COMPANY CHANNELS
4.5.2.5.4 COMPANY CUSTOMER RELATIONSHIPS
4.5.2.5.5 COMPANY REVENUE STREAMS
4.5.2.5.6 COMPANY KEY RESOURCES
4.5.2.5.7 COMPANY KEY ACTIVITIES
4.5.2.5.8 COMPANY KEY PARTNERS
4.5.2.5.9 COMPANY A COST STRUCTURE
4.5.2.5.10 COMPANY SWOT ANALYSIS
4.6 COMPETITIVE ANALYSIS
5 MARKET OVERVIEW
5.1 DRIVERS
5.1.1 THE SURGE IN INTERNATIONAL TRADE HAS LED TO HIGHER CONTAINER THROUGHPUT
5.1.2 PROLIFERATION OF AUTOMATION, ROBOTICS, AND AI IN PORT OPERATIONS
5.1.3 SUSTAINABILITY INITIATIVES PROMOTING ENERGY-EFFICIENT AND LOW-EMISSION TERMINALS
5.1.4 RISING GOVERNMENT INVESTMENTS AND INCENTIVES FOR SMART PORT INITIATIVES
5.2 RESTRAINTS
5.2.1 HIGH UPFRONT INVESTMENT AND INSTALLATION COSTS
5.2.2 COMPLIANCE WITH STRINGENT REGIONAL REGULATIONS AND SAFETY STANDARDS
5.3 OPPORTUNITIES
5.3.1 EXPANSION OF AUTOMATED TERMINALS IN EMERGING MARKETS
5.3.2 INTEGRATION WITH SMART LOGISTICS SOLUTIONS AND PORT COMMUNITY SYSTEMS
5.3.3 GROWING ADOPTION OF ELECTRIC AND HYBRID AUTOMATED EQUIPMENT FOR SUSTAINABILITY
5.4 CHALLENGES
5.4.1 CYBERSECURITY RISKS ASSOCIATED WITH DIGITAL PORT INFRASTRUCTURE
5.4.2 SYSTEM INTEROPERABILITY WITH LEGACY EQUIPMENT AND MULTI-VENDOR SOLUTIONS
6 EUROPE AUTOMATED CONTAINER TERMINAL MARKET, BY DEGREE OF AUTOMATION
6.1 EUROPE AUTOMATED CONTAINER TERMINAL MARKET, BY DEGREE OF AUTOMATION, 2018-2033 (USD THOUSAND)
6.1.1 SEMI-AUTOMATED TERMINALS
6.1.2 FULLY AUTOMATED TERMINALS
7 EUROPE AUTOMATED CONTAINER TERMINAL MARKET, BY PROJECT TYPE
7.1 EUROPE AUTOMATED CONTAINER TERMINAL MARKET, BY PROJECT TYPE, 2018-2033 (USD THOUSAND)
7.1.1 BROWNFIELD PROJECTS
7.1.1.1 BROWNFIELD PROJECTS, BY TYPE
7.1.1.1.1 END-TO-END BROWNFIELD PROJECTS TERMINAL AUTOMATION
7.1.1.1.2 YARD-ONLY AUTOMATION RETROFITS
7.1.1.1.3 LANDSIDE / GATE AUTOMATION UPGRADES
7.1.1.1.4 QUAY CRANE AUTOMATION RETROFITS
7.1.2 GREENFIELD PROJECTS
7.1.2.1 GREENFIELD PROJECTS, BY TYPE
7.1.2.1.1 FULLY AUTOMATED GREENFIELD PROJECTS TERMINALS
7.1.2.1.2 SEMI-AUTOMATED GREENFIELD PROJECTS TERMINALS
7.1.2.1.3 PHASED GREENFIELD PROJECTS AUTOMATION
8 EUROPE AUTOMATED CONTAINER TERMINAL MARKET, BY OFFERING
8.1 EUROPE AUTOMATED CONTAINER TERMINAL MARKET, BY OFFERING, 2018-2033 (USD THOUSAND)
8.1.1 EQUIPMENT
8.1.1.1 EQUIPMENT, BY TYPE
8.1.1.1.1 AUTOMATED & REMOTE-CONTROLLED CRANES
8.1.1.1.2 AUTOMATED HORIZONTAL TRANSPORT
8.1.1.1.3 GATE & LANDSIDE AUTOMATION EQUIPMENT
8.1.1.1.4 OTHERS
8.1.2 SOFTWARE
8.1.2.1 SOFTWARE, BY TYPE
8.1.2.1.1 EQUIPMENT CONTROL SYSTEMS (ECS) & FLEET MANAGEMENT
8.1.2.1.2 TERMINAL OPERATING SYSTEMS (TOS)
8.1.2.1.3 AUTOMATION & ORCHESTRATION PLATFORMS
8.1.2.1.4 DIGITAL TWIN & SIMULATION TOOLS
8.1.2.1.5 GATE & COMMUNITY PLATFORMS
8.1.2.1.6 OTHERS
8.1.3 SERVICES
8.1.3.1 SERVICE, BY TYPE
8.1.3.1.1 PROFESSIONAL SERVICES
8.1.3.1.2 MANAGED SERVICES
9 EUROPE AUTOMATED CONTAINER TERMINAL MARKET, BY END USER
9.1 EUROPE AUTOMATED CONTAINER TERMINAL MARKET, BY END USER, 2018-2033 (USD THOUSAND)
9.1.1 PUBLIC
9.1.1.1 PUBLIC, BY APPLICATION
9.1.1.1.1 PORT INFRASTRUCTURE MODERNIZATION
9.1.1.1.2 TRADE FACILITATION & CUSTOMS AUTOMATION
9.1.1.1.3 SAFETY & COMPLIANCE AUTOMATION
9.1.1.1.4 SMART NATIONAL LOGISTICS CORRIDORS
9.1.1.1.5 PUBLIC–PRIVATE PARTNERSHIP (PPP) CO-MANAGED TERMINALS
9.1.1.1.6 OTHERS
9.1.2 PRIVATE
9.1.2.1 PRIVATE, BY APPLICATION
9.1.2.1.1 HIGH-VOLUME AUTOMATED CONTAINER HANDLING
9.1.2.1.2 AUTOMATED LOGISTICS & INTERMODAL HUBS
9.1.2.1.3 CARRIER-OWNED SMART TERMINALS
9.1.2.1.4 SUBSCRIPTION & MANAGED TERMINAL AUTOMATION SERVICES
10 EUROPE AUTOMATED CONTAINER TERMINAL MARKET, BY DISTRIBUTION CHANNEL
10.1 EUROPE AUTOMATED CONTAINER TERMINAL MARKET, BY DISTRIBUTION CHANNEL, 2018-2033 (USD THOUSAND)
10.1.1 DIRECT CHANNEL
10.1.2 INDIRECT CHANNEL
10.1.2.1 INDIRECT CHANNEL, BY TYPE
10.1.2.1.1 SYSTEM INTEGRATORS
10.1.2.1.2 VALUE-ADDED RESELLERS (VAR)
10.1.2.1.3 OTHERS
11 EUROPE AUTOMATED CONTAINER TERMINAL MARKET, BY REGION
11.1 EUROPE
11.1.1 GERMANY
11.1.2 NETHERLANDS
11.1.3 BELGIUM
11.1.4 UNITED KINGDOM
11.1.5 FRANCE
11.1.6 ITALY
11.1.7 SPAIN
11.1.8 RUSSIA
11.1.9 TURKEY
11.1.10 SWITZERLAND
11.1.11 REST OF EUROPE
12 EUROPE AUTOMATED CONTAINER TERMINAL MARKET, COMPANY LANDSCAPE
12.1 COMPANY SHARE ANALYSIS: GLOBAL
13 SWOT ANALYSIS
14 COMPANY PROFILES
14.1 LIEBHERR
14.1.1 COMPANY SNAPSHOT
14.1.2 REVENUE ANALYSIS
14.1.3 COMPANY SHARE ANALYSIS
14.1.4 PRODUCT PORTFOLIO
14.1.5 RECENT DEVELOPMENT
14.2 BECKHOFF AUTOMATION
14.2.1 COMPANY SNAPSHOT
14.2.2 COMPANY SHARE ANALYSIS
14.2.3 PRODUCT PORTFOLIO
14.2.4 RECENT DEVELOPMENT
14.3 SHANGHAI ZHENHUA HEAVY INDUSTRIES CO., LTD.
14.3.1 COMPANY SNAPSHOTS
14.3.2 REVENUE ANALYSIS
14.3.3 COMPANY SHARE ANALYSIS
14.3.4 PRODUCT PORTFOLIO
14.3.5 RECENT DEVELOPMENT
14.4 KONECRANES
14.4.1 COMPANY SNAPSHOT
14.4.2 REVENUE ANALYSIS
14.4.3 COMPANY SHARE ANALYSIS
14.4.4 PRODUCT PORTFOLIO
14.4.5 RECENT DEVELOPMENT
14.5 KALMAR CORPORATION
14.5.1 COMPANY SNAPSHOT
14.5.2 REVENUE ANALYSIS
14.5.3 COMPANY SHARE ANALYSIS
14.5.4 PRODUCT PORTFOLIO
14.5.5 RECENT DEVELOPMENT
14.6 ABB
14.6.1 COMPANY SNAPSHOT
14.6.2 REVENUE ANALYSIS
14.6.3 PRODUCT PORTFOLIO
14.6.4 RECENT DEVELOPMENT
14.7 APM TERMINALS
14.7.1 COMPANY SNAPSHOT
14.7.2 REVENUE ANALYSIS
14.7.3 PRODUCT PORTFOLIO
14.7.4 RECENT DEVELOPMENT
14.8 CAMCO TECHNOLOGIES
14.8.1 COMPANY SNAPSHOT
14.8.2 REVENUE ANALYSIS
14.8.3 PRODUCT PORTFOLIO
14.8.4 RECENT DEVELOPMENT
14.9 CLT
14.9.1 COMPANY SNAPSHOT
14.9.2 PRODUCT PORTFOLIO
14.9.3 RECENT DEVELOPMENT
14.1 HIAB CORPORATION (SUBSIDIARY OF CARGOTEC)
14.10.1 COMPANY SNAPSHOT
14.10.2 REVENUE ANALYSIS
14.10.3 PRODUCT PORTFOLIO
14.10.4 RECENT DEVELOPMENT
14.11 HAPAG-LLOYD AG
14.11.1 COMPANY SNAPSHOT
14.11.2 REVENUE ANALYSIS
14.11.3 PRODUCT PORTFOLIO
14.11.4 RECENT DEVELOPMENT
14.12 INFYZ.COM.
14.12.1 COMPANY SNAPSHOT
14.12.2 PRODUCT PORTFOLIO
14.12.3 RECENT DEVELOPMENT
14.13 INFORM SOFTWARE
14.13.1 COMPANY SNAPSHOT
14.13.2 PRODUCT PORTFOLIO
14.13.3 RECENT DEVELOPMENT
14.14 IDENTEC SOLUTIONS AG
14.14.1 COMPANY SNAPSHOT
14.14.2 PRODUCT PORTFOLIO
14.14.3 RECENT DEVELOPMENT
14.15 KÜNZ GMBH
14.15.1 COMPANY SNAPSHOT
14.15.2 PRODUCT PORTFOLIO
14.15.3 RECENT DEVELOPMENT
14.16 LOGSTAR ERP.
14.16.1 COMPANY SNAPSHOT
14.16.2 PRODUCT PORTFOLIO
14.16.3 RECENT DEVELOPMENT
14.17 LOGINNO LOGISTIC INNOVATION LTD.
14.17.1 COMPANY SNAPSHOT
14.17.2 PRODUCT PORTFOLIO
14.17.3 RECENT DEVELOPMENT
14.18 ORBCOMM
14.18.1 COMPANY SNAPSHOT
14.18.2 PRODUCT PORTFOLIO
14.18.3 RECENT DEVELOPMENT
14.19 PACECO CORP.
14.19.1 COMPANY SNAPSHOT
14.19.2 PRODUCT PORTFOLIO
14.19.3 RECENT DEVELOPMENT
14.2 STARCOM GPS EUROPE SOLUTIONS
14.20.1 COMPANY SNAPSHOT
14.20.2 PRODUCT PORTFOLIO
14.20.3 ECENT DEVELOPMENT
14.21 TMEIC
14.21.1 COMPANY SNAPSHOT
14.21.2 PRODUCT PORTFOLIO
14.21.3 RECENT DEVELOPMENT
14.22 TIDEWORKS.
14.22.1 COMPANY SNAPSHOT
14.22.2 PRODUCT PORTFOLIO
14.22.3 RECENT DEVELOPMENT
14.23 TOTAL SOFT BANK LTD.
14.23.1 COMPANY SNAPSHOT
14.23.2 REVENUE ANALYSIS
14.23.3 PRODUCT PORTFOLIO
14.24 WCS CONSULTANCY
14.24.1 COMPANY SNAPSHOT
14.24.2 PRODUCT PORTFOLIO
14.24.3 RECENT DEVELOPMENT
15 QUESTIONNAIRE
16 RELATED REPORTS
List of Table
TABLE 1 INDUSTRY ANALYSIS AND FUTURISTIC SCENARIO OF THE EUROPE AUTOMATED CONTAINER TERMINAL MARKET
TABLE 2 EUROPE AUTOMATED CONTAINER TERMINAL MARKET, BY DEGREE OF AUTOMATION, 2018-2033 (USD THOUSAND)
TABLE 3 EUROPE SEMI-AUTOMATED TERMINALS IN AUTOMATED CONTAINER TERMINAL MARKET, BY REGION, 2018-2033 (USD THOUSAND)
TABLE 4 EUROPE FULLY AUTOMATED TERMINALS IN AUTOMATED CONTAINER TERMINAL MARKET, BY REGION, 2018-2033 (USD THOUSAND)
TABLE 5 EUROPE AUTOMATED CONTAINER TERMINAL MARKET, BY PROJECT TYPE, 2018-2033 (USD THOUSAND)
TABLE 6 EUROPE BROWNFIELD PROJECTS IN AUTOMATED CONTAINER TERMINAL MARKET, BY REGION, 2018-2033 (USD THOUSAND)
TABLE 7 EUROPE BROWNFIELD PROJECTS IN AUTOMATED CONTAINER TERMINAL MARKET, BY TYPE, 2018-2033 (USD THOUSAND)
TABLE 8 EUROPE GREENFIELD PROJECTS IN AUTOMATED CONTAINER TERMINAL MARKET, BY REGION, 2018-2033 (USD THOUSAND)
TABLE 9 EUROPE GREENFIELD PROJECTS IN AUTOMATED CONTAINER TERMINAL MARKET, BY TYPE, 2018-2033 (USD THOUSAND)
TABLE 10 EUROPE AUTOMATED CONTAINER TERMINAL MARKET, BY OFFERING, 2018-2033 (USD THOUSAND)
TABLE 11 EUROPE EQUIPMENT IN AUTOMATED CONTAINER TERMINAL MARKET, BY REGION, 2018-2033 (USD THOUSAND)
TABLE 12 EUROPE EQUIPMENT IN AUTOMATED CONTAINER TERMINAL MARKET, BY TYPE, 2018-2033 (USD THOUSAND)
TABLE 13 EUROPE SOFTWARE IN AUTOMATED CONTAINER TERMINAL MARKET, BY REGION, 2018-2033 (USD THOUSAND)
TABLE 14 EUROPE SOFTWARE IN AUTOMATED CONTAINER TERMINAL MARKET, BY TYPE, 2018-2033 (USD THOUSAND)
TABLE 15 EUROPE SERVICES IN AUTOMATED CONTAINER TERMINAL MARKET, BY REGION, 2018-2033 (USD THOUSAND)
TABLE 16 EUROPE SERVICES IN AUTOMATED CONTAINER TERMINAL MARKET, BY TYPE, 2018-2033 (USD THOUSAND)
TABLE 17 EUROPE PROFESSIONAL SERVICES IN AUTOMATED CONTAINER TERMINAL MARKET, BY TYPE, 2018-2033 (USD THOUSAND)
TABLE 18 EUROPE AUTOMATED CONTAINER TERMINAL MARKET, BY END USER, 2018-2033 (USD THOUSAND)
TABLE 19 EUROPE PUBLIC IN AUTOMATED CONTAINER TERMINAL MARKET, BY REGION, 2018-2033 (USD THOUSAND)
TABLE 20 EUROPE PUBLIC IN AUTOMATED CONTAINER TERMINAL MARKET, BY APPLICATION, 2018-2033 (USD THOUSAND)
TABLE 21 EUROPE PRIVATE IN AUTOMATED CONTAINER TERMINAL MARKET, BY REGION, 2018-2033 (USD THOUSAND)
TABLE 22 EUROPE PRIVATE IN AUTOMATED CONTAINER TERMINAL MARKET, BY APPLICATION, 2018-2033 (USD THOUSAND)
TABLE 23 EUROPE AUTOMATED CONTAINER TERMINAL MARKET, BY DISTRIBUTION CHANNEL, 2018-2033 (USD THOUSAND)
TABLE 24 EUROPE DIRECT CHANNEL IN AUTOMATED CONTAINER TERMINAL MARKET, BY REGION, 2018-2033 (USD THOUSAND)
TABLE 25 EUROPE INDIRECT CHANNEL IN AUTOMATED CONTAINER TERMINAL MARKET, BY REGION, 2018-2033 (USD THOUSAND)
TABLE 26 EUROPE INDIRECT CHANNEL IN AUTOMATED CONTAINER TERMINAL MARKET, BY TYPE, 2018-2033 (USD THOUSAND)
TABLE 27 EUROPE AUTOMATED CONTAINER TERMINAL MARKET, BY COUNTRY, 2018-2033 (USD THOUSAND)
TABLE 28 EUROPE AUTOMATED CONTAINER TERMINAL MARKET, BY DEGREE OF AUTOMATION, 2018-2033 (USD THOUSAND)
TABLE 29 EUROPE AUTOMATED CONTAINER TERMINAL MARKET, BY PROJECT TYPE, 2018-2033 (USD THOUSAND)
TABLE 30 EUROPE BROWNFIELD PROJECTS IN AUTOMATED CONTAINER TERMINAL MARKET, BY TYPE, 2018-2033 (USD THOUSAND)
TABLE 31 EUROPE GREENFIELD PROJECTS IN AUTOMATED CONTAINER TERMINAL MARKET, BY TYPE, 2018-2033 (USD THOUSAND)
TABLE 32 EUROPE AUTOMATED CONTAINER TERMINAL MARKET, BY OFFERING, 2018-2033 (USD THOUSAND)
TABLE 33 EUROPE EQUIPMENT IN AUTOMATED CONTAINER TERMINAL MARKET, BY TYPE, 2018-2033 (USD THOUSAND)
TABLE 34 EUROPE SOFTWARE IN AUTOMATED CONTAINER TERMINAL MARKET, BY TYPE, 2018-2033 (USD THOUSAND)
TABLE 35 EUROPE SERVICES IN AUTOMATED CONTAINER TERMINAL MARKET, BY TYPE, 2018-2033 (USD THOUSAND)
TABLE 36 EUROPE PROFESSIONAL SERVICES IN AUTOMATED CONTAINER TERMINAL MARKET, BY TYPE, 2018-2033 (USD THOUSAND)
TABLE 37 EUROPE AUTOMATED CONTAINER TERMINAL MARKET, BY END USER, 2018-2033 (USD THOUSAND)
TABLE 38 EUROPE PUBLIC IN AUTOMATED CONTAINER TERMINAL MARKET, BY APPLICATION, 2018-2033 (USD THOUSAND)
TABLE 39 EUROPE PRIVATE IN AUTOMATED CONTAINER TERMINAL MARKET, BY APPLICATION, 2018-2033 (USD THOUSAND)
TABLE 40 EUROPE AUTOMATED CONTAINER TERMINAL MARKET, BY DISTRIBUTION CHANNEL, 2018-2033 (USD THOUSAND)
TABLE 41 EUROPE INDIRECT CHANNEL IN AUTOMATED CONTAINER TERMINAL MARKET, BY TYPE, 2018-2033 (USD THOUSAND)
TABLE 42 GERMANY (USD THOUSAND)
TABLE 43 GERMANY AUTOMATED CONTAINER TERMINAL MARKET, BY DEGREE OF AUTOMATION, 2018-2033 (USD THOUSAND)
TABLE 44 GERMANY AUTOMATED CONTAINER TERMINAL MARKET, BY PROJECT TYPE, 2018-2033 (USD THOUSAND)
TABLE 45 GERMANY BROWNFIELD PROJECTS IN AUTOMATED CONTAINER TERMINAL MARKET, BY TYPE, 2018-2033 (USD THOUSAND)
TABLE 46 GERMANY GREENFIELD PROJECTS IN AUTOMATED CONTAINER TERMINAL MARKET, BY TYPE, 2018-2033 (USD THOUSAND)
TABLE 47 GERMANY AUTOMATED CONTAINER TERMINAL MARKET, BY OFFERING, 2018-2033 (USD THOUSAND)
TABLE 48 GERMANY EQUIPMENT IN AUTOMATED CONTAINER TERMINAL MARKET, BY TYPE, 2018-2033 (USD THOUSAND)
TABLE 49 GERMANY SOFTWARE IN AUTOMATED CONTAINER TERMINAL MARKET, BY TYPE, 2018-2033 (USD THOUSAND)
TABLE 50 GERMANY SERVICES IN AUTOMATED CONTAINER TERMINAL MARKET, BY TYPE, 2018-2033 (USD THOUSAND)
TABLE 51 GERMANY PROFESSIONAL SERVICES IN AUTOMATED CONTAINER TERMINAL MARKET, BY TYPE, 2018-2033 (USD THOUSAND)
TABLE 52 GERMANY AUTOMATED CONTAINER TERMINAL MARKET, BY END USER, 2018-2033 (USD THOUSAND)
TABLE 53 GERMANY PUBLIC IN AUTOMATED CONTAINER TERMINAL MARKET, BY APPLICATION, 2018-2033 (USD THOUSAND)
TABLE 54 GERMANY PRIVATE IN AUTOMATED CONTAINER TERMINAL MARKET, BY APPLICATION, 2018-2033 (USD THOUSAND)
TABLE 55 GERMANY AUTOMATED CONTAINER TERMINAL MARKET, BY DISTRIBUTION CHANNEL, 2018-2033 (USD THOUSAND)
TABLE 56 GERMANY INDIRECT CHANNEL IN AUTOMATED CONTAINER TERMINAL MARKET, BY TYPE, 2018-2033 (USD THOUSAND)
TABLE 57 NETHERLANDS (USD THOUSAND)
TABLE 58 NETHERLANDS AUTOMATED CONTAINER TERMINAL MARKET, BY DEGREE OF AUTOMATION, 2018-2033 (USD THOUSAND)
TABLE 59 NETHERLANDS AUTOMATED CONTAINER TERMINAL MARKET, BY PROJECT TYPE, 2018-2033 (USD THOUSAND)
TABLE 60 NETHERLANDS BROWNFIELD PROJECTS IN AUTOMATED CONTAINER TERMINAL MARKET, BY TYPE, 2018-2033 (USD THOUSAND)
TABLE 61 NETHERLANDS GREENFIELD PROJECTS IN AUTOMATED CONTAINER TERMINAL MARKET, BY TYPE, 2018-2033 (USD THOUSAND)
TABLE 62 NETHERLANDS AUTOMATED CONTAINER TERMINAL MARKET, BY OFFERING, 2018-2033 (USD THOUSAND)
TABLE 63 NETHERLANDS EQUIPMENT IN AUTOMATED CONTAINER TERMINAL MARKET, BY TYPE, 2018-2033 (USD THOUSAND)
TABLE 64 NETHERLANDS SOFTWARE IN AUTOMATED CONTAINER TERMINAL MARKET, BY TYPE, 2018-2033 (USD THOUSAND)
TABLE 65 NETHERLANDS SERVICES IN AUTOMATED CONTAINER TERMINAL MARKET, BY TYPE, 2018-2033 (USD THOUSAND)
TABLE 66 NETHERLANDS PROFESSIONAL SERVICES IN AUTOMATED CONTAINER TERMINAL MARKET, BY TYPE, 2018-2033 (USD THOUSAND)
TABLE 67 NETHERLANDS AUTOMATED CONTAINER TERMINAL MARKET, BY END USER, 2018-2033 (USD THOUSAND)
TABLE 68 NETHERLANDS PUBLIC IN AUTOMATED CONTAINER TERMINAL MARKET, BY APPLICATION, 2018-2033 (USD THOUSAND)
TABLE 69 NETHERLANDS PRIVATE IN AUTOMATED CONTAINER TERMINAL MARKET, BY APPLICATION, 2018-2033 (USD THOUSAND)
TABLE 70 NETHERLANDS AUTOMATED CONTAINER TERMINAL MARKET, BY DISTRIBUTION CHANNEL, 2018-2033 (USD THOUSAND)
TABLE 71 NETHERLANDS INDIRECT CHANNEL IN AUTOMATED CONTAINER TERMINAL MARKET, BY TYPE, 2018-2033 (USD THOUSAND)
TABLE 72 BELGIUM (USD THOUSAND)
TABLE 73 BELGIUM AUTOMATED CONTAINER TERMINAL MARKET, BY DEGREE OF AUTOMATION, 2018-2033 (USD THOUSAND)
TABLE 74 BELGIUM AUTOMATED CONTAINER TERMINAL MARKET, BY PROJECT TYPE, 2018-2033 (USD THOUSAND)
TABLE 75 BELGIUM BROWNFIELD PROJECTS IN AUTOMATED CONTAINER TERMINAL MARKET, BY TYPE, 2018-2033 (USD THOUSAND)
TABLE 76 BELGIUM GREENFIELD PROJECTS IN AUTOMATED CONTAINER TERMINAL MARKET, BY TYPE, 2018-2033 (USD THOUSAND)
TABLE 77 BELGIUM AUTOMATED CONTAINER TERMINAL MARKET, BY OFFERING, 2018-2033 (USD THOUSAND)
TABLE 78 BELGIUM EQUIPMENT IN AUTOMATED CONTAINER TERMINAL MARKET, BY TYPE, 2018-2033 (USD THOUSAND)
TABLE 79 BELGIUM SOFTWARE IN AUTOMATED CONTAINER TERMINAL MARKET, BY TYPE, 2018-2033 (USD THOUSAND)
TABLE 80 BELGIUM SERVICES IN AUTOMATED CONTAINER TERMINAL MARKET, BY TYPE, 2018-2033 (USD THOUSAND)
TABLE 81 BELGIUM PROFESSIONAL SERVICES IN AUTOMATED CONTAINER TERMINAL MARKET, BY TYPE, 2018-2033 (USD THOUSAND)
TABLE 82 BELGIUM AUTOMATED CONTAINER TERMINAL MARKET, BY END USER, 2018-2033 (USD THOUSAND)
TABLE 83 BELGIUM PUBLIC IN AUTOMATED CONTAINER TERMINAL MARKET, BY APPLICATION, 2018-2033 (USD THOUSAND)
TABLE 84 BELGIUM PRIVATE IN AUTOMATED CONTAINER TERMINAL MARKET, BY APPLICATION, 2018-2033 (USD THOUSAND)
TABLE 85 BELGIUM AUTOMATED CONTAINER TERMINAL MARKET, BY DISTRIBUTION CHANNEL, 2018-2033 (USD THOUSAND)
TABLE 86 BELGIUM INDIRECT CHANNEL IN AUTOMATED CONTAINER TERMINAL MARKET, BY TYPE, 2018-2033 (USD THOUSAND)
TABLE 87 UNITED KINGDOM (USD THOUSAND)
TABLE 88 UNITED KINGDOM AUTOMATED CONTAINER TERMINAL MARKET, BY DEGREE OF AUTOMATION, 2018-2033 (USD THOUSAND)
TABLE 89 UNITED KINGDOM AUTOMATED CONTAINER TERMINAL MARKET, BY PROJECT TYPE, 2018-2033 (USD THOUSAND)
TABLE 90 UNITED KINGDOM BROWNFIELD PROJECTS IN AUTOMATED CONTAINER TERMINAL MARKET, BY TYPE, 2018-2033 (USD THOUSAND)
TABLE 91 UNITED KINGDOM GREENFIELD PROJECTS IN AUTOMATED CONTAINER TERMINAL MARKET, BY TYPE, 2018-2033 (USD THOUSAND)
TABLE 92 UNITED KINGDOM AUTOMATED CONTAINER TERMINAL MARKET, BY OFFERING, 2018-2033 (USD THOUSAND)
TABLE 93 UNITED KINGDOM EQUIPMENT IN AUTOMATED CONTAINER TERMINAL MARKET, BY TYPE, 2018-2033 (USD THOUSAND)
TABLE 94 UNITED KINGDOM SOFTWARE IN AUTOMATED CONTAINER TERMINAL MARKET, BY TYPE, 2018-2033 (USD THOUSAND)
TABLE 95 UNITED KINGDOM SERVICES IN AUTOMATED CONTAINER TERMINAL MARKET, BY TYPE, 2018-2033 (USD THOUSAND)
TABLE 96 UNITED KINGDOM PROFESSIONAL SERVICES IN AUTOMATED CONTAINER TERMINAL MARKET, BY TYPE, 2018-2033 (USD THOUSAND)
TABLE 97 UNITED KINGDOM AUTOMATED CONTAINER TERMINAL MARKET, BY END USER, 2018-2033 (USD THOUSAND)
TABLE 98 UNITED KINGDOM PUBLIC IN AUTOMATED CONTAINER TERMINAL MARKET, BY APPLICATION, 2018-2033 (USD THOUSAND)
TABLE 99 UNITED KINGDOM PRIVATE IN AUTOMATED CONTAINER TERMINAL MARKET, BY APPLICATION, 2018-2033 (USD THOUSAND)
TABLE 100 UNITED KINGDOM AUTOMATED CONTAINER TERMINAL MARKET, BY DISTRIBUTION CHANNEL, 2018-2033 (USD THOUSAND)
TABLE 101 UNITED KINGDOM INDIRECT CHANNEL IN AUTOMATED CONTAINER TERMINAL MARKET, BY TYPE, 2018-2033 (USD THOUSAND)
TABLE 102 FRANCE (USD THOUSAND)
TABLE 103 FRANCE AUTOMATED CONTAINER TERMINAL MARKET, BY DEGREE OF AUTOMATION, 2018-2033 (USD THOUSAND)
TABLE 104 FRANCE AUTOMATED CONTAINER TERMINAL MARKET, BY PROJECT TYPE, 2018-2033 (USD THOUSAND)
TABLE 105 FRANCE BROWNFIELD PROJECTS IN AUTOMATED CONTAINER TERMINAL MARKET, BY TYPE, 2018-2033 (USD THOUSAND)
TABLE 106 FRANCE GREENFIELD PROJECTS IN AUTOMATED CONTAINER TERMINAL MARKET, BY TYPE, 2018-2033 (USD THOUSAND)
TABLE 107 FRANCE AUTOMATED CONTAINER TERMINAL MARKET, BY OFFERING, 2018-2033 (USD THOUSAND)
TABLE 108 FRANCE EQUIPMENT IN AUTOMATED CONTAINER TERMINAL MARKET, BY TYPE, 2018-2033 (USD THOUSAND)
TABLE 109 FRANCE SOFTWARE IN AUTOMATED CONTAINER TERMINAL MARKET, BY TYPE, 2018-2033 (USD THOUSAND)
TABLE 110 FRANCE SERVICES IN AUTOMATED CONTAINER TERMINAL MARKET, BY TYPE, 2018-2033 (USD THOUSAND)
TABLE 111 FRANCE PROFESSIONAL SERVICES IN AUTOMATED CONTAINER TERMINAL MARKET, BY TYPE, 2018-2033 (USD THOUSAND)
TABLE 112 FRANCE AUTOMATED CONTAINER TERMINAL MARKET, BY END USER, 2018-2033 (USD THOUSAND)
TABLE 113 FRANCE PUBLIC IN AUTOMATED CONTAINER TERMINAL MARKET, BY APPLICATION, 2018-2033 (USD THOUSAND)
TABLE 114 FRANCE PRIVATE IN AUTOMATED CONTAINER TERMINAL MARKET, BY APPLICATION, 2018-2033 (USD THOUSAND)
TABLE 115 FRANCE AUTOMATED CONTAINER TERMINAL MARKET, BY DISTRIBUTION CHANNEL, 2018-2033 (USD THOUSAND)
TABLE 116 FRANCE INDIRECT CHANNEL IN AUTOMATED CONTAINER TERMINAL MARKET, BY TYPE, 2018-2033 (USD THOUSAND)
TABLE 117 ITALY (USD THOUSAND)
TABLE 118 ITALY AUTOMATED CONTAINER TERMINAL MARKET, BY DEGREE OF AUTOMATION, 2018-2033 (USD THOUSAND)
TABLE 119 ITALY AUTOMATED CONTAINER TERMINAL MARKET, BY PROJECT TYPE, 2018-2033 (USD THOUSAND)
TABLE 120 ITALY BROWNFIELD PROJECTS IN AUTOMATED CONTAINER TERMINAL MARKET, BY TYPE, 2018-2033 (USD THOUSAND)
TABLE 121 ITALY GREENFIELD PROJECTS IN AUTOMATED CONTAINER TERMINAL MARKET, BY TYPE, 2018-2033 (USD THOUSAND)
TABLE 122 ITALY AUTOMATED CONTAINER TERMINAL MARKET, BY OFFERING, 2018-2033 (USD THOUSAND)
TABLE 123 ITALY EQUIPMENT IN AUTOMATED CONTAINER TERMINAL MARKET, BY TYPE, 2018-2033 (USD THOUSAND)
TABLE 124 ITALY SOFTWARE IN AUTOMATED CONTAINER TERMINAL MARKET, BY TYPE, 2018-2033 (USD THOUSAND)
TABLE 125 ITALY SERVICES IN AUTOMATED CONTAINER TERMINAL MARKET, BY TYPE, 2018-2033 (USD THOUSAND)
TABLE 126 ITALY PROFESSIONAL SERVICES IN AUTOMATED CONTAINER TERMINAL MARKET, BY TYPE, 2018-2033 (USD THOUSAND)
TABLE 127 ITALY AUTOMATED CONTAINER TERMINAL MARKET, BY END USER, 2018-2033 (USD THOUSAND)
TABLE 128 ITALY PUBLIC IN AUTOMATED CONTAINER TERMINAL MARKET, BY APPLICATION, 2018-2033 (USD THOUSAND)
TABLE 129 ITALY PRIVATE IN AUTOMATED CONTAINER TERMINAL MARKET, BY APPLICATION, 2018-2033 (USD THOUSAND)
TABLE 130 ITALY AUTOMATED CONTAINER TERMINAL MARKET, BY DISTRIBUTION CHANNEL, 2018-2033 (USD THOUSAND)
TABLE 131 ITALY INDIRECT CHANNEL IN AUTOMATED CONTAINER TERMINAL MARKET, BY TYPE, 2018-2033 (USD THOUSAND)
TABLE 132 SPAIN (USD THOUSAND)
TABLE 133 SPAIN AUTOMATED CONTAINER TERMINAL MARKET, BY DEGREE OF AUTOMATION, 2018-2033 (USD THOUSAND)
TABLE 134 SPAIN AUTOMATED CONTAINER TERMINAL MARKET, BY PROJECT TYPE, 2018-2033 (USD THOUSAND)
TABLE 135 SPAIN BROWNFIELD PROJECTS IN AUTOMATED CONTAINER TERMINAL MARKET, BY TYPE, 2018-2033 (USD THOUSAND)
TABLE 136 SPAIN GREENFIELD PROJECTS IN AUTOMATED CONTAINER TERMINAL MARKET, BY TYPE, 2018-2033 (USD THOUSAND)
TABLE 137 SPAIN AUTOMATED CONTAINER TERMINAL MARKET, BY OFFERING, 2018-2033 (USD THOUSAND)
TABLE 138 SPAIN EQUIPMENT IN AUTOMATED CONTAINER TERMINAL MARKET, BY TYPE, 2018-2033 (USD THOUSAND)
TABLE 139 SPAIN SOFTWARE IN AUTOMATED CONTAINER TERMINAL MARKET, BY TYPE, 2018-2033 (USD THOUSAND)
TABLE 140 SPAIN SERVICES IN AUTOMATED CONTAINER TERMINAL MARKET, BY TYPE, 2018-2033 (USD THOUSAND)
TABLE 141 SPAIN PROFESSIONAL SERVICES IN AUTOMATED CONTAINER TERMINAL MARKET, BY TYPE, 2018-2033 (USD THOUSAND)
TABLE 142 SPAIN AUTOMATED CONTAINER TERMINAL MARKET, BY END USER, 2018-2033 (USD THOUSAND)
TABLE 143 SPAIN PUBLIC IN AUTOMATED CONTAINER TERMINAL MARKET, BY APPLICATION, 2018-2033 (USD THOUSAND)
TABLE 144 SPAIN PRIVATE IN AUTOMATED CONTAINER TERMINAL MARKET, BY APPLICATION, 2018-2033 (USD THOUSAND)
TABLE 145 SPAIN AUTOMATED CONTAINER TERMINAL MARKET, BY DISTRIBUTION CHANNEL, 2018-2033 (USD THOUSAND)
TABLE 146 SPAIN INDIRECT CHANNEL IN AUTOMATED CONTAINER TERMINAL MARKET, BY TYPE, 2018-2033 (USD THOUSAND)
TABLE 147 RUSSIA (USD THOUSAND)
TABLE 148 RUSSIA AUTOMATED CONTAINER TERMINAL MARKET, BY DEGREE OF AUTOMATION, 2018-2033 (USD THOUSAND)
TABLE 149 RUSSIA AUTOMATED CONTAINER TERMINAL MARKET, BY PROJECT TYPE, 2018-2033 (USD THOUSAND)
TABLE 150 RUSSIA BROWNFIELD PROJECTS IN AUTOMATED CONTAINER TERMINAL MARKET, BY TYPE, 2018-2033 (USD THOUSAND)
TABLE 151 RUSSIA GREENFIELD PROJECTS IN AUTOMATED CONTAINER TERMINAL MARKET, BY TYPE, 2018-2033 (USD THOUSAND)
TABLE 152 RUSSIA AUTOMATED CONTAINER TERMINAL MARKET, BY OFFERING, 2018-2033 (USD THOUSAND)
TABLE 153 RUSSIA EQUIPMENT IN AUTOMATED CONTAINER TERMINAL MARKET, BY TYPE, 2018-2033 (USD THOUSAND)
TABLE 154 RUSSIA SOFTWARE IN AUTOMATED CONTAINER TERMINAL MARKET, BY TYPE, 2018-2033 (USD THOUSAND)
TABLE 155 RUSSIA SERVICES IN AUTOMATED CONTAINER TERMINAL MARKET, BY TYPE, 2018-2033 (USD THOUSAND)
TABLE 156 RUSSIA PROFESSIONAL SERVICES IN AUTOMATED CONTAINER TERMINAL MARKET, BY TYPE, 2018-2033 (USD THOUSAND)
TABLE 157 RUSSIA AUTOMATED CONTAINER TERMINAL MARKET, BY END USER, 2018-2033 (USD THOUSAND)
TABLE 158 RUSSIA PUBLIC IN AUTOMATED CONTAINER TERMINAL MARKET, BY APPLICATION, 2018-2033 (USD THOUSAND)
TABLE 159 RUSSIA PRIVATE IN AUTOMATED CONTAINER TERMINAL MARKET, BY APPLICATION, 2018-2033 (USD THOUSAND)
TABLE 160 RUSSIA AUTOMATED CONTAINER TERMINAL MARKET, BY DISTRIBUTION CHANNEL, 2018-2033 (USD THOUSAND)
TABLE 161 RUSSIA INDIRECT CHANNEL IN AUTOMATED CONTAINER TERMINAL MARKET, BY TYPE, 2018-2033 (USD THOUSAND)
TABLE 162 TURKEY (USD THOUSAND)
TABLE 163 TURKEY AUTOMATED CONTAINER TERMINAL MARKET, BY DEGREE OF AUTOMATION, 2018-2033 (USD THOUSAND)
TABLE 164 TURKEY AUTOMATED CONTAINER TERMINAL MARKET, BY PROJECT TYPE, 2018-2033 (USD THOUSAND)
TABLE 165 TURKEY BROWNFIELD PROJECTS IN AUTOMATED CONTAINER TERMINAL MARKET, BY TYPE, 2018-2033 (USD THOUSAND)
TABLE 166 TURKEY GREENFIELD PROJECTS IN AUTOMATED CONTAINER TERMINAL MARKET, BY TYPE, 2018-2033 (USD THOUSAND)
TABLE 167 TURKEY AUTOMATED CONTAINER TERMINAL MARKET, BY OFFERING, 2018-2033 (USD THOUSAND)
TABLE 168 TURKEY EQUIPMENT IN AUTOMATED CONTAINER TERMINAL MARKET, BY TYPE, 2018-2033 (USD THOUSAND)
TABLE 169 TURKEY SOFTWARE IN AUTOMATED CONTAINER TERMINAL MARKET, BY TYPE, 2018-2033 (USD THOUSAND)
TABLE 170 TURKEY SERVICES IN AUTOMATED CONTAINER TERMINAL MARKET, BY TYPE, 2018-2033 (USD THOUSAND)
TABLE 171 TURKEY PROFESSIONAL SERVICES IN AUTOMATED CONTAINER TERMINAL MARKET, BY TYPE, 2018-2033 (USD THOUSAND)
TABLE 172 TURKEY AUTOMATED CONTAINER TERMINAL MARKET, BY END USER, 2018-2033 (USD THOUSAND)
TABLE 173 TURKEY PUBLIC IN AUTOMATED CONTAINER TERMINAL MARKET, BY APPLICATION, 2018-2033 (USD THOUSAND)
TABLE 174 TURKEY PRIVATE IN AUTOMATED CONTAINER TERMINAL MARKET, BY APPLICATION, 2018-2033 (USD THOUSAND)
TABLE 175 TURKEY AUTOMATED CONTAINER TERMINAL MARKET, BY DISTRIBUTION CHANNEL, 2018-2033 (USD THOUSAND)
TABLE 176 TURKEY INDIRECT CHANNEL IN AUTOMATED CONTAINER TERMINAL MARKET, BY TYPE, 2018-2033 (USD THOUSAND)
TABLE 177 SWITZERLAND (USD THOUSAND)
TABLE 178 SWITZERLAND AUTOMATED CONTAINER TERMINAL MARKET, BY DEGREE OF AUTOMATION, 2018-2033 (USD THOUSAND)
TABLE 179 SWITZERLAND AUTOMATED CONTAINER TERMINAL MARKET, BY PROJECT TYPE, 2018-2033 (USD THOUSAND)
TABLE 180 SWITZERLAND BROWNFIELD PROJECTS IN AUTOMATED CONTAINER TERMINAL MARKET, BY TYPE, 2018-2033 (USD THOUSAND)
TABLE 181 SWITZERLAND GREENFIELD PROJECTS IN AUTOMATED CONTAINER TERMINAL MARKET, BY TYPE, 2018-2033 (USD THOUSAND)
TABLE 182 SWITZERLAND AUTOMATED CONTAINER TERMINAL MARKET, BY OFFERING, 2018-2033 (USD THOUSAND)
TABLE 183 SWITZERLAND EQUIPMENT IN AUTOMATED CONTAINER TERMINAL MARKET, BY TYPE, 2018-2033 (USD THOUSAND)
TABLE 184 SWITZERLAND SOFTWARE IN AUTOMATED CONTAINER TERMINAL MARKET, BY TYPE, 2018-2033 (USD THOUSAND)
TABLE 185 SWITZERLAND SERVICES IN AUTOMATED CONTAINER TERMINAL MARKET, BY TYPE, 2018-2033 (USD THOUSAND)
TABLE 186 SWITZERLAND PROFESSIONAL SERVICES IN AUTOMATED CONTAINER TERMINAL MARKET, BY TYPE, 2018-2033 (USD THOUSAND)
TABLE 187 SWITZERLAND AUTOMATED CONTAINER TERMINAL MARKET, BY END USER, 2018-2033 (USD THOUSAND)
TABLE 188 SWITZERLAND PUBLIC IN AUTOMATED CONTAINER TERMINAL MARKET, BY APPLICATION, 2018-2033 (USD THOUSAND)
TABLE 189 SWITZERLAND PRIVATE IN AUTOMATED CONTAINER TERMINAL MARKET, BY APPLICATION, 2018-2033 (USD THOUSAND)
TABLE 190 SWITZERLAND AUTOMATED CONTAINER TERMINAL MARKET, BY DISTRIBUTION CHANNEL, 2018-2033 (USD THOUSAND)
TABLE 191 SWITZERLAND INDIRECT CHANNEL IN AUTOMATED CONTAINER TERMINAL MARKET, BY TYPE, 2018-2033 (USD THOUSAND)
TABLE 192 REST OF EUROPE (USD THOUSAND)
TABLE 193 REST OF EUROPE AUTOMATED CONTAINER TERMINAL MARKET, BY DEGREE OF AUTOMATION, 2018-2033 (USD THOUSAND)
TABLE 194 REST OF EUROPE AUTOMATED CONTAINER TERMINAL MARKET, BY PROJECT TYPE, 2018-2033 (USD THOUSAND)
TABLE 195 REST OF EUROPE BROWNFIELD PROJECTS IN AUTOMATED CONTAINER TERMINAL MARKET, BY TYPE, 2018-2033 (USD THOUSAND)
TABLE 196 REST OF EUROPE GREENFIELD PROJECTS IN AUTOMATED CONTAINER TERMINAL MARKET, BY TYPE, 2018-2033 (USD THOUSAND)
TABLE 197 REST OF EUROPE AUTOMATED CONTAINER TERMINAL MARKET, BY OFFERING, 2018-2033 (USD THOUSAND)
TABLE 198 REST OF EUROPE EQUIPMENT IN AUTOMATED CONTAINER TERMINAL MARKET, BY TYPE, 2018-2033 (USD THOUSAND)
TABLE 199 REST OF EUROPE SOFTWARE IN AUTOMATED CONTAINER TERMINAL MARKET, BY TYPE, 2018-2033 (USD THOUSAND)
TABLE 200 REST OF EUROPE SERVICES IN AUTOMATED CONTAINER TERMINAL MARKET, BY TYPE, 2018-2033 (USD THOUSAND)
TABLE 201 REST OF EUROPE PROFESSIONAL SERVICES IN AUTOMATED CONTAINER TERMINAL MARKET, BY TYPE, 2018-2033 (USD THOUSAND)
TABLE 202 REST OF EUROPE AUTOMATED CONTAINER TERMINAL MARKET, BY END USER, 2018-2033 (USD THOUSAND)
TABLE 203 REST OF EUROPE PUBLIC IN AUTOMATED CONTAINER TERMINAL MARKET, BY APPLICATION, 2018-2033 (USD THOUSAND)
TABLE 204 REST OF EUROPE PRIVATE IN AUTOMATED CONTAINER TERMINAL MARKET, BY APPLICATION, 2018-2033 (USD THOUSAND)
TABLE 205 REST OF EUROPE AUTOMATED CONTAINER TERMINAL MARKET, BY DISTRIBUTION CHANNEL, 2018-2033 (USD THOUSAND)
TABLE 206 REST OF EUROPE INDIRECT CHANNEL IN AUTOMATED CONTAINER TERMINAL MARKET, BY TYPE, 2018-2033 (USD THOUSAND)
List of Figure
FIGURE 1 EUROPE AUTOMATED CONTAINER TERMINAL MARKET
FIGURE 2 EUROPE AUTOMATED CONTAINER TERMINAL MARKET: DATA TRIANGULATION
FIGURE 3 EUROPE AUTOMATED CONTAINER TERMINAL MARKET: DROC ANALYSIS
FIGURE 4 EUROPE AUTOMATED CONTAINER TERMINAL MARKET: EUROPE VS REGIONAL MARKET ANALYSIS
FIGURE 5 EUROPE AUTOMATED CONTAINER TERMINAL MARKET: COMPANY RESEARCH ANALYSIS
FIGURE 6 EUROPE AUTOMATED CONTAINER TERMINAL MARKET: MULTIVARIATE MODELLING
FIGURE 7 SWOT ANALYSIS
FIGURE 8 EUROPE AUTOMATED CONTAINER TERMINAL MARKET: INTERVIEW DEMOGRAPHICS
FIGURE 9 EUROPE AUTOMATED CONTAINER TERMINAL MARKET: DBMR MARKET POSITION GRID
FIGURE 10 EUROPE AUTOMATED CONTAINER TERMINAL MARKET: VENDOR SHARE ANALYSIS
FIGURE 11 EXECUTIVE SUMMARY
FIGURE 12 EUROPE AUTOMATED CONTAINER TERMINAL MARKET: SEGMENTATION
FIGURE 13 STRATEGIC DECISIONS
FIGURE 14 TWO SEGMENTS COMPRISE THE EUROPE AUTOMATED CONTAINER TERMINAL MARKET, BY PROJECT TYPE
FIGURE 15 THE SURGE IN INTERNATIONAL TRADE HAS LED TO HIGHER CONTAINER THROUGHPUT. IT IS EXPECTED TO DRIVE THE EUROPE AUTOMATED CONTAINER TERMINAL MARKET IN THE FORECAST PERIOD OF 2026 TO 2033
FIGURE 16 SEMI-AUTOMATED SEGMENT IS EXPECTED TO ACCOUNT FOR THE LARGEST MARKET SHARE OF THE EUROPE AUTOMATED CONTAINER TERMINAL MARKET IN 2025 AND 2033
FIGURE 17 DRIVERS, RESTRAINTS, OPPORTUNITIES, AND CHALLENGES OF EUROPE AUTOMATED CONTAINER TERMINAL MARKET
FIGURE 18 EUROPE AUTOMATED CONTAINER TERMINAL MARKET: BY DEGREE OF AUTOMATION, 2025
FIGURE 19 EUROPE AUTOMATED CONTAINER TERMINAL MARKET: BY PROJECT TYPE, 2025
FIGURE 20 EUROPE AUTOMATED CONTAINER TERMINAL MARKET: BY OFFERING, 2025
FIGURE 21 EUROPE AUTOMATED CONTAINER TERMINAL MARKET: BY END USER, 2025
FIGURE 22 EUROPE AUTOMATED CONTAINER TERMINAL MARKET: BY DISTRIBUTION CHANNEL, 2025
FIGURE 23 EUROPE AUTOMATED CONTAINER TERMINAL MARKET: SNAPSHOT (2025)
FIGURE 24 EUROPE AUTOMATED CONTAINER TERMINAL MARKET: COMPANY SHARE 2024 (%)
Data collection and base year analysis are done using data collection modules with large sample sizes. The stage includes obtaining market information or related data through various sources and strategies. It includes examining and planning all the data acquired from the past in advance. It likewise envelops the examination of information inconsistencies seen across different information sources. The market data is analysed and estimated using market statistical and coherent models. Also, market share analysis and key trend analysis are the major success factors in the market report. To know more, please request an analyst call or drop down your inquiry.
The key research methodology used by DBMR research team is data triangulation which involves data mining, analysis of the impact of data variables on the market and primary (industry expert) validation. Data models include Vendor Positioning Grid, Market Time Line Analysis, Market Overview and Guide, Company Positioning Grid, Patent Analysis, Pricing Analysis, Company Market Share Analysis, Standards of Measurement, Global versus Regional and Vendor Share Analysis. To know more about the research methodology, drop in an inquiry to speak to our industry experts.
Data Bridge Market Research is a leader in advanced formative research. We take pride in servicing our existing and new customers with data and analysis that match and suits their goal. The report can be customized to include price trend analysis of target brands understanding the market for additional countries (ask for the list of countries), clinical trial results data, literature review, refurbished market and product base analysis. Market analysis of target competitors can be analyzed from technology-based analysis to market portfolio strategies. We can add as many competitors that you require data about in the format and data style you are looking for. Our team of analysts can also provide you data in crude raw excel files pivot tables (Fact book) or can assist you in creating presentations from the data sets available in the report.


