
Europe Butyric Acid Market
Market Size in USD Million
 USD
134.90 Million
USD
255.31 Million
2024
2032
USD
134.90 Million
USD
255.31 Million
2024
2032
| 2025 - 2032 | |
| USD 134.90 Million | |
| USD 255.31 Million | |
| % | |
|
Butyric Acid Market Size
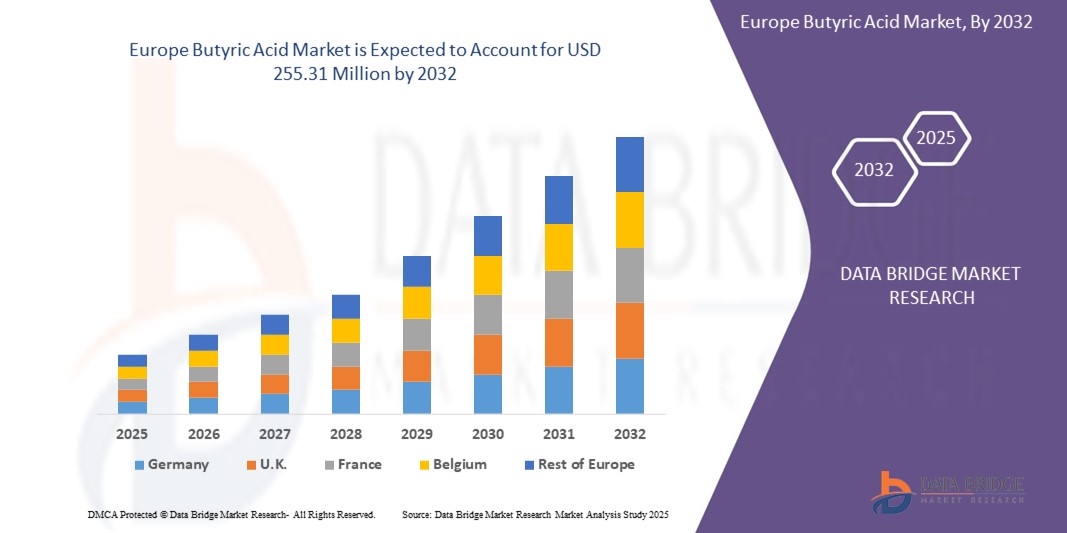
- The Europe butyric acid market size was valued at USD 134.90 million in 2024 and is expected to reach USD 255.31 million by 2032, at a CAGR of 8.3% during the forecast period
- Market growth is being driven by increasing demand from the animal feed industry, where butyric acid is used as a performance-enhancing additive to improve gut health and nutrient absorption in livestock
- In addition, the rising popularity of functional foods and dietary supplements is contributing to demand, particularly as butyric acid is recognized for its role in supporting gut microbiota and overall digestive health
Butyric Acid Market Analysis
- Butyric acid, a vital short-chain fatty acid used extensively across food, pharmaceutical, animal feed, and chemical industries, is witnessing increasing demand in Europe driven by its natural preservative properties and health benefits
- The surge in demand for natural food additives, rising consumer focus on gut health and probiotics, and the pharmaceutical industry's growing use of butyric acid derivatives for advanced drug formulations are key factors propelling the market growth in Europe
- Germany leads the European butyric acid market with the largest revenue share of approximately 25.7% in 2025. The country’s mature chemical manufacturing infrastructure, stringent regulatory frameworks promoting natural additives, and a strong pharmaceutical sector contribute to this dominance
- Italy is forecasted to be the fastest-growing country in the Europe butyric acid market, expected to achieve a compound annual growth rate (CAGR) of over 7.5% through the forecast period, fueled by rising animal feed production and dairy product manufacturing where butyric acid serves as a flavor enhancer and preservative
- The natural butyric acid segment is anticipated to dominate the market in Europe with a market share of approximately 52.3% in 2025. This is due to growing consumer preference for bio-based and organic ingredients across food and pharmaceutical products, as well as increasing regulatory support for natural additives over synthetic alternatives
Report Scope and Butyric Acid Market Segmentation
|
Attributes |
Butyric Acid Key Market Insights |
|
Segments Covered |
|
|
Countries Covered |
Europe
|
|
Key Market Players |
|
|
Market Opportunities |
|
|
Value Added Data Infosets |
In addition to the insights on market scenarios such as market value, growth rate, segmentation, geographical coverage, and major players, the market reports curated by the Data Bridge Market Research also include in-depth expert analysis, pricing analysis, brand share analysis, consumer survey, demography analysis, supply chain analysis, value chain analysis, raw material/consumables overview, vendor selection criteria, PESTLE Analysis, Porter Analysis, and regulatory framework. |
Butyric Acid Market Trends
“Growing Demand for Natural and Bio-Based Products”
- A prominent and accelerating trend in the European butyric acid market is the increasing preference for natural, bio-based, and sustainable sources of butyric acid over synthetic alternatives. This shift is driven by stricter environmental regulations and rising consumer awareness around clean-label and organic products
- For instances, several European manufacturers are investing in biotechnological production methods using renewable feedstocks such as corn starch and biomass, reducing reliance on petrochemical sources. Companies such as Purac and BASF have expanded their bio-based butyric acid production capabilities in Europe to meet this growing demand
- The preference for natural butyric acid is especially strong in the food and pharmaceutical sectors, where clean-label ingredients and health benefits such as gut microbiome support are highly valued. This has led to innovations in natural preservative formulations and probiotic supplements containing butyric acid derivatives
- In addition, Europe’s animal feed industry is increasingly incorporating butyric acid as a natural growth promoter and gut health enhancer, replacing antibiotics and synthetic additives in compliance with EU regulations
- The trend toward sustainable sourcing and natural ingredients is influencing new product development and regulatory frameworks, encouraging manufacturers to adopt greener processes. For instance EU policies promoting circular bioeconomy and chemical sustainability are accelerating research in bio-fermentation and enzymatic synthesis methods for butyric acid
- Demand for natural and bio-based butyric acid products is rapidly growing across countries such as Germany, France, and Italy, as consumers and industries alike prioritize sustainability alongside performance and safety
Butyric Acid Market Dynamics
Driver
“Rising Demand from Food, Pharmaceutical, and Animal Feed Industries”
- The increasing demand for natural preservatives, flavoring agents, and gut health supplements is a significant driver for the growth of the butyric acid market in Europe
- For instances, in March 2024, BASF expanded its production capacities for bio-based butyric acid in Germany to meet growing demand from food and pharmaceutical companies focused on clean-label and functional products
- Rising consumer awareness about the benefits of butyric acid for digestive health and immunity is fueling its incorporation in dietary supplements and probiotic formulations across Europe
- In addition, the animal feed sector is increasingly adopting butyric acid as a natural growth promoter and gut health enhancer, especially after EU regulations limited the use of antibiotics as feed additives
- The growing trend towards bio-based and sustainable chemicals is encouraging manufacturers to invest in greener production methods, further boosting market growth in countries such as Germany, France, and Italy
Restraint/Challenge
“Supply Chain Volatility and Price Sensitivity Amid Regulatory Pressure”
- Fluctuations in raw material availability, such as corn or sugarcane used for bio-fermentation, and rising costs of sustainable production processes pose challenges for steady supply and pricing of butyric acid in Europe
- For instance, volatile agricultural commodity prices in late 2023 created cost pressures for several European manufacturers, causing concerns about product affordability for downstream industries
- In addition, strict environmental and safety regulations in the EU increase production compliance costs, which can raise the overall price of butyric acid products compared to synthetic alternatives
- While demand is rising, some price-sensitive sectors—particularly smaller animal feed producers—remain hesitant to fully switch to natural butyric acid due to cost concerns
- Overcoming these challenges will require process innovations to improve production efficiency, diversification of feedstock sources, and collaborative efforts to stabilize supply chains. Regulatory support for bio-based chemicals and consumer education on product benefits may also help offset price sensitivities
Butyric Acid Market Scope
The market is segmented on the basis of type, derivatives, and application.
By Type
On the basis of type, the butyric acid market is segmented into Natural Butyric Acid and Synthetic Butyric Acid. The natural butyric acid segment dominates the largest market revenue share in 2025, driven by growing demand for bio-based and sustainable products across food, pharmaceutical, and animal feed industries. Consumers and manufacturers increasingly prefer natural butyric acid due to its environmental benefits and clean-label status.
The synthetic butyric acid segment holds a steady share due to its cost-effectiveness and wide use as a chemical intermediate in various industrial applications.
By Derivatives
On the basis of derivatives, the butyric acid market is segmented into Sodium Butyrate, Calcium Butyrate, and Others. The sodium butyrate segment dominates with the largest market revenue share in 2025, attributed to its widespread use in animal feed as a natural growth promoter and gut health enhancer.
Calcium butyrate is anticipated to witness the fastest growth rate during the forecast period, owing to its stability and increasing application in food and pharmaceutical formulations. The others segment includes derivatives used in specialty chemicals such as perfumes, inks, paints, and coatings.
By Application
On the basis of application, the butyric acid market is segmented into Animal Feed, Chemical Intermediate, Food and Flavors, Pharmaceuticals, Perfumes, Inks, Paints and Coatings, and Others. The animal feed segment accounted for the largest market revenue share in 2024, driven by rising adoption of butyric acid as a natural additive replacing antibiotics and enhancing livestock health.
The food and flavors segment is expected to witness significant growth due to the increasing use of butyric acid as a natural flavoring and preservative agent. Pharmaceuticals also hold a considerable share, with growing research supporting the therapeutic benefits of butyric acid in treating various diseases.
Butyric Acid Market Regional Analysis.
U.K. Butyric Acid Market Insight
The U.K. butyric acid market is expected to grow steadily during the forecast period, driven by increasing demand from the animal feed industry and food & flavor applications. The growing focus on natural and sustainable ingredients in the pharmaceutical and food sectors is encouraging manufacturers to adopt natural butyric acid. Furthermore, rising awareness about gut health benefits and the use of sodium butyrate as a feed additive are significant growth factors. The U.K.’s strong regulatory framework and advanced manufacturing infrastructure support market expansion.
Germany Butyric Acid Market Insight
The German butyric acid market is anticipated to expand at a significant CAGR during the forecast period, supported by increasing industrial use of butyric acid derivatives in chemicals, paints, and coatings. Germany’s emphasis on sustainable chemical processes and bio-based products is fostering the growth of natural butyric acid applications. Additionally, the country’s robust pharmaceutical and animal feed industries contribute to rising demand for high-purity butyric acid and its salts. Growing consumer preference for eco-friendly and health-focused products is further accelerating market adoption.
France Butyric Acid Market Insight
The France butyric acid market is poised for notable growth, fueled by increasing use in the food and flavors sector, where butyric acid serves as a natural flavoring and preservative agent. Rising demand for sodium and calcium butyrate in animal nutrition, particularly for antibiotic-free feed additives, is also driving market expansion. The country’s growing pharmaceutical research activities focusing on butyric acid’s health benefits are contributing to steady market development. Government initiatives promoting sustainable agriculture and bio-based chemicals enhance market prospects
Butyric Acid Market Share
The butyric acid industry is primarily led by well-established companies, including:
- Green Biologics Limited (U.K.)
- Eastman Chemical Company (U.S.)
- Celanese Corporation (U.S.)
- Thermo Fisher Scientific Inc. (U.S.)
- Axxence Aromatic GmbH (Germany)
- Augustus Oils Ltd. (U.K.)
- Ennolys (A Subsidiary of Lesaffre Group) (France)
- ELiE Health Solutions (U.S.)
- Kemin Industries, Inc. (U.S.)
- OXEA GmbH (Germany)
- Perstorp Holding AB (Sweden)
- Treatt Plc (U.K.)
- Merck KGaA (Germany)
- Tokyo Chemical Industry Co., Ltd (Japan)
Latest Developments in Global Butyric Acid Market
- In March 2025, METEX NØØVISTA, a subsidiary of METABOLIC EXPLORER, and ALINOVA announced an agreement for the marketing of the first 100% bio-based butyric acid for animal nutrition in France. This partnership enables ALINOVA to expand its portfolio of performance-enhancing products to meet its customers’ needs for natural and sustainable ingredients
- In May 2024, NutraShure launched BIOMEnd, a form of butyrate designed to help solve palatability and solubility issues found with traditional butyrate ingredients. BIOMEnd contains L-Lysine Butyrate, the L-Lysine salt of butyric acid, which allows for complete solubility in a liquid solution, according to the company
- In May 2024, NutraShure Distribution, LLC. launched BIOMEnd, a new butyrate formulation designed to address solubility and palatability issues with traditional butyrate ingredients. BIOMEnd contains L-Lysine Butyrate, the l-lysine salt of butyric acid, which is superior in form and completely soluble in liquid solution, making it suitable for various supplement formats
- In March 2022, Perstorp expanded its innovative range of broiler feed solutions with the launch of Gastrivix Avi. It is a unique gut health solution combining the benefits of valeric and butyric acid
- In March 2022, METEX NØØVISTA and ALINOVA announced an agreement for the marketing in France of the first 100% bio-based butyric acid for animal nutrition made in France. This partnership will enable ALINOVA to grow its portfolio of technical, performance-enhancing products to meet its customers' natural and sustainable ingredients needs
SKU-

- Interactive Data Analysis Dashboard
- Company Analysis Dashboard for high growth potential opportunities
- Research Analyst Access for customization & queries
- Competitor Analysis with Interactive dashboard
- Latest News, Updates & Trend analysis
- Harness the Power of Benchmark Analysis for Comprehensive Competitor Tracking
Data collection and base year analysis are done using data collection modules with large sample sizes. The stage includes obtaining market information or related data through various sources and strategies. It includes examining and planning all the data acquired from the past in advance. It likewise envelops the examination of information inconsistencies seen across different information sources. The market data is analysed and estimated using market statistical and coherent models. Also, market share analysis and key trend analysis are the major success factors in the market report. To know more, please request an analyst call or drop down your inquiry.
The key research methodology used by DBMR research team is data triangulation which involves data mining, analysis of the impact of data variables on the market and primary (industry expert) validation. Data models include Vendor Positioning Grid, Market Time Line Analysis, Market Overview and Guide, Company Positioning Grid, Patent Analysis, Pricing Analysis, Company Market Share Analysis, Standards of Measurement, Global versus Regional and Vendor Share Analysis. To know more about the research methodology, drop in an inquiry to speak to our industry experts.
Data Bridge Market Research is a leader in advanced formative research. We take pride in servicing our existing and new customers with data and analysis that match and suits their goal. The report can be customized to include price trend analysis of target brands understanding the market for additional countries (ask for the list of countries), clinical trial results data, literature review, refurbished market and product base analysis. Market analysis of target competitors can be analyzed from technology-based analysis to market portfolio strategies. We can add as many competitors that you require data about in the format and data style you are looking for. Our team of analysts can also provide you data in crude raw excel files pivot tables (Fact book) or can assist you in creating presentations from the data sets available in the report.


