
Europe Calcineurin Inhibitors Market
Market Size in USD Billion
 USD
2.09 Billion
USD
4.47 Billion
2024
2032
USD
2.09 Billion
USD
4.47 Billion
2024
2032
| 2025 - 2032 | |
| USD 2.09 Billion | |
| USD 4.47 Billion | |
| % | |
Europe Calcineurin Inhibitors Market Analysis
Calcineurin Inhibitors (CNIs) have a significant history in the field of medicine, particularly in transplantation and immunology. The first CNI, cyclosporine, was discovered in the 1970s from a soil fungus and became a groundbreaking immunosuppressive agent after its introduction in clinical practice in the early 1980s for organ transplantation. It revolutionized transplant medicine by significantly improving graft survival rates. Following cyclosporine, tacrolimus was developed in the late 1980s, offering even more potent immunosuppressive effects. Both drugs inhibit the activity of calcineurin, an important enzyme in T-cell activation, effectively dampening the immune response. Over the years, these agents have been widely adopted for various autoimmune diseases and post-transplant management, shaping the landscape of modern immunotherapy and significantly enhancing outcomes for patients with organ transplants.
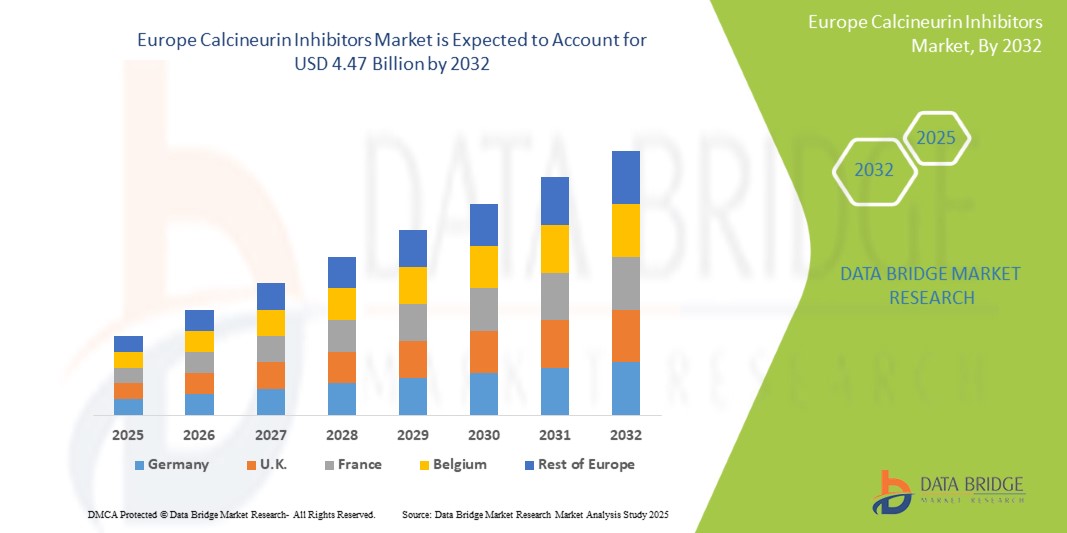
Europe Calcineurin Inhibitors Market Size
Europe calcineurin inhibitors market size was valued at USD 2.09 billion in 2024 and is projected to reach USD 4.47 billion by 2032, with a CAGR of 10.0% during the forecast period of 2025 to 2032. In addition to the insights on market scenarios such as market value, growth rate, segmentation, geographical coverage, and major players, the market reports curated by the Data Bridge Market Research also include import export analysis, production capacity overview, production consumption analysis, price trend analysis, climate change scenario, supply chain analysis, value chain analysis, raw material/consumables overview, vendor selection criteria, PESTLE Analysis, Porter Analysis, and regulatory framework.
Europe Calcineurin Inhibitors Market Trends
“The Increasing Demand For Targeted Therapies”
One significant trend in the Europe inhibitor market is the increasing demand for targeted therapies, particularly in oncology. As advancements in cancer research continue, inhibitors targeting specific molecular pathways have gained popularity due to their ability to precisely target cancer cells while minimizing damage to surrounding healthy tissues. This trend is driven by the growing understanding of cancer biology and the genetic mutations associated with various cancers. Targeted inhibitors, such as immune checkpoint inhibitors, are becoming central to cancer treatment regimens, offering patients more personalized and effective treatment options. Moreover, the shift towards precision medicine is driving the development of inhibitors that can address specific biomarkers, enhancing treatment outcomes. This trend is not only revolutionizing oncology but also extending to other therapeutic areas such as autoimmune diseases, cardiovascular conditions, and rare genetic disorders. As a result, the inhibitor market is expanding rapidly, with pharmaceutical companies investing heavily in research and development to bring new and innovative inhibitors to market, meeting the rising demand for more effective and tailored therapies.
Report Scope and Europe Calcineurin Inhibitors Market Segmentation
|
Attributes |
Europe Calcineurin Inhibitors Market Insights |
|
Segments Covered |
|
|
Region Covered |
Germany, France, U.K., Italy, Spain, Switzerland, Netherlands, Russia, Turkey, Belgium, Austria, Ireland, Norway, Poland, and Rest Of Europe |
|
Key Market Players |
Astellas Pharma US, Inc. (U.S.), Lupin (India), Viatris Inc. (U.S.), Glenmark Pharmaceuticals Inc. (U.S.), LEO Pharma Inc. (Denmark), Bausch Health Companies Inc. (Canada), AbbVie Inc. (U.S.), SANDOZ (Switzerland), Teva Pharmaceutical Industries Ltd. (Israel), RPG Life Sciences Limited (India), Dr. Reddy’s Laboratories Ltd. (India), Biocon (India), Apotex Inc. (Canada), Novaliq GmbH (Germany), Sun Pharmaceutical Industries Ltd. (India), and ZAMBON COMPANY S.P.A. (Italy) |
|
Market Opportunities |
|
|
Value Added Data Infosets |
In addition to the insights on market scenarios such as market value, growth rate, segmentation, geographical coverage, and major players, the market reports curated by the Data Bridge Market Research also include import export analysis, production capacity overview, production consumption analysis, price trend analysis, climate change scenario, supply chain analysis, value chain analysis, raw material/consumables overview, vendor selection criteria, PESTLE Analysis, Porter Analysis, and regulatory framework. |
Europe Calcineurin Inhibitors Market Definition
Calcineurin inhibitors are a class of pharmaceutical agents that selectively inhibit the activity of calcineurin, a calcium-dependent serine/threonine phosphatase involved in T-cell activation and immune response regulation. These medications, including cyclosporine and tacrolimus, are primarily used in the prevention of organ transplant rejection and the treatment of autoimmune diseases due to their immunosuppressive properties. By modulating the immune system, calcineurin inhibitors help reduce inflammation and prevent the body's rejection of transplanted tissues while also posing a risk of side effects such as increased susceptibility to infections and organ toxicity. As such, the market for calcineurin inhibitors is driven by the increasing incidences of organ transplants, the prevalence of autoimmune disorders, and ongoing research into their therapeutic applications.
Europe Calcineurin Inhibitors Market Dynamics
Drivers
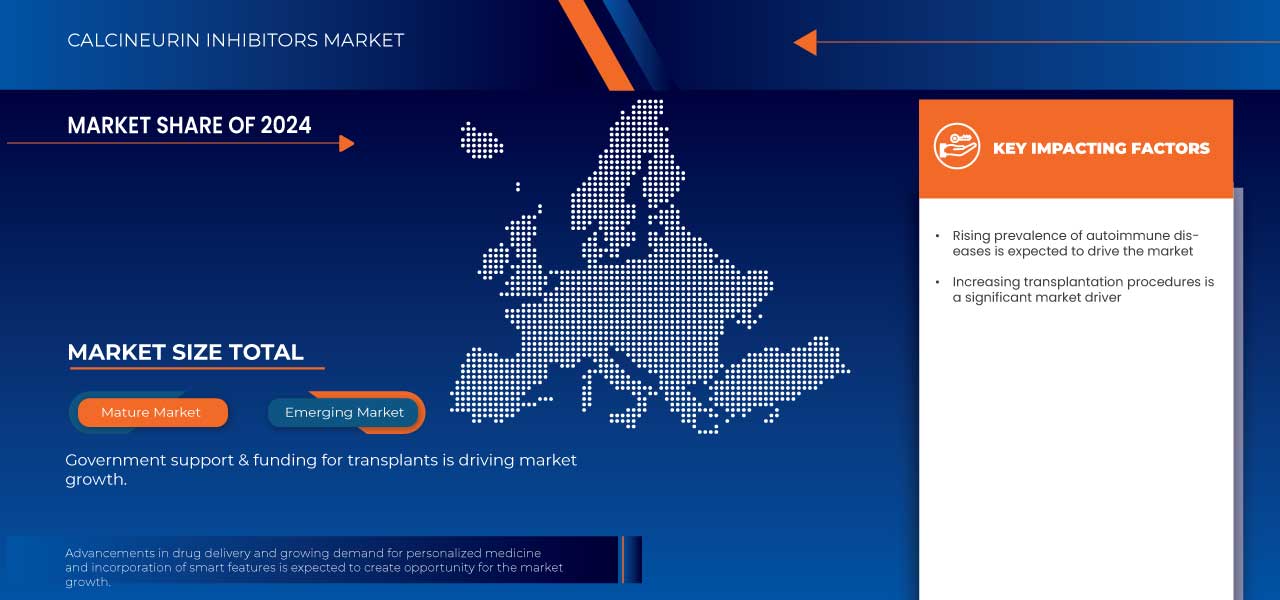
- Rising Prevalence of Autoimmune Diseases
The rising prevalence of autoimmune diseases, such as rheumatoid arthritis, psoriasis, and other chronic inflammatory conditions, is significantly contributing to the growing demand for calcineurin inhibitors in treatment regimens. Autoimmune diseases occur when the immune system mistakenly attacks the body’s own cells, leading to inflammation and tissue damage. In conditions like rheumatoid arthritis, psoriasis, and lupus, the immune system's overactivity needs to be controlled to prevent further damage to joints, skin, and other organs. Calcineurin inhibitors, by suppressing T-cell activation and modulating immune responses, are increasingly used as part of the treatment strategy for managing these disorders. With the Europe incidence of autoimmune diseases on the rise, fueled by factors such as genetic predisposition, environmental triggers, and lifestyle changes, the demand for effective immunosuppressive therapies like calcineurin inhibitors has escalated. These drugs play a crucial role in maintaining disease control, improving patients' quality of life, and reducing the risk of flare-ups, making them an essential part of therapeutic regimens. As the Europe burden of autoimmune diseases continues to grow, the increased reliance on calcineurin inhibitors to manage these conditions acts as a significant driver for the expansion of the market.
For instance,
- In June 2022, according to the article published by THE LANCLET, Autoimmune diseases affect around one in ten people, and their prevalence is steadily increasing, with varying rates across different conditions. Socioeconomic, seasonal, and regional factors point to environmental influences on disease development. Shared mechanisms among autoimmune diseases, particularly in connective tissue and endocrine disorders, drive the demand for treatments like calcineurin inhibitors, acting as a significant driver for the Europe market.
- In November 2022, according to the article published by NCBI, Multiple factors, including changes in diet, exposure to xenobiotics, air pollution, infections, lifestyle shifts, psychosocial stress, and climate change, are contributing to the rising prevalence of autoimmune diseases. This increase in autoimmune conditions is driving the demand for effective treatments like calcineurin inhibitors, which help manage inflammation and immune system activity, thus acting as a key driver for the Europe market.
The increasing prevalence of autoimmune diseases, including rheumatoid arthritis, psoriasis, and lupus, is driving the demand for calcineurin inhibitors in treatment plans. These disorders occur when the immune system attacks the body’s own tissues, causing chronic inflammation. Calcineurin inhibitors help suppress immune system activity, making them valuable in managing autoimmune conditions by reducing inflammation and preventing further damage. As autoimmune diseases become more common due to factors like genetics, environmental influences, and lifestyle, the need for effective immunosuppressive treatments grows. Calcineurin inhibitors are integral to controlling symptoms, improving patients' quality of life, and preventing flare-ups. This rising prevalence of autoimmune diseases plays a key role in fueling the growth of the Europe calcineurin inhibitors market.
- Increasing Transplantation Procedures
The increasing number of organ transplant procedures worldwide, driven by the rising prevalence of chronic diseases such as kidney failure, liver cirrhosis, heart disease, and diabetes, is significantly boosting the demand for calcineurin inhibitors. Organ transplantation has become a critical medical solution for patients with end-stage organ failure, and effective immunosuppressive therapy is essential to prevent organ rejection following transplantation. Calcineurin inhibitors, including cyclosporine and tacrolimus, play a pivotal role in suppressing the immune system’s response, reducing the risk of transplant rejection and promoting graft survival. With advancements in transplant medicine, better surgical techniques, and improved post-transplant care, the success rates of organ transplants have increased, further driving the need for potent immunosuppressive drugs. In addition, the growing demand for organ transplants in regions with aging populations and rising incidences of organ failure continues to expand the market for calcineurin inhibitors. This surge in transplant procedures directly fuels the demand for calcineurin inhibitors, making it a key driver of market growth in the Europe immunosuppressive drugs sector.
For instance,
- In January 2024, according to the article published by Organ Procurement and Transplantation Network, In 2023, 46,632 organ transplants were performed, marking an 8.7% increase from 2022 and a 12.7% increase from 2021. Notably, 39,679 transplants were from deceased donors, setting a record for the eleventh consecutive year. This continued rise in transplant procedures drives the demand for calcineurin inhibitors, essential for preventing organ rejection, acting as a significant driver for the Europe market.
- In January 2023, according to the article published by United Network for Organ Sharing, In 2022, the United States saw 42,887 organ transplants, marking a 3.7% increase over 2021. This rise in transplant procedures reflects the growing need for effective immunosuppressive therapies to prevent organ rejection. As the number of transplants continues to grow, the demand for calcineurin inhibitors, which play a crucial role in transplant success, acts as a major driver for the Europe market.
The rising number of organ transplants due to chronic diseases like kidney failure, liver cirrhosis, heart disease, and diabetes is driving the demand for calcineurin inhibitors. These drugs are essential for preventing organ rejection after transplants by suppressing the immune system. As transplant success rates improve with advanced techniques, the need for effective immunosuppressive treatments increases, making calcineurin inhibitors a crucial driver for market growth.
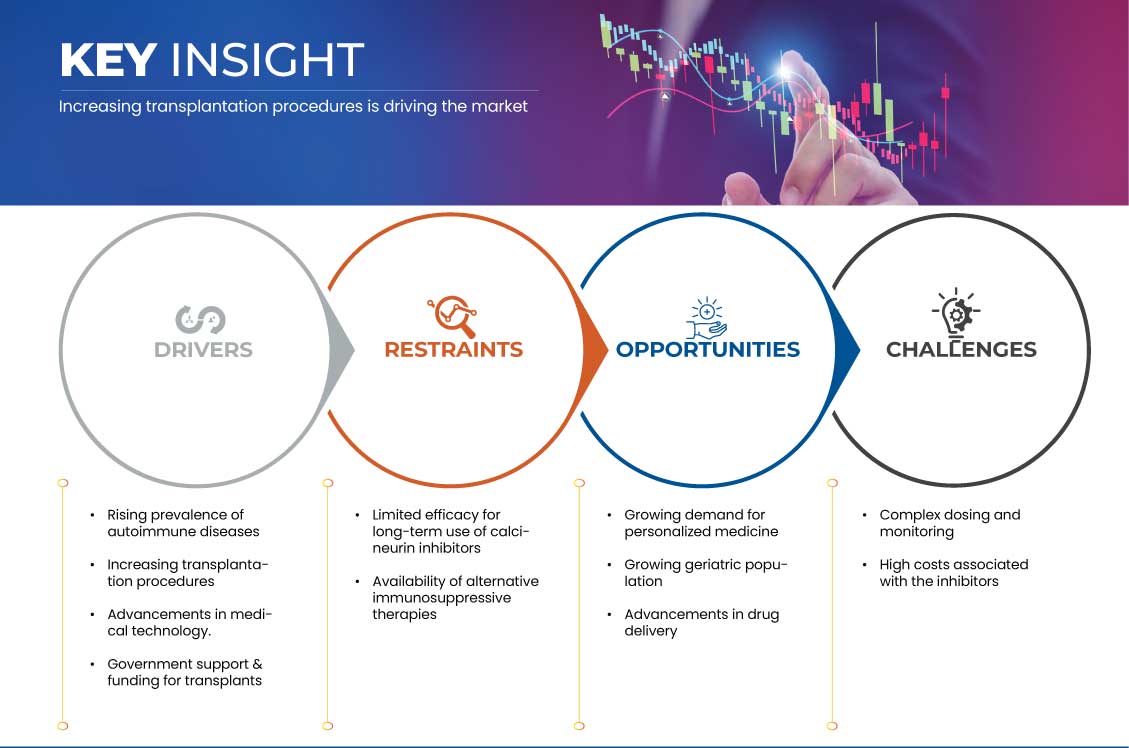
Opportunities
- Growing Demand for Personalized Medicine
The increasing demand for personalized medicine offers a substantial opportunity for the Europe calcineurin inhibitors market, as healthcare providers seek tailored treatment approaches that account for individual patient variability. Personalized medicine focuses on customizing drug therapies based on a patient’s genetic makeup, medical history, and specific disease characteristics. As calcineurin inhibitors are commonly used to manage autoimmune diseases and transplant rejection, their efficacy and safety vary significantly among patients. By developing personalized treatment plans that optimize the use of these immunosuppressive drugs, pharmaceutical companies can better meet the specific needs of patients, enhancing treatment outcomes and patient satisfaction.
For Instance
- According to a study published by Elsevier B.V., the growing demand for personalized medicine stems from the recognition of significant inter-individual variation in disease processes. Emerging technologies such as DNA sequencing, proteomics, and wireless monitoring enable tailored interventions based on an individual's unique genetic, physiological, environmental, and behavioral characteristics, promising more effective treatments and prevention strategies.
- In June 2020, a study published by MDPI highlighted that the growing demand for personalized medicine is driven by advancements in genomics and technology, enabling more precise treatments tailored to individual patients. This approach improves disease prevention, early detection, and targeted therapies, offering significant benefits in managing chronic diseases, reducing healthcare costs, and enhancing patient outcomes.
In addition, advancements in genetic profiling and biomarkers are paving the way for more precise dosing and monitoring strategies for calcineurin inhibitors. This trend aligns with the broader shift within the healthcare industry towards evidence-based and patient-centered care. As clinicians become increasingly equipped with tools to identify which patients are likely to respond best to calcineurin inhibitors, there is a growing potential to minimize adverse effects and improve efficacy. Consequently, innovations in personalized medicine can drive greater adoption of calcineurin inhibitors, positioning companies that focus on this approach for significant growth within the market.
- Growing Geriatric Population
The growing geriatric population represents a significant opportunity for the Europe calcineurin inhibitors market due to the increased prevalence of chronic diseases and autoimmune disorders among older adults. As individuals age, their immune systems often weaken, leading to a higher susceptibility to conditions that require immunosuppressive treatments, such as rheumatoid arthritis, lupus, and organ transplantation. This demographic shift creates a greater demand for effective therapeutic options, driving pharmaceutical companies to invest in the development and marketing of calcineurin inhibitors tailored to meet the unique needs of the elderly population.
For instance,
- In December 2023, according to an article published by UNFPA India, the current elderly population of 153 million (aged 60 and above) is expected to reach a staggering 347 million by 2050. This increase, in turn, leads to an increased number of older patients getting affected by chronic diseases leading to the need for Calcineurin Inhibitors.
In addition, the healthcare infrastructure is evolving to better accommodate the needs of geriatric patients, including improved medication management and personalized care strategies. With advancements in medical technology and an emphasis on preventive care, there is a growing focus on optimizing treatment outcomes for older adults. By addressing the complexities associated with geriatric patients, such as polypharmacy and comorbidities, companies in the calcineurin inhibitors market have the opportunity to enhance patient adherence and overall effectiveness of treatment, thereby expanding their market presence and driving revenue growth in this lucrative segment.
Restraints/Challenges
- Limited Efficacy for Long-Term Use of Calcineurin Inhibitors
The long-term use of calcineurin inhibitors, while essential for preventing organ rejection after transplantation, is associated with several significant complications that hinder their appeal for chronic use. Prolonged exposure to these drugs often results in nephrotoxicity, where kidney function deteriorates, increasing the risk of kidney failure. In addition, extended use has been linked to a higher incidence of cancers, particularly skin cancer and lymphomas, due to their immune-suppressing effects. These severe side effects make long-term adherence to calcineurin inhibitor treatment challenging for patients, as the risks of organ damage and cancer become more pronounced over time. For chronic conditions requiring continuous immunosuppression, such as autoimmune diseases or organ transplants, the limited long-term efficacy of calcineurin inhibitors reduces their attractiveness as a preferred treatment. This limitation in their safe and effective use over prolonged periods acts as a restraint for the Europe market, as patients and healthcare providers seek alternatives with better long-term safety profiles.
For instance,
- In January 2020, according to the article published by NCBI, The use of calcineurin inhibitors (CNI) can result in various toxicities, leading to both acute and chronic kidney injury, electrolyte imbalances, and adverse effects on the endocrine, nervous, and cardiovascular systems. These serious complications, especially with long-term use, limit their safety and effectiveness in chronic conditions, acting as a significant restraint on the Europe calcineurin inhibitors market.
- In August 2021, according to the article published by MDPI, Calcineurin inhibitors (CNIs) are linked to several side effects, including nephrotoxicity, hypertension, gingival hyperplasia, hypertrichosis, hepatotoxicity, hyperkalemia, and neurotoxicity. These adverse effects, particularly with prolonged use, limit their long-term efficacy and safety, making them less desirable for chronic treatment. This limitation in their long-term use acts as a significant restraint on the Europe calcineurin inhibitors market.
Long-term use of calcineurin inhibitors, essential for preventing transplant rejection, leads to serious complications such as kidney damage and an increased risk of cancers, including skin cancer and lymphomas. These side effects make prolonged use challenging for patients, particularly in chronic conditions. The limited safety and effectiveness over time reduce their appeal, acting as a restraint for the Europe market as patients and doctors seek safer alternatives.
- Availability of Alternative Immunosuppressive Therapies
The availability of alternative immunosuppressive therapies presents a significant challenge to the Europe calcineurin inhibitors market. The development of biologics and newer immunosuppressants with fewer side effects offers patients and healthcare providers options that are safer and more effective, particularly for long-term use. These alternatives, such as monoclonal antibodies and Janus kinase inhibitors, are designed to target specific pathways in the immune system, reducing the risk of broad immunosuppression and minimizing side effects like nephrotoxicity, hypertension, and cancer. As these therapies continue to improve in both efficacy and safety, they are increasingly preferred over traditional calcineurin inhibitors, especially in chronic conditions and organ transplants. The availability of these advanced treatments directly reduces the demand for calcineurin inhibitors, acting as a key restraint to market growth and limiting their use in the broader immunosuppressive drug market.
For Instance,
- In August 2024, according to the article published by Cleveland Clinic, Biologics effectively manage chronic inflammation and pain, reducing the reliance on corticosteroids, which lose efficacy and increase side effects over time. Unlike non-biologic immunosuppressants, biologics are more selective, targeting specific inflammatory pathways without broadly suppressing the immune system. This improved efficacy and safety profile make biologics a preferred option, posing a restraint to the demand for calcineurin inhibitors in the market.
- In December 2023, according to the article published by American Cancer Society, Naked monoclonal antibodies (mAbs) typically have fewer serious side effects compared to chemotherapy drugs, offering a safer alternative for immunosuppressive therapy. Their targeted action reduces overall immune suppression, minimizing adverse effects. This improved safety and efficacy make naked mAbs an attractive option, thereby limiting the demand for calcineurin inhibitors and acting as a restraint for the Europe market.
The rise of alternative immunosuppressive therapies, such as biologics and newer drugs with fewer side effects, poses a significant challenge to the calcineurin inhibitors market. These alternatives target specific immune pathways, offering improved safety and efficacy, particularly for long-term use. As such therapies gain preference, the demand for calcineurin inhibitors decreases, acting as a restraint to market growth.
Europe Calcineurin Inhibitors Market Scope
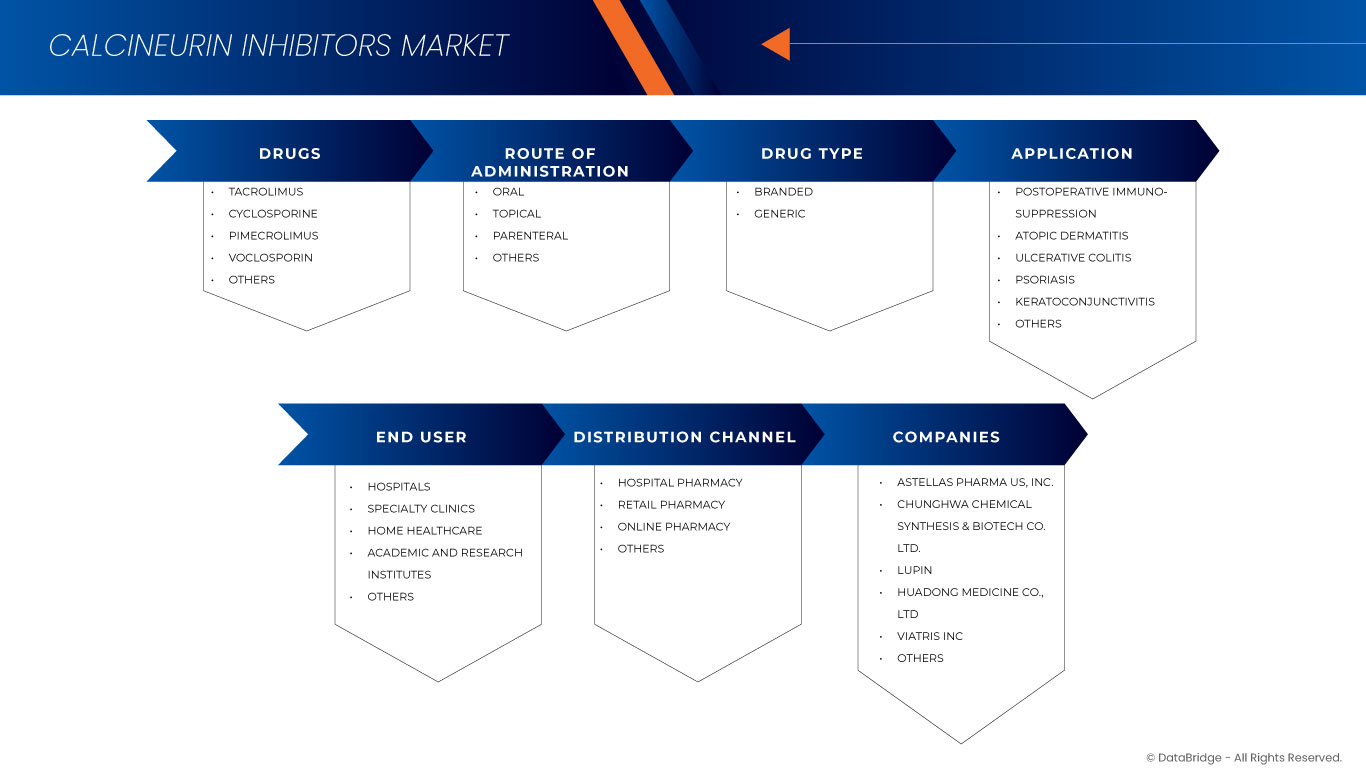
The market is segmented on the basis of by drugs, route of administration, drug type, application, end user, and distribution channel. The growth amongst these segments will help you analyze meagre growth segments in the industries and provide the users with a valuable market overview and market insights to help them make strategic decisions for identifying core market applications.
Drugs
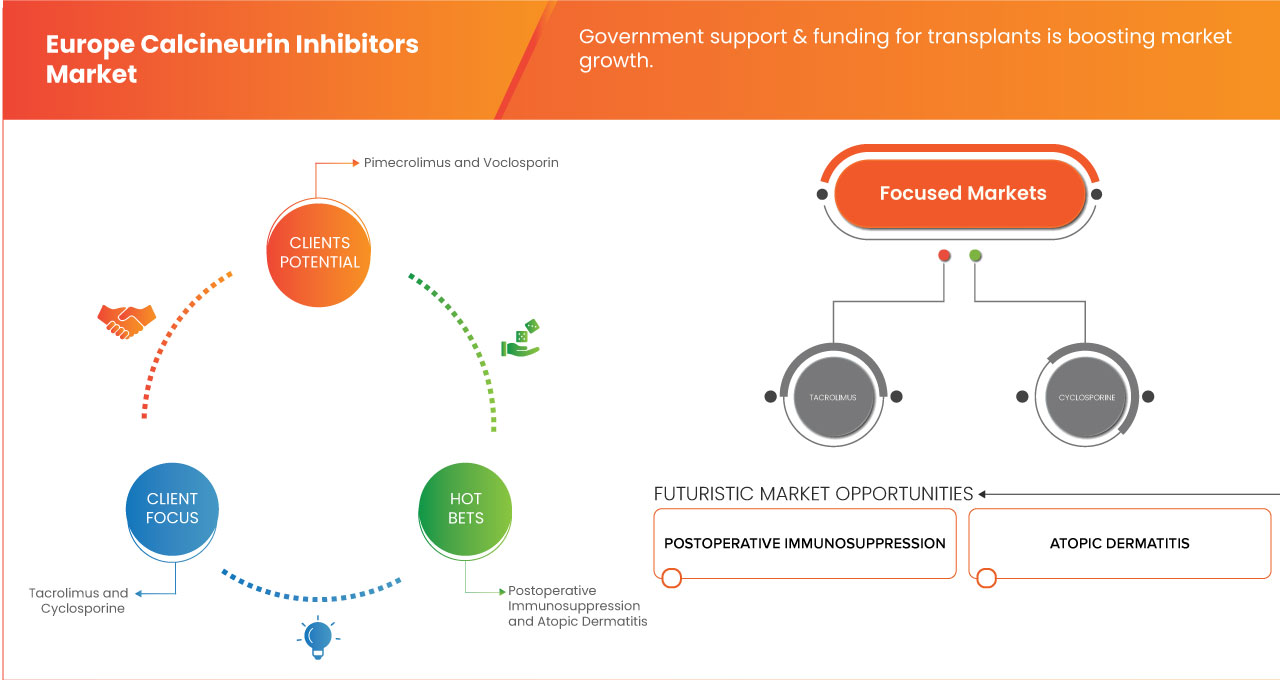
- Tacrolimus
- By Dosage Form
- Capsules
- Tablets
- Injections
- Granules For Oral Suspension
- By Drug Type
- Branded
- Prograf
- Astagraf Xl
- Envarsus Xr
- Other
- Generic
- Branded
- By Strength
- 0.5 Mg
- 1 Mg
- 5 Mg
- By Age Group
- Adult
- Geriatric
- Pediatric
- By Dosage Form
- Cyclosporine
- By Drug Type
- Branded
- Neoral
- Sandimmune
- Gengraf
- Others
- Generic
- Branded
- By Dosage Form
- Capsules
- Oral Solution
- Tablets
- Injection
- Others
- By Strength
- 100 Mg
- 25 Mg
- 50 Mg
- By Age Group
- Adult
- Geriatric
- Pediatric
- By Drug Type
- Pimecrolimus (Topical Cream)
- By Drug Type
- Branded
- Elidel
- Others
- Generic
- Branded
- By Age Group
- Adult
- Geriatric
- Pediatric
- By Drug Type
- Voclosporin (Oral Capsule)
- Others
Route Of Administration
- Oral
- Capsule
- Tablet
- Solution
- Topical
- Parenteral
- Others
Drug Type
- Branded
- Generic
Application
- Postoperative Immunosuppression
- Branded
- Generic
- Atopic Dermatitiss
- Branded
- Generic
- Ulcerative Colitis
- Branded
- Generic
- Psoriasis
- Branded
- Generic
- Keratoconjunctivitis
- Branded
- Generic
- Others
- Branded
- Generic
End User
- Hospitals
- By Type
- Public
- Private
- By Level
- Tier 3
- Tier 2
- Tier 1
- By Type
- Specialty Clinics
- Home Healthcare
- Academic And Research Institutes
- Others
Distribution Channel
- Hospital Pharmacy
- Retail Pharmacy
- Online Pharmacy
- Others
Europe Calcineurin Inhibitors Market Regional Analysis
The market is analyzed and market size insights and trends are provided by country, drugs, route of administration, drug type, application, end user, and distribution channel as referenced above.
The countries covered in the market are Germany, France, U.K., Italy, Spain, Switzerland, Netherlands, Russia, Turkey, Belgium, Austria, Ireland, Norway, Poland, and rest Of Europe.
Germany is the highest growing due to its advanced healthcare infrastructure, high adoption of immunosuppressive therapies, significant research and development investments, and a large organ transplant patient population and is expected to be the fastest growing due to due to increasing healthcare infrastructure, rising prevalence of autoimmune diseases, and growing awareness about advanced therapies.
The country section of the report also provides individual market impacting factors and changes in regulation in the market domestically that impacts the current and future trends of the market. Data points like down-stream and upstream value chain analysis, technical trends and porter's five forces analysis, case studies are some of the pointers used to forecast the market scenario for individual countries. Also, the presence and availability of Europe brands and their challenges faced due to large or scarce competition from local and domestic brands, impact of domestic tariffs and trade routes are considered while providing forecast analysis of the country data.
Europe Calcineurin Inhibitors MarketShare
The market competitive landscape provides details by competitor. Details included are company overview, company financials, revenue generated, market potential, investment in research and development, new market initiatives, Europe presence, production sites and facilities, production capacities, company strengths and weaknesses, product launch, product width and breadth, application dominance. The above data points provided are only related to the companies' focus related to market.
Europe Calcineurin Inhibitors Market Leaders Operating in the Market Are:
- Astellas Pharma US, Inc. (U.S.)
- Lupin (India)
- Viatris Inc. (U.S.)
- Glenmark Pharmaceuticals Inc. (U.S.)
- LEO Pharma Inc. (Denmark)
- Bausch Health Companies Inc. (Canada)
- AbbVie Inc. (U.S.)
- SANDOZ (Switzerland)
- Teva Pharmaceutical Industries Ltd. (Israel)
- RPG Life Sciences Limited (India)
- Dr. Reddy’s Laboratories Ltd. (India)
- Biocon (India)
- Apotex Inc. (Canada)
- Novaliq GmbH (Germany)
- Sun Pharmaceutical Industries Ltd. (India)
- ZAMBON COMPANY S.P.A. (Italy)
Latest Developments in Europe Calcineurin Inhibitors Market
- In November 2024, Astellas opened two advanced innovation centers in the U.S.—the West Coast Innovation Center in South San Francisco and the Life Sciences Center in Cambridge. These facilities aim to foster collaboration, scientific progress, and new treatments for Europe patients
- In October 2024, Viatris announced an exclusive licensing agreement with Lexicon Pharmaceuticals for sotagliflozin in all markets outside the U.S. and Europe. Approved by the FDA in 2023, the agreement expanded Viatris' cardiovascular portfolio, leveraging its Europe infrastructure to address unmet medical needs
- In January 2023, Viatris completed its acquisition of Oyster Point Pharma and Famy Life Sciences, forming the new Viatris Eye Care Division. Jeffrey Nau, former CEO of Oyster Point Pharma, led the division, aiming to expand their portfolio and create a Europe eye care leader
- In October 2024, AbbVie has reached an agreement to acquire Aliada Therapeutics .The acquisition includes Aliada's novel blood-brain barrier technology and its lead candidate, ALIA-1758, an anti-amyloid antibody for Alzheimer's treatment
- In April 2024, AbbVie has completed its acquisition of Cerevel Therapeutics, enhancing its neuroscience portfolio. The acquisition includes Cerevel’s promising clinical-stage assets like Emraclidine for schizophrenia and Tavapadon for Parkinson's disease, strengthening AbbVie’s position in neurology and psychiatry
SKU-

- Interactive Data Analysis Dashboard
- Company Analysis Dashboard for high growth potential opportunities
- Research Analyst Access for customization & queries
- Competitor Analysis with Interactive dashboard
- Latest News, Updates & Trend analysis
- Harness the Power of Benchmark Analysis for Comprehensive Competitor Tracking
Table of Content
1 INTRODUCTION
1.1 OBJECTIVES OF THE STUDY
1.2 MARKET DEFINITION
1.3 OVERVIEW OF THE EUROPE CALCINEURIN INHIBITORS MARKET
1.4 CURRENCY AND PRICING
1.5 LIMITATIONS
1.6 MARKETS COVERED
2 MARKET SEGMENTATION
2.1 MARKETS COVERED
2.2 GEOGRAPHICAL SCOPE
2.3 YEARS CONSIDERED FOR THE STUDY
2.4 DBMR TRIPOD DATA VALIDATION MODEL
2.5 PRIMARY INTERVIEWS WITH KEY OPINION LEADERS
2.6 MULTIVARIATE MODELLING
2.7 DBMR MARKET POSITION GRID
2.8 VENDOR SHARE ANALYSIS
2.9 SECONDARY SOURCES
2.1 ASSUMPTIONS
3 EXECUTIVE SUMMARY
4 PREMIUM INSIGHTS
4.1 PESTEL ANALYSIS
4.2 PORTER’S FIVE FORCES
5 EUROPE CALCINEURIN INHIBITORS MARKET: REGULATIONS
5.1 REGULATORY AUTHORITIES IN EUROPE
5.1.1 GERMANY:
5.1.2 UNITED KINGDOM:
5.1.3 FRANCE:
5.1.4 ITALY:
5.1.5 SPAIN:
6 MARKET OVERVIEW
6.1 DRIVERS
6.1.1 RISING PREVALENCE OF AUTOIMMUNE DISEASES
6.1.2 INCREASING TRANSPLANTATION PROCEDURES
6.1.3 ADVANCEMENTS IN MEDICAL TECHNOLOGY
6.1.4 GOVERNMENT SUPPORT & FUNDING FOR TRANSPLANTS
6.2 RESTRAINTS
6.2.1 LIMITED EFFICACY FOR LONG-TERM USE OF CALCINEURIN INHIBITORS
6.2.2 AVAILABILITY OF ALTERNATIVE IMMUNOSUPPRESSIVE THERAPIES
6.3 OPPORTUNITIES
6.3.1 GROWING DEMAND FOR PERSONALIZED MEDICINE
6.3.2 GROWING GERIATRIC POPULATION
6.3.3 ADVANCEMENTS IN DRUG DELIVERY
6.4 CHALLENGES
6.4.1 COMPLEX DOSING AND MONITORING
6.4.2 HIGH COSTS ASSOCIATED WITH THE INHIBITORS
7 EUROPE CALCINEURIN INHIBITORS MARKET, BY DRUG TYPE
7.1 OVERVIEW
7.2 GENERIC
7.2.1 POSTOPERATIVE IMMUNOSUPPRESSION
7.2.2 ATOPIC DERMATITIS
7.2.3 ULCERATIVE COLITIS
7.2.4 PSORIASIS
7.2.5 KERATOCONJUNCTIVITIS
7.2.6 OTHERS
7.3 BRANDED
7.3.1 POSTOPERATIVE IMMUNOSUPPRESSION
7.3.2 ATOPIC DERMATITIS
7.3.3 ULCERATIVE COLITIS
7.3.4 PSORIASIS
7.3.5 KERATOCONJUNCTIVITIS
7.3.6 OTHERS
8 EUROPE CALCINEURIN INHIBITORS MARKET, BY DRUGS
8.1 OVERVIEW
8.2 TACROLIMUS
8.2.1 GENERIC
8.2.2 BRANDED
8.2.2.1 PROGRAF
8.2.2.2 ASTAGRAF XL
8.2.2.3 ENVARSUS XR
8.2.2.4 OTHER
8.2.2.4.1 CAPSULES
8.2.2.4.2 TABLETS
8.2.2.4.3 INJECTIONS
8.2.2.4.4 GRANULES FOR ORAL SUSPENSION
8.2.2.4.4.1 1 MG
8.2.2.4.4.2 0.5 MG
8.2.2.4.4.3 5 MG
8.2.2.4.4.4 OTHERS
8.2.2.4.4.4.1 ADULT
8.2.2.4.4.4.2 GERIATRIC
8.2.2.4.4.4.3 PEDIATRIC
8.3 CYCLOSPORINE
8.3.1 GENERIC
8.3.2 BRANDED
8.3.2.1 NEORAL
8.3.2.2 SANDIMMUNE
8.3.2.3 GENGRAF
8.3.2.4 OTHERS
8.3.2.4.1 CAPSULES
8.3.2.4.2 ORAL SOLUTION
8.3.2.4.3 INJECTION
8.3.2.4.4 OTHERS
8.3.2.4.4.1 100 MG
8.3.2.4.4.2 25 MG
8.3.2.4.4.3 50 MG
8.3.2.4.4.4 OTHERS
8.3.2.4.4.4.1 ADULT
8.3.2.4.4.4.2 PEDIATRIC
8.3.2.4.4.4.3 GERIATRIC
8.4 PIMECROLIMUS (TOPICAL CREAM)
8.4.1 GENERIC
8.4.2 BRANDED
8.4.2.1 ADULT
8.4.2.2 GERIATRIC
8.4.2.3 PEDIATRIC
8.5 VOCLOSPORIN (ORAL CAPSULE)
8.6 OTHERS
8.6.1 GENERIC
8.6.2 BRANDED
9 EUROPE CALCINEURIN INHIBITORS MARKET, BY ROUTE OF ADMINISTRATION
9.1 OVERVIEW
9.2 ORAL
9.2.1 CAPSULE
9.2.2 TABLET
9.2.3 SOLUTION
9.3 TOPICAL
9.4 PARENTERAL
9.5 OTHERS
10 EUROPE CALCINEURIN INHIBITORS MARKET, BY APPLICATION
10.1 OVERVIEW
10.2 POSTOPERATIVE IMMUNOSUPPRESSION
10.3 ATOPIC DERMATITIS
10.4 ULCERATIVE COLITIS
10.5 PSORIASIS
10.6 KERATOCONJUNCTIVITIS
10.7 OTHERS
11 EUROPE CALCINEURIN INHIBITORS MARKET, BY END USER
11.1 OVERVIEW
11.2 HOSPITALS
11.3 SPECIALTY CLINICS
11.4 HOME HEALTHCARE
11.5 ACADEMIC AND RESEARCH INSTITUTES
11.6 OTHERS
12 EUROPE CALCINEURIN INHIBITORS MARKET, BY DISTRIBUTION CHANNEL
12.1 OVERVIEW
12.2 HOSPITAL PHARMACY
12.3 RETAIL PHARMACY
12.4 ONLINE PHARMACY
12.5 OTHERS
13 EUROPE CALCINEURIN INHIBITORS MARKET, BY COUNTRY
13.1 EUROPE
14 EUROPE CALCINEURIN INHIBITORS MARKET, COMPANY LANDSCAPE
14.1 COMPANY SHARE ANALYSIS: EUROPE
15 SWOT ANALYSIS
16 COMPANY PROFILES
16.1 ASTELLAS PHARMA US, INC.
16.1.1 COMPANY SNAPSHOT
16.1.2 REVENUE ANALYSIS
16.1.3 PRODUCT PORTFOLIO
16.1.4 RECENT DEVELOPMENT
16.2 CHUNGHWA CHEMICAL SYNTHESIS & BIOTECH CO., LTD
16.2.1 COMPANY SNAPSHOT
16.2.2 REVENUE ANALYSIS
16.2.3 PRODUCT PORTFOLIO
16.2.4 RECENT DEVELOPMENT
16.3 LUPIN
16.3.1 COMPANY SNAPSHOT
16.3.2 REVENUE ANALYSIS
16.3.3 PRODUCT PORTFOLIO
16.3.4 RECENT DEVELOPMENT
16.4 HUADONG MEDICINE CO.,LTD
16.4.1 COMPANY SNAPSHOT
16.4.2 REVENUE ANALYSIS
16.4.3 PRODUCT PORTFOLIO
16.4.4 RECENT DEVELOPMENT
16.5 VIATRIS INC.
16.5.1 COMPANY SNAPSHOT
16.5.2 REVENUE ANALYSIS
16.5.3 PRODUCT PORTFOLIO
16.5.4 RECENT DEVELOPMENT
16.6 ABBVIE INC
16.6.1 COMPANY SNAPSHOT
16.6.2 REVENUE ANALYSIS
16.6.3 PRODUCT PORTFOLIO
16.6.4 RECENT DEVELOPMENT
16.7 ACCORD HEALTHCARE US.
16.7.1 COMPANY SNAPSHOT
16.7.2 PRODUCT PORTFOLIO
16.7.3 RECENT DEVELOPMENT
16.8 ACTIZAPHARMA
16.8.1 COMPANY SNAPSHOT
16.8.2 PRODUCT PORTFOLIO
16.8.3 RECENT DEVELOPMENT
16.9 ADVACARE PHARMA
16.9.1 COMPANY SNAPSHOT
16.9.2 PRODUCT PORTFOLIO
16.9.3 RECENT DEVELOPMENT
16.1 BIOCON
16.10.1 COMPANY SNAPSHOT
16.10.2 REVENUE ANALYSIS
16.10.3 PRODUCT PORTFOLIO
16.10.4 RECENT DEVELOPMENT
16.11 BAUSCH HEALTH COMPANIES INC.
16.11.1 COMPANY SNAPSHOT
16.11.2 REVENUE ANALYSIS
16.11.3 PRODUCT PORTFOLIO
16.11.4 RECENT DEVELOPMENT
16.12 CONCORD BIOTECH
16.12.1 COMPANY SNAPSHOT
16.12.2 REVENUE ANALYSIS
16.12.3 PRODUCT PORTFOLIO
16.12.4 RECENT DEVELOPMENT
16.13 DR. REDDY’S LABORATORIES
16.13.1 COMPANY SNAPSHOT
16.13.2 REVENUE ANALYSIS
16.13.3 PRODUCT PORTFOLIO
16.13.4 RECENT DEVELOPMENT
16.14 GLENMARK PHARMACEUTICALS INC
16.14.1 COMPANY SNAPSHOT
16.14.2 REVENUE ANALYSIS
16.14.3 PRODUCT PORTFOLIO
16.14.4 RECENT DEVELOPMENT
16.15 LEO PHARMA INC.
16.15.1 COMPANY SNAPSHOT
16.15.2 PRODUCT PORTFOLIO
16.15.3 RECENT DEVELOPMENT
16.16 NOVARTIS AG
16.16.1 COMPANY SNAPSHOT
16.16.2 REVENUE ANALYSIS
16.16.3 PRODUCT PORTFOLIO
16.16.4 RECENT DEVELOPMENT
16.17 NOVALIQ GMBH
16.17.1 COMPANY SNAPSHOT
16.17.2 PRODUCT PORTFOLIO
16.17.3 RECENT DEVELOPMENT
16.18 RPG LIFE SCIENCES LIMITED
16.18.1 COMPANY SNAPSHOT
16.18.2 REVENUE ANALYSIS
16.18.3 PRODUCT PORTFOLIO
16.18.4 RECENT DEVELOPMENT
16.19 VELOXIS PHARMACEUTICALS, INC.
16.19.1 COMPANY SNAPSHOT
16.19.2 REVENUE ANALYSIS
16.19.3 PRODUCT PORTFOLIO
16.19.4 RECENT DEVELOPMENT
16.2 ZHAOKE OPHTHALMOLOGY LIMITED
16.20.1 COMPANY SNAPSHOT
16.20.2 REVENUE ANALYSIS
16.20.3 PRODUCT PORTFOLIO
16.20.4 RECENT DEVELOPMENT
16.21 ZAMBON COMPANY S.P.A.
16.21.1 COMPANY SNAPSHOT
16.21.2 PRODUCT PORTFOLIO
16.21.3 RECENT DEVELOPMENT
17 QUESTIONNAIRE
18 RELATED REPORTS
List of Table
TABLE 1 EUROPE CALCINEURIN INHIBITORS MARKET, BY DRUG TYPE, 2018-2032 (USD MILLION)
TABLE 2 EUROPE GENERIC IN CALCINEURIN INHIBITORS MARKET, BY APPLICATION, 2018-2032 (USD MILLION)
TABLE 3 EUROPE BRANDED IN CALCINEURIN INHIBITORS MARKET, BY APPLICATION, 2018-2032 (USD MILLION)
TABLE 4 EUROPE CALCINEURIN INHIBITORS MARKET, BY DRUGS, 2018-2032 (USD MILLION)
TABLE 5 EUROPE TACROLIMUS IN CALCINEURIN INHIBITORS MARKET, BY DRUG TYPE, 2018-2032 (USD MILLION)
TABLE 6 EUROPE BRANDED IN CALCINEURIN INHIBITORS MARKET, BY TYPE, 2018-2032 (USD MILLION)
TABLE 7 EUROPE TACROLIMUS IN CALCINEURIN INHIBITORS MARKET, BY DOSAGE FORM, 2018-2032 (USD MILLION)
TABLE 8 EUROPE TACROLIMUS IN CALCINEURIN INHIBITORS MARKET, BY STRENGTH, 2018-2032 (USD MILLION)
TABLE 9 EUROPE TACROLIMUS IN CALCINEURIN INHIBITORS MARKET, BY AGE GROUP, 2018-2032 (USD MILLION)
TABLE 10 EUROPE CYCLOSPORINE IN CALCINEURIN INHIBITORS MARKET, BY DRUG TYPE, 2018-2032 (USD MILLION)
TABLE 11 EUROPE BRANDED IN CALCINEURIN INHIBITORS MARKET, BY TYPE, 2018-2032 (USD MILLION)
TABLE 12 EUROPE CYCLOSPORINE IN CALCINEURIN INHIBITORS MARKET, BY DOSAGE FORM, 2018-2032 (USD MILLION)
TABLE 13 EUROPE CYCLOSPORINE IN CALCINEURIN INHIBITORS MARKET, BY STRENGTH, 2018-2032 (USD MILLION)
TABLE 14 EUROPE CYCLOSPORINE IN CALCINEURIN INHIBITORS MARKET, BY AGE GROUP, 2018-2032 (USD MILLION)
TABLE 15 EUROPE PIMECROLIMUS (TOPICAL CREAM) IN CALCINEURIN INHIBITORS MARKET, BY DRUG TYPE, 2018-2032 (USD MILLION)
TABLE 16 EUROPE PIMECROLIMUS (TOPICAL CREAM) IN CALCINEURIN INHIBITORS MARKET, BY AGE GROUP, 2018-2032 (USD MILLION)
TABLE 17 EUROPE OTHERS IN CALCINEURIN INHIBITORS MARKET, BY DRUG TYPE, 2018-2032 (USD MILLION)
TABLE 18 EUROPE CALCINEURIN INHIBITORS MARKET, BY ROUTE OF ADMINISTRATION, 2018-2032 (USD MILLION)
TABLE 19 EUROPE ORAL IN CALCINEURIN INHIBITORS MARKET, BY TYPE, 2018-2032 (USD MILLION)
TABLE 20 EUROPE CALCINEURIN INHIBITORS MARKET, BY APPLICATION, 2018-2032 (USD MILLION)
TABLE 21 EUROPE CALCINEURIN INHIBITORS MARKET, BY END USER, 2018-2032 (USD MILLION)
TABLE 22 EUROPE HOSPITALS IN CALCINEURIN INHIBITORS MARKET, BY TYPE, 2018-2032 (USD MILLION)
TABLE 23 EUROPE HOSPITALS IN CALCINEURIN INHIBITORS MARKET, BY LEVEL, 2018-2032 (USD MILLION)
TABLE 24 EUROPE CALCINEURIN INHIBITORS MARKET, BY DISTRIBUTION CHANNEL, 2018-2032 (USD MILLION)
TABLE 25 EUROPE CALCINEURIN INHIBITORS MARKET, BY COUNTRY, 2018-2032 (USD MILLION)
TABLE 26 EUROPE CALCINEURIN INHIBITORS MARKET, BY DRUGS, 2018-2032 (USD MILLION)
TABLE 27 EUROPE TACROLIMUS IN CALCINEURIN INHIBITORS MARKET, BY DRUG TYPE, 2018-2032 (USD MILLION)
TABLE 28 EUROPE BRANDED IN CALCINEURIN INHIBITORS MARKET, BY TYPE, 2018-2032 (USD MILLION)
TABLE 29 EUROPE TACROLIMUS IN CALCINEURIN INHIBITORS MARKET, BY DOSAGE FORM, 2018-2032 (USD MILLION)
TABLE 30 EUROPE TACROLIMUS IN CALCINEURIN INHIBITORS MARKET, BY STRENGTH, 2018-2032 (USD MILLION)
TABLE 31 EUROPE TACROLIMUS IN CALCINEURIN INHIBITORS MARKET, BY AGE GROUP, 2018-2032 (USD MILLION)
TABLE 32 EUROPE CYCLOSPORINE IN CALCINEURIN INHIBITORS MARKET, BY DRUG TYPE, 2018-2032 (USD MILLION)
TABLE 33 EUROPE BRANDED IN CALCINEURIN INHIBITORS MARKET, BY TYPE, 2018-2032 (USD MILLION)
TABLE 34 EUROPE CYCLOSPORINE IN CALCINEURIN INHIBITORS MARKET, BY DOSAGE FORM, 2018-2032 (USD MILLION)
TABLE 35 EUROPE CYCLOSPORINE IN CALCINEURIN INHIBITORS MARKET, BY STRENGTH, 2018-2032 (USD MILLION)
TABLE 36 EUROPE CYCLOSPORINE IN CALCINEURIN INHIBITORS MARKET, BY AGE GROUP, 2018-2032 (USD MILLION)
TABLE 37 EUROPE PIMECROLIMUS (TOPICAL CREAM) IN CALCINEURIN INHIBITORS MARKET, BY DRUG TYPE, 2018-2032 (USD MILLION)
TABLE 38 EUROPE PIMECROLIMUS (TOPICAL CREAM) IN CALCINEURIN INHIBITORS MARKET, BY AGE GROUP, 2018-2032 (USD MILLION)
TABLE 39 EUROPE CALCINEURIN INHIBITORS MARKET, BY ROUTE OF ADMINISTRATION, 2018-2032 (USD MILLION)
TABLE 40 EUROPE ORAL IN CALCINEURIN INHIBITORS MARKET, BY TYPE, 2018-2032 (USD MILLION)
TABLE 41 EUROPE OTHERS IN CALCINEURIN INHIBITORS MARKET, BY DRUG TYPE, 2018-2032 (USD MILLION)
TABLE 42 EUROPE CALCINEURIN INHIBITORS MARKET, BY DRUG TYPE, 2018-2032 (USD MILLION)
TABLE 43 EUROPE GENERIC IN CALCINEURIN INHIBITORS MARKET, BY APPLICATION, 2018-2032 (USD MILLION)
TABLE 44 EUROPE BRANDED IN CALCINEURIN INHIBITORS MARKET, BY APPLICATION, 2018-2032 (USD MILLION)
TABLE 45 EUROPE CALCINEURIN INHIBITORS MARKET, BY APPLICATION, 2018-2032 (USD MILLION)
TABLE 46 EUROPE CALCINEURIN INHIBITORS MARKET, BY END USER, 2018-2032 (USD MILLION)
TABLE 47 EUROPE HOSPITALS IN CALCINEURIN INHIBITORS MARKET, BY TYPE, 2018-2032 (USD MILLION)
TABLE 48 EUROPE HOSPITALS IN CALCINEURIN INHIBITORS MARKET, BY LEVEL, 2018-2032 (USD MILLION)
TABLE 49 EUROPE CALCINEURIN INHIBITORS MARKET, BY DISTRIBUTION CHANNEL, 2018-2032 (USD MILLION)
TABLE 50 GERMANY CALCINEURIN INHIBITORS MARKET, BY DRUGS, 2018-2032 (USD MILLION)
TABLE 51 GERMANY TACROLIMUS IN CALCINEURIN INHIBITORS MARKET, BY DRUG TYPE, 2018-2032 (USD MILLION)
TABLE 52 GERMANY BRANDED IN CALCINEURIN INHIBITORS MARKET, BY TYPE, 2018-2032 (USD MILLION)
TABLE 53 GERMANY TACROLIMUS IN CALCINEURIN INHIBITORS MARKET, BY DOSAGE FORM, 2018-2032 (USD MILLION)
TABLE 54 GERMANY TACROLIMUS IN CALCINEURIN INHIBITORS MARKET, BY STRENGTH, 2018-2032 (USD MILLION)
TABLE 55 GERMANY TACROLIMUS IN CALCINEURIN INHIBITORS MARKET, BY AGE GROUP, 2018-2032 (USD MILLION)
TABLE 56 GERMANY CYCLOSPORINE IN CALCINEURIN INHIBITORS MARKET, BY DRUG TYPE, 2018-2032 (USD MILLION)
TABLE 57 GERMANY BRANDED IN CALCINEURIN INHIBITORS MARKET, BY TYPE, 2018-2032 (USD MILLION)
TABLE 58 GERMANY CYCLOSPORINE IN CALCINEURIN INHIBITORS MARKET, BY DOSAGE FORM, 2018-2032 (USD MILLION)
TABLE 59 GERMANY CYCLOSPORINE IN CALCINEURIN INHIBITORS MARKET, BY STRENGTH, 2018-2032 (USD MILLION)
TABLE 60 GERMANY CYCLOSPORINE IN CALCINEURIN INHIBITORS MARKET, BY AGE GROUP, 2018-2032 (USD MILLION)
TABLE 61 GERMANY PIMECROLIMUS (TOPICAL CREAM) IN CALCINEURIN INHIBITORS MARKET, BY DRUG TYPE, 2018-2032 (USD MILLION)
TABLE 62 GERMANY PIMECROLIMUS (TOPICAL CREAM) IN CALCINEURIN INHIBITORS MARKET, BY AGE GROUP, 2018-2032 (USD MILLION)
TABLE 63 GERMANY CALCINEURIN INHIBITORS MARKET, BY ROUTE OF ADMINISTRATION, 2018-2032 (USD MILLION)
TABLE 64 GERMANY ORAL IN CALCINEURIN INHIBITORS MARKET, BY TYPE, 2018-2032 (USD MILLION)
TABLE 65 GERMANY OTHERS IN CALCINEURIN INHIBITORS MARKET, BY DRUG TYPE, 2018-2032 (USD MILLION)
TABLE 66 GERMANY CALCINEURIN INHIBITORS MARKET, BY DRUG TYPE, 2018-2032 (USD MILLION)
TABLE 67 GERMANY GENERIC IN CALCINEURIN INHIBITORS MARKET, BY APPLICATION, 2018-2032 (USD MILLION)
TABLE 68 GERMANY BRANDED IN CALCINEURIN INHIBITORS MARKET, BY APPLICATION, 2018-2032 (USD MILLION)
TABLE 69 GERMANY CALCINEURIN INHIBITORS MARKET, BY APPLICATION, 2018-2032 (USD MILLION)
TABLE 70 GERMANY CALCINEURIN INHIBITORS MARKET, BY END USER, 2018-2032 (USD MILLION)
TABLE 71 GERMANY HOSPITALS IN CALCINEURIN INHIBITORS MARKET, BY TYPE, 2018-2032 (USD MILLION)
TABLE 72 GERMANY HOSPITALS IN CALCINEURIN INHIBITORS MARKET, BY LEVEL, 2018-2032 (USD MILLION)
TABLE 73 GERMANY CALCINEURIN INHIBITORS MARKET, BY DISTRIBUTION CHANNEL, 2018-2032 (USD MILLION)
TABLE 74 FRANCE CALCINEURIN INHIBITORS MARKET, BY DRUGS, 2018-2032 (USD MILLION)
TABLE 75 FRANCE TACROLIMUS IN CALCINEURIN INHIBITORS MARKET, BY DRUG TYPE, 2018-2032 (USD MILLION)
TABLE 76 FRANCE GENERIC IN CALCINEURIN INHIBITORS MARKET, BY TYPE, 2018-2032 (USD MILLION)
TABLE 77 FRANCE TACROLIMUS IN CALCINEURIN INHIBITORS MARKET, BY DOSAGE FORM, 2018-2032 (USD MILLION)
TABLE 78 FRANCE TACROLIMUS IN CALCINEURIN INHIBITORS MARKET, BY STRENGTH, 2018-2032 (USD MILLION)
TABLE 79 FRANCE TACROLIMUS IN CALCINEURIN INHIBITORS MARKET, BY AGE GROUP, 2018-2032 (USD MILLION)
TABLE 80 FRANCE CYCLOSPORINE IN CALCINEURIN INHIBITORS MARKET, BY DRUG TYPE, 2018-2032 (USD MILLION)
TABLE 81 FRANCE BRANDED IN CALCINEURIN INHIBITORS MARKET, BY TYPE, 2018-2032 (USD MILLION)
TABLE 82 FRANCE CYCLOSPORINE IN CALCINEURIN INHIBITORS MARKET, BY DOSAGE FORM, 2018-2032 (USD MILLION)
TABLE 83 FRANCE CYCLOSPORINE IN CALCINEURIN INHIBITORS MARKET, BY STRENGTH, 2018-2032 (USD MILLION)
TABLE 84 FRANCE CYCLOSPORINE IN CALCINEURIN INHIBITORS MARKET, BY AGE GROUP, 2018-2032 (USD MILLION)
TABLE 85 FRANCE PIMECROLIMUS (TOPICAL CREAM) IN CALCINEURIN INHIBITORS MARKET, BY DRUG TYPE, 2018-2032 (USD MILLION)
TABLE 86 FRANCE PIMECROLIMUS (TOPICAL CREAM) IN CALCINEURIN INHIBITORS MARKET, BY AGE GROUP, 2018-2032 (USD MILLION)
TABLE 87 FRANCE CALCINEURIN INHIBITORS MARKET, BY ROUTE OF ADMINISTRATION, 2018-2032 (USD MILLION)
TABLE 88 FRANCE ORAL IN CALCINEURIN INHIBITORS MARKET, BY TYPE, 2018-2032 (USD MILLION)
TABLE 89 FRANCE OTHERS IN CALCINEURIN INHIBITORS MARKET, BY DRUG TYPE, 2018-2032 (USD MILLION)
TABLE 90 FRANCE CALCINEURIN INHIBITORS MARKET, BY DRUG TYPE, 2018-2032 (USD MILLION)
TABLE 91 FRANCE GENERIC IN CALCINEURIN INHIBITORS MARKET, BY APPLICATION, 2018-2032 (USD MILLION)
TABLE 92 FRANCE BRANDED IN CALCINEURIN INHIBITORS MARKET, BY APPLICATION, 2018-2032 (USD MILLION)
TABLE 93 FRANCE CALCINEURIN INHIBITORS MARKET, BY APPLICATION, 2018-2032 (USD MILLION)
TABLE 94 FRANCE CALCINEURIN INHIBITORS MARKET, BY END USER, 2018-2032 (USD MILLION)
TABLE 95 FRANCE HOSPITALS IN CALCINEURIN INHIBITORS MARKET, BY TYPE, 2018-2032 (USD MILLION)
TABLE 96 FRANCE HOSPITALS IN CALCINEURIN INHIBITORS MARKET, BY LEVEL, 2018-2032 (USD MILLION)
TABLE 97 FRANCE CALCINEURIN INHIBITORS MARKET, BY DISTRIBUTION CHANNEL, 2018-2032 (USD MILLION)
TABLE 98 U.K. CALCINEURIN INHIBITORS MARKET, BY DRUGS, 2018-2032 (USD MILLION)
TABLE 99 U.K. TACROLIMUS IN CALCINEURIN INHIBITORS MARKET, BY DRUG TYPE, 2018-2032 (USD MILLION)
TABLE 100 U.K. BRANDED IN CALCINEURIN INHIBITORS MARKET, BY TYPE, 2018-2032 (USD MILLION)
TABLE 101 U.K. TACROLIMUS IN CALCINEURIN INHIBITORS MARKET, BY DOSAGE FORM, 2018-2032 (USD MILLION)
TABLE 102 U.K. TACROLIMUS IN CALCINEURIN INHIBITORS MARKET, BY STRENGTH, 2018-2032 (USD MILLION)
TABLE 103 U.K. TACROLIMUS IN CALCINEURIN INHIBITORS MARKET, BY AGE GROUP, 2018-2032 (USD MILLION)
TABLE 104 U.K. CYCLOSPORINE IN CALCINEURIN INHIBITORS MARKET, BY DRUG TYPE, 2018-2032 (USD MILLION)
TABLE 105 U.K. BRANDED IN CALCINEURIN INHIBITORS MARKET, BY TYPE, 2018-2032 (USD MILLION)
TABLE 106 U.K. CYCLOSPORINE IN CALCINEURIN INHIBITORS MARKET, BY DOSAGE FORM, 2018-2032 (USD MILLION)
TABLE 107 U.K. CYCLOSPORINE IN CALCINEURIN INHIBITORS MARKET, BY STRENGTH, 2018-2032 (USD MILLION)
TABLE 108 U.K. CYCLOSPORINE IN CALCINEURIN INHIBITORS MARKET, BY AGE GROUP, 2018-2032 (USD MILLION)
TABLE 109 U.K. PIMECROLIMUS (TOPICAL CREAM) IN CALCINEURIN INHIBITORS MARKET, BY DRUG TYPE, 2018-2032 (USD MILLION)
TABLE 110 U.K. PIMECROLIMUS (TOPICAL CREAM) IN CALCINEURIN INHIBITORS MARKET, BY AGE GROUP, 2018-2032 (USD MILLION)
TABLE 111 U.K. CALCINEURIN INHIBITORS MARKET, BY ROUTE OF ADMINISTRATION, 2018-2032 (USD MILLION)
TABLE 112 U.K. ORAL IN CALCINEURIN INHIBITORS MARKET, BY TYPE, 2018-2032 (USD MILLION)
TABLE 113 U.K. OTHERS IN CALCINEURIN INHIBITORS MARKET, BY DRUG TYPE, 2018-2032 (USD MILLION)
TABLE 114 U.K. CALCINEURIN INHIBITORS MARKET, BY DRUG TYPE, 2018-2032 (USD MILLION)
TABLE 115 U.K. GENERIC IN CALCINEURIN INHIBITORS MARKET, BY APPLICATION, 2018-2032 (USD MILLION)
TABLE 116 U.K. BRANDED IN CALCINEURIN INHIBITORS MARKET, BY APPLICATION, 2018-2032 (USD MILLION)
TABLE 117 U.K. CALCINEURIN INHIBITORS MARKET, BY APPLICATION, 2018-2032 (USD MILLION)
TABLE 118 U.K. CALCINEURIN INHIBITORS MARKET, BY END USER, 2018-2032 (USD MILLION)
TABLE 119 U.K. HOSPITALS IN CALCINEURIN INHIBITORS MARKET, BY TYPE, 2018-2032 (USD MILLION)
TABLE 120 U.K. HOSPITALS IN CALCINEURIN INHIBITORS MARKET, BY LEVEL, 2018-2032 (USD MILLION)
TABLE 121 U.K. CALCINEURIN INHIBITORS MARKET, BY DISTRIBUTION CHANNEL, 2018-2032 (USD MILLION)
TABLE 122 ITALY CALCINEURIN INHIBITORS MARKET, BY DRUGS, 2018-2032 (USD MILLION)
TABLE 123 ITALY TACROLIMUS IN CALCINEURIN INHIBITORS MARKET, BY DRUG TYPE, 2018-2032 (USD MILLION)
TABLE 124 ITALY BRANDED IN CALCINEURIN INHIBITORS MARKET, BY TYPE, 2018-2032 (USD MILLION)
TABLE 125 ITALY TACROLIMUS IN CALCINEURIN INHIBITORS MARKET, BY DOSAGE FORM, 2018-2032 (USD MILLION)
TABLE 126 ITALY TACROLIMUS IN CALCINEURIN INHIBITORS MARKET, BY STRENGTH, 2018-2032 (USD MILLION)
TABLE 127 ITALY TACROLIMUS IN CALCINEURIN INHIBITORS MARKET, BY AGE GROUP, 2018-2032 (USD MILLION)
TABLE 128 ITALY CYCLOSPORINE IN CALCINEURIN INHIBITORS MARKET, BY DRUG TYPE, 2018-2032 (USD MILLION)
TABLE 129 ITALY BRANDED IN CALCINEURIN INHIBITORS MARKET, BY TYPE, 2018-2032 (USD MILLION)
TABLE 130 ITALY CYCLOSPORINE IN CALCINEURIN INHIBITORS MARKET, BY DOSAGE FORM, 2018-2032 (USD MILLION)
TABLE 131 ITALY CYCLOSPORINE IN CALCINEURIN INHIBITORS MARKET, BY STRENGTH, 2018-2032 (USD MILLION)
TABLE 132 ITALY CYCLOSPORINE IN CALCINEURIN INHIBITORS MARKET, BY AGE GROUP, 2018-2032 (USD MILLION)
TABLE 133 ITALY PIMECROLIMUS (TOPICAL CREAM) IN CALCINEURIN INHIBITORS MARKET, BY DRUG TYPE, 2018-2032 (USD MILLION)
TABLE 134 ITALY PIMECROLIMUS (TOPICAL CREAM) IN CALCINEURIN INHIBITORS MARKET, BY AGE GROUP, 2018-2032 (USD MILLION)
TABLE 135 ITALY CALCINEURIN INHIBITORS MARKET, BY ROUTE OF ADMINISTRATION, 2018-2032 (USD MILLION)
TABLE 136 ITALY ORAL IN CALCINEURIN INHIBITORS MARKET, BY TYPE, 2018-2032 (USD MILLION)
TABLE 137 ITALY OTHERS IN CALCINEURIN INHIBITORS MARKET, BY DRUG TYPE, 2018-2032 (USD MILLION)
TABLE 138 ITALY CALCINEURIN INHIBITORS MARKET, BY DRUG TYPE, 2018-2032 (USD MILLION)
TABLE 139 ITALY GENERIC IN CALCINEURIN INHIBITORS MARKET, BY APPLICATION, 2018-2032 (USD MILLION)
TABLE 140 ITALY BRANDED IN CALCINEURIN INHIBITORS MARKET, BY APPLICATION, 2018-2032 (USD MILLION)
TABLE 141 ITALY CALCINEURIN INHIBITORS MARKET, BY APPLICATION, 2018-2032 (USD MILLION)
TABLE 142 ITALY CALCINEURIN INHIBITORS MARKET, BY END USER, 2018-2032 (USD MILLION)
TABLE 143 ITALY HOSPITALS IN CALCINEURIN INHIBITORS MARKET, BY TYPE, 2018-2032 (USD MILLION)
TABLE 144 ITALY HOSPITALS IN CALCINEURIN INHIBITORS MARKET, BY LEVEL, 2018-2032 (USD MILLION)
TABLE 145 ITALY CALCINEURIN INHIBITORS MARKET, BY DISTRIBUTION CHANNEL, 2018-2032 (USD MILLION)
TABLE 146 SPAIN CALCINEURIN INHIBITORS MARKET, BY DRUGS, 2018-2032 (USD MILLION)
TABLE 147 SPAIN TACROLIMUS IN CALCINEURIN INHIBITORS MARKET, BY DRUG TYPE, 2018-2032 (USD MILLION)
TABLE 148 SPAIN BRANDED IN CALCINEURIN INHIBITORS MARKET, BY TYPE, 2018-2032 (USD MILLION)
TABLE 149 SPAIN TACROLIMUS IN CALCINEURIN INHIBITORS MARKET, BY DOSAGE FORM, 2018-2032 (USD MILLION)
TABLE 150 SPAIN TACROLIMUS IN CALCINEURIN INHIBITORS MARKET, BY STRENGTH, 2018-2032 (USD MILLION)
TABLE 151 SPAIN TACROLIMUS IN CALCINEURIN INHIBITORS MARKET, BY AGE GROUP, 2018-2032 (USD MILLION)
TABLE 152 SPAIN CYCLOSPORINE IN CALCINEURIN INHIBITORS MARKET, BY DRUG TYPE, 2018-2032 (USD MILLION)
TABLE 153 SPAIN BRANDED IN CALCINEURIN INHIBITORS MARKET, BY TYPE, 2018-2032 (USD MILLION)
TABLE 154 SPAIN CYCLOSPORINE IN CALCINEURIN INHIBITORS MARKET, BY DOSAGE FORM, 2018-2032 (USD MILLION)
TABLE 155 SPAIN CYCLOSPORINE IN CALCINEURIN INHIBITORS MARKET, BY STRENGTH, 2018-2032 (USD MILLION)
TABLE 156 SPAIN CYCLOSPORINE IN CALCINEURIN INHIBITORS MARKET, BY AGE GROUP, 2018-2032 (USD MILLION)
TABLE 157 SPAIN PIMECROLIMUS (TOPICAL CREAM) IN CALCINEURIN INHIBITORS MARKET, BY DRUG TYPE, 2018-2032 (USD MILLION)
TABLE 158 SPAIN PIMECROLIMUS (TOPICAL CREAM) IN CALCINEURIN INHIBITORS MARKET, BY AGE GROUP, 2018-2032 (USD MILLION)
TABLE 159 SPAIN CALCINEURIN INHIBITORS MARKET, BY ROUTE OF ADMINISTRATION, 2018-2032 (USD MILLION)
TABLE 160 SPAIN ORAL IN CALCINEURIN INHIBITORS MARKET, BY TYPE, 2018-2032 (USD MILLION)
TABLE 161 SPAIN OTHERS IN CALCINEURIN INHIBITORS MARKET, BY DRUG TYPE, 2018-2032 (USD MILLION)
TABLE 162 SPAIN CALCINEURIN INHIBITORS MARKET, BY DRUG TYPE, 2018-2032 (USD MILLION)
TABLE 163 SPAIN GENERIC IN CALCINEURIN INHIBITORS MARKET, BY APPLICATION, 2018-2032 (USD MILLION)
TABLE 164 SPAIN BRANDED IN CALCINEURIN INHIBITORS MARKET, BY APPLICATION, 2018-2032 (USD MILLION)
TABLE 165 SPAIN CALCINEURIN INHIBITORS MARKET, BY APPLICATION, 2018-2032 (USD MILLION)
TABLE 166 SPAIN CALCINEURIN INHIBITORS MARKET, BY END USER, 2018-2032 (USD MILLION)
TABLE 167 SPAIN HOSPITALS IN CALCINEURIN INHIBITORS MARKET, BY TYPE, 2018-2032 (USD MILLION)
TABLE 168 SPAIN HOSPITALS IN CALCINEURIN INHIBITORS MARKET, BY LEVEL, 2018-2032 (USD MILLION)
TABLE 169 SPAIN CALCINEURIN INHIBITORS MARKET, BY DISTRIBUTION CHANNEL, 2018-2032 (USD MILLION)
TABLE 170 RUSSIA CALCINEURIN INHIBITORS MARKET, BY DRUGS, 2018-2032 (USD MILLION)
TABLE 171 RUSSIA TACROLIMUS IN CALCINEURIN INHIBITORS MARKET, BY DRUG TYPE, 2018-2032 (USD MILLION)
TABLE 172 RUSSIA BRANDED IN CALCINEURIN INHIBITORS MARKET, BY TYPE, 2018-2032 (USD MILLION)
TABLE 173 RUSSIA TACROLIMUS IN CALCINEURIN INHIBITORS MARKET, BY DOSAGE FORM, 2018-2032 (USD MILLION)
TABLE 174 RUSSIA TACROLIMUS IN CALCINEURIN INHIBITORS MARKET, BY STRENGTH, 2018-2032 (USD MILLION)
TABLE 175 RUSSIA TACROLIMUS IN CALCINEURIN INHIBITORS MARKET, BY AGE GROUP, 2018-2032 (USD MILLION)
TABLE 176 RUSSIA CYCLOSPORINE IN CALCINEURIN INHIBITORS MARKET, BY DRUG TYPE, 2018-2032 (USD MILLION)
TABLE 177 RUSSIA BRANDED IN CALCINEURIN INHIBITORS MARKET, BY TYPE, 2018-2032 (USD MILLION)
TABLE 178 RUSSIA CYCLOSPORINE IN CALCINEURIN INHIBITORS MARKET, BY DOSAGE FORM, 2018-2032 (USD MILLION)
TABLE 179 RUSSIA CYCLOSPORINE IN CALCINEURIN INHIBITORS MARKET, BY STRENGTH, 2018-2032 (USD MILLION)
TABLE 180 RUSSIA CYCLOSPORINE IN CALCINEURIN INHIBITORS MARKET, BY AGE GROUP, 2018-2032 (USD MILLION)
TABLE 181 RUSSIA PIMECROLIMUS (TOPICAL CREAM) IN CALCINEURIN INHIBITORS MARKET, BY DRUG TYPE, 2018-2032 (USD MILLION)
TABLE 182 RUSSIA PIMECROLIMUS (TOPICAL CREAM) IN CALCINEURIN INHIBITORS MARKET, BY AGE GROUP, 2018-2032 (USD MILLION)
TABLE 183 RUSSIA CALCINEURIN INHIBITORS MARKET, BY ROUTE OF ADMINISTRATION, 2018-2032 (USD MILLION)
TABLE 184 RUSSIA ORAL IN CALCINEURIN INHIBITORS MARKET, BY TYPE, 2018-2032 (USD MILLION)
TABLE 185 RUSSIA OTHERS IN CALCINEURIN INHIBITORS MARKET, BY DRUG TYPE, 2018-2032 (USD MILLION)
TABLE 186 RUSSIA CALCINEURIN INHIBITORS MARKET, BY DRUG TYPE, 2018-2032 (USD MILLION)
TABLE 187 RUSSIA GENERIC IN CALCINEURIN INHIBITORS MARKET, BY APPLICATION, 2018-2032 (USD MILLION)
TABLE 188 RUSSIA BRANDED IN CALCINEURIN INHIBITORS MARKET, BY APPLICATION, 2018-2032 (USD MILLION)
TABLE 189 RUSSIA CALCINEURIN INHIBITORS MARKET, BY APPLICATION, 2018-2032 (USD MILLION)
TABLE 190 RUSSIA CALCINEURIN INHIBITORS MARKET, BY END USER, 2018-2032 (USD MILLION)
TABLE 191 RUSSIA HOSPITALS IN CALCINEURIN INHIBITORS MARKET, BY TYPE, 2018-2032 (USD MILLION)
TABLE 192 RUSSIA HOSPITALS IN CALCINEURIN INHIBITORS MARKET, BY LEVEL, 2018-2032 (USD MILLION)
TABLE 193 RUSSIA CALCINEURIN INHIBITORS MARKET, BY DISTRIBUTION CHANNEL, 2018-2032 (USD MILLION)
TABLE 194 TURKEY CALCINEURIN INHIBITORS MARKET, BY DRUGS, 2018-2032 (USD MILLION)
TABLE 195 TURKEY TACROLIMUS IN CALCINEURIN INHIBITORS MARKET, BY DRUG TYPE, 2018-2032 (USD MILLION)
TABLE 196 TURKEY BRANDED IN CALCINEURIN INHIBITORS MARKET, BY TYPE, 2018-2032 (USD MILLION)
TABLE 197 TURKEY TACROLIMUS IN CALCINEURIN INHIBITORS MARKET, BY DOSAGE FORM, 2018-2032 (USD MILLION)
TABLE 198 TURKEY TACROLIMUS IN CALCINEURIN INHIBITORS MARKET, BY STRENGTH, 2018-2032 (USD MILLION)
TABLE 199 TURKEY TACROLIMUS IN CALCINEURIN INHIBITORS MARKET, BY AGE GROUP, 2018-2032 (USD MILLION)
TABLE 200 TURKEY CYCLOSPORINE IN CALCINEURIN INHIBITORS MARKET, BY DRUG TYPE, 2018-2032 (USD MILLION)
TABLE 201 TURKEY BRANDED IN CALCINEURIN INHIBITORS MARKET, BY TYPE, 2018-2032 (USD MILLION)
TABLE 202 TURKEY CYCLOSPORINE IN CALCINEURIN INHIBITORS MARKET, BY DOSAGE FORM, 2018-2032 (USD MILLION)
TABLE 203 TURKEY CYCLOSPORINE IN CALCINEURIN INHIBITORS MARKET, BY STRENGTH, 2018-2032 (USD MILLION)
TABLE 204 TURKEY CYCLOSPORINE IN CALCINEURIN INHIBITORS MARKET, BY AGE GROUP, 2018-2032 (USD MILLION)
TABLE 205 TURKEY PIMECROLIMUS (TOPICAL CREAM) IN CALCINEURIN INHIBITORS MARKET, BY DRUG TYPE, 2018-2032 (USD MILLION)
TABLE 206 TURKEY PIMECROLIMUS (TOPICAL CREAM) IN CALCINEURIN INHIBITORS MARKET, BY AGE GROUP, 2018-2032 (USD MILLION)
TABLE 207 TURKEY CALCINEURIN INHIBITORS MARKET, BY ROUTE OF ADMINISTRATION, 2018-2032 (USD MILLION)
TABLE 208 TURKEY ORAL IN CALCINEURIN INHIBITORS MARKET, BY TYPE, 2018-2032 (USD MILLION)
TABLE 209 TURKEY OTHERS IN CALCINEURIN INHIBITORS MARKET, BY DRUG TYPE, 2018-2032 (USD MILLION)
TABLE 210 TURKEY CALCINEURIN INHIBITORS MARKET, BY DRUG TYPE, 2018-2032 (USD MILLION)
TABLE 211 TURKEY GENERIC IN CALCINEURIN INHIBITORS MARKET, BY APPLICATION, 2018-2032 (USD MILLION)
TABLE 212 TURKEY BRANDED IN CALCINEURIN INHIBITORS MARKET, BY APPLICATION, 2018-2032 (USD MILLION)
TABLE 213 TURKEY CALCINEURIN INHIBITORS MARKET, BY APPLICATION, 2018-2032 (USD MILLION)
TABLE 214 TURKEY CALCINEURIN INHIBITORS MARKET, BY END USER, 2018-2032 (USD MILLION)
TABLE 215 TURKEY HOSPITALS IN CALCINEURIN INHIBITORS MARKET, BY TYPE, 2018-2032 (USD MILLION)
TABLE 216 TURKEY HOSPITALS IN CALCINEURIN INHIBITORS MARKET, BY LEVEL, 2018-2032 (USD MILLION)
TABLE 217 TURKEY CALCINEURIN INHIBITORS MARKET, BY DISTRIBUTION CHANNEL, 2018-2032 (USD MILLION)
TABLE 218 NETHERLANDS CALCINEURIN INHIBITORS MARKET, BY DRUGS, 2018-2032 (USD MILLION)
TABLE 219 NETHERLANDS TACROLIMUS IN CALCINEURIN INHIBITORS MARKET, BY DRUG TYPE, 2018-2032 (USD MILLION)
TABLE 220 NETHERLANDS BRANDED IN CALCINEURIN INHIBITORS MARKET, BY TYPE, 2018-2032 (USD MILLION)
TABLE 221 NETHERLANDS TACROLIMUS IN CALCINEURIN INHIBITORS MARKET, BY DOSAGE FORM, 2018-2032 (USD MILLION)
TABLE 222 NETHERLANDS TACROLIMUS IN CALCINEURIN INHIBITORS MARKET, BY STRENGTH, 2018-2032 (USD MILLION)
TABLE 223 NETHERLANDS TACROLIMUS IN CALCINEURIN INHIBITORS MARKET, BY AGE GROUP, 2018-2032 (USD MILLION)
TABLE 224 NETHERLANDS CYCLOSPORINE IN CALCINEURIN INHIBITORS MARKET, BY DRUG TYPE, 2018-2032 (USD MILLION)
TABLE 225 NETHERLANDS BRANDED IN CALCINEURIN INHIBITORS MARKET, BY TYPE, 2018-2032 (USD MILLION)
TABLE 226 NETHERLANDS CYCLOSPORINE IN CALCINEURIN INHIBITORS MARKET, BY DOSAGE FORM, 2018-2032 (USD MILLION)
TABLE 227 NETHERLANDS CYCLOSPORINE IN CALCINEURIN INHIBITORS MARKET, BY STRENGTH, 2018-2032 (USD MILLION)
TABLE 228 NETHERLANDS CYCLOSPORINE IN CALCINEURIN INHIBITORS MARKET, BY AGE GROUP, 2018-2032 (USD MILLION)
TABLE 229 NETHERLANDS PIMECROLIMUS (TOPICAL CREAM) IN CALCINEURIN INHIBITORS MARKET, BY DRUG TYPE, 2018-2032 (USD MILLION)
TABLE 230 NETHERLANDS PIMECROLIMUS (TOPICAL CREAM) IN CALCINEURIN INHIBITORS MARKET, BY AGE GROUP, 2018-2032 (USD MILLION)
TABLE 231 NETHERLANDS CALCINEURIN INHIBITORS MARKET, BY ROUTE OF ADMINISTRATION, 2018-2032 (USD MILLION)
TABLE 232 NETHERLANDS ORAL IN CALCINEURIN INHIBITORS MARKET, BY TYPE, 2018-2032 (USD MILLION)
TABLE 233 NETHERLANDS OTHERS IN CALCINEURIN INHIBITORS MARKET, BY DRUG TYPE, 2018-2032 (USD MILLION)
TABLE 234 NETHERLANDS CALCINEURIN INHIBITORS MARKET, BY DRUG TYPE, 2018-2032 (USD MILLION)
TABLE 235 NETHERLANDS GENERIC IN CALCINEURIN INHIBITORS MARKET, BY APPLICATION, 2018-2032 (USD MILLION)
TABLE 236 NETHERLANDS BRANDED IN CALCINEURIN INHIBITORS MARKET, BY APPLICATION, 2018-2032 (USD MILLION)
TABLE 237 NETHERLANDS CALCINEURIN INHIBITORS MARKET, BY APPLICATION, 2018-2032 (USD MILLION)
TABLE 238 NETHERLANDS CALCINEURIN INHIBITORS MARKET, BY END USER, 2018-2032 (USD MILLION)
TABLE 239 NETHERLANDS HOSPITALS IN CALCINEURIN INHIBITORS MARKET, BY TYPE, 2018-2032 (USD MILLION)
TABLE 240 NETHERLANDS HOSPITALS IN CALCINEURIN INHIBITORS MARKET, BY LEVEL, 2018-2032 (USD MILLION)
TABLE 241 NETHERLANDS CALCINEURIN INHIBITORS MARKET, BY DISTRIBUTION CHANNEL, 2018-2032 (USD MILLION)
TABLE 242 SWITZERLAND CALCINEURIN INHIBITORS MARKET, BY DRUGS, 2018-2032 (USD MILLION)
TABLE 243 SWITZERLAND TACROLIMUS IN CALCINEURIN INHIBITORS MARKET, BY DRUG TYPE, 2018-2032 (USD MILLION)
TABLE 244 SWITZERLAND BRANDED IN CALCINEURIN INHIBITORS MARKET, BY TYPE, 2018-2032 (USD MILLION)
TABLE 245 SWITZERLAND TACROLIMUS IN CALCINEURIN INHIBITORS MARKET, BY DOSAGE FORM, 2018-2032 (USD MILLION)
TABLE 246 SWITZERLAND TACROLIMUS IN CALCINEURIN INHIBITORS MARKET, BY STRENGTH, 2018-2032 (USD MILLION)
TABLE 247 SWITZERLAND TACROLIMUS IN CALCINEURIN INHIBITORS MARKET, BY AGE GROUP, 2018-2032 (USD MILLION)
TABLE 248 SWITZERLAND CYCLOSPORINE IN CALCINEURIN INHIBITORS MARKET, BY DRUG TYPE, 2018-2032 (USD MILLION)
TABLE 249 SWITZERLAND BRANDED IN CALCINEURIN INHIBITORS MARKET, BY TYPE, 2018-2032 (USD MILLION)
TABLE 250 SWITZERLAND CYCLOSPORINE IN CALCINEURIN INHIBITORS MARKET, BY DOSAGE FORM, 2018-2032 (USD MILLION)
TABLE 251 SWITZERLAND CYCLOSPORINE IN CALCINEURIN INHIBITORS MARKET, BY STRENGTH, 2018-2032 (USD MILLION)
TABLE 252 SWITZERLAND CYCLOSPORINE IN CALCINEURIN INHIBITORS MARKET, BY AGE GROUP, 2018-2032 (USD MILLION)
TABLE 253 SWITZERLAND PIMECROLIMUS (TOPICAL CREAM) IN CALCINEURIN INHIBITORS MARKET, BY DRUG TYPE, 2018-2032 (USD MILLION)
TABLE 254 SWITZERLAND PIMECROLIMUS (TOPICAL CREAM) IN CALCINEURIN INHIBITORS MARKET, BY AGE GROUP, 2018-2032 (USD MILLION)
TABLE 255 SWITZERLAND CALCINEURIN INHIBITORS MARKET, BY ROUTE OF ADMINISTRATION, 2018-2032 (USD MILLION)
TABLE 256 SWITZERLAND ORAL IN CALCINEURIN INHIBITORS MARKET, BY TYPE, 2018-2032 (USD MILLION)
TABLE 257 SWITZERLAND OTHERS IN CALCINEURIN INHIBITORS MARKET, BY DRUG TYPE, 2018-2032 (USD MILLION)
TABLE 258 SWITZERLAND CALCINEURIN INHIBITORS MARKET, BY DRUG TYPE, 2018-2032 (USD MILLION)
TABLE 259 SWITZERLAND GENERIC IN CALCINEURIN INHIBITORS MARKET, BY APPLICATION, 2018-2032 (USD MILLION)
TABLE 260 SWITZERLAND BRANDED IN CALCINEURIN INHIBITORS MARKET, BY APPLICATION, 2018-2032 (USD MILLION)
TABLE 261 SWITZERLAND CALCINEURIN INHIBITORS MARKET, BY APPLICATION, 2018-2032 (USD MILLION)
TABLE 262 SWITZERLAND CALCINEURIN INHIBITORS MARKET, BY END USER, 2018-2032 (USD MILLION)
TABLE 263 SWITZERLAND HOSPITALS IN CALCINEURIN INHIBITORS MARKET, BY TYPE, 2018-2032 (USD MILLION)
TABLE 264 SWITZERLAND HOSPITALS IN CALCINEURIN INHIBITORS MARKET, BY LEVEL, 2018-2032 (USD MILLION)
TABLE 265 SWITZERLAND CALCINEURIN INHIBITORS MARKET, BY DISTRIBUTION CHANNEL, 2018-2032 (USD MILLION)
TABLE 266 BELGIUM CALCINEURIN INHIBITORS MARKET, BY DRUGS, 2018-2032 (USD MILLION)
TABLE 267 BELGIUM TACROLIMUS IN CALCINEURIN INHIBITORS MARKET, BY DRUG TYPE, 2018-2032 (USD MILLION)
TABLE 268 BELGIUM BRANDED IN CALCINEURIN INHIBITORS MARKET, BY TYPE, 2018-2032 (USD MILLION)
TABLE 269 BELGIUM TACROLIMUS IN CALCINEURIN INHIBITORS MARKET, BY DOSAGE FORM, 2018-2032 (USD MILLION)
TABLE 270 BELGIUM TACROLIMUS IN CALCINEURIN INHIBITORS MARKET, BY STRENGTH, 2018-2032 (USD MILLION)
TABLE 271 BELGIUM TACROLIMUS IN CALCINEURIN INHIBITORS MARKET, BY AGE GROUP, 2018-2032 (USD MILLION)
TABLE 272 BELGIUM CYCLOSPORINE IN CALCINEURIN INHIBITORS MARKET, BY DRUG TYPE, 2018-2032 (USD MILLION)
TABLE 273 BELGIUM BRANDED IN CALCINEURIN INHIBITORS MARKET, BY TYPE, 2018-2032 (USD MILLION)
TABLE 274 BELGIUM CYCLOSPORINE IN CALCINEURIN INHIBITORS MARKET, BY DOSAGE FORM, 2018-2032 (USD MILLION)
TABLE 275 BELGIUM CYCLOSPORINE IN CALCINEURIN INHIBITORS MARKET, BY STRENGTH, 2018-2032 (USD MILLION)
TABLE 276 BELGIUM CYCLOSPORINE IN CALCINEURIN INHIBITORS MARKET, BY AGE GROUP, 2018-2032 (USD MILLION)
TABLE 277 BELGIUM PIMECROLIMUS (TOPICAL CREAM) IN CALCINEURIN INHIBITORS MARKET, BY DRUG TYPE, 2018-2032 (USD MILLION)
TABLE 278 BELGIUM PIMECROLIMUS (TOPICAL CREAM) IN CALCINEURIN INHIBITORS MARKET, BY AGE GROUP, 2018-2032 (USD MILLION)
TABLE 279 BELGIUM CALCINEURIN INHIBITORS MARKET, BY ROUTE OF ADMINISTRATION, 2018-2032 (USD MILLION)
TABLE 280 BELGIUM ORAL IN CALCINEURIN INHIBITORS MARKET, BY TYPE, 2018-2032 (USD MILLION)
TABLE 281 BELGIUM OTHERS IN CALCINEURIN INHIBITORS MARKET, BY DRUG TYPE, 2018-2032 (USD MILLION)
TABLE 282 BELGIUM CALCINEURIN INHIBITORS MARKET, BY DRUG TYPE, 2018-2032 (USD MILLION)
TABLE 283 BELGIUM GENERIC IN CALCINEURIN INHIBITORS MARKET, BY APPLICATION, 2018-2032 (USD MILLION)
TABLE 284 BELGIUM BRANDED IN CALCINEURIN INHIBITORS MARKET, BY APPLICATION, 2018-2032 (USD MILLION)
TABLE 285 BELGIUM CALCINEURIN INHIBITORS MARKET, BY APPLICATION, 2018-2032 (USD MILLION)
TABLE 286 BELGIUM CALCINEURIN INHIBITORS MARKET, BY END USER, 2018-2032 (USD MILLION)
TABLE 287 BELGIUM HOSPITALS IN CALCINEURIN INHIBITORS MARKET, BY TYPE, 2018-2032 (USD MILLION)
TABLE 288 BELGIUM HOSPITALS IN CALCINEURIN INHIBITORS MARKET, BY LEVEL, 2018-2032 (USD MILLION)
TABLE 289 BELGIUM CALCINEURIN INHIBITORS MARKET, BY DISTRIBUTION CHANNEL, 2018-2032 (USD MILLION)
TABLE 290 POLAND CALCINEURIN INHIBITORS MARKET, BY DRUGS, 2018-2032 (USD MILLION)
TABLE 291 POLAND TACROLIMUS IN CALCINEURIN INHIBITORS MARKET, BY DRUG TYPE, 2018-2032 (USD MILLION)
TABLE 292 POLAND BRANDED IN CALCINEURIN INHIBITORS MARKET, BY TYPE, 2018-2032 (USD MILLION)
TABLE 293 POLAND TACROLIMUS IN CALCINEURIN INHIBITORS MARKET, BY DOSAGE FORM, 2018-2032 (USD MILLION)
TABLE 294 POLAND TACROLIMUS IN CALCINEURIN INHIBITORS MARKET, BY STRENGTH, 2018-2032 (USD MILLION)
TABLE 295 POLAND TACROLIMUS IN CALCINEURIN INHIBITORS MARKET, BY AGE GROUP, 2018-2032 (USD MILLION)
TABLE 296 POLAND CYCLOSPORINE IN CALCINEURIN INHIBITORS MARKET, BY DRUG TYPE, 2018-2032 (USD MILLION)
TABLE 297 POLAND BRANDED IN CALCINEURIN INHIBITORS MARKET, BY TYPE, 2018-2032 (USD MILLION)
TABLE 298 POLAND CYCLOSPORINE IN CALCINEURIN INHIBITORS MARKET, BY DOSAGE FORM, 2018-2032 (USD MILLION)
TABLE 299 POLAND CYCLOSPORINE IN CALCINEURIN INHIBITORS MARKET, BY STRENGTH, 2018-2032 (USD MILLION)
TABLE 300 POLAND CYCLOSPORINE IN CALCINEURIN INHIBITORS MARKET, BY AGE GROUP, 2018-2032 (USD MILLION)
TABLE 301 POLAND PIMECROLIMUS (TOPICAL CREAM) IN CALCINEURIN INHIBITORS MARKET, BY DRUG TYPE, 2018-2032 (USD MILLION)
TABLE 302 POLAND PIMECROLIMUS (TOPICAL CREAM) IN CALCINEURIN INHIBITORS MARKET, BY AGE GROUP, 2018-2032 (USD MILLION)
TABLE 303 POLAND CALCINEURIN INHIBITORS MARKET, BY ROUTE OF ADMINISTRATION, 2018-2032 (USD MILLION)
TABLE 304 POLAND ORAL IN CALCINEURIN INHIBITORS MARKET, BY TYPE, 2018-2032 (USD MILLION)
TABLE 305 POLAND OTHERS IN CALCINEURIN INHIBITORS MARKET, BY DRUG TYPE, 2018-2032 (USD MILLION)
TABLE 306 POLAND CALCINEURIN INHIBITORS MARKET, BY DRUG TYPE, 2018-2032 (USD MILLION)
TABLE 307 POLAND GENERIC IN CALCINEURIN INHIBITORS MARKET, BY APPLICATION, 2018-2032 (USD MILLION)
TABLE 308 POLAND BRANDED IN CALCINEURIN INHIBITORS MARKET, BY APPLICATION, 2018-2032 (USD MILLION)
TABLE 309 POLAND CALCINEURIN INHIBITORS MARKET, BY APPLICATION, 2018-2032 (USD MILLION)
TABLE 310 POLAND CALCINEURIN INHIBITORS MARKET, BY END USER, 2018-2032 (USD MILLION)
TABLE 311 POLAND HOSPITALS IN CALCINEURIN INHIBITORS MARKET, BY TYPE, 2018-2032 (USD MILLION)
TABLE 312 POLAND HOSPITALS IN CALCINEURIN INHIBITORS MARKET, BY LEVEL, 2018-2032 (USD MILLION)
TABLE 313 POLAND CALCINEURIN INHIBITORS MARKET, BY DISTRIBUTION CHANNEL, 2018-2032 (USD MILLION)
TABLE 314 AUSTRIA CALCINEURIN INHIBITORS MARKET, BY DRUGS, 2018-2032 (USD MILLION)
TABLE 315 AUSTRIA TACROLIMUS IN CALCINEURIN INHIBITORS MARKET, BY DRUG TYPE, 2018-2032 (USD MILLION)
TABLE 316 AUSTRIA BRANDED IN CALCINEURIN INHIBITORS MARKET, BY TYPE, 2018-2032 (USD MILLION)
TABLE 317 AUSTRIA TACROLIMUS IN CALCINEURIN INHIBITORS MARKET, BY DOSAGE FORM, 2018-2032 (USD MILLION)
TABLE 318 AUSTRIA TACROLIMUS IN CALCINEURIN INHIBITORS MARKET, BY STRENGTH, 2018-2032 (USD MILLION)
TABLE 319 AUSTRIA TACROLIMUS IN CALCINEURIN INHIBITORS MARKET, BY AGE GROUP, 2018-2032 (USD MILLION)
TABLE 320 AUSTRIA CYCLOSPORINE IN CALCINEURIN INHIBITORS MARKET, BY DRUG TYPE, 2018-2032 (USD MILLION)
TABLE 321 AUSTRIA BRANDED IN CALCINEURIN INHIBITORS MARKET, BY TYPE, 2018-2032 (USD MILLION)
TABLE 322 AUSTRIA CYCLOSPORINE IN CALCINEURIN INHIBITORS MARKET, BY DOSAGE FORM, 2018-2032 (USD MILLION)
TABLE 323 AUSTRIA CYCLOSPORINE IN CALCINEURIN INHIBITORS MARKET, BY STRENGTH, 2018-2032 (USD MILLION)
TABLE 324 AUSTRIA CYCLOSPORINE IN CALCINEURIN INHIBITORS MARKET, BY AGE GROUP, 2018-2032 (USD MILLION)
TABLE 325 AUSTRIA PIMECROLIMUS (TOPICAL CREAM) IN CALCINEURIN INHIBITORS MARKET, BY DRUG TYPE, 2018-2032 (USD MILLION)
TABLE 326 AUSTRIA PIMECROLIMUS (TOPICAL CREAM) IN CALCINEURIN INHIBITORS MARKET, BY AGE GROUP, 2018-2032 (USD MILLION)
TABLE 327 AUSTRIA CALCINEURIN INHIBITORS MARKET, BY ROUTE OF ADMINISTRATION, 2018-2032 (USD MILLION)
TABLE 328 AUSTRIA ORAL IN CALCINEURIN INHIBITORS MARKET, BY TYPE, 2018-2032 (USD MILLION)
TABLE 329 AUSTRIA OTHERS IN CALCINEURIN INHIBITORS MARKET, BY DRUG TYPE, 2018-2032 (USD MILLION)
TABLE 330 AUSTRIA CALCINEURIN INHIBITORS MARKET, BY DRUG TYPE, 2018-2032 (USD MILLION)
TABLE 331 AUSTRIA GENERIC IN CALCINEURIN INHIBITORS MARKET, BY APPLICATION, 2018-2032 (USD MILLION)
TABLE 332 AUSTRIA BRANDED IN CALCINEURIN INHIBITORS MARKET, BY APPLICATION, 2018-2032 (USD MILLION)
TABLE 333 AUSTRIA CALCINEURIN INHIBITORS MARKET, BY APPLICATION, 2018-2032 (USD MILLION)
TABLE 334 AUSTRIA CALCINEURIN INHIBITORS MARKET, BY END USER, 2018-2032 (USD MILLION)
TABLE 335 AUSTRIA HOSPITALS IN CALCINEURIN INHIBITORS MARKET, BY TYPE, 2018-2032 (USD MILLION)
TABLE 336 AUSTRIA HOSPITALS IN CALCINEURIN INHIBITORS MARKET, BY LEVEL, 2018-2032 (USD MILLION)
TABLE 337 AUSTRIA CALCINEURIN INHIBITORS MARKET, BY DISTRIBUTION CHANNEL, 2018-2032 (USD MILLION)
TABLE 338 IRELAND CALCINEURIN INHIBITORS MARKET, BY DRUGS, 2018-2032 (USD MILLION)
TABLE 339 IRELAND TACROLIMUS IN CALCINEURIN INHIBITORS MARKET, BY DRUG TYPE, 2018-2032 (USD MILLION)
TABLE 340 IRELAND BRANDED IN CALCINEURIN INHIBITORS MARKET, BY TYPE, 2018-2032 (USD MILLION)
TABLE 341 IRELAND TACROLIMUS IN CALCINEURIN INHIBITORS MARKET, BY DOSAGE FORM, 2018-2032 (USD MILLION)
TABLE 342 IRELAND TACROLIMUS IN CALCINEURIN INHIBITORS MARKET, BY STRENGTH, 2018-2032 (USD MILLION)
TABLE 343 IRELAND TACROLIMUS IN CALCINEURIN INHIBITORS MARKET, BY AGE GROUP, 2018-2032 (USD MILLION)
TABLE 344 IRELAND CYCLOSPORINE IN CALCINEURIN INHIBITORS MARKET, BY DRUG TYPE, 2018-2032 (USD MILLION)
TABLE 345 IRELAND BRANDED IN CALCINEURIN INHIBITORS MARKET, BY TYPE, 2018-2032 (USD MILLION)
TABLE 346 IRELAND CYCLOSPORINE IN CALCINEURIN INHIBITORS MARKET, BY DOSAGE FORM, 2018-2032 (USD MILLION)
TABLE 347 IRELAND CYCLOSPORINE IN CALCINEURIN INHIBITORS MARKET, BY STRENGTH, 2018-2032 (USD MILLION)
TABLE 348 IRELAND CYCLOSPORINE IN CALCINEURIN INHIBITORS MARKET, BY AGE GROUP, 2018-2032 (USD MILLION)
TABLE 349 IRELAND PIMECROLIMUS (TOPICAL CREAM) IN CALCINEURIN INHIBITORS MARKET, BY DRUG TYPE, 2018-2032 (USD MILLION)
TABLE 350 IRELAND PIMECROLIMUS (TOPICAL CREAM) IN CALCINEURIN INHIBITORS MARKET, BY AGE GROUP, 2018-2032 (USD MILLION)
TABLE 351 IRELAND CALCINEURIN INHIBITORS MARKET, BY ROUTE OF ADMINISTRATION, 2018-2032 (USD MILLION)
TABLE 352 IRELAND ORAL IN CALCINEURIN INHIBITORS MARKET, BY TYPE, 2018-2032 (USD MILLION)
TABLE 353 IRELAND OTHERS IN CALCINEURIN INHIBITORS MARKET, BY DRUG TYPE, 2018-2032 (USD MILLION)
TABLE 354 IRELAND CALCINEURIN INHIBITORS MARKET, BY DRUG TYPE, 2018-2032 (USD MILLION)
TABLE 355 IRELAND GENERIC IN CALCINEURIN INHIBITORS MARKET, BY APPLICATION, 2018-2032 (USD MILLION)
TABLE 356 IRELAND BRANDED IN CALCINEURIN INHIBITORS MARKET, BY APPLICATION, 2018-2032 (USD MILLION)
TABLE 357 IRELAND CALCINEURIN INHIBITORS MARKET, BY APPLICATION, 2018-2032 (USD MILLION)
TABLE 358 IRELAND CALCINEURIN INHIBITORS MARKET, BY END USER, 2018-2032 (USD MILLION)
TABLE 359 IRELAND HOSPITALS IN CALCINEURIN INHIBITORS MARKET, BY TYPE, 2018-2032 (USD MILLION)
TABLE 360 IRELAND HOSPITALS IN CALCINEURIN INHIBITORS MARKET, BY LEVEL, 2018-2032 (USD MILLION)
TABLE 361 IRELAND CALCINEURIN INHIBITORS MARKET, BY DISTRIBUTION CHANNEL, 2018-2032 (USD MILLION)
TABLE 362 NORWAY CALCINEURIN INHIBITORS MARKET, BY DRUGS, 2018-2032 (USD MILLION)
TABLE 363 NORWAY TACROLIMUS IN CALCINEURIN INHIBITORS MARKET, BY DRUG TYPE, 2018-2032 (USD MILLION)
TABLE 364 NORWAY BRANDED IN CALCINEURIN INHIBITORS MARKET, BY TYPE, 2018-2032 (USD MILLION)
TABLE 365 NORWAY TACROLIMUS IN CALCINEURIN INHIBITORS MARKET, BY DOSAGE FORM, 2018-2032 (USD MILLION)
TABLE 366 NORWAY TACROLIMUS IN CALCINEURIN INHIBITORS MARKET, BY STRENGTH, 2018-2032 (USD MILLION)
TABLE 367 NORWAY TACROLIMUS IN CALCINEURIN INHIBITORS MARKET, BY AGE GROUP, 2018-2032 (USD MILLION)
TABLE 368 NORWAY CYCLOSPORINE IN CALCINEURIN INHIBITORS MARKET, BY DRUG TYPE, 2018-2032 (USD MILLION)
TABLE 369 NORWAY BRANDED IN CALCINEURIN INHIBITORS MARKET, BY TYPE, 2018-2032 (USD MILLION)
TABLE 370 NORWAY CYCLOSPORINE IN CALCINEURIN INHIBITORS MARKET, BY DOSAGE FORM, 2018-2032 (USD MILLION)
TABLE 371 NORWAY CYCLOSPORINE IN CALCINEURIN INHIBITORS MARKET, BY STRENGTH, 2018-2032 (USD MILLION)
TABLE 372 NORWAY CYCLOSPORINE IN CALCINEURIN INHIBITORS MARKET, BY AGE GROUP, 2018-2032 (USD MILLION)
TABLE 373 NORWAY PIMECROLIMUS (TOPICAL CREAM) IN CALCINEURIN INHIBITORS MARKET, BY DRUG TYPE, 2018-2032 (USD MILLION)
TABLE 374 NORWAY PIMECROLIMUS (TOPICAL CREAM) IN CALCINEURIN INHIBITORS MARKET, BY AGE GROUP, 2018-2032 (USD MILLION)
TABLE 375 NORWAY CALCINEURIN INHIBITORS MARKET, BY ROUTE OF ADMINISTRATION, 2018-2032 (USD MILLION)
TABLE 376 NORWAY ORAL IN CALCINEURIN INHIBITORS MARKET, BY TYPE, 2018-2032 (USD MILLION)
TABLE 377 NORWAY OTHERS IN CALCINEURIN INHIBITORS MARKET, BY DRUG TYPE, 2018-2032 (USD MILLION)
TABLE 378 NORWAY CALCINEURIN INHIBITORS MARKET, BY DRUG TYPE, 2018-2032 (USD MILLION)
TABLE 379 NORWAY GENERIC IN CALCINEURIN INHIBITORS MARKET, BY APPLICATION, 2018-2032 (USD MILLION)
TABLE 380 NORWAY BRANDED IN CALCINEURIN INHIBITORS MARKET, BY APPLICATION, 2018-2032 (USD MILLION)
TABLE 381 NORWAY CALCINEURIN INHIBITORS MARKET, BY APPLICATION, 2018-2032 (USD MILLION)
TABLE 382 NORWAY CALCINEURIN INHIBITORS MARKET, BY END USER, 2018-2032 (USD MILLION)
TABLE 383 NORWAY HOSPITALS IN CALCINEURIN INHIBITORS MARKET, BY TYPE, 2018-2032 (USD MILLION)
TABLE 384 NORWAY HOSPITALS IN CALCINEURIN INHIBITORS MARKET, BY LEVEL, 2018-2032 (USD MILLION)
TABLE 385 NORWAY CALCINEURIN INHIBITORS MARKET, BY DISTRIBUTION CHANNEL, 2018-2032 (USD MILLION)
TABLE 386 REST OF EUROPE CALCINEURIN INHIBITORS MARKET, BY DRUGS, 2018-2032 (USD MILLION)
List of Figure
FIGURE 1 EUROPE CALCINEURIN INHIBITORS MARKET: SEGMENTATION
FIGURE 2 EUROPE CALCINEURIN INHIBITORS MARKET: DATA TRIANGULATION
FIGURE 3 EUROPE CALCINEURIN INHIBITORS MARKET: DROC ANALYSIS
FIGURE 4 EUROPE CALCINEURIN INHIBITORS MARKET: EUROPE VS REGIONAL MARKET ANALYSIS
FIGURE 5 EUROPE CALCINEURIN INHIBITORS MARKET: COMPANY RESEARCH ANALYSIS
FIGURE 6 EUROPE CALCINEURIN INHIBITORS MARKET: INTERVIEW DEMOGRAPHICS
FIGURE 7 EUROPE CALCINEURIN INHIBITORS MARKET: DBMR MARKET POSITION GRID
FIGURE 8 EUROPE CALCINEURIN INHIBITORS MARKET: VENDOR SHARE ANALYSIS
FIGURE 9 EUROPE CALCINEURIN INHIBITORS MARKET: SEGMENTATION
FIGURE 10 FIVE SEGMENTS COMPRISE THE EUROPE CALCINEURIN INHIBITORS MARKET, BY DRUGS (2024)
FIGURE 11 EUROPE CALCINEURIN INHIBITORS MARKET EXECUTIVE SUMMARY
FIGURE 12 STRATEGIC DECISIONS
FIGURE 13 RISING PREVALENCE OF AUTOIMMUNE DISEASES IS DRIVING THE GROWTH OF THE EUROPE CALCINEURIN INHIBITORS MARKET FROM 2025 TO 2032
FIGURE 14 THE TACROLIMUS SEGMENT IS EXPECTED TO ACCOUNT FOR THE LARGEST SHARE OF THE EUROPE CALCINEURIN INHIBITORS MARKET IN 2025 AND 2032
FIGURE 15 MARKET OVERVIEW
FIGURE 16 EUROPE CALCINEURIN INHIBITORS MARKET: BY DRUG TYPE, 2024
FIGURE 17 EUROPE CALCINEURIN INHIBITORS MARKET: BY DRUG TYPE, 2025-2032 (USD MILLION)
FIGURE 18 EUROPE CALCINEURIN INHIBITORS MARKET: BY DRUG TYPE, CAGR (2025-2032)
FIGURE 19 EUROPE CALCINEURIN INHIBITORS MARKET: BY DRUG TYPE, LIFELINE CURVE
FIGURE 20 EUROPE CALCINEURIN INHIBITORS MARKET: BY DRUGS, 2024
FIGURE 21 EUROPE CALCINEURIN INHIBITORS MARKET: BY DRUGS, 2025-2032 (USD MILLION)
FIGURE 22 EUROPE CALCINEURIN INHIBITORS MARKET: BY DRUGS, CAGR (2025-2032)
FIGURE 23 EUROPE CALCINEURIN INHIBITORS MARKET: BY DRUGS, LIFELINE CURVE
FIGURE 24 EUROPE CALCINEURIN INHIBITORS MARKET: BY ROUTE OF ADMINISTRATION, 2024
FIGURE 25 EUROPE CALCINEURIN INHIBITORS MARKET: BY ROUTE OF ADMINISTRATION, 2025-2032 (USD MILLION)
FIGURE 26 EUROPE CALCINEURIN INHIBITORS MARKET: BY ROUTE OF ADMINISTRATION, CAGR (2025-2032)
FIGURE 27 EUROPE CALCINEURIN INHIBITORS MARKET: BY ROUTE OF ADMINISTRATION, LIFELINE CURVE
FIGURE 28 EUROPE CALCINEURIN INHIBITORS MARKET: BY APPLICATION, 2024
FIGURE 29 EUROPE CALCINEURIN INHIBITORS MARKET: BY APPLICATION, 2025-2032 (USD MILLION)
FIGURE 30 EUROPE CALCINEURIN INHIBITORS MARKET: BY APPLICATION, CAGR (2025-2032)
FIGURE 31 EUROPE CALCINEURIN INHIBITORS MARKET: BY APPLICATION, LIFELINE CURVE
FIGURE 32 EUROPE CALCINEURIN INHIBITORS MARKET: BY END USER, 2024
FIGURE 33 EUROPE CALCINEURIN INHIBITORS MARKET: BY END USER, 2025-2032 (USD MILLION)
FIGURE 34 EUROPE CALCINEURIN INHIBITORS MARKET: BY END USER, CAGR (2025-2032)
FIGURE 35 EUROPE CALCINEURIN INHIBITORS MARKET: BY END USER, LIFELINE CURVE
FIGURE 36 EUROPE CALCINEURIN INHIBITORS MARKET: BY DISTRIBUTION CHANNEL, 2024
FIGURE 37 EUROPE CALCINEURIN INHIBITORS MARKET: BY DISTRIBUTION CHANNEL, 2025-2032 (USD MILLION)
FIGURE 38 EUROPE CALCINEURIN INHIBITORS MARKET: BY DISTRIBUTION CHANNEL, CAGR (2025-2032)
FIGURE 39 EUROPE CALCINEURIN INHIBITORS MARKET: BY DISTRIBUTION CHANNEL, LIFELINE CURVE
FIGURE 40 EUROPE CALCINEURIN INHIBITORS MARKET: SNAPSHOT
FIGURE 41 EUROPE CALCINEURIN INHIBITORS MARKET: COMPANY SHARE 2024 (%)
Data collection and base year analysis are done using data collection modules with large sample sizes. The stage includes obtaining market information or related data through various sources and strategies. It includes examining and planning all the data acquired from the past in advance. It likewise envelops the examination of information inconsistencies seen across different information sources. The market data is analysed and estimated using market statistical and coherent models. Also, market share analysis and key trend analysis are the major success factors in the market report. To know more, please request an analyst call or drop down your inquiry.
The key research methodology used by DBMR research team is data triangulation which involves data mining, analysis of the impact of data variables on the market and primary (industry expert) validation. Data models include Vendor Positioning Grid, Market Time Line Analysis, Market Overview and Guide, Company Positioning Grid, Patent Analysis, Pricing Analysis, Company Market Share Analysis, Standards of Measurement, Global versus Regional and Vendor Share Analysis. To know more about the research methodology, drop in an inquiry to speak to our industry experts.
Data Bridge Market Research is a leader in advanced formative research. We take pride in servicing our existing and new customers with data and analysis that match and suits their goal. The report can be customized to include price trend analysis of target brands understanding the market for additional countries (ask for the list of countries), clinical trial results data, literature review, refurbished market and product base analysis. Market analysis of target competitors can be analyzed from technology-based analysis to market portfolio strategies. We can add as many competitors that you require data about in the format and data style you are looking for. Our team of analysts can also provide you data in crude raw excel files pivot tables (Fact book) or can assist you in creating presentations from the data sets available in the report.


