Caramel Color Market Overview
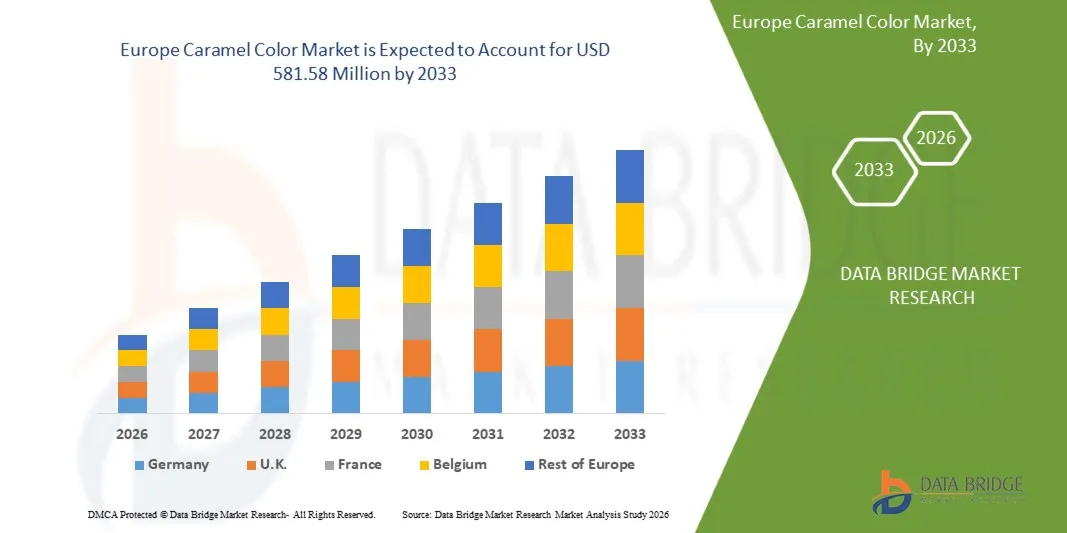
The Europe caramel color market was valued at USD 407.54 million in 2025 and is projected to reach USD 581.58 million by 2033, growing at a CAGR of 4.55% from 2026 to 2033. The increasing demand for natural and clean-label food ingredients, rising consumption of processed and convenience foods, and continuous advancements in food coloring technologies. Food and beverage manufacturers across the globe are increasingly adopting caramel color to enhance the appearance, consistency, and visual appeal of carbonated beverages, bakery products, confectionery, sauces, soups, and other food products. Growing consumer preference for visually appealing food products, improved product consistency, and versatile coloring ingredients is further supporting market expansion.
Furthermore, stringent food safety regulations, growing emphasis on clean-label ingredients, and increasing demand for stable and cost-effective coloring solutions are encouraging manufacturers to develop innovative caramel color products with improved stability, quality, and application flexibility. The expansion of the processed food and beverage industry, coupled with rising demand for ready-to-drink beverages and packaged food products, is expected to create significant growth opportunities for the Europe caramel color market during the forecast period.
Market Size & Forecast
- Europe Market Value (2025): USD 407.54 Million
- Expected Market Value (2033): USD 581.58 Million
- Forecast CAGR (2026–2033): 4.55%
- Leading Region in 2025: Germany
- Fastest Growing Region: U.K.
Key Market Trends & Insights
- Germany dominated the Europe caramel color market with the largest revenue share of 14.50% in 2025, driven by its established food and beverage processing industry, strong demand for packaged foods, and extensive use of caramel color in soft drinks, sauces, bakery products, and confectionery. Growing demand for consistent product appearance, increasing consumption of convenience foods, and continuous innovation in food formulations further strengthened the country's market position.
- The Class IV – E150d (Sulphite Ammonia Caramel) segment led the market with a 50.53% share in 2025, owing to its extensive use in cola beverages, carbonated soft drinks, sauces, and processed food products. Its strong coloring properties, stability in acidic formulations, and ability to deliver consistent brown coloration further supported the segment's dominance.
- The U.K. is expected to be among the fastest-growing countries in the Europe caramel color market, registering an estimated CAGR of 5.68% during 2026–2033, supported by rising demand for processed foods and beverages, increasing consumption of ready-to-drink products, and growing use of caramel color in sauces, bakery products, and confectionery. Product innovation, expanding foodservice operations, and increasing demand for consistent coloring solutions are expected to further support market growth.
- The powder caramel color segment is projected to be the fastest-growing physical form, with an estimated CAGR of 5.47% during the forecast period, reflecting increasing demand for easy-to-handle coloring ingredients in dry food formulations, instant beverage mixes, bakery products, and confectionery. Its storage and transportation advantages and suitability for powdered formulations are expected to support segment growth.
- The beverages / soft drinks segment dominated the end-use segment with a 23.36% revenue share in 2025, driven by the widespread use of caramel color in cola beverages and other carbonated drinks. Demand for consistent coloration, expanding packaged beverage portfolios, and increasing consumption of ready-to-drink products continued to reinforce the segment's leadership.
- The beverage manufacturers segment accounted for 43.54% of the market in 2025, supported by the extensive use of caramel color in carbonated soft drinks, beer and malt beverages, and other beverage formulations. The need for consistent product appearance, reliable ingredient quality, and compatibility with large-scale manufacturing processes further supported demand.
- The bubble tea segment is anticipated to be among the fastest-growing end-use applications, registering an estimated CAGR of 5.29% during 2026–2033, driven by growing interest in specialty beverages, product diversification, and demand for visually appealing drink formulations. Expanding specialty beverage outlets and increasing innovation in tea-based drinks are expected to create further opportunities for caramel color applications..
Report Scope and Caramel Color Market Segmentation
|
Attributes |
Caramel Color Key Market Insights |
|
Segments Covered |
|
|
Countries Covered |
Europe
|
|
Key Market Players |
|
|
Market Opportunities |
|
|
Value Added Data Infosets |
In addition to the insights on market scenarios such as market value, growth rate, segmentation, geographical coverage, and major players, the market reports curated by the Data Bridge Market Research also include in-depth expert analysis, pricing analysis, brand share analysis, consumer survey, demography analysis, supply chain analysis, value chain analysis, raw material/consumables overview, vendor selection criteria, PESTLE Analysis, Porter Analysis, and regulatory framework. |
Caramel Color Market Trends
Trend: Expansion of Clean-Label Formulations, Specialized Caramel Colors, and Application-Specific Solutions
The Europe caramel color market is increasingly shifting toward application-specific, clean-label, and technologically advanced coloring solutions. Food and beverage manufacturers are strengthening collaboration with ingredient suppliers to develop caramel colors with improved stability, consistent shades, and compatibility with diverse formulations, including soft drinks, instant beverage mixes, bakery products, sauces, and confectionery. Growing consumer attention to ingredient transparency, product appearance, and food safety is further encouraging innovation across Class I, Class II, Class III, and Class IV caramel colors.
For instance,
- In March 2025, Sethness-Roquette introduced its dark Class I Powder Caramel Color 1360PW, designed to provide reddish-brown coloration in applications such as spice blends, baked foods, and other food products. This development highlights the growing diversification of powder caramel colors for specialized industrial applications.
- In August 2024, PepsiCo updated its information on caramel coloring, emphasizing regulatory compliance, product safety, and responsiveness to consumer questions regarding caramel color in food and beverages. This reflects the importance of ingredient transparency and consumer confidence in caramel color applications.
- In November 2023, Sethness-Roquette India announced an expansion of its manufacturing facility in Ahmedabad to support growing customer needs in the Indian market. The development highlights the importance of regional production capacity and supply availability for caramel color and related ingredient applications.
Overall, these developments indicate that product specialization, manufacturing capacity, and greater attention to ingredient transparency are shaping the Europe caramel color market. Continued innovation in liquid and powder formulations, alongside application-specific performance improvements, is expected to support broader adoption across beverage, bakery, confectionery, and other industrial food applications.
Europe Caramel Color Market Dynamics
Key Market Driver: Increasing Demand for Consistent Color, Product Quality, and Versatile Food Applications
The Europe caramel color market is experiencing growth as food and beverage manufacturers increasingly prioritize consistent product appearance, color stability, and formulation flexibility. Caramel color is widely used in carbonated soft drinks, beer and malt beverages, instant beverage mixes, bakery products, sauces, soups, and confectionery to achieve standardized shades and improve visual appeal. Growing consumption of packaged foods, expanding beverage production, and increasing demand for convenient food products are encouraging manufacturers to adopt specialized caramel color solutions. Advances in liquid and powder formulations are further supporting efficient processing and application across diverse food categories.
For instance,
- In March 2025, Sethness-Roquette introduced its dark Class I Powder Caramel Color 1360PW for applications including spice blends, baked foods, and other food products. This development demonstrates the expansion of specialized caramel color solutions for manufacturers requiring consistent reddish-brown shades across different formulations.
- In August 2024, PepsiCo updated its information on caramel coloring, highlighting the importance of regulatory compliance, product safety, and addressing consumer questions regarding caramel color in food and beverages. This illustrates the importance of consumer confidence and ingredient transparency in the food and beverage industry.
- In March 2025, the development of Class I powder caramel color for dry food applications highlighted the potential for manufacturers to expand caramel color usage beyond traditional liquid beverage formulations into bakery products, spice blends, and other industrial applications.
The increasing demand for consistent color, formulation flexibility, and reliable product quality is supporting the expansion of the Europe caramel color market. As food and beverage manufacturers continue to diversify their product portfolios, suppliers offering application-specific caramel color solutions are expected to benefit from growing demand across beverage, bakery, confectionery, and other industrial food applications.
Key Restraint/Challenge: Regulatory Compliance, Formulation Complexity, and Raw Material Cost Pressures
Regulatory compliance, formulation complexity, and raw material cost fluctuations remain important challenges for the Europe caramel color market. Manufacturers must maintain consistent color intensity, stability, and quality while meeting applicable food safety requirements. Differences in formulation requirements across beverages, sauces, bakery products, and confectionery can require specialized caramel color grades and additional product testing. Furthermore, fluctuations in the prices of sugar-based raw materials, energy, and processing inputs can increase manufacturing costs and affect profitability. These challenges may be particularly significant for smaller manufacturers and price-sensitive food processing customers.
For instance,
- In August 2024, PepsiCo highlighted the importance of complying with regulatory guidelines and addressing consumer questions regarding caramel coloring. This demonstrates the continuing need for food and beverage companies to maintain regulatory compliance and communicate ingredient safety information, which can increase quality assurance and documentation requirements.
- In March 2025, Sethness-Roquette introduced a specialized Class I powder caramel color for selected dry food applications. The development illustrates the need for application-specific formulation and technical product development to meet differing requirements across industrial food categories.
- In August 2024, the U.S. Food and Drug Administration's regulatory framework continued to require caramel color used in food products to comply with applicable color additive provisions. Manufacturers therefore need to ensure that their products meet relevant specifications and permitted-use requirements across target markets.
Regulatory requirements, specialized formulation needs, and raw material price volatility can constrain the expansion of the Europe caramel color market. Manufacturers must balance product performance, compliance, and cost efficiency while maintaining consistent quality. Investments in process optimization, quality control, and efficient raw material management can help mitigate these challenges.
Key Market Opportunity: Rising Demand for Application-Specific and Clean-Label Caramel Color Solutions
The growing demand for application-specific and clean-label coloring solutions is creating opportunities in the Europe caramel color market. Food and beverage manufacturers are increasingly seeking caramel colors that deliver consistent shades, stability, and compatibility with different product formulations. Growing consumption of instant coffee, tea premixes, soft drinks, bakery products, sauces, and confectionery is encouraging suppliers to develop specialized liquid and powder formulations. In addition, increasing attention to ingredient transparency and product specifications is creating opportunities for Class I caramel color and other tailored solutions that meet particular formulation and labeling requirements.
Technological advancements in caramelization processes, powder formulation, and color stability are enabling suppliers to address a broader range of industrial applications. At the same time, expanding food processing capacity in emerging economies and growing demand for consistent coloring ingredients are creating opportunities for manufacturers to strengthen regional distribution and develop customized solutions for food and beverage producers.
For instance,
- In March 2025, Sethness-Roquette introduced its dark Class I Powder Caramel Color 1360PW for use in applications such as spice blends and baked foods. This development highlights opportunities to expand powder caramel color applications across dry food formulations and specialized industrial uses.
- In November 2023, Sethness-Roquette India announced the expansion of its manufacturing facility in Ahmedabad to support growing customer needs in the Indian market. This development demonstrates the opportunity to strengthen regional supply capabilities and serve expanding demand for caramel color ingredients.
- In August 2024, PepsiCo emphasized regulatory compliance and responsiveness to consumer questions regarding caramel coloring in food and beverages. This highlights the opportunity for caramel color suppliers to support manufacturers through reliable product specifications, transparent technical information, and application guidance.
Therefore, rising demand for consistent coloration, specialized formulations, and reliable ingredient supply is creating opportunities for suppliers in the Europe caramel color market. Continued product innovation, regional manufacturing expansion, and technical collaboration with food and beverage manufacturers are expected to support the development of application-specific caramel color solutions across the forecast period.
Europe Caramel Color Market Scope
The Europe caramel color market is segmented into four notable segments based on product class, physical form, end use, and customer segment.
- By Product Class
On the basis of product class, the market is segmented into Class I – E150a (Plain Caramel), Class II – E150b (Caustic Sulphite Caramel), Class III – E150c (Ammonia Caramel), and Class IV – E150d (Sulphite Ammonia Caramel). In 2025, the Class IV – E150d segment is expected to dominate the Europe caramel color market with a market share of 50.53% due to its extensive use in carbonated soft drinks, particularly cola beverages, as well as sauces and other processed food products. Its strong coloring properties, stability in acidic formulations, and suitability for large-scale beverage production support widespread adoption. Growing consumption of packaged beverages and increasing demand for consistent product appearance further strengthen the segment's market position.
The Class I – E150a segment is projected to register an estimated CAGR of 5.50% from 2026 to 2033, owing to increasing interest in caramel colors produced without ammonium or sulfite compounds and growing demand for alternative coloring solutions. Its potential applications in selected food products, bakery formulations, and beverages, combined with increasing attention to ingredient composition and formulation requirements, are expected to support segment growth.
- By Physical Form
On the basis of physical form, the market is segmented into liquid caramel color, powder caramel color, and other commercial forms. In 2025, the liquid caramel color segment is expected to dominate the Europe caramel color market with a market share of 76.80% due to its ease of handling, convenient integration into liquid formulations, and widespread use in beverages, sauces, soups, and condiments. Its ability to provide uniform coloration, simplify industrial processing, and support large-scale food and beverage production strengthens adoption. Growing demand for carbonated soft drinks, beer and malt beverages, and liquid food preparations further supports the segment's market leadership.
The powder caramel color segment is projected to register an estimated CAGR of 5.60% from 2026 to 2033, owing to its convenient storage, ease of transportation, and suitability for dry food formulations. Increasing demand for instant beverage mixes, 3-in-1 coffee, tea premixes, bakery products, and confectionery is encouraging manufacturers to adopt powder-based coloring solutions. Improved handling efficiency and flexibility in ingredient formulation are expected to support segment growth.
- By End Use
On the basis of end use, the market is segmented into 3-in-1 coffee, tea premixes, instant beverage mixes, bubble tea, vending, bakery, soups, sauces & condiments, confectionery, beverages / soft drinks, beer & malt beverages, and other industrial applications. In 2025, the beverages / soft drinks segment is expected to dominate the Europe caramel color market with a market share of 23.36% due to the extensive use of caramel color in cola beverages and other carbonated drinks. Its ability to deliver consistent brown coloration, maintain visual uniformity, and perform effectively in acidic beverage formulations supports widespread adoption. Rising consumption of packaged beverages, expanding beverage production, and increasing demand for standardized product appearance further strengthen the segment's market leadership.
The bubble tea segment is projected to register an estimated CAGR of 5.40% from 2026 to 2033, owing to the growing popularity of specialty tea beverages, innovative drink formulations, and expanding availability of customized beverage options. Increasing demand for visually appealing drinks, expanding specialty beverage outlets, and growing product diversification are expected to create opportunities for caramel color applications in bubble tea formulations.
- By Customer Segment
On the basis of customer segment, the market is segmented into beverage manufacturers, coffee & tea premix companies, vending companies, bubble tea chains, bakery manufacturers, sauce / soup / condiment manufacturers, confectionery manufacturers, HoReCa / foodservice, and other industrial food users. In 2025, the beverage manufacturers segment is expected to dominate the Europe caramel color market with a market share of 43.54% due to the extensive consumption of caramel color in carbonated soft drinks, beer and malt beverages, and other beverage formulations. The need for consistent coloration, reliable ingredient quality, and compatibility with large-scale manufacturing processes supports strong demand. Growing packaged beverage production and continuous product innovation further reinforce the segment's market leadership.
The coffee & tea premix companies segment is projected to register an estimated CAGR of 6.20% from 2026 to 2033, driven by increasing consumption of instant coffee, tea premixes, and convenient beverage products. Expanding vending operations, rising demand for ready-to-prepare drinks, and diversification of instant beverage formulations are encouraging manufacturers to adopt specialized caramel color solutions. Growing demand for consistent appearance and efficient ingredient handling is expected to support segment growth.
France Caramel Color Market Regional Analysis
The France caramel color market is driven by the country's established food and beverage manufacturing industry, rising demand for processed foods, and growing consumption of packaged beverages. Caramel color is widely used in soft drinks, sauces, condiments, confectionery, bakery products, and alcoholic beverages to achieve consistent color and visual appeal. Increasing demand for premium food products, continued innovation in ingredient formulations, and manufacturers' focus on product consistency and regulatory compliance further support market growth across the country..
Spain Caramel Color Market Insight
The Spain caramel color market is driven by expanding food and beverage production, increasing consumption of packaged drinks, and rising demand for processed food products. Caramel color is used in carbonated soft drinks, sauces, soups, seasonings, bakery products, confectionery, and beer to improve appearance and maintain consistent product color. Growth in foodservice, tourism-related food consumption, and the development of convenient food and beverage offerings further support demand. Continued investment in food processing and product formulation is expected to contribute to market expansion.
U.K. Caramel Color Market Insight
The U.K. caramel color market is driven by strong demand for packaged beverages, processed foods, and convenient food products. Caramel color is widely used in soft drinks, sauces, gravies, soups, confectionery, bakery products, and beer and malt beverages to provide consistent coloring and enhance product appearance. The growth of ready-to-drink beverages, instant beverage mixes, and private-label food products further supports its adoption. Increasing focus on ingredient quality, formulation consistency, and compliance with food safety requirements continues to shape market development across the country.
Europe Caramel Color Market Share
The Europe Caramel Color industry is primarily led by well-established companies, including:
- Ethness Roquette (France)
- Givaudan Sense Colour (U.S.)
- Nigay (France)
- Oterra (Denmark)
- Ingredion (U.S.)
Latest Developments in Europe Caramel Color Market
- In March 2025, Sethness-Roquette introduced Class I Powder Caramel Color 1360PW, designed for applications such as spice blends and baked foods. The launch highlights the development of application-specific caramel color solutions that offer consistent coloring performance in dry food formulations and support manufacturers seeking greater flexibility in product development.
- In August 2024, PepsiCo provided updated information regarding caramel coloring, addressing product safety, regulatory compliance, and consumer questions. This highlights the importance of ingredient transparency and compliance with applicable food safety requirements in the use of caramel color across beverage and packaged food applications.
- In November 2023, Sethness-Roquette India announced the expansion of its manufacturing facility in Ahmedabad, strengthening its production capabilities and supporting the supply of caramel color solutions to food and beverage manufacturers. The expansion reflects continued investment in manufacturing capacity to meet demand from diverse industrial applications.
- In March 2025, the introduction of Class I powder caramel color for dry food applications highlighted growing opportunities for specialized coloring solutions in bakery products, spice blends, and other powdered formulations. Such developments support manufacturers seeking convenient ingredients that deliver consistent color and simplify incorporation into dry mixes.
- In August 2024, growing attention to regulatory compliance and consumer understanding of caramel coloring reinforced the importance of transparent ingredient information and adherence to food safety standards. These considerations continue to influence caramel color selection and formulation practices among food and beverage manufacturers.
- Interactive Data Analysis Dashboard
- Company Analysis Dashboard for high growth potential opportunities
- Research Analyst Access for customization & queries
- Competitor Analysis with Interactive dashboard
- Latest News, Updates & Trend analysis
- Harness the Power of Benchmark Analysis for Comprehensive Competitor Tracking
Table of Content
1 EXECUTIVE SUMMARY
1.1 EUROPE CARAMEL COLOR INDUSTRY OVERVIEW
1.2 MARKET DEFINITION AND SCOPE
1.3 KEY FINDINGS
1.4 EUROPE DEMAND OVERVIEW
1.5 EUROPE SUPPLY OVERVIEW
1.6 DEMAND–SUPPLY BALANCE
1.7 LARGEST CONSUMING COUNTRIES
1.8 MAJOR MANUFACTURERS
1.9 MAJOR B2B CUSTOMER SEGMENTS
1.1 TRADE FLOW HIGHLIGHTS
1.11 PRICING HIGHLIGHTS
1.12 RAW MATERIAL OUTLOOK
1.13 INDIA MANUFACTURING COMPETITIVENESS
1.14 FIVE-YEAR INDUSTRY OUTLOOK
2 PREMIUM INSIGHTS
2.1 PORTER'S FIVE FORCES ANALYSIS
2.2 PESTLE ANALYSIS
3 RESEARCH METHODOLOGY AND MARKET DEFINITION
3.1 RESEARCH APPROACH
3.2 RESEARCH FRAMEWORK
3.3 PRIMARY AND SECONDARY RESEARCH
3.4 DATA SOURCES AND SOURCE HIERARCHY
3.5 MARKET ESTIMATION METHODOLOGY
3.6 VOLUME ESTIMATION METHODOLOGY
3.7 VALUE ESTIMATION METHODOLOGY
3.8 PRICING METHODOLOGY
3.9 SUPPLY ESTIMATION METHODOLOGY
3.1 DEMAND–SUPPLY RECONCILIATION
3.11 TRADE FLOW VALIDATION
3.12 DATA TRIANGULATION
3.13 FORECASTING METHODOLOGY
3.14 ASSUMPTIONS AND LIMITATIONS
3.15 PRODUCT DEFINITION
3.16 INCLUDED PRODUCTS
3.17 EXCLUDED PRODUCTS
3.18 REGIONAL TERMINOLOGY
3.19 HS/HSN CLASSIFICATION ASSESSMENT
4 CARAMEL COLOR PRODUCT CLASSIFICATION
4.1 CLASS I – E150A / PLAIN CARAMEL
4.2 CLASS II – E150B / CAUSTIC SULPHITE CARAMEL
4.3 CLASS III – E150C / AMMONIA CARAMEL
4.4 CLASS IV – E150D / SULPHITE AMMONIA CARAMEL
4.5 LIQUID CARAMEL COLOR
4.6 POWDER CARAMEL COLOR
4.7 STANDARD GRADES
4.8 HIGH-COLOR / HIGH-TINCTORIAL-STRENGTH GRADES
4.9 SPECIALTY / APPLICATION-SPECIFIC GRADES
4.1 CLEAN-LABEL-ORIENTED PRODUCT POSITIONING
4.11 REGIONAL PRODUCT TERMINOLOGY
5 EUROPE DEMAND ASSESSMENT
5.1 EUROPE DEMAND BY VOLUME
5.2 EUROPE DEMAND BY VALUE
5.3 HISTORICAL DEMAND GROWTH
5.4 EXPECTED DEMAND GROWTH – FIVE YEARS
5.5 MAJOR DEMAND DRIVERS
5.6 DEMAND RESTRAINTS
5.7 EMERGING DEMAND AREAS
5.8 LARGEST CONSUMING COUNTRIES
5.9 LARGEST CONSUMING REGIONS
6 CUSTOMER MAPPING & CONSUMPTION ANALYSIS
6.1 MAJOR B2B CONSUMERS BY GEOGRAPHY
6.2 COMPANY NAME
6.3 COUNTRY / MANUFACTURING LOCATION
6.4 ESTIMATED ANNUAL CARAMEL COLOR CONSUMPTION (MT)
6.5 PRIMARY APPLICATION(S)
6.6 PREFERRED GRADE / CLASS
6.7 PREFERRED PHYSICAL FORM
6.8 EXISTING SUPPLIER(S), WHERE AVAILABLE
6.9 PURCHASING CRITERIA
6.1 TOP CONSUMING COMPANIES BY GEOGRAPHY
6.11 TOP 10 CUSTOMER CONCENTRATION
7 CUSTOMER & PRODUCT TECHNICAL REQUIREMENTS
7.1 COLOR STRENGTH
7.2 SHADE / HUE
7.3 TINCTORIAL STRENGTH
7.4 SOLUBILITY / DISPERSION
7.5 COLLOIDAL CHARGE
7.6 ACID STABILITY
7.7 HEAT / PROCESS STABILITY
7.8 LIGHT STABILITY
7.9 MOUTHFEEL / SENSORY IMPACT
7.1 FOAMING / FUNCTIONAL CHARACTERISTICS, WHERE APPLICABLE
7.11 SHELF LIFE
7.12 MICROBIOLOGICAL REQUIREMENTS
7.13 TECHNICAL DOCUMENTATION
7.14 CERTIFICATE OF ANALYSIS REQUIREMENTS
7.15 CUSTOMER SUPPLIER-SELECTION CRITERIA
8 EUROPE SUPPLY ASSESSMENT
8.1 EUROPE SUPPLY BY VOLUME
8.2 SUPPLY BY REGION
8.3 SUPPLY BY CARAMEL CLASS
8.4 SUPPLY BY PHYSICAL FORM
8.5 MAJOR MANUFACTURING COUNTRIES
8.6 MANUFACTURING HUBS
8.7 INSTALLED PRODUCTION CAPACITY
8.8 EFFECTIVE CAPACITY
8.9 CAPACITY UTILIZATION
8.1 CAPACITY ADDITIONS UNDER IMPLEMENTATION
8.11 ANNOUNCED EXPANSION PROJECTS
8.12 SUPPLY OUTLOOK – FIVE YEARS
9 MANUFACTURER & PRODUCTION CAPACITY ASSESSMENT
9.1 MAJOR MANUFACTURERS
9.2 PRODUCTION LOCATIONS
9.3 PRODUCTION CAPACITY
9.4 CAPACITY UTILIZATION
9.5 PRODUCT PORTFOLIO
9.6 GRADES MANUFACTURED
9.7 APPLICATIONS SERVED
9.8 GEOGRAPHIC PRESENCE
9.9 CERTIFICATIONS
9.1 RECENT DEVELOPMENTS
9.11 EXPANSION PLANS
9.12 MANUFACTURER-LEVEL SUPPLY CONTRIBUTION
10 SUPPLY–DEMAND BALANCE
10.1 EUROPE SUPPLY–DEMAND BALANCE
10.2 REGIONAL BALANCE
10.3 COUNTRY-LEVEL BALANCE
10.4 DEFICIT MARKETS
10.5 BALANCED MARKETS
10.6 SURPLUS MARKETS
10.7 STRUCTURAL IMPORT-DEPENDENT MARKETS
10.8 EXPORT-ORIENTED MANUFACTURING HUBS
10.9 CURRENT BALANCE VS. FIVE-YEAR EXPECTED BALANCE
11 TRADE FLOW ANALYSIS
11.1 EUROPE IMPORTS
11.2 IMPORT VOLUMES
11.3 IMPORT VALUES
11.4 MAJOR IMPORTING COUNTRIES
11.5 MAJOR IMPORTERS / BUYERS, WHERE AVAILABLE
11.6 EUROPE EXPORTS
11.7 EXPORT VOLUMES
11.8 EXPORT VALUES
11.9 MAJOR EXPORTING COUNTRIES
11.1 MAJOR EXPORTERS / MANUFACTURERS
11.11 MAJOR TRADE ROUTES
11.12 IMPORT DEPENDENCE
11.13 EXPORT ORIENTATION
11.14 THREE-TO-FIVE-YEAR TRADE EVOLUTION
11.15 TRADE FLOWS VS. SUPPLY–DEMAND BALANCE
12 PRICING & COMMERCIAL ASSESSMENT
12.1 CURRENT B2B MARKET PRICES
12.2 HISTORICAL PRICE TRENDS
12.3 PRICE BY CARAMEL CLASS
12.4 PRICE BY PHYSICAL FORM
12.5 REGIONAL PRICE DIFFERENCES
12.6 DISTRIBUTOR VS. MANUFACTURER PRICING
12.7 CONTRACT / SPOT PRICING, WHERE OBSERVABLE
12.8 MAJOR PRICING DRIVERS
12.9 PRICE OUTLOOK – FIVE YEARS
13 RAW MATERIAL ASSESSMENT
13.1 RAW MATERIALS USED IN CARAMEL COLOR PRODUCTION
13.2 EUROPE RAW MATERIAL PRODUCTION
13.3 MAJOR PRODUCING COUNTRIES
13.4 MAJOR EXPORTING COUNTRIES
13.5 MAJOR SUPPLIERS TO INDIA
13.6 RAW MATERIAL PRICE HISTORY
13.7 CURRENT RAW MATERIAL PRICES
13.8 RAW MATERIAL PRICE OUTLOOK
13.9 RAW MATERIAL AVAILABILITY RISKS
13.1 APPROXIMATE RAW MATERIAL CONSUMPTION BY CARAMEL COLOR INDUSTRY
14 INDIA MANUFACTURING COMPETITIVENESS
14.1 INDIAN CARAMEL COLOR INDUSTRY
14.2 INDIAN MANUFACTURERS
14.3 MANUFACTURING CAPACITY
14.4 RAW MATERIAL AVAILABILITY
14.5 RAW MATERIAL COST
14.6 LABOR AND CONVERSION COST
14.7 ENERGY COST
14.8 PRODUCTION SCALE
14.9 PRODUCT / TECHNOLOGY CAPABILITY
14.1 PRODUCT CUSTOMIZATION
14.11 CERTIFICATIONS
14.12 EXPORT COMPETITIVENESS
14.13 LOGISTICS AND MARKET ACCESS
15 INDIA VS. CHINA / INDONESIA / MALAYSIA / OTHER EXPORTERS
15.1 RAW MATERIAL COST
15.2 FEEDSTOCK AVAILABILITY
15.3 MANUFACTURING SCALE
15.4 CONVERSION COST
15.5 LABOR COST
15.6 PRODUCT CAPABILITY
15.7 CUSTOMIZATION
15.8 TECHNICAL SUPPORT
15.9 FOOD SAFETY CERTIFICATIONS
15.1 EXPORT COMPETITIVENESS
15.11 LOGISTICS / MARKET ACCESS
15.12 OVERALL MANUFACTURING COMPETITIVENESS
16 REGULATORY REQUIREMENTS
16.1 EUROPE REGULATORY FRAMEWORK
16.2 EUROPEAN UNION
16.3 UNITED STATES
16.4 INDIA
16.5 CHINA
16.6 JAPAN
16.7 SOUTH KOREA
16.8 OTHER MAJOR MARKETS
16.9 HS/HSN CLASSIFICATION
16.1 IMPORT REQUIREMENTS
16.11 LABELING REQUIREMENTS
16.12 PERMITTED USES / CONDITIONS OF USE
17 CERTIFICATION REQUIREMENTS
17.1 RSPO
17.2 HALAL
17.3 KOSHER
17.4 FDA-RELATED REQUIREMENTS
17.5 FSSC 22000
17.6 BRCGS
17.7 ORGANIC
17.8 NON-GMO
17.9 OTHER RELEVANT CERTIFICATIONS
17.1 LEGALLY MANDATORY CERTIFICATIONS
17.11 CUSTOMER-MANDATED CERTIFICATIONS
17.12 COMMERCIALLY PREFERRED CERTIFICATIONS
18 INDUSTRY TRENDS & MARKET OUTLOOK
18.1 EMERGING PRODUCT CATEGORIES
18.2 NEW APPLICATION AREAS
18.3 TECHNOLOGY DEVELOPMENTS
18.4 CLEAN-LABEL TRENDS
18.5 SPECIALTY CARAMEL TRENDS
18.6 SUSTAINABILITY TRENDS
18.7 REGULATORY TRENDS
18.8 KEY INDUSTRY RISKS
18.9 FUTURE DEMAND OPPORTUNITIES
18.1 FIVE-YEAR INDUSTRY OUTLOOK
19 EUROPE CARAMEL COLOR MARKET, BY PRODUCT CLASS, 2018–2033 (USD MILLION)
19.1 OVERVIEW
19.2 CLASS I – E150A (PLAIN CARAMEL)
19.3 CLASS II – E150B (CAUSTIC SULPHITE CARAMEL)
19.4 CLASS III – E150C (AMMONIA CARAMEL)
19.5 CLASS IV – E150D (SULPHITE AMMONIA CARAMEL)
20 EUROPE CARAMEL COLOR MARKET, BY PHYSICAL FORM, 2018–2033 (USD MILLION)
20.1 OVERVIEW
20.2 LIQUID CARAMEL COLOR
20.3 POWDER CARAMEL COLOR
20.4 OTHER COMMERCIAL FORMS
21 EUROPE CARAMEL COLOR MARKET, BY END USE, 2018–2033 (USD MILLION)
21.1 OVERVIEW
21.2 3-IN-1 COFFEE
21.3 TEA PREMIXES
21.4 INSTANT BEVERAGE MIXES
21.5 BUBBLE TEA
21.6 VENDING
21.7 BAKERY
21.8 SOUPS
21.9 SAUCES & CONDIMENTS
21.1 CONFECTIONERY
21.11 BEVERAGES / SOFT DRINKS
21.12 BEER & MALT BEVERAGES
21.13 OTHER INDUSTRIAL APPLICATIONS
22 EUROPE CARAMEL COLOR MARKET, BY CUSTOMER SEGMENT, 2018–2033 (USD MILLION)
22.1 OVERVIEW
22.2 BEVERAGE MANUFACTURERS
22.3 COFFEE & TEA PREMIX COMPANIES
22.4 VENDING COMPANIES
22.5 BUBBLE TEA CHAINS
22.6 BAKERY MANUFACTURERS
22.7 SAUCE / SOUP / CONDIMENT MANUFACTURERS
22.8 CONFECTIONERY MANUFACTURERS
22.9 HORECA / FOODSERVICE
22.1 OTHER INDUSTRIAL FOOD USERS
23 EUROPE CARAMEL COLOR MARKET, BY REGION, 2018–2033 (USD MILLION)
23.1 OVERVIEW
23.1.1 EUROPE
23.1.1.1 GERMANY
23.1.1.2 U.K.
23.1.1.3 FRANCE
23.1.1.4 ITALY
23.1.1.5 SPAIN
23.1.1.6 REST OF EUROPE
24 COMPETITIVE LANDSCAPE
24.1 INDUSTRY STRUCTURE
24.2 MAJOR MANUFACTURERS
24.3 MANUFACTURER POSITIONING
24.4 PRODUCT PORTFOLIO COMPARISON
24.5 GEOGRAPHIC FOOTPRINT
24.6 MANUFACTURING FOOTPRINT
24.7 CAPACITY COMPARISON
24.8 APPLICATION COVERAGE
24.9 RECENT DEVELOPMENTS
24.1 CAPACITY EXPANSION / NEW PROJECTS
25 EUROPE CARAMEL COLOR MARKET, COMPANY PROFILES
25.1 EUROPE COLOUR AND INGREDIENT HOUSES
25.1.1 SETHNESS ROQUETTE
25.1.1.1 COMPANY OVERVIEW
25.1.1.2 REVENUE ANALYSIS
25.1.1.3 GEOGRAPHIC PRESENCE
25.1.1.4 PRODUCT PORTFOLIO
25.1.1.5 RECENT DEVELOPMENTS
25.1.1.5.1 M&A
25.1.1.5.2 PRODUCTION CAPACITY EXPANSION
25.1.1.5.3 JOINT VENTURES
25.1.1.5.4 INNOVATIONS
25.1.1.5.5 OTHERS
25.1.2 GIVAUDAN SENSE COLOUR
25.1.2.1 COMPANY OVERVIEW
25.1.2.2 REVENUE ANALYSIS
25.1.2.3 GEOGRAPHIC PRESENCE
25.1.2.4 PRODUCT PORTFOLIO
25.1.2.5 RECENT DEVELOPMENTS
25.1.2.5.1 MAJOR DEALS
25.1.2.5.2 M&A
25.1.2.5.3 PRODUCT ACQUISITION
25.1.2.5.4 PRODUCTION CAPACITY EXPANSION
25.1.2.5.5 OTHERS
25.1.3 NIGAY
25.1.3.1 COMPANY OVERVIEW
25.1.3.2 REVENUE ANALYSIS
25.1.3.3 GEOGRAPHIC PRESENCE
25.1.3.4 PRODUCT PORTFOLIO
25.1.3.5 RECENT DEVELOPMENTS
25.1.3.5.1 COLLABORATION
25.1.3.5.2 PRODUCTION CAPACITY EXPANSION
25.1.3.5.3 JOINT VENTURES
25.1.3.5.4 INNOVATIONS
25.1.3.5.5 OTHERS
25.1.4 OTERRA
25.1.4.1 COMPANY OVERVIEW
25.1.4.2 REVENUE ANALYSIS
25.1.4.3 GEOGRAPHIC PRESENCE
25.1.4.4 PRODUCT PORTFOLIO
25.1.4.5 RECENT DEVELOPMENTS
25.1.4.5.1 M&A
25.1.4.5.2 PRODUCT ACQUISITION
25.1.4.5.3 PRODUCTION CAPACITY EXPANSION
25.1.4.5.4 INNOVATIONS
25.1.4.5.5 OTHERS
25.1.5 INGREDION
25.1.5.1 COMPANY OVERVIEW
25.1.5.2 REVENUE ANALYSIS
25.1.5.3 GEOGRAPHIC PRESENCE
25.1.5.4 PRODUCT PORTFOLIO
25.1.5.4.1 OTHERS
25.2 REGIONAL AND INDIAN CARAMEL COLOUR MANUFACTURERS
25.2.1 AARKAY FOOD PRODUCTS LTD
25.2.1.1 COMPANY OVERVIEW
25.2.1.2 REVENUE ANALYSIS
25.2.1.3 GEOGRAPHIC PRESENCE
25.2.1.4 PRODUCT PORTFOLIO
25.2.1.4.1 PRODUCTION CAPACITY EXPANSION
25.2.1.4.2 PRODUCT LAUNCHES
25.2.1.4.3 OTHERS
25.2.2 ALVIN CARAMEL COLOURS (INDIA) PVT LTD
25.2.2.1 COMPANY OVERVIEW
25.2.2.2 REVENUE ANALYSIS
25.2.2.3 GEOGRAPHIC PRESENCE
25.2.2.4 PRODUCT PORTFOLIO
25.2.2.4.1 INNOVATIONS
25.2.2.4.2 PRODUCT LAUNCHES
25.2.2.4.3 OTHERS
25.2.3 MASCOT FOOD COLOURS
25.2.3.1 COMPANY OVERVIEW
25.2.3.2 REVENUE ANALYSIS
25.2.3.3 GEOGRAPHIC PRESENCE
25.2.3.4 PRODUCT PORTFOLIO
25.2.3.4.1 PRODUCT LAUNCHES
25.2.3.4.2 OTHERS
25.2.4 VINAYAK INGREDIENTS (INDIA) PVT LTD
25.2.4.1 COMPANY OVERVIEW
25.2.4.2 REVENUE ANALYSIS
25.2.4.3 GEOGRAPHIC PRESENCE
25.2.4.4 PRODUCT PORTFOLIO
25.2.4.4.1 PRODUCT LAUNCHES
25.2.4.4.2 OTHERS
25.2.5 SAYAJI INDUSTRIES
25.2.5.1 COMPANY OVERVIEW
25.2.5.2 REVENUE ANALYSIS
25.2.5.3 GEOGRAPHIC PRESENCE
25.2.5.4 PRODUCT PORTFOLIO
25.2.5.5 RECENT DEVELOPMENTS
25.2.5.5.1 MAJOR DEALS
25.2.5.5.2 PRODUCTION CAPACITY EXPANSION
25.2.5.5.3 JOINT VENTURES
25.2.5.5.4 OTHERS
25.2.6 QIANHE FOOD
25.2.6.1 COMPANY OVERVIEW
25.2.6.2 REVENUE ANALYSIS
25.2.6.3 GEOGRAPHIC PRESENCE
25.2.6.4 PRODUCT PORTFOLIO
25.2.6.5 RECENT DEVELOPMENTS
25.2.6.5.1 PRODUCTION CAPACITY EXPANSION
25.2.6.5.2 INNOVATIONS
25.2.6.5.3 OTHERS
25.2.7 KANGLONG
25.2.7.1 COMPANY OVERVIEW
25.2.7.2 REVENUE ANALYSIS
25.2.7.3 GEOGRAPHIC PRESENCE
25.2.7.4 PRODUCT PORTFOLIO
25.2.7.4.1 PRODUCTION CAPACITY EXPANSION
25.2.7.4.2 EVENTS
25.2.7.4.3 OTHERS
26 DATABASES & SUPPORTING DELIVERABLES
26.1 DEMAND DATABASE
26.2 SUPPLY & CAPACITY DATABASE
26.3 TRADE FLOW DATABASE
26.4 CUSTOMER & BUYER MAPPING DATABASE
26.5 MANUFACTURER DATABASE
26.6 PRICING DATABASE
26.7 RAW MATERIAL DATABASE
26.8 REGULATORY DATABASE
26.9 CERTIFICATION DATABASE
26.1 SOURCE REFERENCE DATABASE
27 SOURCES, ASSUMPTIONS & DATA QUALITY
27.1 SOURCE HIERARCHY
27.2 OFFICIAL GOVERNMENT SOURCES
27.3 INTERNATIONAL DATABASES
27.4 COMPANY AND TECHNICAL SOURCES
27.5 RETAIL / DISTRIBUTOR SOURCES
27.6 PRIMARY RESEARCH
27.7 DATA GAP TREATMENT
27.8 PROXY INDICATOR TREATMENT
27.9 DATA TRIANGULATION
27.1 QUALITY-CONTROL CHECKS
27.11 GEOGRAPHIC RECONCILIATION
27.12 SEGMENT RECONCILIATION
27.13 KEY ASSUMPTIONS AND LIMITATIONS
List of Table
TABLE 1 EUROPE CARAMEL COLOR MARKET: SEGMENTATION AT A GLANCE, 2025
TABLE 2 EUROPE CARAMEL COLOR MARKET: EUROPE DEMAND BY END USE, 2025
TABLE 3 EUROPE CARAMEL COLOR MARKET: REGIONAL SUPPLY AND DEMAND BALANCE, 2024
TABLE 4 EUROPE CARAMEL COLOR MARKET: LARGEST CONSUMING COUNTRIES BY VALUE, 2025
TABLE 5 EUROPE CARAMEL COLOR MARKET: EUROPE MARKET BY CUSTOMER SEGMENT, 2025
TABLE 6 EUROPE CARAMEL COLOR MARKET: PRICE GRID BY REGION AND PHYSICAL FORM, 2025 (USD PER METRIC TON)
TABLE 7 EUROPE CARAMEL COLOR MARKET: PORTER'S FIVE FORCES
TABLE 8 EUROPE CARAMEL COLOR MARKET: SOURCE HIERARCHY, AND WHAT EACH RANK IS USED FOR
TABLE 9 EUROPE CARAMEL COLOR MARKET: THE VOLUME IDENTITY, AND WHAT EACH TERM RESTS ON
TABLE 10 EUROPE CARAMEL COLOR MARKET: REGIONAL DESIGNATIONS FOR THE SAME FOUR CLASSES
TABLE 11 EUROPE CARAMEL COLOR MARKET: CUSTOMS TREATMENT OF CARAMEL, BY JURISDICTION
TABLE 12 EUROPE CARAMEL COLOR MARKET: EUROPE DEMAND BY VOLUME AND REGION, METRIC TONS
TABLE 13 EUROPE CARAMEL COLOR MARKET: EUROPE DEMAND BY VALUE AND REGION, USD MILLION
TABLE 14 EUROPE CARAMEL COLOR MARKET: FIVE-YEAR DEMAND OUTLOOK BY REGION, 2025 TO 2030
TABLE 15 EUROPE CARAMEL COLOR MARKET: CONSUMING COUNTRIES RANKED BY VALUE, 2025
TABLE 16 EUROPE CARAMEL COLOR MARKET: REGIONS RANKED ON BOTH BASES, 2025
TABLE 17 EUROPE CARAMEL COLOR MARKET: COLA BOTTLERS, SIZED ON PUBLISHED UNIT CASE VOLUME
TABLE 18 EUROPE CARAMEL COLOR MARKET: BUYER GROUPS AGAINST APPLICATIONS AND CLASS
TABLE 19 EUROPE CARAMEL COLOR MARKET: LARGEST BREWING GROUPS BY PUBLISHED PRODUCTION
TABLE 20 EUROPE CARAMEL COLOR MARKET: TINCTORIAL MEASUREMENT BASES, ONE GRADE
TABLE 21 EUROPE CARAMEL COLOR MARKET: COLLOIDAL CHARGE BY CLASS
TABLE 22 EUROPE CARAMEL COLOR MARKET: SUPPLIER-SELECTION CRITERIA IN ORDER OF APPLICATION
TABLE 23 EUROPE CARAMEL COLOR MARKET: SUPPLY AND DEMAND BY REGION, 2024 (METRIC TONS)
TABLE 24 EUROPE CARAMEL COLOR MARKET: VERIFIED CARAMEL COLOUR PRODUCERS
TABLE 25 EUROPE CARAMEL COLOR MARKET: MANUFACTURING LOCATIONS BY PRODUCER
TABLE 26 EUROPE CARAMEL COLOR MARKET: CAPACITY FIGURES ON THE PUBLIC RECORD
TABLE 27 EUROPE CARAMEL COLOR MARKET: PRODUCT PORTFOLIO BY PRODUCER
TABLE 28 EUROPE CARAMEL COLOR MARKET: CLASSES AGAINST THE APPLICATIONS THEY SERVE
TABLE 29 EUROPE CARAMEL COLOR MARKET: HEADQUARTERS AND MANUFACTURING FOOTPRINT
TABLE 30 EUROPE CARAMEL COLOR MARKET: DEVELOPMENTS BY PRODUCER
TABLE 31 EUROPE CARAMEL COLOR MARKET: ESTIMATED SUPPLY CONTRIBUTION BY NAMED PRODUCER, 2025
TABLE 32 EUROPE CARAMEL COLOR MARKET: REGIONAL SUPPLY–DEMAND BALANCE, 2024 (METRIC TONS)
TABLE 33 EUROPE CARAMEL COLOR MARKET: EU27 EXTRA-EU IMPORTS BY VOLUME (METRIC TONS)
TABLE 34 EUROPE CARAMEL COLOR MARKET: PORTER'S FIVE FORCES
TABLE 35 EUROPE CARAMEL COLOR MARKET: EU27 EXTRA-EU EXPORTS BY VOLUME (METRIC TONS)
TABLE 36 EUROPE CARAMEL COLOR MARKET: EU27 EXTRA-EU EXPORT VALUE AND UNIT VALUE
TABLE 37 EUROPE CARAMEL COLOR MARKET: PORTER'S FIVE FORCES
TABLE 38 EUROPE CARAMEL COLOR MARKET: TRADE AGAINST BALANCE, 2024
TABLE 39 EUROPE CARAMEL COLOR MARKET: CURRENT PRICES BY REGION AND FORM, 2025 (USD PER METRIC TON)
TABLE 40 EUROPE CARAMEL COLOR MARKET: PRICE HISTORY, LIQUID GRADES, USD PER METRIC TON
TABLE 41 EUROPE CARAMEL COLOR MARKET: POWDER PREMIUM OVER LIQUID BY REGION, 2025
TABLE 42 EUROPE CARAMEL COLOR MARKET: PRICE OUTLOOK BY REGION, LIQUID GRADES, USD PER METRIC TON
TABLE 43 EUROPE CARAMEL COLOR MARKET: DERIVED FEEDSTOCK CONSUMPTION, 2026
TABLE 44 EUROPE CARAMEL COLOR MARKET: VERIFIED INDIAN PRODUCERS
TABLE 45 EUROPE CARAMEL COLOR MARKET: PORTER'S FIVE FORCES
TABLE 46 EUROPE CARAMEL COLOR MARKET: FEEDSTOCK POSITION BY EXPORTING COUNTRY
TABLE 47 EUROPE CARAMEL COLOR MARKET: COMPARATIVE POSITION, INDIA AGAINST PEER EXPORTERS
TABLE 48 EUROPE CARAMEL COLOR MARKET: ACCEPTABLE DAILY INTAKE BY CLASS AND AUTHORITY
TABLE 49 EUROPE CARAMEL COLOR MARKET: TARIFF TREATMENT BY JURISDICTION
TABLE 50 EUROPE CARAMEL COLOR MARKET: MANDATORY AGAINST VOLUNTARY
TABLE 51 EUROPE CARAMEL COLOR MARKET: FASTEST GROWING END USES, 2025 TO 2033
TABLE 52 EUROPE CARAMEL COLOR MARKET: THE MARKET IN FIVE YEARS, AGAINST TODAY
TABLE 53 EUROPE CARAMEL COLOR MARKET, BY PRODUCT CLASS, 2018-2025 (USD MILLION)
TABLE 54 EUROPE CARAMEL COLOR MARKET, BY PRODUCT CLASS, 2026-2033 (USD MILLION)
TABLE 55 EUROPE CARAMEL COLOR MARKET, BY PRODUCT CLASS, 2018-2025 (METRIC TONS (MT))
TABLE 56 EUROPE CARAMEL COLOR MARKET, BY PRODUCT CLASS, 2026-2033 (METRIC TONS (MT))
TABLE 57 EUROPE CARAMEL COLOR MARKET, BY PHYSICAL FORM, 2018-2025 (USD MILLION)
TABLE 58 EUROPE CARAMEL COLOR MARKET, BY PHYSICAL FORM, 2026-2033 (USD MILLION)
TABLE 59 EUROPE CARAMEL COLOR MARKET, BY PHYSICAL FORM, 2018-2025 (METRIC TONS (MT))
TABLE 60 EUROPE CARAMEL COLOR MARKET, BY PHYSICAL FORM, 2026-2033 (METRIC TONS (MT))
TABLE 61 EUROPE CARAMEL COLOR MARKET, BY END USE, 2018-2025 (USD MILLION)
TABLE 62 EUROPE CARAMEL COLOR MARKET, BY END USE, 2026-2033 (USD MILLION)
TABLE 63 EUROPE CARAMEL COLOR MARKET, BY END USE, 2018-2025 (METRIC TONS (MT))
TABLE 64 EUROPE CARAMEL COLOR MARKET, BY END USE, 2026-2033 (METRIC TONS (MT))
TABLE 65 EUROPE CARAMEL COLOR MARKET, BY CUSTOMER SEGMENT, 2018-2025 (USD MILLION)
TABLE 66 EUROPE CARAMEL COLOR MARKET, BY CUSTOMER SEGMENT, 2026-2033 (USD MILLION)
TABLE 67 EUROPE CARAMEL COLOR MARKET, BY CUSTOMER SEGMENT, 2018-2025 (METRIC TONS (MT))
TABLE 68 EUROPE CARAMEL COLOR MARKET, BY CUSTOMER SEGMENT, 2026-2033 (METRIC TONS (MT))
TABLE 69 EUROPE, BY COUNTRY, 2018-2025 (USD MILLION)
TABLE 70 EUROPE, BY COUNTRY, 2026-2033 (USD MILLION)
TABLE 71 EUROPE, BY COUNTRY, 2018-2025 (METRIC TONS (MT))
TABLE 72 EUROPE, BY COUNTRY, 2026-2033 (METRIC TONS (MT))
TABLE 73 EUROPE, BY PRODUCT CLASS, 2018-2025 (USD MILLION)
TABLE 74 EUROPE, BY PRODUCT CLASS, 2026-2033 (USD MILLION)
TABLE 75 EUROPE, BY PRODUCT CLASS, 2018-2025 (METRIC TONS (MT))
TABLE 76 EUROPE, BY PRODUCT CLASS, 2026-2033 (METRIC TONS (MT))
TABLE 77 EUROPE, BY PHYSICAL FORM, 2018-2025 (USD MILLION)
TABLE 78 EUROPE, BY PHYSICAL FORM, 2026-2033 (USD MILLION)
TABLE 79 EUROPE, BY PHYSICAL FORM, 2018-2025 (METRIC TONS (MT))
TABLE 80 EUROPE, BY PHYSICAL FORM, 2026-2033 (METRIC TONS (MT))
TABLE 81 EUROPE, BY END USE, 2018-2025 (USD MILLION)
TABLE 82 EUROPE, BY END USE, 2026-2033 (USD MILLION)
TABLE 83 EUROPE, BY END USE, 2018-2025 (METRIC TONS (MT))
TABLE 84 EUROPE, BY END USE, 2026-2033 (METRIC TONS (MT))
TABLE 85 EUROPE, BY CUSTOMER SEGMENT, 2018-2025 (USD MILLION)
TABLE 86 EUROPE, BY CUSTOMER SEGMENT, 2026-2033 (USD MILLION)
TABLE 87 EUROPE, BY CUSTOMER SEGMENT, 2018-2025 (METRIC TONS (MT))
TABLE 88 EUROPE, BY CUSTOMER SEGMENT, 2026-2033 (METRIC TONS (MT))
TABLE 89 GERMANY, BY PRODUCT CLASS, 2018-2025 (USD MILLION)
TABLE 90 GERMANY, BY PRODUCT CLASS, 2026-2033 (USD MILLION)
TABLE 91 GERMANY, BY PRODUCT CLASS, 2018-2025 (METRIC TONS (MT))
TABLE 92 GERMANY, BY PRODUCT CLASS, 2026-2033 (METRIC TONS (MT))
TABLE 93 GERMANY, BY PHYSICAL FORM, 2018-2025 (USD MILLION)
TABLE 94 GERMANY, BY PHYSICAL FORM, 2026-2033 (USD MILLION)
TABLE 95 GERMANY, BY PHYSICAL FORM, 2018-2025 (METRIC TONS (MT))
TABLE 96 GERMANY, BY PHYSICAL FORM, 2026-2033 (METRIC TONS (MT))
TABLE 97 GERMANY, BY END USE, 2018-2025 (USD MILLION)
TABLE 98 GERMANY, BY END USE, 2026-2033 (USD MILLION)
TABLE 99 GERMANY, BY END USE, 2018-2025 (METRIC TONS (MT))
TABLE 100 GERMANY, BY END USE, 2026-2033 (METRIC TONS (MT))
TABLE 101 GERMANY, BY CUSTOMER SEGMENT, 2018-2025 (USD MILLION)
TABLE 102 GERMANY, BY CUSTOMER SEGMENT, 2026-2033 (USD MILLION)
TABLE 103 GERMANY, BY CUSTOMER SEGMENT, 2018-2025 (METRIC TONS (MT))
TABLE 104 GERMANY, BY CUSTOMER SEGMENT, 2026-2033 (METRIC TONS (MT))
TABLE 105 U.K., BY PRODUCT CLASS, 2018-2025 (USD MILLION)
TABLE 106 U.K., BY PRODUCT CLASS, 2026-2033 (USD MILLION)
TABLE 107 U.K., BY PRODUCT CLASS, 2018-2025 (METRIC TONS (MT))
TABLE 108 U.K., BY PRODUCT CLASS, 2026-2033 (METRIC TONS (MT))
TABLE 109 U.K., BY PHYSICAL FORM, 2018-2025 (USD MILLION)
TABLE 110 U.K., BY PHYSICAL FORM, 2026-2033 (USD MILLION)
TABLE 111 U.K., BY PHYSICAL FORM, 2018-2025 (METRIC TONS (MT))
TABLE 112 U.K., BY PHYSICAL FORM, 2026-2033 (METRIC TONS (MT))
TABLE 113 U.K., BY END USE, 2018-2025 (USD MILLION)
TABLE 114 U.K., BY END USE, 2026-2033 (USD MILLION)
TABLE 115 U.K., BY END USE, 2018-2025 (METRIC TONS (MT))
TABLE 116 U.K., BY END USE, 2026-2033 (METRIC TONS (MT))
TABLE 117 U.K., BY CUSTOMER SEGMENT, 2018-2025 (USD MILLION)
TABLE 118 U.K., BY CUSTOMER SEGMENT, 2026-2033 (USD MILLION)
TABLE 119 U.K., BY CUSTOMER SEGMENT, 2018-2025 (METRIC TONS (MT))
TABLE 120 U.K., BY CUSTOMER SEGMENT, 2026-2033 (METRIC TONS (MT))
TABLE 121 FRANCE, BY PRODUCT CLASS, 2018-2025 (USD MILLION)
TABLE 122 FRANCE, BY PRODUCT CLASS, 2026-2033 (USD MILLION)
TABLE 123 FRANCE, BY PRODUCT CLASS, 2018-2025 (METRIC TONS (MT))
TABLE 124 FRANCE, BY PRODUCT CLASS, 2026-2033 (METRIC TONS (MT))
TABLE 125 FRANCE, BY PHYSICAL FORM, 2018-2025 (USD MILLION)
TABLE 126 FRANCE, BY PHYSICAL FORM, 2026-2033 (USD MILLION)
TABLE 127 FRANCE, BY PHYSICAL FORM, 2018-2025 (METRIC TONS (MT))
TABLE 128 FRANCE, BY PHYSICAL FORM, 2026-2033 (METRIC TONS (MT))
TABLE 129 FRANCE, BY END USE, 2018-2025 (USD MILLION)
TABLE 130 FRANCE, BY END USE, 2026-2033 (USD MILLION)
TABLE 131 FRANCE, BY END USE, 2018-2025 (METRIC TONS (MT))
TABLE 132 FRANCE, BY END USE, 2026-2033 (METRIC TONS (MT))
TABLE 133 FRANCE, BY CUSTOMER SEGMENT, 2018-2025 (USD MILLION)
TABLE 134 FRANCE, BY CUSTOMER SEGMENT, 2026-2033 (USD MILLION)
TABLE 135 FRANCE, BY CUSTOMER SEGMENT, 2018-2025 (METRIC TONS (MT))
TABLE 136 FRANCE, BY CUSTOMER SEGMENT, 2026-2033 (METRIC TONS (MT))
TABLE 137 ITALY, BY PRODUCT CLASS, 2018-2025 (USD MILLION)
TABLE 138 ITALY, BY PRODUCT CLASS, 2026-2033 (USD MILLION)
TABLE 139 ITALY, BY PRODUCT CLASS, 2018-2025 (METRIC TONS (MT))
TABLE 140 ITALY, BY PRODUCT CLASS, 2026-2033 (METRIC TONS (MT))
TABLE 141 ITALY, BY PHYSICAL FORM, 2018-2025 (USD MILLION)
TABLE 142 ITALY, BY PHYSICAL FORM, 2026-2033 (USD MILLION)
TABLE 143 ITALY, BY PHYSICAL FORM, 2018-2025 (METRIC TONS (MT))
TABLE 144 ITALY, BY PHYSICAL FORM, 2026-2033 (METRIC TONS (MT))
TABLE 145 ITALY, BY END USE, 2018-2025 (USD MILLION)
TABLE 146 ITALY, BY END USE, 2026-2033 (USD MILLION)
TABLE 147 ITALY, BY END USE, 2018-2025 (METRIC TONS (MT))
TABLE 148 ITALY, BY END USE, 2026-2033 (METRIC TONS (MT))
TABLE 149 ITALY, BY CUSTOMER SEGMENT, 2018-2025 (USD MILLION)
TABLE 150 ITALY, BY CUSTOMER SEGMENT, 2026-2033 (USD MILLION)
TABLE 151 ITALY, BY CUSTOMER SEGMENT, 2018-2025 (METRIC TONS (MT))
TABLE 152 ITALY, BY CUSTOMER SEGMENT, 2026-2033 (METRIC TONS (MT))
TABLE 153 SPAIN, BY PRODUCT CLASS, 2018-2025 (USD MILLION)
TABLE 154 SPAIN, BY PRODUCT CLASS, 2026-2033 (USD MILLION)
TABLE 155 SPAIN, BY PRODUCT CLASS, 2018-2025 (METRIC TONS (MT))
TABLE 156 SPAIN, BY PRODUCT CLASS, 2026-2033 (METRIC TONS (MT))
TABLE 157 SPAIN, BY PHYSICAL FORM, 2018-2025 (USD MILLION)
TABLE 158 SPAIN, BY PHYSICAL FORM, 2026-2033 (USD MILLION)
TABLE 159 SPAIN, BY PHYSICAL FORM, 2018-2025 (METRIC TONS (MT))
TABLE 160 SPAIN, BY PHYSICAL FORM, 2026-2033 (METRIC TONS (MT))
TABLE 161 SPAIN, BY END USE, 2018-2025 (USD MILLION)
TABLE 162 SPAIN, BY END USE, 2026-2033 (USD MILLION)
TABLE 163 SPAIN, BY END USE, 2018-2025 (METRIC TONS (MT))
TABLE 164 SPAIN, BY END USE, 2026-2033 (METRIC TONS (MT))
TABLE 165 SPAIN, BY CUSTOMER SEGMENT, 2018-2025 (USD MILLION)
TABLE 166 SPAIN, BY CUSTOMER SEGMENT, 2026-2033 (USD MILLION)
TABLE 167 SPAIN, BY CUSTOMER SEGMENT, 2018-2025 (METRIC TONS (MT))
TABLE 168 SPAIN, BY CUSTOMER SEGMENT, 2026-2033 (METRIC TONS (MT))
TABLE 169 REST OF EUROPE, BY PRODUCT CLASS, 2018-2025 (USD MILLION)
TABLE 170 REST OF EUROPE, BY PRODUCT CLASS, 2026-2033 (USD MILLION)
TABLE 171 REST OF EUROPE, BY PRODUCT CLASS, 2018-2025 (METRIC TONS (MT))
TABLE 172 REST OF EUROPE, BY PRODUCT CLASS, 2026-2033 (METRIC TONS (MT))
TABLE 173 REST OF EUROPE, BY PHYSICAL FORM, 2018-2025 (USD MILLION)
TABLE 174 REST OF EUROPE, BY PHYSICAL FORM, 2026-2033 (USD MILLION)
TABLE 175 REST OF EUROPE, BY PHYSICAL FORM, 2018-2025 (METRIC TONS (MT))
TABLE 176 REST OF EUROPE, BY PHYSICAL FORM, 2026-2033 (METRIC TONS (MT))
TABLE 177 REST OF EUROPE, BY END USE, 2018-2025 (USD MILLION)
TABLE 178 REST OF EUROPE, BY END USE, 2026-2033 (USD MILLION)
TABLE 179 REST OF EUROPE, BY END USE, 2018-2025 (METRIC TONS (MT))
TABLE 180 REST OF EUROPE, BY END USE, 2026-2033 (METRIC TONS (MT))
TABLE 181 REST OF EUROPE, BY CUSTOMER SEGMENT, 2018-2025 (USD MILLION)
TABLE 182 REST OF EUROPE, BY CUSTOMER SEGMENT, 2026-2033 (USD MILLION)
TABLE 183 REST OF EUROPE, BY CUSTOMER SEGMENT, 2018-2025 (METRIC TONS (MT))
TABLE 184 REST OF EUROPE, BY CUSTOMER SEGMENT, 2026-2033 (METRIC TONS (MT))
TABLE 185 EUROPE CARAMEL COLOR MARKET: PROFILED PRODUCERS, OWNERSHIP AND ESTIMATED SHARE
TABLE 186 EUROPE CARAMEL COLOR MARKET: CLASS AND FORM COVERAGE BY PRODUCER
TABLE 187 EUROPE CARAMEL COLOR MARKET: MANUFACTURING COUNTRIES AND THE PRODUCERS PLACED IN THEM
TABLE 188 EUROPE CARAMEL COLOR MARKET: OWNERSHIP AND COMMERCIAL DEVELOPMENTS
TABLE 189 SETHNESS ROQUETTE: COMPANY SNAPSHOT
TABLE 190 SETHNESS ROQUETTE: PRODUCT PORTFOLIO
TABLE 191 SETHNESS ROQUETTE: RECENT DEVELOPMENTS
TABLE 192 GIVAUDAN SENSE COLOUR: COMPANY SNAPSHOT
TABLE 193 GIVAUDAN SENSE COLOUR: PRODUCT PORTFOLIO
TABLE 194 GIVAUDAN SENSE COLOUR: RECENT DEVELOPMENTS
TABLE 195 NIGAY: COMPANY SNAPSHOT
TABLE 196 NIGAY: PRODUCT PORTFOLIO
TABLE 197 NIGAY: RECENT DEVELOPMENTS
TABLE 198 OTERRA: COMPANY SNAPSHOT
TABLE 199 OTERRA: PRODUCT PORTFOLIO
TABLE 200 OTERRA: RECENT DEVELOPMENTS
TABLE 201 INGREDION: COMPANY SNAPSHOT
TABLE 202 INGREDION: PRODUCT PORTFOLIO
TABLE 203 AARKAY FOOD PRODUCTS LTD: COMPANY SNAPSHOT
TABLE 204 AARKAY FOOD PRODUCTS LTD: PRODUCT PORTFOLIO
TABLE 205 ALVIN CARAMEL COLOURS (INDIA) PVT LTD: COMPANY SNAPSHOT
TABLE 206 ALVIN CARAMEL COLOURS (INDIA) PVT LTD: PRODUCT PORTFOLIO
TABLE 207 MASCOT FOOD COLOURS: COMPANY SNAPSHOT
TABLE 208 MASCOT FOOD COLOURS: PRODUCT PORTFOLIO
TABLE 209 VINAYAK INGREDIENTS (INDIA) PVT LTD: COMPANY SNAPSHOT
TABLE 210 VINAYAK INGREDIENTS (INDIA) PVT LTD: PRODUCT PORTFOLIO
TABLE 211 SAYAJI INDUSTRIES: COMPANY SNAPSHOT
TABLE 212 SAYAJI INDUSTRIES: PRODUCT PORTFOLIO
TABLE 213 SAYAJI INDUSTRIES: RECENT DEVELOPMENTS
TABLE 214 QIANHE FOOD: COMPANY SNAPSHOT
TABLE 215 QIANHE FOOD: PRODUCT PORTFOLIO
TABLE 216 QIANHE FOOD: RECENT DEVELOPMENTS
TABLE 217 KANGLONG: COMPANY SNAPSHOT
TABLE 218 KANGLONG: PRODUCT PORTFOLIO
TABLE 219 EUROPE CARAMEL COLOR MARKET: SUPPORTING DATABASES
TABLE 220 EUROPE CARAMEL COLOR MARKET: GEOGRAPHIC RECONCILIATION, 2025
TABLE 221 EUROPE CARAMEL COLOR MARKET: SEGMENT RECONCILIATION AGAINST THE WORLD TOTAL, 2025
List of Figure
FIGURE 1 EUROPE CARAMEL COLOR MARKET, 2018-2033 (USD MILLION)
FIGURE 2 EUROPE CARAMEL COLOR MARKET: PESTLE ANALYSIS
FIGURE 3 EUROPE CARAMEL COLOR MARKET, BY PRODUCT CLASS: KEY FINDINGS
FIGURE 4 EUROPE CARAMEL COLOR MARKET, BY PRODUCT CLASS, 2025
FIGURE 5 EUROPE CARAMEL COLOR MARKET, BY PRODUCT CLASS, 2033 (USD MILLION)
FIGURE 6 EUROPE CARAMEL COLOR MARKET, BY PHYSICAL FORM: KEY FINDINGS
FIGURE 7 EUROPE CARAMEL COLOR MARKET, BY PHYSICAL FORM, 2025
FIGURE 8 EUROPE CARAMEL COLOR MARKET, BY END USE: KEY FINDINGS
FIGURE 9 EUROPE CARAMEL COLOR MARKET, BY END USE, 2025
FIGURE 10 EUROPE CARAMEL COLOR MARKET, BY CUSTOMER SEGMENT: KEY FINDINGS
FIGURE 11 EUROPE CARAMEL COLOR MARKET, BY CUSTOMER SEGMENT, 2025
FIGURE 12 EUROPE CARAMEL COLOR MARKET, BY REGION: KEY FINDINGS
FIGURE 13 EUROPE, BY COUNTRY, 2025
FIGURE 14 SETHNESS ROQUETTE, SHARE OF THE EUROPE EUROPE MARKET, 2025
FIGURE 15 GIVAUDAN SENSE COLOUR, SHARE OF THE EUROPE EUROPE MARKET, 2025
FIGURE 16 NIGAY, SHARE OF THE EUROPE EUROPE MARKET, 2025
FIGURE 17 OTERRA, SHARE OF THE EUROPE EUROPE MARKET, 2025
FIGURE 18 AARKAY FOOD PRODUCTS LTD, SHARE OF THE EUROPE EUROPE MARKET, 2025
FIGURE 19 ALVIN CARAMEL COLOURS (INDIA) PVT LTD, SHARE OF THE EUROPE EUROPE MARKET, 2025
FIGURE 20 MASCOT FOOD COLOURS, SHARE OF THE EUROPE EUROPE MARKET, 2025
FIGURE 21 VINAYAK INGREDIENTS (INDIA) PVT LTD, SHARE OF THE EUROPE EUROPE MARKET, 2025
FIGURE 22 QIANHE FOOD, SHARE OF THE EUROPE EUROPE MARKET, 2025
FIGURE 23 KANGLONG, SHARE OF THE EUROPE EUROPE MARKET, 2025

Europe Caramel Color Market, Supply Chain Analysis and Ecosystem Framework
To support market growth and help clients navigate the impact of geopolitical shifts, DBMR has integrated in-depth supply chain analysis into its Europe Caramel Color Market research reports. This addition empowers clients to respond effectively to global changes affecting their industries. The supply chain analysis section includes detailed insights such as Europe Caramel Color Market consumption and production by country, price trend analysis, the impact of tariffs and geopolitical developments, and import and export trends by country and HSN code. It also highlights major suppliers with data on production capacity and company profiles, as well as key importers and exporters. In addition to research, DBMR offers specialized supply chain consulting services backed by over a decade of experience, providing solutions like supplier discovery, supplier risk assessment, price trend analysis, impact evaluation of inflation and trade route changes, and comprehensive market trend analysis.
Data collection and base year analysis are done using data collection modules with large sample sizes. The stage includes obtaining market information or related data through various sources and strategies. It includes examining and planning all the data acquired from the past in advance. It likewise envelops the examination of information inconsistencies seen across different information sources. The market data is analysed and estimated using market statistical and coherent models. Also, market share analysis and key trend analysis are the major success factors in the market report. To know more, please request an analyst call or drop down your inquiry.
The key research methodology used by DBMR research team is data triangulation which involves data mining, analysis of the impact of data variables on the market and primary (industry expert) validation. Data models include Vendor Positioning Grid, Market Time Line Analysis, Market Overview and Guide, Company Positioning Grid, Patent Analysis, Pricing Analysis, Company Market Share Analysis, Standards of Measurement, Global versus Regional and Vendor Share Analysis. To know more about the research methodology, drop in an inquiry to speak to our industry experts.
Data Bridge Market Research is a leader in advanced formative research. We take pride in servicing our existing and new customers with data and analysis that match and suits their goal. The report can be customized to include price trend analysis of target brands understanding the market for additional countries (ask for the list of countries), clinical trial results data, literature review, refurbished market and product base analysis. Market analysis of target competitors can be analyzed from technology-based analysis to market portfolio strategies. We can add as many competitors that you require data about in the format and data style you are looking for. Our team of analysts can also provide you data in crude raw excel files pivot tables (Fact book) or can assist you in creating presentations from the data sets available in the report.