
Europe Cleanroom Particle Counters Market
Market Size in USD Million
 USD
34.98 Million
USD
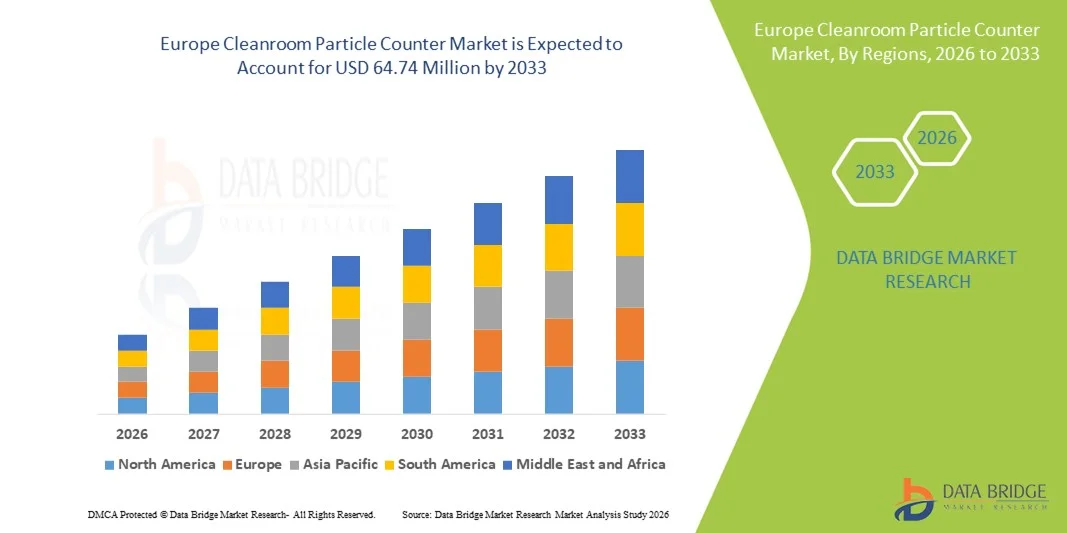
64.74 Million
2025
2033
USD
34.98 Million
USD
64.74 Million
2025
2033
| 2026 - 2033 | |
| USD 34.98 Million | |
| USD 64.74 Million | |
| % | |
|
Europe Cleanroom Particle Counter Market Size
- The Europe cleanroom particle counter market size was valued at USD 34.98 million in 2025 and is expected to reach USD 64.74 million by 2033, at a CAGR of 8.00% during the forecast period
- The market growth is largely driven by the expanding pharmaceutical and biotechnology manufacturing base across Europe, along with stringent regulatory standards for contamination control in cleanroom environments
- Furthermore, increasing investments in semiconductor fabrication, medical device production, and advanced healthcare infrastructure are strengthening demand for high-precision airborne particle monitoring systems. These converging factors are accelerating the adoption of cleanroom particle counters, thereby significantly boosting the region’s market growth
Europe Cleanroom Particle Counter Market Analysis
- Cleanroom particle counters, designed to detect and measure airborne particles in controlled environments, are increasingly critical components in pharmaceutical, biotechnology, semiconductor, and medical device manufacturing facilities across Europe due to their role in ensuring regulatory compliance, product quality, and contamination control
- The escalating demand for cleanroom particle counters is primarily fueled by stringent EU GMP and ISO cleanroom standards, expanding biologics and vaccine production, and the growing emphasis on real-time environmental monitoring within advanced manufacturing environments
- Germany dominated the Europe cleanroom particle counter market with the largest revenue share of 29.84% in 2025, characterized by its strong pharmaceutical manufacturing base, advanced industrial infrastructure, and significant investments in Industry 4.0 technologies
- The United Kingdom is expected to be the fastest growing country in the Europe cleanroom particle counter market during the forecast period due to rising biopharmaceutical R&D activities and increasing upgrades of cleanroom facilities in healthcare and life sciences sectors
- Portable particle counter segment dominated the Europe cleanroom particle counter market with a market share of 38.6% in 2025, driven by its flexibility, ease of deployment across multiple cleanroom zones, and suitability for routine validation and spot monitoring applications
Report Scope and Europe Cleanroom Particle Counter Market Segmentation
|
Attributes |
Europe Cleanroom Particle Counter Key Market Insights |
|
Segments Covered |
|
|
Countries Covered |
Europe
|
|
Key Market Players |
|
|
Market Opportunities |
|
|
Value Added Data Infosets |
In addition to the insights on market scenarios such as market value, growth rate, segmentation, geographical coverage, and major players, the market reports curated by the Data Bridge Market Research also include in-depth expert analysis, patient epidemiology, pipeline analysis, pricing analysis, and regulatory framework |
Europe Cleanroom Particle Counter Market Trends
Real-Time Monitoring and Digital Integration Across Controlled Environments
- A significant and accelerating trend in the Europe cleanroom particle counter market is the deepening integration with real-time monitoring software, cloud-based data management systems, and Industry 4.0 frameworks. This convergence of technologies is significantly enhancing contamination control efficiency and regulatory transparency across pharmaceutical and semiconductor facilities
- For instance, several European manufacturers have introduced particle counters with Ethernet connectivity and centralized monitoring platforms, enabling facility managers to access live airborne particle data across multiple cleanroom zones through unified dashboards and automated reporting systems
- Advanced integration enables features such as continuous environmental monitoring, automated deviation alerts, and predictive maintenance capabilities. For instance, certain models incorporate intelligent data analytics to identify abnormal particle spikes and trigger corrective workflows, while also maintaining secure audit trails aligned with EU GMP Annex 1 requirements
- The seamless integration of particle counters with building management systems and broader environmental monitoring platforms facilitates centralized control over temperature, humidity, and airborne contamination parameters. Through a single interface, operators can oversee multiple compliance-critical variables, creating a unified and highly controlled production environment
- This trend towards more automated, compliant, and interconnected monitoring systems is fundamentally reshaping operational standards in European cleanrooms. Consequently, companies such as Beckman Coulter Life Sciences are developing advanced particle counters with remote data access, 21 CFR Part 11 compliant software compatibility, and scalable network integration capabilities
- The demand for cleanroom particle counters that offer seamless digital integration and real-time analytics is growing rapidly across pharmaceutical, biotechnology, and semiconductor sectors, as manufacturers increasingly prioritize data integrity, operational efficiency, and strict regulatory adherence
Europe Cleanroom Particle Counter Market Dynamics
Driver
Stringent Regulatory Standards and Expanding Pharmaceutical Manufacturing
- The increasing enforcement of EU GMP Annex 1 guidelines and ISO cleanroom standards, coupled with the expansion of pharmaceutical and biologics manufacturing facilities, is a significant driver for the heightened demand for cleanroom particle counters
- For instance, in 2023, several European pharmaceutical manufacturers upgraded their environmental monitoring systems to align with revised Annex 1 contamination control strategies, accelerating investments in continuous airborne particle monitoring technologies
- As manufacturers intensify their focus on sterility assurance and contamination prevention, particle counters provide critical capabilities such as real-time data logging, alarm notifications, and validation support, offering a substantial upgrade over manual sampling methods
- Furthermore, the growing production of advanced therapies, vaccines, and semiconductor components is making high-precision particle monitoring an integral component of cleanroom operations, ensuring consistent product quality and regulatory compliance
- The rising number of cleanroom expansions and retrofitting projects across Europe, particularly in Germany, France, and the U.K., is further accelerating the deployment of advanced airborne particle monitoring systems
- Increasing investments in semiconductor fabrication plants and microelectronics manufacturing within Europe are creating additional demand for ultra-sensitive particle counters capable of detecting sub-micron contamination levels
- The need for continuous environmental validation, audit-ready digital records, and integration with facility-wide monitoring platforms are key factors propelling the adoption of cleanroom particle counters across pharmaceutical, biotechnology, and electronics sectors.
- The transition toward automated manufacturing environments further contributes to market growth
Restraint/Challenge
High Capital Investment and Complex Compliance Requirements
- Concerns surrounding the high initial investment costs of advanced cleanroom particle counters and the complexity of regulatory validation requirements pose a significant challenge to broader market adoption. As these systems require calibration, validation, and periodic maintenance, operational expenditures can be substantial for small and mid-sized facilities
- For instance, smaller medical device manufacturers may delay upgrading to fully automated continuous monitoring systems due to the financial burden associated with equipment acquisition, software validation, and staff training
- Addressing these cost and compliance challenges through scalable system configurations, modular deployment models, and simplified validation documentation is crucial for improving accessibility. Companies such as Lighthouse Worldwide Solutions and TSI emphasize flexible system architectures and compliance-ready software to support smoother implementation. Additionally, the technical expertise required for system integration and data management can present operational hurdles for facilities transitioning from manual monitoring processes
- While digital monitoring enhances accuracy and traceability, the perceived complexity of system validation and ongoing maintenance requirements can still slow procurement decisions, particularly among cost-sensitive or resource-constrained organization
- The requirement for periodic calibration and validation in accordance with ISO 21501 standards can increase downtime and maintenance complexity, posing operational challenges for facilities with continuous production cycles
- Data security concerns related to cloud-connected monitoring systems may also restrain adoption, as manufacturers must ensure compliance with stringent European data protection regulations such as GDPR while maintaining system accessibility and integrity
- Overcoming these challenges through cost-effective product innovation, enhanced technical support services, and streamlined compliance frameworks will be vital for sustaining long-term market growth across Europe
Europe Cleanroom Particle Counter Market Scope
The market is segmented on the basis of type, particle size, flow rate capacity, facility type, end user, and distribution channel.
- By Type
On the basis of type, the Europe cleanroom particle counter market is segmented into portable particle counter, handheld particle counter, and remote particle counter. The portable particle counter segment dominated the market with the largest revenue share of 38.6% in 2025, driven by its flexibility in performing routine cleanroom certification, validation, and troubleshooting across multiple zones. These systems are widely adopted in pharmaceutical and biotechnology facilities due to their mobility, high sensitivity, and compliance with EU GMP Annex 1 requirements. Portable models offer advanced data logging, real-time monitoring, and compatibility with environmental monitoring software, making them suitable for both periodic and continuous assessments. Their ability to measure multiple particle size channels and integrate with validation protocols further strengthens their demand. Additionally, ease of transport between cleanroom classifications enhances operational efficiency.
The remote particle counter segment is anticipated to witness the fastest growth rate from 2026 to 2033, fueled by increasing adoption of continuous environmental monitoring systems in pharmaceutical and semiconductor manufacturing. Remote systems are permanently installed and connected to centralized monitoring platforms, enabling uninterrupted airborne particle surveillance. The growing emphasis on contamination control strategies and automated alert mechanisms is accelerating demand for these networked solutions. Integration with building management systems and cloud-based dashboards enhances data integrity and audit readiness. As European facilities modernize toward Industry 4.0 environments, remote particle counters are becoming essential for real-time compliance and predictive risk management.
- By Particle Size
On the basis of particle size, the market is segmented into 0.1 µm–0.2 µm, 0.2 µm–0.3 µm, 0.3 µm–0.5 µm, 0.5 µm–5 µm, and more than 5 µm. The 0.3 µm–0.5 µm segment dominated the market in 2025 due to its alignment with ISO cleanroom classification standards and EU GMP requirements. Monitoring at 0.5 µm is critical for pharmaceutical sterile manufacturing and medical device production. These particle sizes are widely used for regulatory validation and routine monitoring. The segment benefits from established compliance benchmarks and standardized testing protocols. Its importance in assessing air cleanliness levels across Grade A–D cleanrooms supports sustained demand.
The 0.1 µm–0.2 µm segment is projected to be the fastest growing during the forecast period, driven by advancements in semiconductor fabrication and microelectronics manufacturing in Europe. Ultra-fine particle detection is crucial in high-tech industries where even sub-micron contamination can compromise product yield. Increasing investments in chip manufacturing facilities are accelerating the adoption of high-sensitivity particle counters. These systems support advanced filtration validation and nanotechnology research. The rising complexity of manufacturing processes is further boosting demand in this segment.
- By Flow Rate Capacity
On the basis of flow rate capacity, the market is segmented into low flow, standard flow, and high flow. The standard flow segment dominated the market in 2025, owing to its balanced performance for routine cleanroom certification and monitoring activities. Standard flow counters provide reliable detection across multiple particle channels while maintaining manageable instrument size. They are widely used in pharmaceutical manufacturing and hospital cleanrooms. Their compatibility with ISO validation procedures enhances their adoption. Additionally, they offer cost-effective solutions for medium-scale facilities.
The high flow segment is expected to witness the fastest growth from 2026 to 2033, driven by the need for rapid sampling in large cleanroom environments and critical manufacturing zones. High flow particle counters reduce sampling time while maintaining accuracy. This is particularly valuable in semiconductor fabs and large biologics production plants. Faster monitoring supports quicker compliance verification and reduced operational downtime. As facilities scale up production capacities, demand for high-throughput monitoring systems is increasing.
- By Facility Type
On the basis of facility type, the market is segmented into small and large facilities. The large facility segment dominated the market in 2025 due to extensive cleanroom infrastructure in pharmaceutical manufacturing plants and semiconductor fabrication units. Large facilities require multiple monitoring points and continuous compliance validation. The complexity of operations necessitates advanced particle counting systems with network integration. Higher capital budgets also enable investment in sophisticated monitoring technologies. These factors collectively strengthen the dominance of this segment.
The small facility segment is projected to grow at the fastest rate during the forecast period, supported by the expansion of small-scale biotech startups and specialty medical device manufacturers across Europe. Increasing regulatory enforcement is encouraging smaller facilities to upgrade their environmental monitoring capabilities. Cost-effective and portable particle counters are improving accessibility for this segment. Growing contract manufacturing activities are also contributing to demand growth.
- By End User
On the basis of end user, the market is segmented into pharmaceutical and biotechnology industry, semiconductor and electronics industry, chemical industry, and others. The pharmaceutical and biotechnology industry segment dominated the market in 2025, driven by stringent contamination control requirements and expanding biologics production. Compliance with EU GMP Annex 1 mandates continuous environmental monitoring. Particle counters are essential for sterility assurance and validation processes. Increasing vaccine and advanced therapy manufacturing further supports segment growth.
The semiconductor and electronics industry segment is anticipated to register the fastest growth rate from 2026 to 2033, fueled by rising investments in European chip manufacturing and microelectronics facilities. Semiconductor fabrication demands ultra-clean environments with sub-micron monitoring. High-precision particle counters are critical for yield optimization and defect reduction. The push for technological self-sufficiency in Europe is accelerating infrastructure development in this sector.
- By Distribution Channel
On the basis of distribution channel, the market is segmented into direct tenders and third party distributors. The direct tenders segment dominated the market in 2025, as large pharmaceutical and semiconductor companies prefer direct procurement from manufacturers for customized solutions and long-term service contracts. Direct engagement ensures better technical support and regulatory compliance alignment. It also enables tailored system integration and validation assistance. Strong manufacturer-client relationships enhance repeat procurement cycles.
The third party distributors segment is expected to witness the fastest growth during the forecast period, supported by increasing penetration into the small and mid-sized facilities across Europe. The distributors provide localized technical support and faster delivery timelines. They also help manufacturers to expand regional presence without establishing the direct subsidiaries. The growing demand from emerging biotech hubs is further strengthening this channel’s expansion. Expanding regional distribution networks are further enhancing market accessibility
Europe Cleanroom Particle Counter Market Regional Analysis
- Germany dominated the Europe cleanroom particle counter market with the largest revenue share of 29.84% in 2025, characterized by its strong pharmaceutical manufacturing base, advanced industrial infrastructure, and significant investments in Industry 4.0 technologies
- Manufacturers in the region place high importance on strict compliance with EU GMP Annex 1 and ISO cleanroom standards, as well as the adoption of advanced environmental monitoring systems to ensure contamination control and product quality assurance
- This widespread adoption is further supported by robust industrial infrastructure, growing research and development activities, and the increasing transition toward automated and digitally integrated cleanroom environments, establishing particle counters as an essential solution across pharmaceutical, biotechnology, and electronics industries
The Germany Cleanroom Particle Counter Market Insight
Germany cleanroom particle counter market captured the largest revenue share within Europe in 2025, fueled by the country’s strong pharmaceutical manufacturing base and expanding semiconductor fabrication investments. Manufacturers are increasingly prioritizing advanced contamination control systems to comply with EU GMP Annex 1 and ISO cleanroom standards. The presence of well-established life sciences companies and contract manufacturing organizations further propels demand for high-precision airborne particle monitoring systems. Moreover, Germany’s emphasis on Industry 4.0 and automated production environments is significantly contributing to the integration of remote and real-time particle counting solutions across pharmaceutical and electronics facilities.
France Cleanroom Particle Counter Market Insight
The France cleanroom particle counter market is projected to expand at a substantial CAGR throughout the forecast period, primarily driven by growth in biopharmaceutical production and increasing investments in vaccine manufacturing infrastructure. The country’s focus on strengthening domestic drug manufacturing capabilities is fostering the adoption of advanced environmental monitoring systems. French manufacturers are increasingly incorporating continuous particle monitoring technologies in both new and upgraded cleanroom facilities. Additionally, rising research activities in biotechnology and medical devices are supporting steady market expansion.
U.K. Cleanroom Particle Counter Market Insight
The U.K. cleanroom particle counter market is anticipated to grow at a noteworthy CAGR during the forecast period, driven by rising biopharmaceutical R&D activities and modernization of healthcare manufacturing facilities. The implementation of stringent contamination control strategies in alignment with revised Annex 1 guidelines is encouraging facility upgrades. Increasing demand for automated environmental monitoring and digital data integrity solutions is further strengthening adoption. The U.K.’s strong research ecosystem and contract manufacturing landscape continue to stimulate market growth.
Italy Cleanroom Particle Counter Market Insight
The Italy cleanroom particle counter market is expected to expand at a considerable CAGR during the forecast period, fueled by growing pharmaceutical exports and expanding sterile manufacturing capabilities. Italy’s established medical device production sector is promoting the deployment of portable and remote particle monitoring systems. Increasing regulatory inspections and compliance requirements are driving facilities to adopt advanced validation technologies. The integration of particle counters with centralized environmental monitoring platforms is becoming increasingly prevalent across industrial cleanrooms.
Europe Cleanroom Particle Counter Market Share
The Europe Cleanroom Particle Counter industry is primarily led by well-established companies, including:
- Particle Measuring Systems, Inc. (U.S.)
- Beckman Coulter, Inc. (U.S.)
- TSI Incorporated (U.S.)
- RION Co., Ltd. (Japan)
- Setra Systems (U.S.)
- IQAir AG (Switzerland)
- Lighthouse Worldwide Solutions, Inc. (U.S.)
- Kanomax USA, Inc. (U.S.)
- Climet Instruments Company (U.S.)
- Met One Instruments, Inc. (U.S.)
- Particles Plus, Inc. (U.S.)
- Suzhou Sujing Automation Instrument Equipment Co., Ltd. (China)
- Honri Airclean Technology Co., Ltd. (China)
- Zhejiang FUXIA Medical Technology Co., Ltd. (China)
- PCE Deutschland GmbH (Germany)
- GRIMM Aerosol Technik Ainring GmbH & Co. KG (Germany)
- TOPAS GmbH (Germany)
- HIYI (China)
- Veltek Associates, Inc. (U.S.)
What are the Recent Developments in Europe Cleanroom Particle Counter Market?
- In June 2025, nanoDUST expanded its product portfolio with the launch of the C30 Cleanroom Particle Counter, designed specifically for cleanroom certification and airborne contamination monitoring. The C30 includes ISO-17025 traceable calibration and supports standards such as EU GMP Annex 1 and ISO-14644, offering versatile detection with Ethernet, RS-485, and Wi-Fi connectivity for enhanced real-time quality control in pharmaceutical and high-tech manufacturing
- In February 2025, calibration services specialist Trescal officially acquired Facility Monitoring Systems (FMS), a UK-based provider of contamination control and environmental monitoring technologies, including cleanroom particle counter solutions. The acquisition expands service capabilities and contamination control offerings across the UK and Ireland, strengthening FMS’s position in regulated sectors such as pharmaceuticals and biotechnology
- In September 2024, Cleanzone 2024, Europe’s major cleanroom technology expo held in Frankfurt am Main, brought together international suppliers and experts showcasing the latest innovations in contamination control, hygiene, and cleanroom equipment including airborne particle monitoring systems. The event reinforced trends in digitalization, energy efficiency, and advanced cleanroom solutions, signaling sustained innovation momentum in particle counter and environmental monitoring technologies
- In August 2023, a product video showcasing the IsoAir Pro-Plus Remote Particle Counter emphasized its user-friendly design and flexible monitoring capabilities for continuous cleanroom environments, underscoring industry recognition of next-generation remote particle monitoring tools in Europe’s contamination-sensitive sectors
- In May 2021, Particle Measuring Systems introduced the IsoAir Pro-Plus Remote Particle Counter, aimed at high-tech cleanrooms and pharmaceutical manufacturing environments. This advanced particle counter offers remote monitoring with real-time data collection, enhancing contamination control and compliance with stringent cleanliness standards critical in semiconductor and biopharma facilities
SKU-

- Interactive Data Analysis Dashboard
- Company Analysis Dashboard for high growth potential opportunities
- Research Analyst Access for customization & queries
- Competitor Analysis with Interactive dashboard
- Latest News, Updates & Trend analysis
- Harness the Power of Benchmark Analysis for Comprehensive Competitor Tracking
Data collection and base year analysis are done using data collection modules with large sample sizes. The stage includes obtaining market information or related data through various sources and strategies. It includes examining and planning all the data acquired from the past in advance. It likewise envelops the examination of information inconsistencies seen across different information sources. The market data is analysed and estimated using market statistical and coherent models. Also, market share analysis and key trend analysis are the major success factors in the market report. To know more, please request an analyst call or drop down your inquiry.
The key research methodology used by DBMR research team is data triangulation which involves data mining, analysis of the impact of data variables on the market and primary (industry expert) validation. Data models include Vendor Positioning Grid, Market Time Line Analysis, Market Overview and Guide, Company Positioning Grid, Patent Analysis, Pricing Analysis, Company Market Share Analysis, Standards of Measurement, Global versus Regional and Vendor Share Analysis. To know more about the research methodology, drop in an inquiry to speak to our industry experts.
Data Bridge Market Research is a leader in advanced formative research. We take pride in servicing our existing and new customers with data and analysis that match and suits their goal. The report can be customized to include price trend analysis of target brands understanding the market for additional countries (ask for the list of countries), clinical trial results data, literature review, refurbished market and product base analysis. Market analysis of target competitors can be analyzed from technology-based analysis to market portfolio strategies. We can add as many competitors that you require data about in the format and data style you are looking for. Our team of analysts can also provide you data in crude raw excel files pivot tables (Fact book) or can assist you in creating presentations from the data sets available in the report.


