
Europe Cleanroom Technology Market
Market Size in USD Billion
 USD
1.30 Billion
USD
2.24 Billion
2024
2032
USD
1.30 Billion
USD
2.24 Billion
2024
2032
| 2025 - 2032 | |
| USD 1.30 Billion | |
| USD 2.24 Billion | |
| % | |
|
Cleanroom Technology Market Size
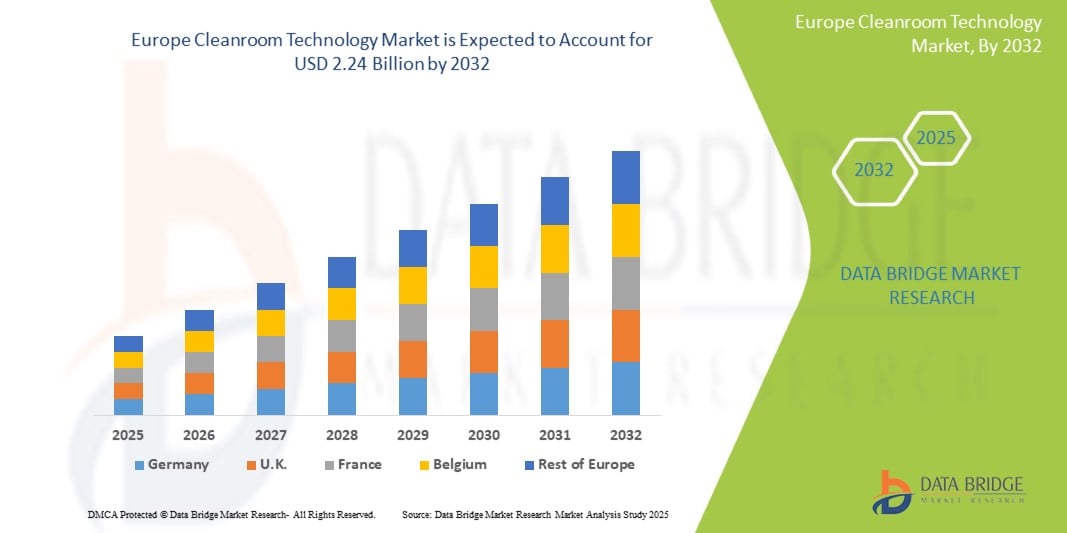
- The Europe cleanroom technology market was valued at USD 1.30 billion in 2024 and is expected to reach USD 2.24 billion by 2032
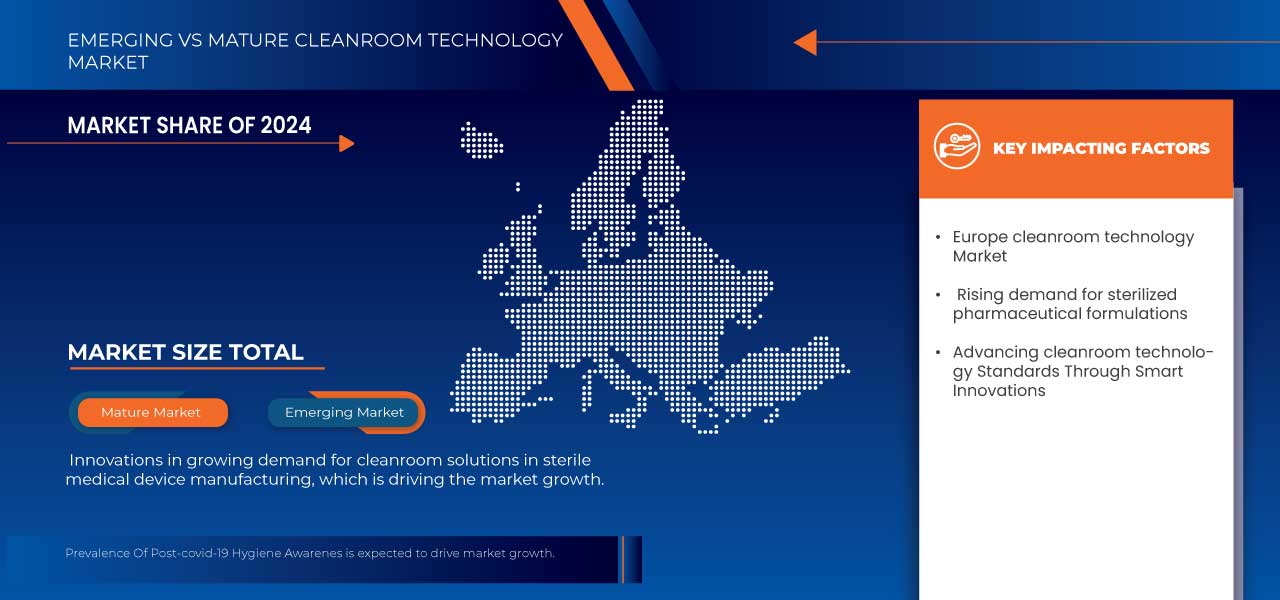
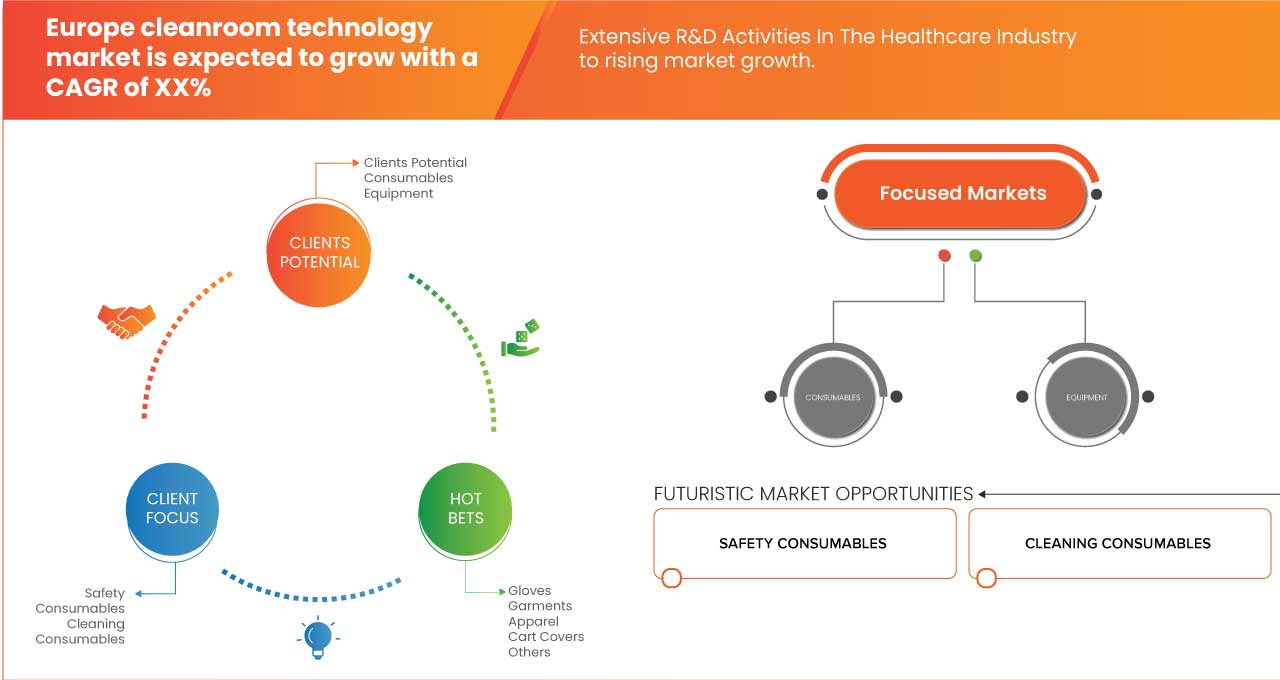
- During the forecast period of 2025 to 2032 the market is likely to grow at a CAGR of 7.1%, primarily driven by the rising demand for sterilized pharmaceutical formulations
- The advancing cleanroom technology standards through smart innovations and the growth of the pharmaceutical sector in Europe driving cleanroom technology demand are driving demand for cleanroom technology. Additionally, growing demand for cleanroom solutions in sterile medical device manufacturing is further propelling market growth.
Cleanroom Technology Market Analysis
- Cleanroom technology involves controlled environments with minimal air pollutants, particulates, and microbial contamination, essential for sectors like pharmaceuticals and semiconductor manufacturing. These facilities maintain strict cleanliness standards through air filtration, specialized materials, and rigorous protocols to ensure product integrity and safety.
- Germany emerges as a leading region in the cleanroom technology market, driven by its robust manufacturing sector and stringent regulatory standards in industries such as pharmaceuticals and biotechnology.
- For instance, Germany's strong emphasis on research and development, coupled with advancements in automation and digitalization, further bolsters its position in the cleanroom technology market.
Report Scope and Cleanroom technology market Segmentation
|
Attributes |
Cleanroom technology Key Market Insights |
|
Segments Covered |
|
|
Countries Covered |
Europe
|
|
Key Market Players |
|
|
Market Opportunities |
|
|
Value Added Data Infosets |
In addition to the insights on market scenarios such as market value, growth rate, segmentation, geographical coverage, and major players, the market reports curated by the Data Bridge Market Research also include import export analysis, production capacity overview, production consumption analysis, price trend analysis, climate change scenario, supply chain analysis, value chain analysis, raw material/consumables overview, vendor selection criteria, PESTLE Analysis, Porter Analysis, and regulatory framework. |
Europe Cleanroom Technology Market Trends
“Increased Automation and Digitalization in Cleanroom Technology”
- Automation technologies, such as robotics and intelligent control systems, are being integrated into cleanroom operations to streamline processes, reduce human error, and improve operational efficiency.
- The use of IoT devices and advanced sensors enables real-time monitoring of environmental conditions, such as temperature, humidity, and particulate levels, ensuring optimal cleanroom performance and compliance with industry standards.
- For instance, With the integration of big data analytics into cleanroom operations, companies can leverage predictive analytics and machine learning to optimize workflows, enhance maintenance schedules, and reduce downtime.
- Automated cleanroom solutions offer greater scalability, allowing manufacturers to easily adjust to changing production demands while maintaining consistent quality and regulatory compliance.
- By minimizing human involvement and maximizing operational efficiency, automation in cleanroom technology helps reduce labor costs, energy consumption, and material waste, ultimately leading to cost savings for companies.
Europe Cleanroom Technology Market Dynamics
Driver
“Rising Demand For Sterilized Pharmaceutical Formulations”
- Cleanroom offers a clean, sterile environment free of germs. Such rooms are built to minimize the possibility of pollution of machinery, walls, fabrics and staff items. Industries have sterilization plants to avoid contamination of goods. This rising demand for sterilized pharmaceutical formulations by major production firms is proportionally surging the adoption rate of cleanroom technologies by the pharmaceutical industries. The demand for sterilized pharmaceutical formulations is surging due to the increased incidence of chronic diseases across the globe, along with the rising geriatric population.
For instance,
- A March 2024 article by VertMarkets, Inc. highlighted that the demand for sterile filtration of high-concentration drugs is increasing as biotech companies focus on next-generation therapies. With the shift toward subcutaneous administration, sterile filtration ensures drug safety and efficacy. This trend supports patient convenience, reduces infusion time, and aligns with the growing need for advanced pharmaceutical formulations
- In November 2024, Texere Publishing Limited reported that Injectable drugs, including vaccines and biologics, require careful selection of sterile container formats to ensure product quality and patient safety. Innovations in pre-filled syringes, blow-fill-seal technology, and vials support efficient and convenient drug delivery, reflecting the industry's focus on advanced therapeutic packaging and optimized pharmaceutical formulations
- The growing need for sterilized pharmaceutical formulations is directly influencing the widespread adoption of cleanroom technologies in the pharmaceutical industry. As companies strive to maintain stringent hygiene standards, cleanrooms play a crucial role in preventing contamination and ensuring product safety. With the increasing prevalence of chronic diseases and a rising geriatric population, the demand for sterile drug formulations will continue to expand. The integration of advanced sterilization techniques and cleanroom solutions is essential for meeting regulatory requirements and delivering high-quality pharmaceutical products. This trend underscores the industry's commitment to innovation, patient safety, and enhanced drug efficacy.
Opportunity
“Prevalence Of Post-Covid-19 Hygiene Awareness”
- The prevalence of post-COVID-19 hygiene awareness has significantly heightened the importance of maintaining clean and sterile environments across various industries. As organizations prioritize health and safety, there is an increased recognition of the critical role that cleanroom technologies play in preventing contamination and ensuring product integrity. This shift in mindset prompts various sectors—including pharmaceuticals, biotech, food processing, and electronics—to invest in advanced cleanroom solutions to meet stringent hygiene standards and safeguard public health.
For instance,
- In May 2023, according to CleanLink, the pandemic highlighted the importance of maintaining a clean and sterile environment in the pharmaceuticals, biotechnology, and medical devices industries, where contamination is a major concern. The pandemic has also increased the demand for cleanroom technology in the production of medical equipment, such as ventilators, masks, and personal protective equipment (PPE). These factors have positively impacted the market growth
- In November 2023, NCBI stated that although the COVID-19 pandemic has reduced surgical volumes, infection control protocols have increased the ecological footprint of surgery owing to the extensive use of personal protective equipment, sanitation, testing and isolation resources. This heightened emphasis on infection control and the increased reliance on personal protective equipment (PPE) necessitate advancements in cleanroom technology, driving demand for more efficient, sustainable solutions that minimize waste while ensuring safety and compliance in healthcare settings
- Moreover, this heightened awareness has led to a surge in demand for innovative cleanroom technologies, such as automated monitoring systems and energy-efficient designs, which enhance operational efficiency while maintaining sanitary conditions. Companies are increasingly seeking to implement best practices and adhere to enhanced regulatory requirements, further driving the need for state-of-the-art cleanroom facilities. As a result, the Europe Cleanroom Technology Market stands to benefit significantly from this growing emphasis on hygiene, as organizations strive to create safer environments for their employees and customers alike.
Restraint/Challenge
“HIGH CAPITAL INVESTMENT FOR SETTLING UP CLEANROOM TECHNOLOGY”
- High capital investment acts as a significant barrier to entry for smaller companies and startups in the adoption of cleanroom technology. The costs associated with establishing a cleanroom facility can be substantial, encompassing expenses for design, construction, specialized equipment, and initial operational setup. This financial requirement can restrict access for emerging businesses that may not have sufficient resources to compete against larger, established players. As a result, the market may experience a concentration of providers, leading to reduced competition and potentially hindering innovation, as only a limited number of firms can afford the necessary investments in cleanroom technologies.
For instance,
- In August 2023, Pronto Panels announced that while the advancements in clean room panel technologies offer numerous benefits, there are also challenges that need to be addressed for successful adoption. One challenge is the cost of implementing advanced cleanroom panels. These panels often require significant upfront investment due to the use of advanced materials and technologies. However, the long-term benefits, such as improved product quality and operational efficiency, can outweigh the initial costs
- In October 2024, VNPedia stated that with strict requirements for cleanliness, the construction cost can be upto 20 million VND/m2 or more. This significant increase in construction costs can deter new entrants and existing players from investing in cleanroom technology, thereby hindering innovation and advancements in the market. Additionally, the financial burden may lead to reduced operational budgets for many companies, limiting their ability to upgrade or maintain existing cleanroom facilities, ultimately affecting overall industry growth and the ability to meet evolving regulatory standards
- Moreover, the substantial upfront costs can deter potential investors and stakeholders from committing capital to the sector. Existing companies also face pressure to maintain operational efficiency while managing these ongoing expenses, which can strain their financial resources. The need for continuous upgrades to meet evolving technological standards and regulatory requirements heightens this challenge, forcing companies to navigate the delicate balance between ensuring long-term viability and coping with the immediate burdens of significant capital expenditures. This situation can lead to a reluctance to invest in innovations, ultimately limiting the advancement and growth of cleanroom technologies across Europe.
Europe Cleanroom Technology Market Scope
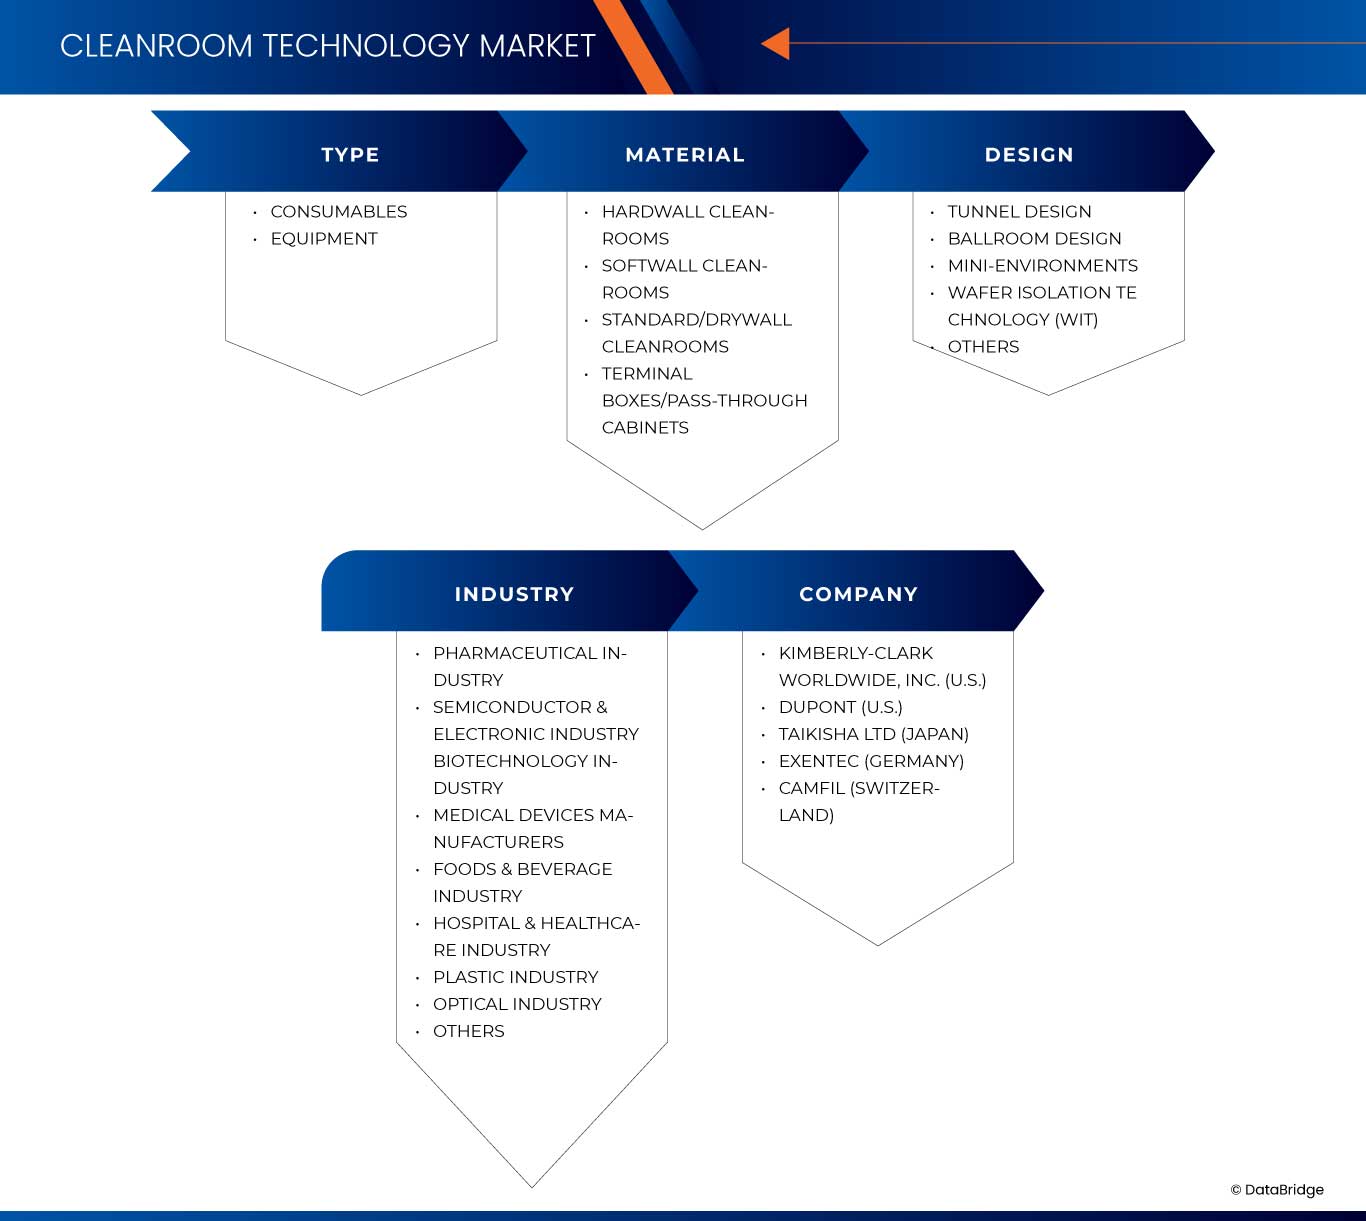
Europe cleanroom technology market is categorized into Four notable segments which are based on the basis of type, Material, Design and industry.
|
Segmentation |
Sub-Segmentation |
|
By type |
|
|
By Material |
|
|
By Design |
|
|
By industry
|
|
Europe Cleanroom Technology Market Regional Analysis
“Germany is the Dominant Region in the Cleanroom technology”
- Germany boasts a robust industrial sector, particularly in pharmaceuticals, biotechnology, and microelectronics. This strong industrial foundation drives the demand for cleanroom technology to meet stringent regulatory requirements and ensure product quality in these high-stakes industries.
- Germany is renowned for its emphasis on research and innovation. The country invests heavily in R&D, particularly in areas related to cleanroom technology, such as automation, digitalization, and advanced materials, keeping it at the forefront of technological advancements in the sector.
- Germany's commitment to high standards of quality and safety in manufacturing, reinforced by rigorous regulations and certifications, necessitates the use of advanced cleanroom solutions. This regulatory framework positions the country as a leader in cleanroom technology by promoting best practices and fostering market growth.
“Germany is Projected to Register the Highest Growth Rate in the Cleanroom technology”
- Germany has a robust manufacturing sector, particularly in industries such as pharmaceuticals, biotechnology, and semiconductor production that require stringent cleanroom conditions. The demand for advanced cleanroom technology is driven by the need for high-quality production environments in these sectors.
- The country is known for its commitment to research and development, which fosters innovation in cleanroom technologies. This investment not only enhances the capabilities of existing cleanroom systems but also drives the development of new solutions that meet changing regulatory requirements and industry standards.
- The increasing emphasis on energy efficiency and sustainable practices in manufacturing is encouraging the adoption of advanced cleanroom technologies. German companies are focusing on integrating eco-friendly materials and energy-efficient systems into their cleanroom designs, propelling growth in this market segment.
Europe Cleanroom Technology Market Share
The market competitive landscape provides details by competitor. Details included are company overview, company financials, revenue generated, market potential, investment in research and development, new market initiatives, Europe presence, production sites and facilities, production capacities, company strengths and weaknesses, product launch, product width and breadth, application dominance. The above data points provided are only related to the companies' focus related to market.
The Major Market Leaders Operating in the Market Are:
- KCWW
- DuPont
- Camfil
- Taikisha Ltd.
- ANSELL LTD
- Terra Universal. Inc
- Parteco srl
- Exentec, Hemair
- Helapet Ltd
- Colandis
- Galvani S.r.l.
- Lindner SE
- ABN Cleanroom Technology
- Nicomac Srl
- Ardmac.
Latest Developments in Europe Cleanroom Technology Market
- In April 2020, DuPont launched the #TyvekTogether program, to increase the overall availability of the Tyvek personal protective garments as an initiative to combat the spread of pandemic COVID-19. This programme launched by the company has increased its credibility in the market.
- In August 2024, Ansell Limited (ASX: ANN) has earned a Gold medal from EcoVadis for its strong sustainability efforts, ranking in the top 5% of over 1000 companies assessed. This recognition highlights Ansell’s leadership in environmental, social, and governance practices and its commitment to continuous improvement for a sustainable future.
- In August 2024, Ansell Limited (ASX: ANN) has earned a Gold medal from EcoVadis for its strong sustainability efforts, ranking in the top 5% of over 1000 companies assessed. This recognition highlights Ansell’s leadership in environmental, social, and governance practices and its commitment to continuous improvement for a sustainable future.
SKU-

- Interactive Data Analysis Dashboard
- Company Analysis Dashboard for high growth potential opportunities
- Research Analyst Access for customization & queries
- Competitor Analysis with Interactive dashboard
- Latest News, Updates & Trend analysis
- Harness the Power of Benchmark Analysis for Comprehensive Competitor Tracking
Table of Content
1 INTRODUCTION
1.1 OBJECTIVES OF THE STUDY
1.2 MARKET DEFINITION
1.3 OVERVIEW OF EUROPE CLEANROOM TECHNOLOGY MARKET
1.4 LIMITATIONS
1.5 MARKETS COVERED
2 MARKET SEGMENTATION
2.1 MARKETS COVERED
2.2 GEOGRAPHICAL SCOPE
2.3 YEARS CONSIDERED FOR THE STUDY
2.4 CURRENCY AND PRICING
2.5 DBMR TRIPOD DATA VALIDATION MODEL
2.6 PRIMARY INTERVIEWS WITH KEY OPINION LEADERS
2.7 MULTIVARIATE MODELLING
2.8 TYPE LIFELINE CURVE
2.9 DBMR MARKET POSITION GRID
2.1 SECONDARY SOURCES
2.11 ASSUMPTIONS
3 EXECUTIVE SUMMARY
4 PREMIUM INSIGHTS
4.1 PORTER’S FIVE FORCES
4.2 PESTEL ANALYSIS
4.3 NUMBER OF CLEANROOMS AND COMPANIES PER COUNTRY
4.3.1 FRANCE
4.3.2 SPAIN
4.3.3 GERMANY
4.3.4 U.K
4.3.5 ITALY
4.3.6 REST OF EUROPE
4.4 OPPUTUNITY MAP ANALYSIS
4.5 INDUSTRY INSIGHTS
5 REGULATORY
5.1 REGULATORY AUTHORITIES
5.1.1 REGULATORY CLASSIFICATIONS
5.1.2 REGULATORY SUBMISSIONS
5.1.3 INTERNATIONAL HARMONIZATION
5.1.4 COMPLIANCE AND QUALITY MANAGEMENT SYSTEMS
5.1.5 REGULATORY CHALLENGES AND STRATEGIES
6 MARKET OVERVIEW
6.1 DRIVERS
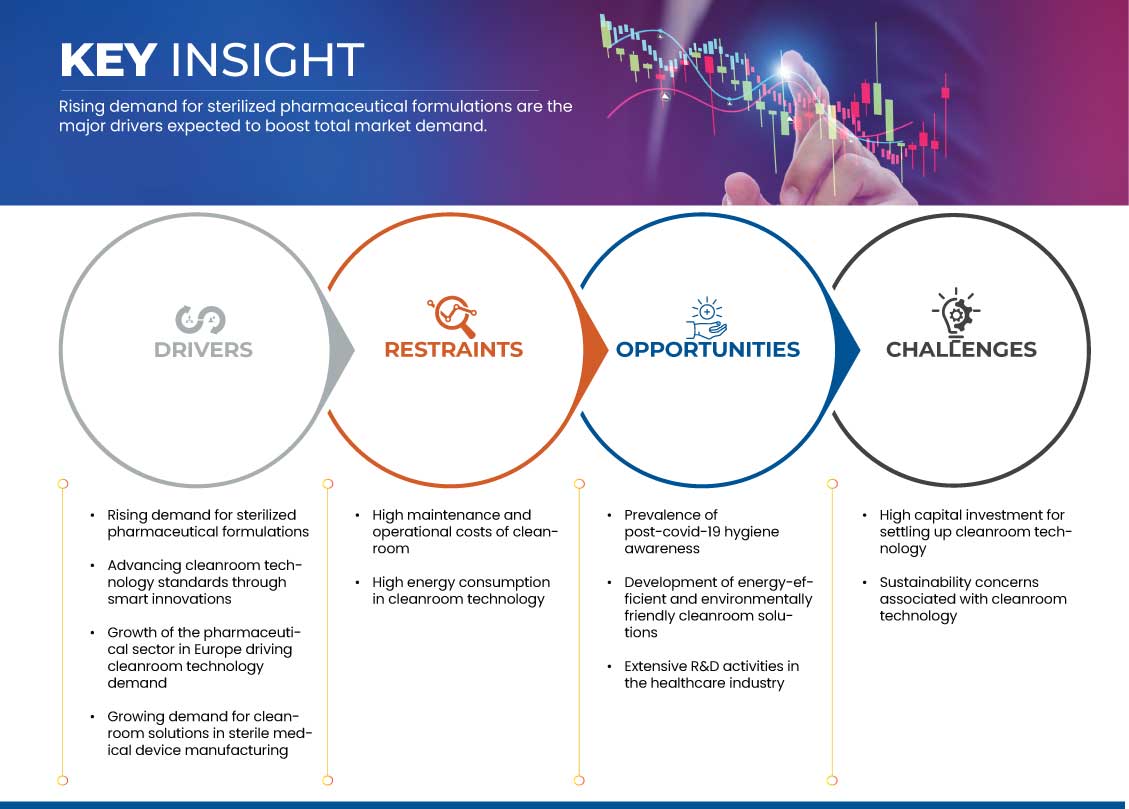
6.1.1 RISING DEMAND FOR STERILIZED PHARMACEUTICAL FORMULATIONS
6.1.2 ADVANCING CLEANROOM TECHNOLOGY STANDARDS THROUGH SMART INNOVATIONS
6.1.3 GROWTH OF THE PHARMACEUTICAL SECTOR IN EUROPE DRIVING CLEANROOM TECHNOLOGY DEMAND
6.1.4 GROWING DEMAND FOR CLEANROOM SOLUTIONS IN STERILE MEDICAL DEVICE MANUFACTURING
6.2 RESTRAINTS
6.2.1 HIGH MAINTENANCE AND OPERATIONAL COSTS OF CLEANROOM
6.2.2 HIGH ENERGY CONSUMPTION IN CLEANROOM TECHNOLOGY
6.3 OPPORTUNITIES
6.3.1 PREVALENCE OF POST-COVID-19 HYGIENE AWARENESS
6.3.2 DEVELOPMENT OF ENERGY-EFFICIENT AND ENVIRONMENTALLY FRIENDLY CLEANROOM SOLUTIONS
6.3.3 EXTENSIVE R&D ACTIVITIES IN THE HEALTHCARE INDUSTRY
6.4 CHALLENGES
6.4.1 HIGH CAPITAL INVESTMENT FOR SETTLING UP CLEANROOM TECHNOLOGY
6.4.2 SUSTAINABILITY CONCERNS ASSOCIATED WITH CLEANROOM TECHNOLOGY
7 EUROPE CLEANROOM TECHNOLOGY MARKET, BY TYPE
7.1 OVERVIEW
7.2 CONSUMABLES
7.2.1 SAFETY CONSUMABLES
7.2.1.1 GLOVES
7.2.1.2 GARMENTS
7.2.1.3 APPAREL
7.2.1.4 CART COVERS
7.2.1.5 OTHERS
7.2.2 CLEANING CONSUMABLES
7.2.2.1 DISINFECTANTS
7.2.2.2 WIPES
7.2.2.3 VACUUM SYSTEMS
7.2.2.4 SWABS
7.2.2.5 FACE MASKS
7.2.2.6 OTHERS
7.3 EQUIPMENT
7.3.1 HIGH-EFFICIENCY PARTICULATE AIR (HEPA) / ULTRA LOW PARTICULATE AIR (ULPA) FILTERS
7.3.2 HEATING VENTILATION AND AIR CONDITIONING SYSTEM (HVAC)
7.3.3 FAN FILTER UNITS (FFU)
7.3.4 LAMINAR AIR FLOW BIOSAFETY CABINETS
7.3.5 AIR DIFFUSERS AND SHOWERS
7.3.6 PRE-FILTERS
7.3.7 OTHERS
7.3.7.1 ENVIRONMENTAL MONITORING SYSTEM
7.3.7.2 FUME HOODS
7.3.7.3 GLOVEBOXES AND ISOLATORS
7.3.7.4 PARTICLE COUNTERS
7.3.7.5 DESICCATOR CABINETS
8 EUROPE CLEANROOM TECHNOLOGY MARKET, BY MATERIAL
8.1 OVERVIEW
8.2 HARDWALL CLEANROOMS
8.3 SOFTWALL CLEANROOMS
8.4 STANDARD/DRYWALL CLEANROOMS
8.5 TERMINAL BOXES/PASS-THROUGH CABINETS
9 EUROPE CLEANROOM TECHNOLOGY MARKET, BY INDUSTRY
9.1 OVERVIEW
9.2 PHARMACEUTICAL INDUSTRY
9.3 SEMICONDUCTOR & ELECTRONIC INDUSTRY
9.4 BIOTECHNOLOGY INDUSTRY
9.5 MEDICAL DEVICES MANUFACTURERS
9.6 FOODS & BEVERAGE INDUSTRY
9.7 HOSPITAL & HEALTHCARE INDUSTRY
9.8 PLASTIC INDUSTRY
9.9 OPTICAL INDUSTRY
9.1 OTHERS
10 EUROPE CLEANROOM TECHNOLOGY MARKET, BY DESIGN
10.1 OVERVIEW
10.2 TUNNEL DESIGN
10.3 BALLROOM DESIGN
10.4 MINI-ENVIRONMENTS
10.5 WAFER ISOLATION TECHNOLOGY (WIT)
10.6 OTHERS
11 EUROPE CLEANROOM TECHNOLOGY MARKET, BY COUNTRIES
11.1 EUROPE
11.1.1 GERMANY
11.1.2 FRANCE
11.1.3 U.K.
11.1.4 ITALY
11.1.5 SPAIN
11.1.6 RUSSIA
11.1.7 TURKEY
11.1.8 NETHERLANDS
11.1.9 SWITZERLAND
11.1.10 POLAND
11.1.11 BELGIUM
11.1.12 SWEDEN
11.1.13 DENMARK
11.1.14 NORWAY
11.1.15 FINLAND
11.1.16 REST OF EUROPE
12 EUROPE CLEANROOM TECHNOLOGY MARKET: COMPANY LANDSCAPE
12.1 COMPANY SHARE ANALYSIS: EUROPE
13 SWOT ANALYSIS
14 COMPANY PROFILE
14.1 KCWW
14.1.1 COMPANY SNAPSHOT
14.1.2 REVENUE ANALYSIS
14.1.3 PRODUCT PORTFOLIO
14.1.4 RECENT DEVELOPMENT
14.2 DUPONT
14.2.1 COMPANY SNAPSHOT
14.2.2 REVENUE ANALYSIS
14.2.3 PRODUCT PORTFOLIO
14.2.4 RECENT DEVELOPMENTS/NEWS
14.3 EXENTEC
14.3.1 COMPANY SNAPSHOT
14.3.2 PRODUCT PORTFOLIO
14.3.3 RECENT DEVELOPMENTS
14.4 CAMFIL
14.4.1 COMPANY SNAPSHOT
14.4.2 PRODUCT PORTFOLIO
14.4.3 RECENT DEVELOPMENT
14.5 TAIKISHA LTD.
14.5.1 COMPANY SNAPSHOT
14.5.2 REVENUE ANALYSIS
14.5.3 PRODUCT PORTFOLIO
14.5.4 RECENT DEVELOPMENTS
14.6 ABN CLEANROOM TECHNOLOGY
14.6.1 COMPANY SNAPSHOT
14.6.2 PRODUCT PORTFOLIO
14.6.3 RECENT DEVELOPMENT
14.7 AIRTECH ADVANCED MATERIALS GROUP
14.7.1 COMPANY SNAPSHOT
14.7.2 PRODUCT PORTFOLIO
14.7.3 RECENT DEVELOPMENT
14.8 ANSELL LTD.
14.8.1 COMPANY SNAPSHOT
14.8.2 REVENUE ANALYSIS
14.8.3 PRODUCT PORTFOLIO
14.8.4 RECENT DEVELOPMENTS/NEWS
14.9 ARDMAC
14.9.1 COMPANY SNAPSHOT
14.9.2 PRODUCT PORTFOLIO
14.9.3 RECENT DEVELOPMENT
14.1 CLEANGRAD
14.10.1 COMPANY SNAPSHOT
14.10.2 PRODUCT PORTFOLIO
14.10.3 RECENT DEVELOPMENT
14.11 COLANDIS GMBH
14.11.1 COMPANY SNAPSHOT
14.11.2 PRODUCT PORTFOLIO
14.11.3 RECENT DEVELOPMENT
14.12 CWS INTERNATIONAL GMBH
14.12.1 COMPANY SNAPSHOT
14.12.2 PRODUCT PORTFOLIO
14.12.3 RECENT DEVELOPMENT
14.13 DASTEX GROUP GMBH
14.13.1 COMPANY SNAPSHOT
14.13.2 PRODUCT PORTFOLIO
14.13.3 RECENT DEVELOPMENT
14.14 ECOS GMBH
14.14.1 COMPANY SNAPSHOT
14.14.2 PRODUCT PORTFOLIO
14.14.3 RECENT DEVELOPMENT
14.15 GALVANI S.R.L.
14.15.1 COMPANY SNAPSHOT
14.15.2 SOLUTION PORTFOLIO
14.15.3 RECENT DEVELOPMENT
14.16 GUARDTECH CLEANROOMS LTD.
14.16.1 COMPANY SNAPSHOT
14.16.2 PRODUCT PORTFOLIO
14.16.3 RECENT DEVELOPMENT
14.17 HELAPET LTD
14.17.1 COMPANY SNAPSHOT
14.17.2 PRODUCT PORTFOLIO
14.17.3 RECENT DEVELOPMENT
14.18 HEMAIR
14.18.1 COMPANY SNAPSHOT
14.18.2 PRODUCT PORTFOLIO
14.18.3 RECENT DEVELOPMENT
14.19 ITW CONTAMINATION CONTROL BV
14.19.1 COMPANY SNAPSHOT
14.19.2 PRODUCT PORTFOLIO
14.19.3 RECENT DEVELOPMENTS
14.2 KLEANLABS.COM
14.20.1 COMPANY SNAPSHOT
14.20.2 PRODUCT PORTFOLIO
14.20.3 RECENT DEVELOPMENT
14.21 LINDNER SE
14.21.1 COMPANY SNAPSHOT
14.21.2 PRODUCT PORTFOLIO
14.21.3 RECENT DEVELOPMENTS
14.22 LINDSTRÖM
14.22.1 COMPANY SNAPSHOT
14.22.2 PRODUCT PORTFOLIO
14.22.3 RECENT DEVELOPMENT
14.23 NICOMAC SRL
14.23.1 COMPANY SNAPSHOT
14.23.2 PRODUCT PORTFOLIO
14.23.3 RECENT DEVELOPMENT
14.24 PARTECO SRL
14.24.1 COMPANY SNAPSHOT
14.24.2 PRODUCT PORTFOLIO
14.24.3 RECENT DEVELOPMENT
14.25 PETEK REINRAUMTECHNIK GMBH
14.25.1 COMPANY SNAPSHOT
14.25.2 PRODUCT PORTFOLIO
14.25.3 RECENT DEVELOPMENT
14.26 PROCLEANROOM
14.26.1 COMPANY SNAPSHOT
14.26.2 PRODUCT PORTFOLIO
14.26.3 RECENT DEVELOPMENT
14.27 REMAK A.S
14.27.1 COMPANY SNAPSHOT
14.27.2 PRODUCT PORTFOLIO
14.27.3 RECENT DEVELOPMENTS
14.28 SOLITE EUROPE
14.28.1 COMPANY SNAPSHOT
14.28.2 PRODUCT PORTFOLIO
14.28.3 RECENT DEVELOPMENT
14.29 TERRA UNIVERSAL INC.
14.29.1 COMPANY SNAPSHOT
14.29.2 PRODUCT PORTFOLIO
14.29.3 RECENT DEVELOPMENT
14.3 TOTAL CLEAN AIR
14.30.1 COMPANY SNAPSHOT
14.30.2 PRODUCT PORTFOLIO
14.30.3 RECENT DEVELOPMENT
14.31 WEISS TECHNIK
14.31.1 COMPANY SNAPSHOT
14.31.2 PRODUCT PORTFOLIO
14.31.3 RECENT DEVELOPMENTS
14.32 WHITEWALL PROJECTS LTD.
14.32.1 COMPANY SNAPSHOT
14.32.2 PRODUCT PORTFOLIO
14.32.3 RECENT DEVELOPMENTS
15 QUESTIONNAIRE
16 RELATED REPORTS
List of Table
TABLE 1 EUROPE CLEANROOM TECHNOLOGY MARKET, BY TYPE, 2018-2032 (USD THOUSAND)
TABLE 2 EUROPE CONSUMABLES IN CLEANROOM TECHNOLOGY MARKET, BY TYPE, 2018-2032 (USD THOUSAND)
TABLE 3 EUROPE SAFETY CONSUMABLES IN CLEANROOM TECHNOLOGY MARKET, BY TYPE, 2018-2032 (USD THOUSAND)
TABLE 4 EUROPE CLEANING CONSUMABLES IN CLEANROOM TECHNOLOGY MARKET, BY TYPE, 2018-2032 (USD THOUSAND)
TABLE 5 EUROPE EQUIPMENT IN CLEANROOM TECHNOLOGY MARKET, BY TYPE, 2018-2032 (USD THOUSAND)
TABLE 6 EUROPE OTHERS IN CLEANROOM TECHNOLOGY MARKET, BY TYPE, 2018-2032 (USD THOUSAND)
TABLE 7 EUROPE CLEANROOM TECHNOLOGY MARKET, BY MATERIAL, 2018-2032 (USD THOUSAND)
TABLE 8 EUROPE CLEANROOM TECHNOLOGY MARKET, BY INDUSTRY, 2018-2032 (USD THOUSAND)
TABLE 9 EUROPE CLEANROOM TECHNOLOGY MARKET, BY DESIGN, 2018-2032 (USD THOUSAND)
TABLE 10 EUROPE CLEANROOM TECHNOLOGY MARKET, BY COUNTRY, 2018-2032 (USD THOUSAND)
TABLE 11 GERMANY CLEANROOM TECHNOLOGY MARKET, BY TYPE, 2018-2032 (USD THOUSAND)
TABLE 12 GERMANY CONSUMABLES IN CLEANROOM TECHNOLOGY MARKET, BY TYPE, 2018-2032 (USD THOUSAND)
TABLE 13 GERMANY SAFETY CONSUMABLES IN CLEANROOM TECHNOLOGY MARKET, BY TYPE, 2018-2032 (USD THOUSAND)
TABLE 14 GERMANY CLEANING CONSUMABLES IN CLEANROOM TECHNOLOGY MARKET, BY TYPE, 2018-2032 (USD THOUSAND)
TABLE 15 GERMANY EQUIPMENT IN CLEANROOM TECHNOLOGY MARKET, BY TYPE, 2018-2032 (USD THOUSAND)
TABLE 16 GERMANY OTHERS IN CLEANROOM TECHNOLOGY MARKET, BY TYPE, 2018-2032 (USD THOUSAND)
TABLE 17 GERMANY CLEANROOM TECHNOLOGY MARKET, BY MATERIAL, 2018-2032 (USD THOUSAND)
TABLE 18 GERMANY CLEANROOM TECHNOLOGY MARKET, BY DESIGN, 2018-2032 (USD THOUSAND)
TABLE 19 GERMANY CLEANROOM TECHNOLOGY MARKET, BY INDUSTRY, 2018-2032 (USD THOUSAND)
TABLE 20 FRANCE CLEANROOM TECHNOLOGY MARKET, BY TYPE, 2018-2032 (USD THOUSAND)
TABLE 21 FRANCE CONSUMABLES IN CLEANROOM TECHNOLOGY MARKET, BY TYPE, 2018-2032 (USD THOUSAND)
TABLE 22 FRANCE SAFETY CONSUMABLES IN CLEANROOM TECHNOLOGY MARKET, BY TYPE, 2018-2032 (USD THOUSAND)
TABLE 23 FRANCE CLEANING CONSUMABLES IN CLEANROOM TECHNOLOGY MARKET, BY TYPE, 2018-2032 (USD THOUSAND)
TABLE 24 FRANCE EQUIPMENT IN CLEANROOM TECHNOLOGY MARKET, BY TYPE, 2018-2032 (USD THOUSAND)
TABLE 25 FRANCE OTHERS IN CLEANROOM TECHNOLOGY MARKET, BY TYPE, 2018-2032 (USD THOUSAND)
TABLE 26 FRANCE CLEANROOM TECHNOLOGY MARKET, BY MATERIAL, 2018-2032 (USD THOUSAND)
TABLE 27 FRANCE CLEANROOM TECHNOLOGY MARKET, BY DESIGN, 2018-2032 (USD THOUSAND)
TABLE 28 FRANCE CLEANROOM TECHNOLOGY MARKET, BY INDUSTRY, 2018-2032 (USD THOUSAND)
TABLE 29 U.K. CLEANROOM TECHNOLOGY MARKET, BY TYPE, 2018-2032 (USD THOUSAND)
TABLE 30 U.K. CONSUMABLES IN CLEANROOM TECHNOLOGY MARKET, BY TYPE, 2018-2032 (USD THOUSAND)
TABLE 31 U.K. SAFETY CONSUMABLES IN CLEANROOM TECHNOLOGY MARKET, BY TYPE, 2018-2032 (USD THOUSAND)
TABLE 32 U.K. CLEANING CONSUMABLES IN CLEANROOM TECHNOLOGY MARKET, BY TYPE, 2018-2032 (USD THOUSAND)
TABLE 33 U.K. EQUIPMENT IN CLEANROOM TECHNOLOGY MARKET, BY TYPE, 2018-2032 (USD THOUSAND)
TABLE 34 U.K. OTHERS IN CLEANROOM TECHNOLOGY MARKET, BY TYPE, 2018-2032 (USD THOUSAND)
TABLE 35 U.K. CLEANROOM TECHNOLOGY MARKET, BY MATERIAL, 2018-2032 (USD THOUSAND)
TABLE 36 U.K. CLEANROOM TECHNOLOGY MARKET, BY DESIGN, 2018-2032 (USD THOUSAND)
TABLE 37 U.K. CLEANROOM TECHNOLOGY MARKET, BY INDUSTRY, 2018-2032 (USD THOUSAND)
TABLE 38 ITALY CLEANROOM TECHNOLOGY MARKET, BY TYPE, 2018-2032 (USD THOUSAND)
TABLE 39 ITALY CONSUMABLES IN CLEANROOM TECHNOLOGY MARKET, BY TYPE, 2018-2032 (USD THOUSAND)
TABLE 40 ITALY SAFETY CONSUMABLES IN CLEANROOM TECHNOLOGY MARKET, BY TYPE, 2018-2032 (USD THOUSAND)
TABLE 41 ITALY CLEANING CONSUMABLES IN CLEANROOM TECHNOLOGY MARKET, BY TYPE, 2018-2032 (USD THOUSAND)
TABLE 42 ITALY EQUIPMENT IN CLEANROOM TECHNOLOGY MARKET, BY TYPE, 2018-2032 (USD THOUSAND)
TABLE 43 ITALY OTHERS IN CLEANROOM TECHNOLOGY MARKET, BY TYPE, 2018-2032 (USD THOUSAND)
TABLE 44 ITALY CLEANROOM TECHNOLOGY MARKET, BY MATERIAL, 2018-2032 (USD THOUSAND)
TABLE 45 ITALY CLEANROOM TECHNOLOGY MARKET, BY DESIGN, 2018-2032 (USD THOUSAND)
TABLE 46 ITALY CLEANROOM TECHNOLOGY MARKET, BY INDUSTRY, 2018-2032 (USD THOUSAND)
TABLE 47 SPAIN CLEANROOM TECHNOLOGY MARKET, BY TYPE, 2018-2032 (USD THOUSAND)
TABLE 48 SPAIN CONSUMABLES IN CLEANROOM TECHNOLOGY MARKET, BY TYPE, 2018-2032 (USD THOUSAND)
TABLE 49 SPAIN SAFETY CONSUMABLES IN CLEANROOM TECHNOLOGY MARKET, BY TYPE, 2018-2032 (USD THOUSAND)
TABLE 50 SPAIN CLEANING CONSUMABLES IN CLEANROOM TECHNOLOGY MARKET, BY TYPE, 2018-2032 (USD THOUSAND)
TABLE 51 SPAIN EQUIPMENT IN CLEANROOM TECHNOLOGY MARKET, BY TYPE, 2018-2032 (USD THOUSAND)
TABLE 52 SPAIN OTHERS IN CLEANROOM TECHNOLOGY MARKET, BY TYPE, 2018-2032 (USD THOUSAND)
TABLE 53 SPAIN CLEANROOM TECHNOLOGY MARKET, BY MATERIAL, 2018-2032 (USD THOUSAND)
TABLE 54 SPAIN CLEANROOM TECHNOLOGY MARKET, BY DESIGN, 2018-2032 (USD THOUSAND)
TABLE 55 SPAIN CLEANROOM TECHNOLOGY MARKET, BY INDUSTRY, 2018-2032 (USD THOUSAND)
TABLE 56 RUSSIA CLEANROOM TECHNOLOGY MARKET, BY TYPE, 2018-2032 (USD THOUSAND)
TABLE 57 RUSSIA CONSUMABLES IN CLEANROOM TECHNOLOGY MARKET, BY TYPE, 2018-2032 (USD THOUSAND)
TABLE 58 RUSSIA SAFETY CONSUMABLES IN CLEANROOM TECHNOLOGY MARKET, BY TYPE, 2018-2032 (USD THOUSAND)
TABLE 59 RUSSIA CLEANING CONSUMABLES IN CLEANROOM TECHNOLOGY MARKET, BY TYPE, 2018-2032 (USD THOUSAND)
TABLE 60 RUSSIA EQUIPMENT IN CLEANROOM TECHNOLOGY MARKET, BY TYPE, 2018-2032 (USD THOUSAND)
TABLE 61 RUSSIA OTHERS IN CLEANROOM TECHNOLOGY MARKET, BY TYPE, 2018-2032 (USD THOUSAND)
TABLE 62 RUSSIA CLEANROOM TECHNOLOGY MARKET, BY MATERIAL, 2018-2032 (USD THOUSAND)
TABLE 63 RUSSIA CLEANROOM TECHNOLOGY MARKET, BY DESIGN, 2018-2032 (USD THOUSAND)
TABLE 64 RUSSIA CLEANROOM TECHNOLOGY MARKET, BY INDUSTRY, 2018-2032 (USD THOUSAND)
TABLE 65 TURKEY CLEANROOM TECHNOLOGY MARKET, BY TYPE, 2018-2032 (USD THOUSAND)
TABLE 66 TURKEY CONSUMABLES IN CLEANROOM TECHNOLOGY MARKET, BY TYPE, 2018-2032 (USD THOUSAND)
TABLE 67 TURKEY SAFETY CONSUMABLES IN CLEANROOM TECHNOLOGY MARKET, BY TYPE, 2018-2032 (USD THOUSAND)
TABLE 68 TURKEY CLEANING CONSUMABLES IN CLEANROOM TECHNOLOGY MARKET, BY TYPE, 2018-2032 (USD THOUSAND)
TABLE 69 TURKEY EQUIPMENT IN CLEANROOM TECHNOLOGY MARKET, BY TYPE, 2018-2032 (USD THOUSAND)
TABLE 70 TURKEY OTHERS IN CLEANROOM TECHNOLOGY MARKET, BY TYPE, 2018-2032 (USD THOUSAND)
TABLE 71 TURKEY CLEANROOM TECHNOLOGY MARKET, BY MATERIAL, 2018-2032 (USD THOUSAND)
TABLE 72 TURKEY CLEANROOM TECHNOLOGY MARKET, BY DESIGN, 2018-2032 (USD THOUSAND)
TABLE 73 TURKEY CLEANROOM TECHNOLOGY MARKET, BY INDUSTRY, 2018-2032 (USD THOUSAND)
TABLE 74 NETHERLANDS CLEANROOM TECHNOLOGY MARKET, BY TYPE, 2018-2032 (USD THOUSAND)
TABLE 75 NETHERLANDS CONSUMABLES IN CLEANROOM TECHNOLOGY MARKET, BY TYPE, 2018-2032 (USD THOUSAND)
TABLE 76 NETHERLANDS SAFETY CONSUMABLES IN CLEANROOM TECHNOLOGY MARKET, BY TYPE, 2018-2032 (USD THOUSAND)
TABLE 77 NETHERLANDS CLEANING CONSUMABLES IN CLEANROOM TECHNOLOGY MARKET, BY TYPE, 2018-2032 (USD THOUSAND)
TABLE 78 NETHERLANDS EQUIPMENT IN CLEANROOM TECHNOLOGY MARKET, BY TYPE, 2018-2032 (USD THOUSAND)
TABLE 79 NETHERLANDS OTHERS IN CLEANROOM TECHNOLOGY MARKET, BY TYPE, 2018-2032 (USD THOUSAND)
TABLE 80 NETHERLANDS CLEANROOM TECHNOLOGY MARKET, BY MATERIAL, 2018-2032 (USD THOUSAND)
TABLE 81 NETHERLANDS CLEANROOM TECHNOLOGY MARKET, BY DESIGN, 2018-2032 (USD THOUSAND)
TABLE 82 NETHERLANDS CLEANROOM TECHNOLOGY MARKET, BY INDUSTRY, 2018-2032 (USD THOUSAND)
TABLE 83 SWITZERLAND CLEANROOM TECHNOLOGY MARKET, BY TYPE, 2018-2032 (USD THOUSAND)
TABLE 84 SWITZERLAND CONSUMABLES IN CLEANROOM TECHNOLOGY MARKET, BY TYPE, 2018-2032 (USD THOUSAND)
TABLE 85 SWITZERLAND SAFETY CONSUMABLES IN CLEANROOM TECHNOLOGY MARKET, BY TYPE, 2018-2032 (USD THOUSAND)
TABLE 86 SWITZERLAND CLEANING CONSUMABLES IN CLEANROOM TECHNOLOGY MARKET, BY TYPE, 2018-2032 (USD THOUSAND)
TABLE 87 SWITZERLAND EQUIPMENT IN CLEANROOM TECHNOLOGY MARKET, BY TYPE, 2018-2032 (USD THOUSAND)
TABLE 88 SWITZERLAND OTHERS IN CLEANROOM TECHNOLOGY MARKET, BY TYPE, 2018-2032 (USD THOUSAND)
TABLE 89 SWITZERLAND CLEANROOM TECHNOLOGY MARKET, BY MATERIAL, 2018-2032 (USD THOUSAND)
TABLE 90 SWITZERLAND CLEANROOM TECHNOLOGY MARKET, BY DESIGN, 2018-2032 (USD THOUSAND)
TABLE 91 SWITZERLAND CLEANROOM TECHNOLOGY MARKET, BY INDUSTRY, 2018-2032 (USD THOUSAND)
TABLE 92 POLAND CLEANROOM TECHNOLOGY MARKET, BY TYPE, 2018-2032 (USD THOUSAND)
TABLE 93 POLAND CONSUMABLES IN CLEANROOM TECHNOLOGY MARKET, BY TYPE, 2018-2032 (USD THOUSAND)
TABLE 94 POLAND SAFETY CONSUMABLES IN CLEANROOM TECHNOLOGY MARKET, BY TYPE, 2018-2032 (USD THOUSAND)
TABLE 95 POLAND CLEANING CONSUMABLES IN CLEANROOM TECHNOLOGY MARKET, BY TYPE, 2018-2032 (USD THOUSAND)
TABLE 96 POLAND EQUIPMENT IN CLEANROOM TECHNOLOGY MARKET, BY TYPE, 2018-2032 (USD THOUSAND)
TABLE 97 POLAND OTHERS IN CLEANROOM TECHNOLOGY MARKET, BY TYPE, 2018-2032 (USD THOUSAND)
TABLE 98 POLAND CLEANROOM TECHNOLOGY MARKET, BY MATERIAL, 2018-2032 (USD THOUSAND)
TABLE 99 POLAND CLEANROOM TECHNOLOGY MARKET, BY DESIGN, 2018-2032 (USD THOUSAND)
TABLE 100 POLAND CLEANROOM TECHNOLOGY MARKET, BY INDUSTRY, 2018-2032 (USD THOUSAND)
TABLE 101 BELGIUM CLEANROOM TECHNOLOGY MARKET, BY TYPE, 2018-2032 (USD THOUSAND)
TABLE 102 BELGIUM CONSUMABLES IN CLEANROOM TECHNOLOGY MARKET, BY TYPE, 2018-2032 (USD THOUSAND)
TABLE 103 BELGIUM SAFETY CONSUMABLES IN CLEANROOM TECHNOLOGY MARKET, BY TYPE, 2018-2032 (USD THOUSAND)
TABLE 104 BELGIUM CLEANING CONSUMABLES IN CLEANROOM TECHNOLOGY MARKET, BY TYPE, 2018-2032 (USD THOUSAND)
TABLE 105 BELGIUM EQUIPMENT IN CLEANROOM TECHNOLOGY MARKET, BY TYPE, 2018-2032 (USD THOUSAND)
TABLE 106 BELGIUM OTHERS IN CLEANROOM TECHNOLOGY MARKET, BY TYPE, 2018-2032 (USD THOUSAND)
TABLE 107 BELGIUM CLEANROOM TECHNOLOGY MARKET, BY MATERIAL, 2018-2032 (USD THOUSAND)
TABLE 108 BELGIUM CLEANROOM TECHNOLOGY MARKET, BY DESIGN, 2018-2032 (USD THOUSAND)
TABLE 109 BELGIUM CLEANROOM TECHNOLOGY MARKET, BY INDUSTRY, 2018-2032 (USD THOUSAND)
TABLE 110 SWEDEN CLEANROOM TECHNOLOGY MARKET, BY TYPE, 2018-2032 (USD THOUSAND)
TABLE 111 SWEDEN CONSUMABLES IN CLEANROOM TECHNOLOGY MARKET, BY TYPE, 2018-2032 (USD THOUSAND)
TABLE 112 SWEDEN SAFETY CONSUMABLES IN CLEANROOM TECHNOLOGY MARKET, BY TYPE, 2018-2032 (USD THOUSAND)
TABLE 113 SWEDEN CLEANING CONSUMABLES IN CLEANROOM TECHNOLOGY MARKET, BY TYPE, 2018-2032 (USD THOUSAND)
TABLE 114 SWEDEN EQUIPMENT IN CLEANROOM TECHNOLOGY MARKET, BY TYPE, 2018-2032 (USD THOUSAND)
TABLE 115 SWEDEN OTHERS IN CLEANROOM TECHNOLOGY MARKET, BY TYPE, 2018-2032 (USD THOUSAND)
TABLE 116 SWEDEN CLEANROOM TECHNOLOGY MARKET, BY MATERIAL, 2018-2032 (USD THOUSAND)
TABLE 117 SWEDEN CLEANROOM TECHNOLOGY MARKET, BY DESIGN, 2018-2032 (USD THOUSAND)
TABLE 118 SWEDEN CLEANROOM TECHNOLOGY MARKET, BY INDUSTRY, 2018-2032 (USD THOUSAND)
TABLE 119 DENMARK CLEANROOM TECHNOLOGY MARKET, BY TYPE, 2018-2032 (USD THOUSAND)
TABLE 120 DENMARK CONSUMABLES IN CLEANROOM TECHNOLOGY MARKET, BY TYPE, 2018-2032 (USD THOUSAND)
TABLE 121 DENMARK SAFETY CONSUMABLES IN CLEANROOM TECHNOLOGY MARKET, BY TYPE, 2018-2032 (USD THOUSAND)
TABLE 122 DENMARK CLEANING CONSUMABLES IN CLEANROOM TECHNOLOGY MARKET, BY TYPE, 2018-2032 (USD THOUSAND)
TABLE 123 DENMARK EQUIPMENT IN CLEANROOM TECHNOLOGY MARKET, BY TYPE, 2018-2032 (USD THOUSAND)
TABLE 124 DENMARK OTHERS IN CLEANROOM TECHNOLOGY MARKET, BY TYPE, 2018-2032 (USD THOUSAND)
TABLE 125 DENMARK CLEANROOM TECHNOLOGY MARKET, BY MATERIAL, 2018-2032 (USD THOUSAND)
TABLE 126 DENMARK CLEANROOM TECHNOLOGY MARKET, BY DESIGN, 2018-2032 (USD THOUSAND)
TABLE 127 DENMARK CLEANROOM TECHNOLOGY MARKET, BY INDUSTRY, 2018-2032 (USD THOUSAND)
TABLE 128 NORWAY CLEANROOM TECHNOLOGY MARKET, BY TYPE, 2018-2032 (USD THOUSAND)
TABLE 129 NORWAY CONSUMABLES IN CLEANROOM TECHNOLOGY MARKET, BY TYPE, 2018-2032 (USD THOUSAND)
TABLE 130 NORWAY SAFETY CONSUMABLES IN CLEANROOM TECHNOLOGY MARKET, BY TYPE, 2018-2032 (USD THOUSAND)
TABLE 131 NORWAY CLEANING CONSUMABLES IN CLEANROOM TECHNOLOGY MARKET, BY TYPE, 2018-2032 (USD THOUSAND)
TABLE 132 NORWAY EQUIPMENT IN CLEANROOM TECHNOLOGY MARKET, BY TYPE, 2018-2032 (USD THOUSAND)
TABLE 133 NORWAY OTHERS IN CLEANROOM TECHNOLOGY MARKET, BY TYPE, 2018-2032 (USD THOUSAND)
TABLE 134 NORWAY CLEANROOM TECHNOLOGY MARKET, BY MATERIAL, 2018-2032 (USD THOUSAND)
TABLE 135 NORWAY CLEANROOM TECHNOLOGY MARKET, BY DESIGN, 2018-2032 (USD THOUSAND)
TABLE 136 NORWAY CLEANROOM TECHNOLOGY MARKET, BY INDUSTRY, 2018-2032 (USD THOUSAND)
TABLE 137 FINLAND CLEANROOM TECHNOLOGY MARKET, BY TYPE, 2018-2032 (USD THOUSAND)
TABLE 138 FINLAND CONSUMABLES IN CLEANROOM TECHNOLOGY MARKET, BY TYPE, 2018-2032 (USD THOUSAND)
TABLE 139 FINLAND SAFETY CONSUMABLES IN CLEANROOM TECHNOLOGY MARKET, BY TYPE, 2018-2032 (USD THOUSAND)
TABLE 140 FINLAND CLEANING CONSUMABLES IN CLEANROOM TECHNOLOGY MARKET, BY TYPE, 2018-2032 (USD THOUSAND)
TABLE 141 FINLAND EQUIPMENT IN CLEANROOM TECHNOLOGY MARKET, BY TYPE, 2018-2032 (USD THOUSAND)
TABLE 142 FINLAND OTHERS IN CLEANROOM TECHNOLOGY MARKET, BY TYPE, 2018-2032 (USD THOUSAND)
TABLE 143 FINLAND CLEANROOM TECHNOLOGY MARKET, BY MATERIAL, 2018-2032 (USD THOUSAND)
TABLE 144 FINLAND CLEANROOM TECHNOLOGY MARKET, BY DESIGN, 2018-2032 (USD THOUSAND)
TABLE 145 FINLAND CLEANROOM TECHNOLOGY MARKET, BY INDUSTRY, 2018-2032 (USD THOUSAND)
TABLE 146 REST OF EUROPE CLEANROOM TECHNOLOGY MARKET, BY TYPE, 2018-2032 (USD THOUSAND)
List of Figure
FIGURE 1 EUROPE CLEANROOM TECHNOLOGY MARKET: SEGMENTATION
FIGURE 2 EUROPE CLEANROOM TECHNOLOGY MARKET: DATA TRIANGULATION
FIGURE 3 EUROPE CLEANROOM TECHNOLOGY MARKET: DROC ANALYSIS
FIGURE 4 EUROPE CLEANROOM TECHNOLOGY MARKET: EUROPE VS REGIONAL MARKET ANALYSIS
FIGURE 5 EUROPE CLEANROOM TECHNOLOGY MARKET: COMPANY RESEARCH ANALYSIS
FIGURE 6 EUROPE CLEANROOM TECHNOLOGY MARKET: INTERVIEW DEMOGRAPHICS
FIGURE 7 EUROPE CLEANROOM TECHNOLOGY MARKET: DBMR MARKET POSITION GRID
FIGURE 8 EUROPE CLEANROOM TECHNOLOGY MARKET: SEGMENTATION
FIGURE 9 EUROPE CLEANROOM TECHNOLOGY MARKET: EXECUTIVE SUMMARY
FIGURE 10 STRATEGIC DECISIONS
FIGURE 11 TWO SEGMENTS COMPRISE THE EUROPE CLEANROOM TECHNOLOGY MARKET, BY TYPE
FIGURE 12 RISING DEMAND FOR STERILIZED PHARMACEUTICAL FORMULATIONS TO DRIVE THE EUROPE CLEANROOM TECHNOLOGY MARKET GROWTH IN THE FORECAST PERIOD OF 2025 TO 2032
FIGURE 13 CONSUMABLES SEGMENT IS EXPECTED TO ACCOUNT FOR THE LARGEST SHARE OF THE EUROPE CLEANROOM TECHNOLOGY MARKET IN THE FORECAST PERIOD OF 2025 & 2032
FIGURE 14 DROC ANALYSIS
FIGURE 15 EUROPE CLEANROOM TECHNOLOGY MARKET: BY TYPE, 2024
FIGURE 16 EUROPE CLEANROOM TECHNOLOGY MARKET: BY TYPE, 2025-2032 (USD THOUSAND)
FIGURE 17 EUROPE CLEANROOM TECHNOLOGY MARKET: BY TYPE, CAGR (2025-2032)
FIGURE 18 EUROPE CLEANROOM TECHNOLOGY MARKET: BY TYPE, LIFELINE CURVE
FIGURE 19 EUROPE CLEANROOM TECHNOLOGY MARKET: BY MATERIAL, 2024
FIGURE 20 EUROPE CLEANROOM TECHNOLOGY MARKET: BY MATERIAL, 2025-2032 (USD THOUSAND)
FIGURE 21 EUROPE CLEANROOM TECHNOLOGY MARKET: BY MATERIAL, CAGR (2025-2032)
FIGURE 22 EUROPE CLEANROOM TECHNOLOGY MARKET: BY MATERIAL, LIFELINE CURVE
FIGURE 23 EUROPE CLEANROOM TECHNOLOGY MARKET: BY INDUSTRY, 2024
FIGURE 24 EUROPE CLEANROOM TECHNOLOGY MARKET: BY INDUSTRY, 2025-2032 (USD THOUSAND)
FIGURE 25 EUROPE CLEANROOM TECHNOLOGY MARKET: BY INDUSTRY, CAGR (2025-2032)
FIGURE 26 EUROPE CLEANROOM TECHNOLOGY MARKET: BY INDUSTRY, LIFELINE CURVE
FIGURE 27 EUROPE CLEANROOM TECHNOLOGY MARKET: BY DESIGN, 2024
FIGURE 28 EUROPE CLEANROOM TECHNOLOGY MARKET: BY DESIGN, 2025-2032 (USD THOUSAND)
FIGURE 29 EUROPE CLEANROOM TECHNOLOGY MARKET: BY DESIGN, CAGR (2025-2032)
FIGURE 30 EUROPE CLEANROOM TECHNOLOGY MARKET: BY DESIGN, LIFELINE CURVE
FIGURE 31 EUROPE CLEANROOM TECHNOLOGY MARKET SNAPSHOT
FIGURE 32 EUROPE CLEANROOM TECHNOLOGY MARKET: COMPANY SHARE 2024 (%)
Data collection and base year analysis are done using data collection modules with large sample sizes. The stage includes obtaining market information or related data through various sources and strategies. It includes examining and planning all the data acquired from the past in advance. It likewise envelops the examination of information inconsistencies seen across different information sources. The market data is analysed and estimated using market statistical and coherent models. Also, market share analysis and key trend analysis are the major success factors in the market report. To know more, please request an analyst call or drop down your inquiry.
The key research methodology used by DBMR research team is data triangulation which involves data mining, analysis of the impact of data variables on the market and primary (industry expert) validation. Data models include Vendor Positioning Grid, Market Time Line Analysis, Market Overview and Guide, Company Positioning Grid, Patent Analysis, Pricing Analysis, Company Market Share Analysis, Standards of Measurement, Global versus Regional and Vendor Share Analysis. To know more about the research methodology, drop in an inquiry to speak to our industry experts.
Data Bridge Market Research is a leader in advanced formative research. We take pride in servicing our existing and new customers with data and analysis that match and suits their goal. The report can be customized to include price trend analysis of target brands understanding the market for additional countries (ask for the list of countries), clinical trial results data, literature review, refurbished market and product base analysis. Market analysis of target competitors can be analyzed from technology-based analysis to market portfolio strategies. We can add as many competitors that you require data about in the format and data style you are looking for. Our team of analysts can also provide you data in crude raw excel files pivot tables (Fact book) or can assist you in creating presentations from the data sets available in the report.


