
Europe Colostrum Market
Market Size in USD Million
 USD
944.68 Million
USD
1,584.29 Million
2025
2033
USD
944.68 Million
USD
1,584.29 Million
2025
2033
| 2026 - 2033 | |
| USD 944.68 Million | |
| USD 1,584.29 Million | |
| % | |
|
Europe Colostrum Market Size
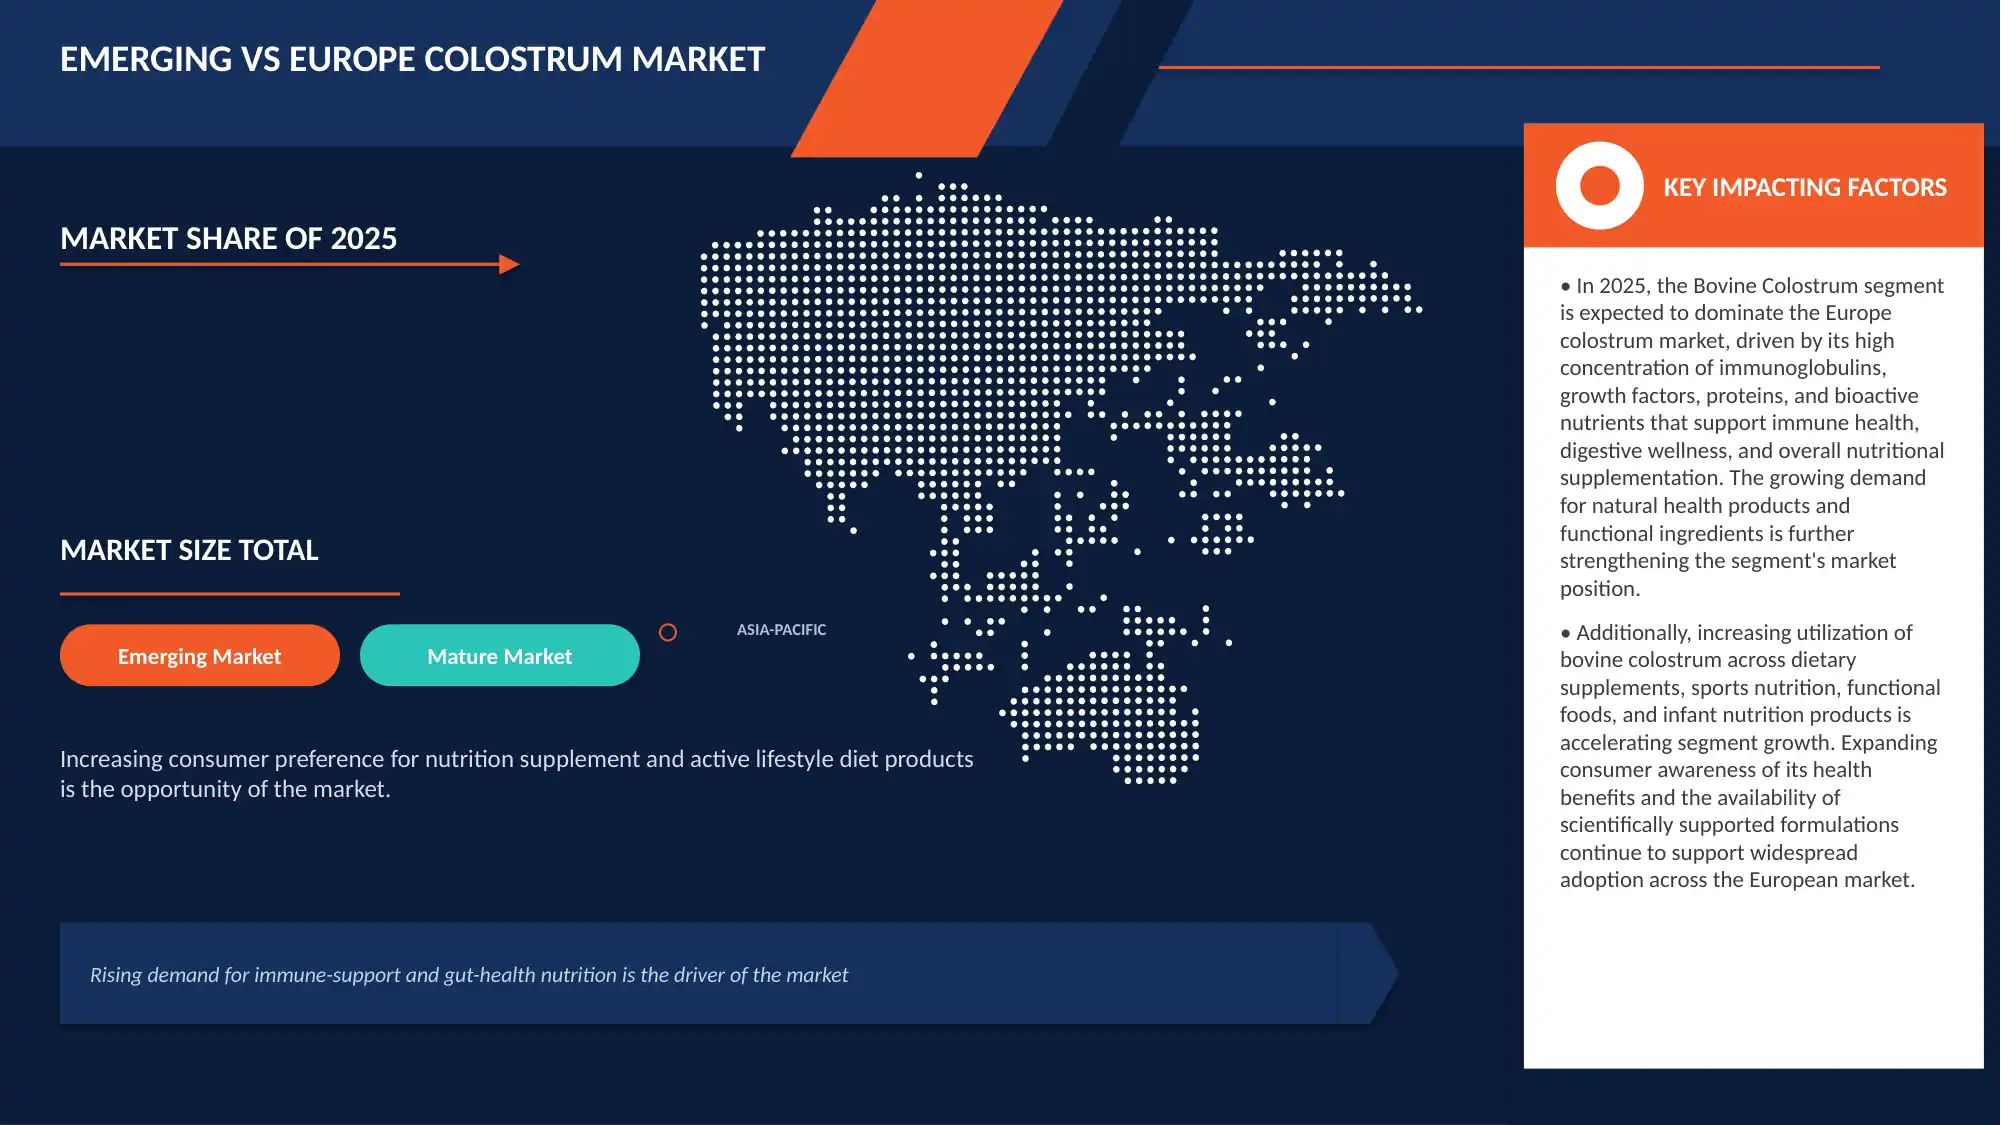
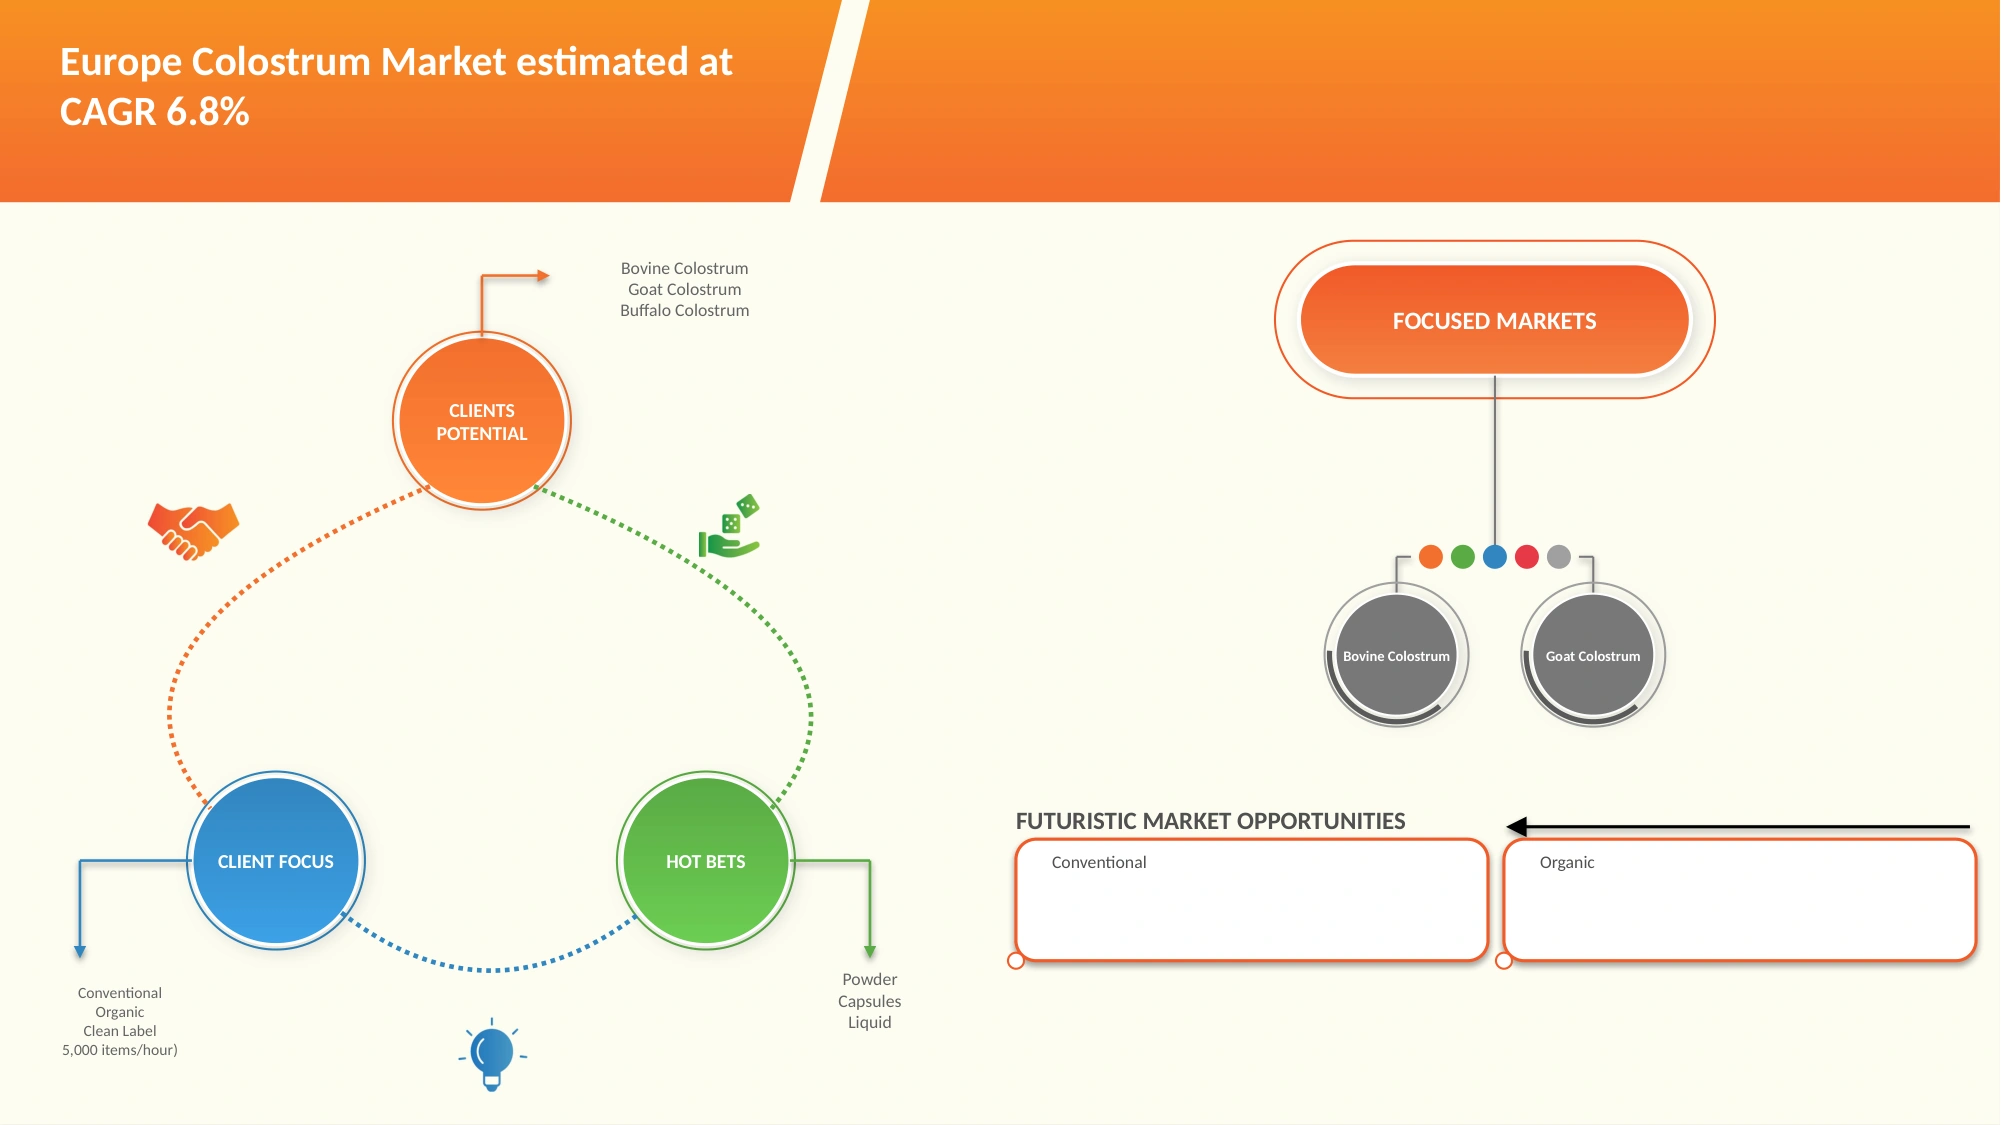
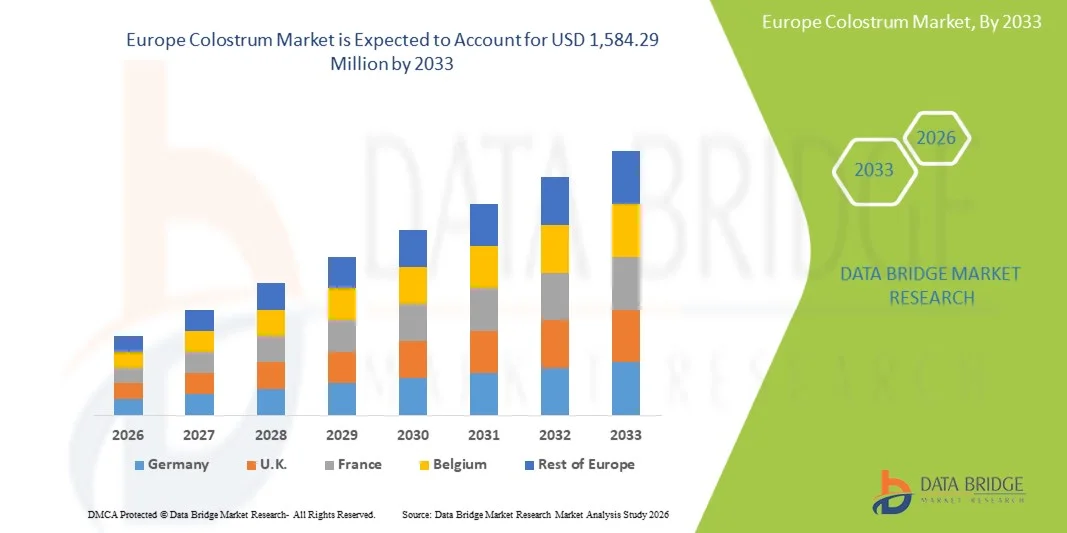
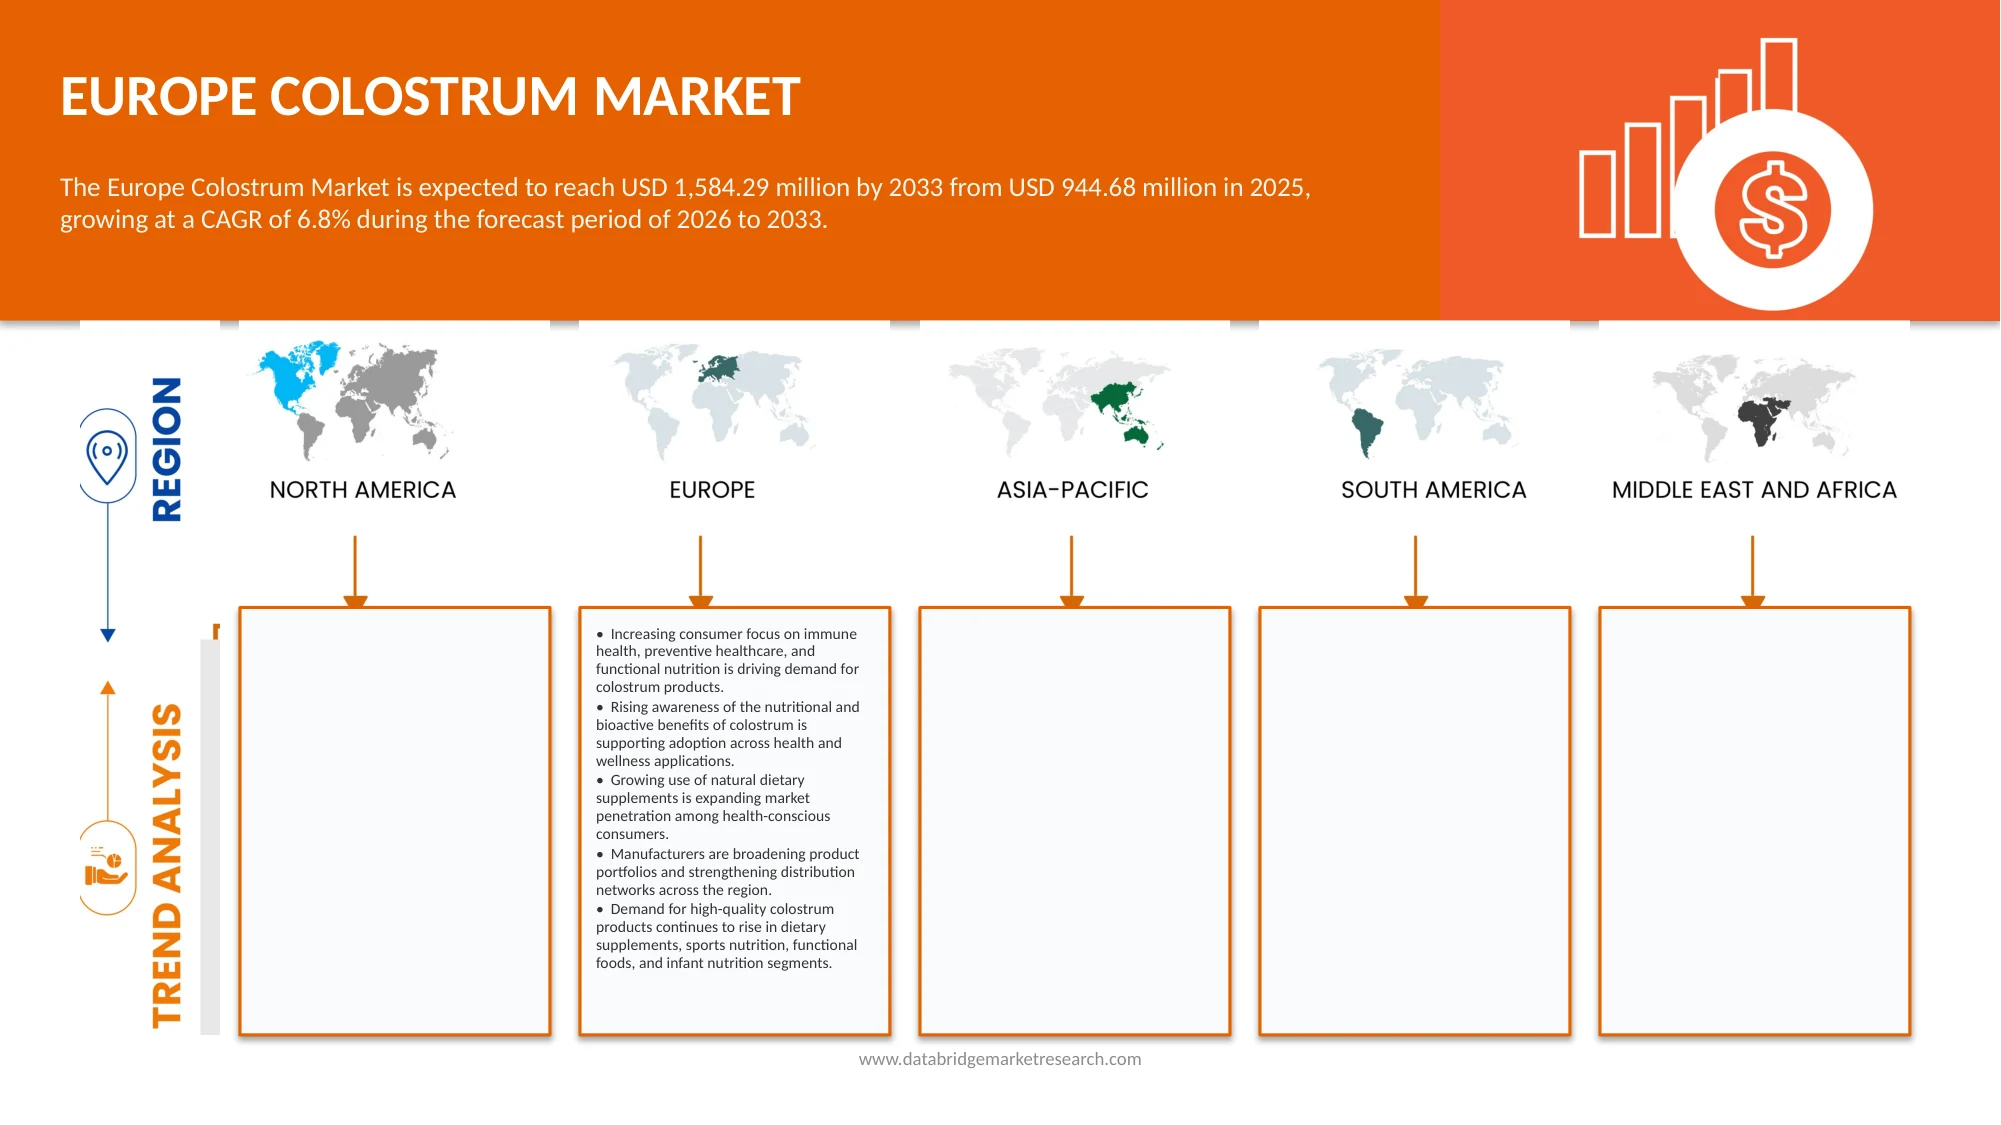
- The Europe colostrum market size was valued at USD 944.68 Million in 2025and is expected to reach USD 1,584.29 Million by 2033, at a CAGR of 6.8% during the forecast period
- Colostrum is the first form of milk produced by mammals during the initial hours after childbirth or calving, typically within the first 24–72 hours. It is a nutrient-dense biological fluid rich in immunoglobulins (IgG), antibodies, growth factors, proteins, vitamins, minerals, lactoferrin, and antimicrobial compounds that help provide passive immunity to newborns before their immune systems fully develop. Bovine colostrum, obtained from cows, is the most commercially utilized form in the nutraceutical and functional nutrition industries due to its high bioactive content and availability from large dairy farming systems.
- In addition, Compared to regular milk, colostrum contains significantly higher concentrations of immune-supporting compounds, making it valuable for applications related to immunity enhancement, gut health, tissue repair, and clinical nutrition support
Europe Colostrum Market Analysis
- The Europe colostrum Market is experiencing steady growth, driven by increasing consumer awareness regarding preventive healthcare, immunity enhancement, gut health management, and sports nutrition
- Rising demand for natural bioactive ingredients, expanding applications in dietary supplements, functional foods, infant nutrition, and animal feed, along with growing interest in nutraceutical products, are significantly supporting market expansion across the region. The market is further benefiting from increasing healthcare expenditures, an aging population, and the growing preference for scientifically supported nutritional products
- Germany is expected to dominate the Europe Colostrum Market with an estimated market share of approximately 18.60% in 2025 and it is anticipated to show the fastest growth during the forecast period, supported by a well-established nutraceutical industry, strong consumer awareness of dietary supplements, advanced healthcare infrastructure, and increasing demand for immune-supporting products. The country is also anticipated to witness significant growth during the forecast period due to continued investments in health and wellness products and growing adoption of functional nutrition
- The Bovine colostrum segment is anticipated to hold the largest market share of approximately 69.05% in 2025 and is expected to maintain strong growth throughout the forecast period. The segment's dominance is attributed to its high concentration of immunoglobulins, growth factors, proteins, vitamins, and minerals, along with its extensive use in dietary supplements, sports nutrition products, functional foods, and infant nutrition formulations
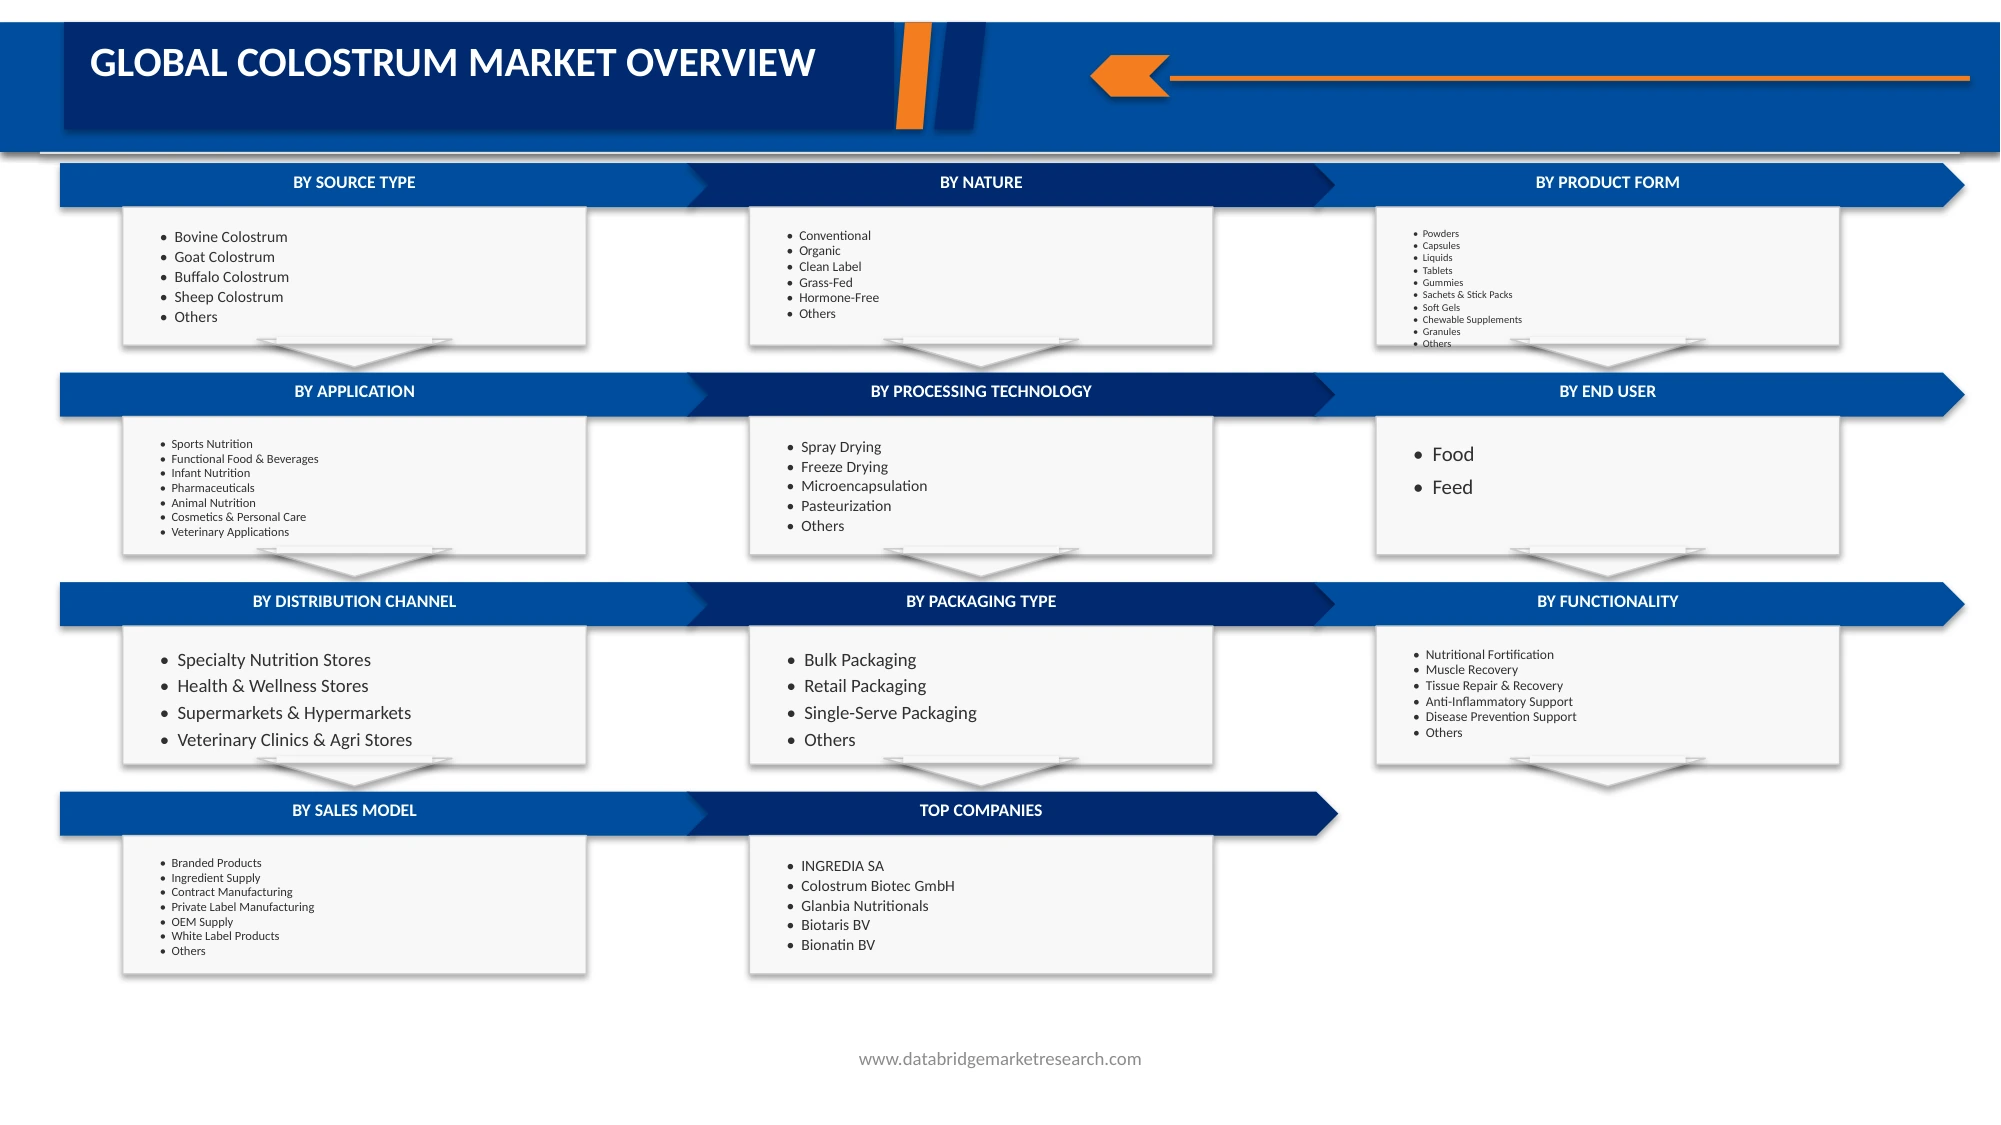
Report Scope and Europe Colostrum Market Segmentation
|
Attributes |
Europe Colostrum Market Key Market Insights |
|
Segments Covered |
· By Source Type: Bovine Colostrum, Goat Colostrum, Buffalo Colostrum, Sheep Colostrum, Mixed Animal Colostrum, and Others · By Nature: Conventional, Organic, Clean Label, Grass-Fed, Hormone-Free, and Others · By Product Form: Powder, Capsules, Liquid, Tablets, Gummies, Sachets & Stick Packs, Soft Gels, Chewable, Granules, and Others · By Immunoglobulin (Igg) Concentration: Below 15%, 15%–25%, 25%–35%, 35%–45%, Above 45%, Customized Igg Formulations, and Others · By Processing Technology: Spray Drying, Freeze Drying, Pasteurization, Membrane Filtration, Low-Temperature Processing, Microfiltration, Defatting, Fat Separation, Nano-Filtration, and Others · By Application: Dietary Supplements, Sports Nutrition, Functional Food & Beverages, Infant Nutrition, Pharmaceuticals, Animal Nutrition, Cosmetics, Veterinary Applications, and Others · By End User: Food and Feed · By Distribution Channel: Direct/B2B Sales, Online Retail, Pharmacies & Medical Stores, Specialty Nutrition Stores, Health & Wellness Stores, Supermarkets & Hypermarkets, Veterinary Clinics & Agri Stores, Convenience Stores, and Others · By Packaging Type: Bulk Packaging, Retail Packaging, Single-Serve Packaging, and Others · By Functionality: Immune Enhancement, Gut Microbiome Support, Nutritional Fortification, Muscle Recovery, Tissue Repair & Recovery, Anti-Inflammatory Support, Disease Prevention Support, Antioxidant Support, and Others · By Sales Model: Branded Products, Ingredient Supply, Contract Manufacturing, Private Label Manufacturing, OEM Supply, White Label Products, and Others |
|
Countries Covered |
Europe · Germany · Netherlands · France · Italy · Spain · Belgium · Austria · U.K. · Sweden · Switzerland · Denmark · Norway · Rest of Europe |
|
Key Market Players |
· Colbiom SP. ZO (Poland) • COLOSTRUM BIOTEC (Germany) • European Colostrum Industry (Belgium) • LacVital Colostrum (Germany) • Vitomega Colostrum B.V. (Netherlands) • COLOSTRUM POLSKA SP. Z O.O. (Poland) • PEDERSEN BIOTECH A/S (Denmark) • Goat Specialty Ingredients (Netherlands) • ZiegenKraft GmbH (Germany) • SwissBioColostrum AG (Switzerland) • INGREDIA S.A. (France) • Colostrum Biotech GmbH (Germany) • Glanbia Nutritionals (Ireland) • Biotaris B.V. (Netherlands) • Bionatin B.V. (Netherlands) |
|
Market Opportunities |
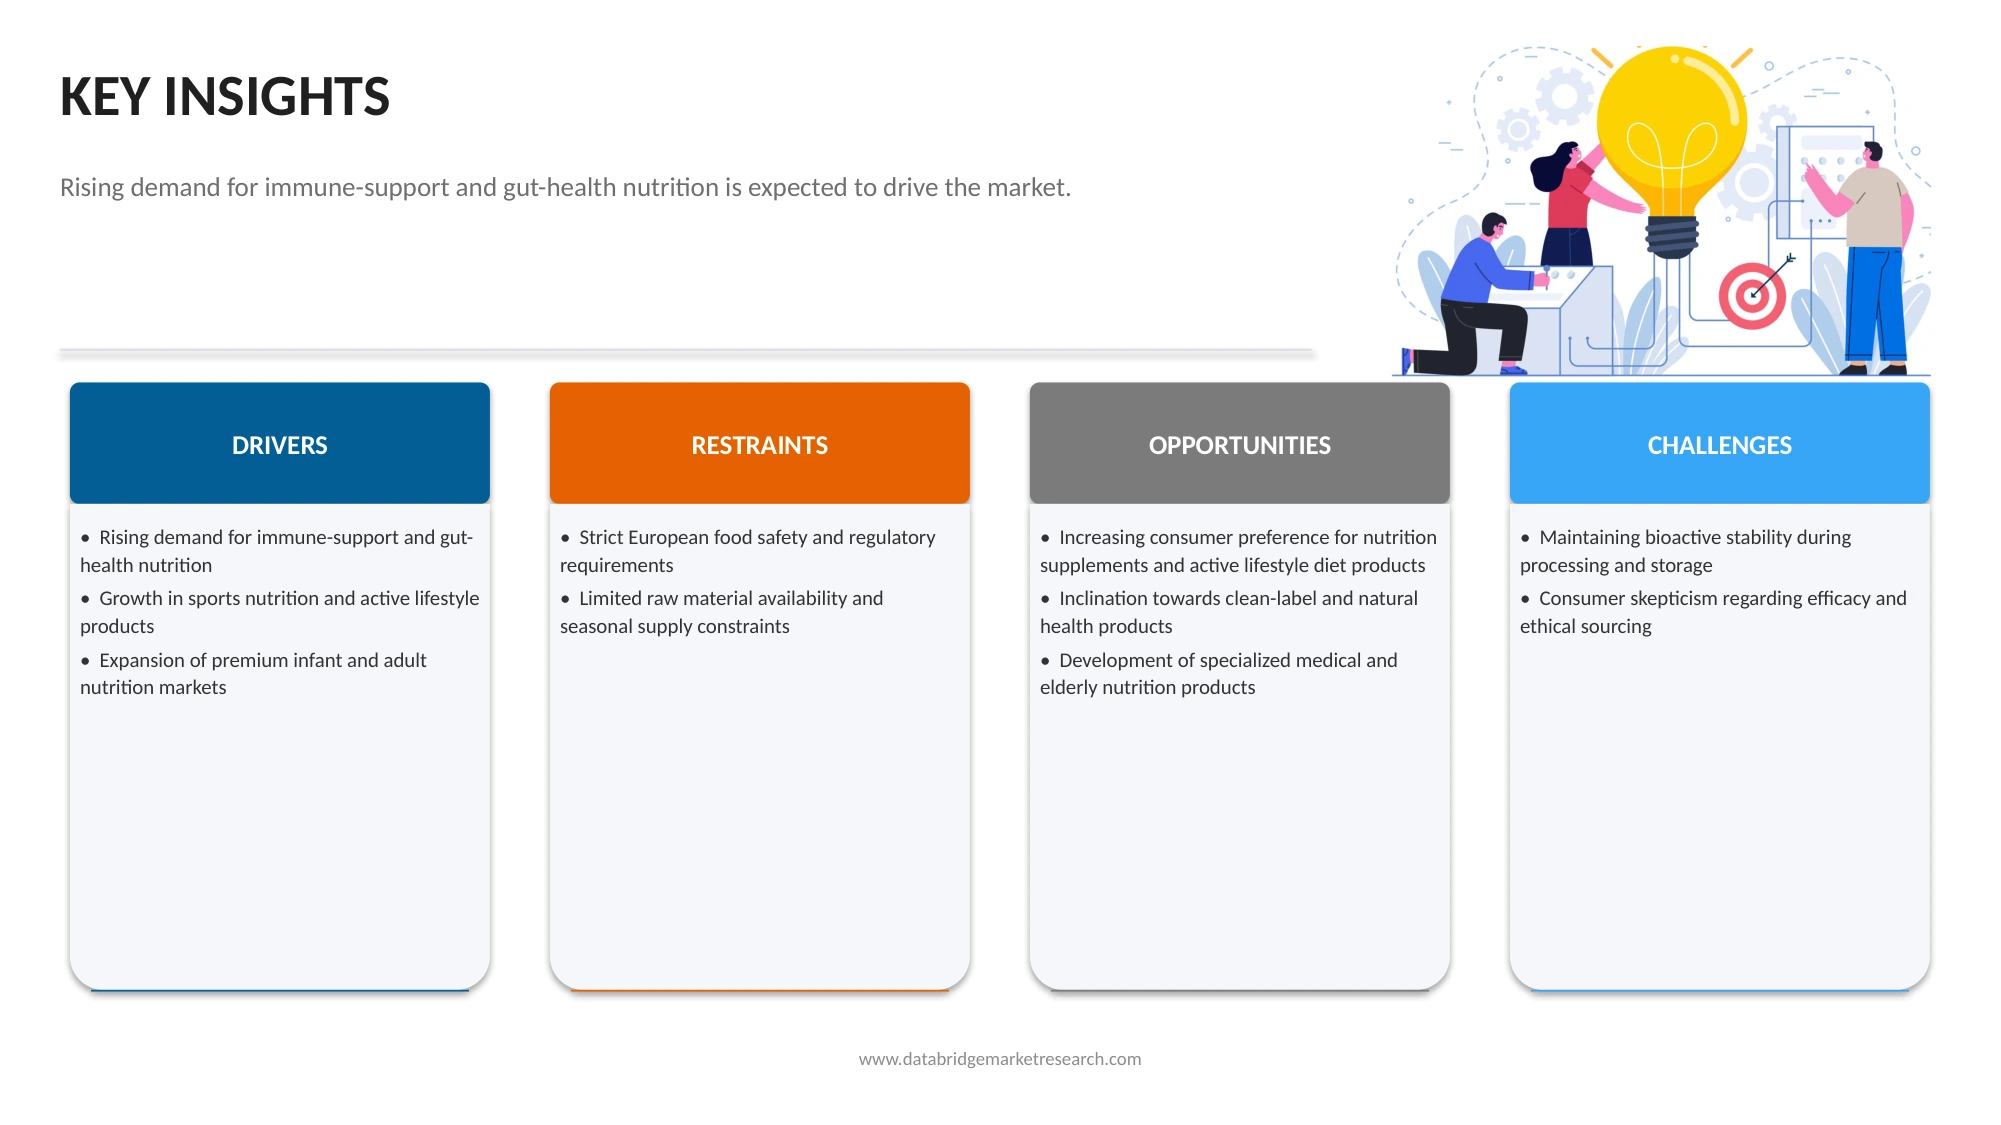
• Increasing consumer preference for nutrition supplement and active lifestyle diet products • Inclination towards clean-label and natural health product |
|
Value Added Data Infosets |
In addition to the insights on market scenarios such as market value, growth rate, segmentation, geographical coverage, and major players, the market reports curated by the Data Bridge Market Research also include in-depth expert analysis, patient epidemiology, pipeline analysis, pricing analysis, and regulatory framework. |
Europe Colostrum Market Trends
“Inclination Towards Clean-Label And Natural Health Product”
- The opportunity is further strengthened by growing consumer interest in ethical sourcing, sustainable dairy practices, and scientifically supported nutrition products. Companies are investing in advanced processing technologies that preserve the bioactivity of immunoglobulins, lactoferrin, and growth factors while maintaining label transparency and product purity. In parallel, wellness brands are increasingly combining colostrum with probiotics, adaptogens, and other naturally positioned ingredients to meet rising demand for multifunctional health solutions. This evolving preference for natural and recognizable ingredients is encouraging both established nutrition companies and emerging wellness brands to expand their clean-label colostrum portfolios through innovation, premiumization, and strategic market expansion.
- According to NutritionInsight, in November 2025, Kourtney Kardashian Barker’s wellness brand Lemme launched Lemme Colostrum Gummies and Lemme Colostrum Liposomal Liquid formulated with bovine colostrum for gut health, immunity, and beauty support. The launch demonstrated how mainstream wellness brands are integrating naturally derived bioactive ingredients into convenient clean-label supplement formats.
- According to Nutraceutical Business Review, in August 2025, ISOPURE launched Colostrum+ Gut Health & Immune Support, an unflavored powder containing bovine colostrum, prebiotics, vitamins, and minerals formulated without artificial flavors. The launch demonstrated how companies are increasingly developing clean-label colostrum products targeted at gut health, immunity, and holistic wellness consumers across Europe and other developed nutrition markets.
- According to NutraIngredients, in July 2025, Naked Nutrition expanded its presence in the European nutrition market with the launch of Naked Colostrum, a single-ingredient bovine colostrum supplement positioned around transparency, minimal processing, and clean-label nutrition. The company highlighted that the product contains no unnecessary additives and is sustainably sourced, aligning with rising European consumer demand for simple and naturally positioned wellness products.
- Overall, the European colostrum market is increasingly benefiting from the region’s strong shift toward clean-label nutrition, minimally processed supplements, and naturally sourced wellness ingredients. As consumers continue prioritizing transparency, sustainability, and multifunctional health benefits, companies are accelerating product innovation and premium positioning strategies that strengthen the long-term growth potential for colostrum-based health and nutrition products across Europe.
Europe Colostrum Market Dynamics
Driver
Rising Demand For Immune-Support And Gut-Health Nutrition
- The growing emphasis on preventive healthcare and nutritional wellness across Europe is significantly increasing demand for immune-support and gut-health products, particularly those containing colostrum and other bioactive dairy ingredients.
- According to Biochem in May 2024, the company launched ColoImmune, a bovine colostrum-based supplement designed to support immunity and early-life gut health in pets, highlighting the increasing commercialization of colostrum products focused on immune resilience and digestive support.
- According to Nutrition Insight in March 2024, dsm-firmenich announced the launch of Humiome B2 at Vitafoods Europe 2024, a microbiome-targeted nutrition solution developed to improve gut barrier integrity and immune health through advanced colon-delivery technology.
- According to DairyReporter in October 2024, Danone expanded its immunity-focused dairy portfolio with the launch of Actimel+ Triple Action across 20 European countries, combining probiotics, vitamins, and minerals to support gut health and immune function.
- The increasing convergence of digestive wellness, immune health, and functional nutrition is expected to continue strengthening demand for colostrum and related bioactive ingredients across Europe. As consumers increasingly prioritize scientifically supported wellness products, companies are likely to invest further in innovation, product diversification, and microbiome-focused nutritional solutions.
Restraint/Challenge
Strict European Food Safety and Regulatory Requirements
- Strict European food safety and regulatory requirements are playing a central role in shaping the food and beverage industry across the region. The European Union maintains one of the world’s most rigorous regulatory frameworks through institutions such as the European Food Safety Authority and the European Commission, which enforce comprehensive standards covering ingredient approvals, traceability, labeling, pesticide residues, contaminants, food additives, and novel foods.
- According to the Food Standards Agency in April 2025, the Food Standards Agency implemented reforms to accelerate market authorization procedures for regulated food and feed products, including additives and flavorings. The initiative aimed to support innovation in the food sector while preserving stringent scientific risk-assessment and consumer safety standards.
- According to the European Commission in February 2026, the European Union authorized several new novel food ingredients, including defatted rapeseed powder and lacto-N-tetraose produced through biotechnology-derived processes. The approvals highlighted the EU’s continued emphasis on scientific validation, traceability, and strict safety assessments before allowing innovative food ingredients into the European market.
- According to the Council of the European Union in May 2026, the Council adopted new legislation to streamline rules governing biocides while maintaining high standards for food and feed safety, human health, and environmental protection. The regulation extended certain data-protection periods for companies operating in the biocidal products market, reflecting Europe’s effort to balance regulatory efficiency with strict safety oversight.
- Overall, strict European food safety and regulatory requirements continue to shape industry practices by compelling companies to prioritize scientific validation, transparency, and compliance-driven innovation. As authorities refine regulatory frameworks and approve new technologies under rigorous assessment systems, Europe is expected to remain a benchmark market for global food safety standards and sustainable food-system governance.
Europe ColostrumMarket Scope
The colostrum market is segmented into eleven notable segments based on source type, nature, product form, immunoglobulin (IGG) concentration, processing technology, application, end user, distribution channel, packaging type, functionality, and sales model.
- By source type
On the basis of source type, the colostrum market is segmented into bovine colostrum, goat colostrum, buffalo colostrum, sheep colostrum, mixed animal colostrum, and others. In 2026, the Bovine Colostrum segment is expected to dominate the market share 69.03% due to its high immunoglobulin concentration, widespread commercial availability, strong scientific validation, and extensive use across dietary supplements, sports nutrition, infant nutrition, and pharmaceutical applications. Established dairy infrastructure, large-scale bovine milk production, and advanced processing technologies in Europe further support consistent supply and product standardization. In addition, increasing consumer preference for immunity-supporting and protein-rich nutritional products continues to drive demand for bovine-derived colostrum formulations across both healthcare and functional nutrition industries.
The Goat Colostrum segment is projected to grow with a 7.9% CAGR during the forecast period. Growing consumer preference for easily digestible dairy-based nutrition is driving demand for goat colostrum across Europe. Its naturally high bioactive content, lower allergenic potential, and suitability for sensitive consumers are supporting adoption in premium supplements, pediatric nutrition products, immune health formulations, and gut wellness applications.
- By Nature
On the basis of Nature, the colostrum market is segmented into conventional, organic, clean label, grass-fed, hormone-free, others. In 2026, the Conventional segment is anticipated to dominate the market share 46.74% due to its widespread availability, cost-effectiveness, established production infrastructure, and strong presence across mainstream dietary supplement and functional nutrition applications. Conventional colostrum products benefit from higher production volumes, easier sourcing processes, and broader distribution networks compared to premium organic alternatives. In addition, increasing consumer demand for affordable immunity-supporting supplements, combined with strong adoption in sports nutrition, animal nutrition, and pharmaceutical applications, continues to support the dominance of conventional colostrum products across global markets
The Clean Label segment is projected to grow with the 7.6% CAGR during the forecast period The increasing demand for transparent ingredient sourcing and minimally processed nutritional products is accelerating the adoption of clean-label colostrum products. European consumers are actively seeking products free from artificial additives, preservatives, and synthetic ingredients, encouraging manufacturers to develop natural and traceable formulations.
- By product form
On the basis of product form, the colostrum market is segmented into powder, capsules, liquid, tablets, gummies, sachets & stick packs, soft gels, chewable, granules, others. In 2026, the powder segment is expected to dominate the market share 39.77% due to its longer shelf life, ease of storage and transportation, higher formulation stability, and broad applicability across dietary supplements, sports nutrition, infant nutrition, and functional food products. Powdered colostrum also offers better concentration efficiency, flexible dosage customization, and compatibility with advanced processing technologies such as spray drying and freeze drying. In addition, growing demand for convenient nutritional supplements and bulk ingredient applications continues to support the widespread adoption of powdered colostrum products globally.
The gummies segment is projected to grow with the 7.8% CAGR during the forecast period. Gummy-based colostrum supplements are gaining popularity due to their convenience, improved taste, and ease of consumption. Rising demand from children, young adults, and busy consumers seeking alternative supplement formats is encouraging manufacturers to expand colostrum-infused gummy product portfolios across Europe.
- By Immunoglobulin (IGG) Concentration
On the basis of Immunoglobulin (IGG) Concentration, the colostrum Market is segmented into Below 15%, 15%–25%, 25%–35%, 35%–45%, Above 45%, customized igg formulations, and others. In 2026, the Below 15% segment is anticipated to dominate the market share 32.17% due to its cost-effectiveness, wider commercial availability, and extensive usage across mainstream dietary supplements, functional foods, and animal nutrition applications. Products within this concentration range are commonly preferred for large-scale manufacturing because they offer balanced nutritional benefits while maintaining affordable pricing for mass-market consumers. In addition, lower IgG concentration colostrum products are easier to source and process in bulk quantities, supporting strong adoption across nutraceutical companies, food manufacturers, and veterinary nutrition sectors globally.
The customized igg formulations is projected to grow with the 7.8% CAGR during the forecast period Growing interest in targeted immunity solutions is driving demand for customized immunoglobulin (IgG) formulations. Manufacturers are increasingly developing specialized colostrum products with standardized IgG concentrations to address specific health needs such as immune support, digestive wellness, sports recovery, and healthy aging.
- By processing technology
On the basis of processing technology, the colostrum market is segmented into spray drying, freeze drying, pasteurization, membrane filtration, low-temperature processing, microfiltration, defatting, fat separation, nano-filtration, others. In 2026, Spray Drying segment is expected to dominate the market share 30.18% due to its cost efficiency, large-scale production capability, extended product shelf life, and widespread adoption across nutraceutical and functional food manufacturing. Spray drying enables effective moisture removal while preserving essential nutrients and bioactive compounds, making it suitable for commercial colostrum powder production. The technology also supports easier storage, transportation, and formulation flexibility for dietary supplements, sports nutrition, and infant nutrition products. In addition, its faster processing speed and lower operational costs compared to freeze drying continue to strengthen its dominance in the global colostrum market.
The freeze drying segment is projected to grow with the 7.8% CAGR during the forecast period Freeze-drying technology is becoming increasingly important in the Europe colostrum market due to its ability to preserve bioactive compounds, immunoglobulins, and growth factors. The process enhances product stability, nutritional integrity, shelf life, and quality, making it suitable for premium nutraceutical applications.
- By application
On the basis of application, the Colostrum Market is segmented into dietary supplements, sports nutrition, functional food & beverages, infant nutrition, pharmaceuticals, animal nutrition, cosmetics, veterinary applications, others. In 2026, the Dietary Supplements segment is expected to dominate the market share 29.53% due to increasing consumer awareness regarding immunity enhancement, preventive healthcare, digestive wellness, and overall nutritional supplementation. Rising demand for natural and functional ingredients, along with growing adoption of colostrum-based products in daily health routines, continues to support segment growth. Dietary supplements also benefit from broad product availability in powders, capsules, tablets, and gummies, enabling convenient consumption across different age groups. In addition, expanding e-commerce distribution, clean-label trends, and increasing focus on sports recovery and immune health further strengthen the dominance of the dietary supplements segment globally.
The sports nutrition segment is projected to grow with the 7.8% CAGR during the forecast period The expanding sports nutrition industry is creating strong demand for colostrum-based products across Europe. Athletes and fitness enthusiasts increasingly utilize colostrum supplements to support muscle recovery, endurance, immune function, and performance enhancement, contributing to growing product adoption in active lifestyle segments.
- By end use
On the basis of end use, the colostrum market is segmented into food and feed. In 2026, food segment is expected to dominate the market share 72.33% due to increasing consumer demand for functional nutrition, immunity-supporting products, and preventive healthcare solutions across all age groups. Rising adoption of colostrum in dietary supplements, infant nutrition, sports nutrition, and functional food products continues to strengthen segment growth. The food segment also benefits from expanding awareness regarding digestive wellness, healthy aging, and protein-rich nutritional formulations. In addition, broader retail availability, growing clean-label product demand, and increasing incorporation of colostrum into wellness beverages and fortified foods further support the dominance of the food segment in the global colostrum market.
The feed segment is projected to grow with the 7.1% CAGR during the forecast period The use of colostrum in animal feed applications is growing due to increasing focus on livestock health, immunity, and productivity. Farmers and animal nutrition companies are incorporating colostrum-derived ingredients into feed formulations to improve animal growth, disease resistance, and overall herd performance.
- By Distribution Channel
On the basis of distribution channel, the colostrum market is segmented into direct/b2b sales, online retail, pharmacies & medical stores, specialty nutrition stores, health & wellness stores, supermarkets & hypermarkets, veterinary clinics & agri stores, convenience stores, and others. In 2026, Direct/B2b Sales segment is expected to dominate the market share 26.97% due to strong bulk purchasing demand from nutraceutical manufacturers, functional food producers, pharmaceutical companies, and animal nutrition suppliers. Direct sales channels enable large-volume procurement, long-term supply agreements, customized ingredient sourcing, and better pricing efficiencies for industrial buyers. In addition, manufacturers prefer direct partnerships to ensure consistent product quality, traceability, and regulatory compliance. The growing use of colostrum as a functional ingredient across dietary supplements, infant nutrition, sports nutrition, and veterinary applications further supports the dominance of the Direct/B2B Sales segment globally.
The online retail segment is projected to grow with the 7.7% CAGR during the forecast period Rapid expansion of e-commerce platforms is significantly boosting colostrum product sales throughout Europe. Online retail channels provide consumers with convenient access to a wide variety of supplements, product information, competitive pricing, and subscription models, supporting broader market penetration and customer reach.
- By packaging type
on the basis of packaging type, the colostrum market is segmented into bulk packaging, retail packaging, single-serve packaging, others. The bulk packaging segment is further sub segmented into Drums, Bags, and Industrial Containers. In 2026, Bulk Packaging segment is expected to dominate the market share 46.46% due to increasing large-scale procurement by nutraceutical manufacturers, functional food companies, pharmaceutical producers, and animal nutrition suppliers. Bulk packaging offers cost efficiency, easier transportation, reduced packaging waste, and improved storage convenience for industrial buyers handling high-volume production. In addition, growing demand for colostrum powder as a raw functional ingredient across dietary supplements, sports nutrition, and feed applications continues to support higher bulk purchasing volumes. Long-term B2B supply agreements and expanding industrial-scale manufacturing activities further strengthen the dominance of the bulk packaging segment globally.
The single-serve packaging segment is projected to grow with the 7.3% CAGR during the forecast period due Demand for single-serve colostrum products is increasing as consumers prioritize convenience, portability, and precise dosage control. Manufacturers are introducing sachets, stick packs, and ready-to-consume formats that cater to active lifestyles while improving product usability and reducing contamination risks.
- By functionality
On the basis of functionality, the Colostrum Market is segmented into immune enhancement, gut microbiome support, nutritional fortification, muscle recovery, tissue repair & recovery, anti-inflammatory support, disease prevention support, antioxidant support, and others. In 2026, Immune Enhancement segment is expected to dominate the market share 28.50% due to increasing consumer awareness regarding preventive healthcare, immunity strengthening, and natural nutritional supplementation. Colostrum contains high levels of immunoglobulins, lactoferrin, growth factors, and bioactive compounds that support immune system function, making it highly preferred in dietary supplements and functional nutrition products. Rising demand for immunity-supporting formulations following global health concerns, along with growing adoption among sports nutrition users, elderly populations, and pediatric consumers, continues to drive segment growth. In addition, increasing clean-label and wellness-focused consumer trends further strengthen the dominance of the Immune Enhancement segment globally.
The gut microbiome support segment is projected to grow with the 7.8% CAGR during the forecast period Growing awareness of digestive health and microbiome balance is driving interest in colostrum-based gut health solutions. Bioactive compounds present in colostrum support intestinal barrier function, promote beneficial gut bacteria, and contribute to digestive wellness, making it increasingly attractive to health-conscious consumers.
- By sales model
On the basis of sales model, the Colostrum Market is segmented into branded products, ingredient supply, contract manufacturing, private label manufacturing, OEM supply, white label products, and others. In 2026, Branded Products segment is expected to dominate the market share 35.87% due to increasing consumer preference for trusted, quality-certified, and clinically positioned nutritional products. Branded colostrum products benefit from strong marketing strategies, established customer loyalty, premium product positioning, and wider retail availability across pharmacies, online platforms, and specialty nutrition stores. In addition, growing awareness regarding immunity support, gut health, and sports recovery has encouraged consumers to prefer recognized brands offering standardized formulations and transparent sourcing practices. Continuous product innovation, clean-label positioning, and expansion into functional wellness categories further support the dominance of the branded products segment globally.
The private label manufacturing segment is projected to grow with the 7.8% CAGR during the forecast period. Private label manufacturing is expanding within the Europe colostrum market as retailers and wellness brands seek differentiated nutritional offerings. Contract manufacturers provide formulation expertise, production scalability, regulatory compliance, and branding flexibility, enabling companies to rapidly launch colostrum-based products and strengthen market presence.
Europe Colostrum Market Regional Analysis
· Germany dominated the driving Europe colostrum market and accounted for the largest revenue share of 18.60% in 2025 Germany's peracetic acid market benefits from its advanced food processing, pharmaceutical, and healthcare industries.
· Strict environmental and hygiene regulations encourage the use of biodegradable disinfectants. Growing wastewater treatment modernization, increasing pharmaceutical manufacturing activities, and the transition toward sustainable industrial cleaning solutions continue to stimulate market growth nationwide.
France Colostrum Market Insight
France is witnessing increased peracetic acid demand due to stringent food safety standards, expanding dairy and beverage industries, and growing healthcare disinfection requirements. Investments in municipal water treatment infrastructure and environmentally friendly sanitation technologies support market expansion. Rising consumer focus on food quality further strengthens product utilization across sectors.
U.K. Colostrum Market Insight
The UK peracetic acid market is supported by growing healthcare sterilization needs, water reuse initiatives, and stringent food processing regulations. Increasing investments in wastewater treatment facilities and sustainable disinfection technologies enhance demand. Expansion of pharmaceutical manufacturing and heightened emphasis on infection prevention continue to create favorable market opportunities.
Italy Colostrum Market Insight
Italy's peracetic acid market growth is driven by its strong food and beverage manufacturing sector, particularly dairy, wine, and processed foods. Rising demand for environmentally safe disinfectants, stricter hygiene regulations, and increased wastewater treatment activities support adoption. Expanding healthcare infrastructure and pharmaceutical production further contribute to market development.
Colostrum Market Share
The colostrum market is primarily led by well-established companies, including:
- Colbiom SP. ZO (Poland)
- COLOSTRUM BIOTEC (Germany)
- European Colostrum Industry (Belgium)
- LacVital Colostrum (Germany)
- Vitomega Colostrum B.V. (Netherlands)
- COLOSTRUM POLSKA SP. Z O.O. (Poland)
- PEDERSEN BIOTECH A/S (Denmark)
- Goat Specialty Ingredients (Netherlands)
- ZiegenKraft GmbH (Germany)
- SwissBioColostrum AG (Switzerland)
- INGREDIA S.A. (France)
- Colostrum Biotech GmbH (Germany)
- Glanbia Nutritionals (Ireland)
- Biotaris B.V. (Netherlands)
- Bionatin B.V. (Netherlands)
Latest Developments in Europe Colostrum Market
- In 2028, Colostrum Polska recently introduced “Colostrum Nature” in a convenient sachet format to strengthen its bovine colostrum product portfolio and address growing consumer demand for portable immunity-support supplements. The new single-dose packaging is designed for daily use and targets active consumers seeking convenient wellness solutions. Through this development, the company is expanding its presence in the functional nutrition and immune-health segment while enhancing accessibility of its premium bovine colostrum offerings.
- In March 2028, Colostrum BioTec GmbH updated its portal with the ABCERT 24/26 Organic Certification (German version), verifying that its raw milk collection and processing methods comply strictly with European ecological and organic farming standards.
- In 2026, Polish colostrum manufacturer Colbiom highlighted its official certification by DEKRA, an international auditing body. This certification verifies that the company successfully pairs a science-based production approach with highly responsible, traceable sourcing for its powder, supplement, and cosmetic lines.
- In 2025 Biotaris B.V. is using a special cold-state processing technology for colostrum, designed to preserve bioactive components such as immunoglobulins, proteins, vitamins, and growth factors. This method avoids heat treatment to maintain the natural quality of bovine colostrum during production. The company states that its production process involves direct freezing of colostrum after milking and gentle processing without heating, ensuring maximum retention of bioactive substances in the final product.
SKU-

- Interactive Data Analysis Dashboard
- Company Analysis Dashboard for high growth potential opportunities
- Research Analyst Access for customization & queries
- Competitor Analysis with Interactive dashboard
- Latest News, Updates & Trend analysis
- Harness the Power of Benchmark Analysis for Comprehensive Competitor Tracking
Table of Content
1 INTRODUCTION
1.1 OBJECTIVES OF THE STUDY
1.2 MARKET DEFINITION
1.3 OVERVIEW OF COLOSTRUM MARKET
1.4 CURRENCY AND PRICING
1.5 LIMITATIONS
1.6 MARKETS COVERED
2 MARKET SEGMENTATION
2.1 MARKETS COVERED
2.2 GEOGRAPHICAL SCOPE
2.3 YEARS CONSIDERED FOR THE STUDY
2.4 DBMR TRIPOD DATA VALIDATION MODEL
2.5 PRIMARY INTERVIEWS WITH KEY OPINION LEADERS
2.6 DBMR MARKET POSITION GRID
2.7 VENDOR SHARE ANALYSIS
2.8 MULTIVARIATE MODELING
2.9 MARKET END USER COVERAGE GRID
2.1 SECONDARY SOURCES
2.11 ASSUMPTIONS
3 EXECUTIVE SUMMARY
4 PREMIUM INSIGHTS
4.1 PORTER'S FIVE FORCES ANALYSIS
4.2 VALUE CHAIN ANALYSIS
4.2.1 RAW MATERIAL SOURCING AND DAIRY FARM COLLECTION
4.2.2 QUALITY TESTING AND STANDARDIZATION
4.2.3 PROCESSING AND BIOACTIVE PRESERVATION
4.2.4 PRODUCT FORMULATION AND MANUFACTURING
4.2.5 PACKAGING, BRANDING, AND REGULATORY COMPLIANCE
4.2.6 DISTRIBUTION AND SUPPLY CHAIN NETWORKS
4.2.7 END-USE CONSUMPTION AND CLINICAL ADOPTION
4.3 SUPPLY CHAIN ANALYSIS
4.3.1 INTRODUCTION
4.3.2 RAW MATERIAL PROCUREMENT
4.3.3 COLOSTRUM PROCESSING & MANUFACTURING
4.3.4 DISTRIBUTION & LOGISTICS
4.3.5 END-USER CONSUMPTION
4.3.6 CONCLUSION
4.4 RAW MATERIAL COVERAGE
4.4.1 INTRODUCTION
4.4.2 STRATEGIC IMPORTANCE OF RAW MATERIAL QUALITY
4.4.3 RAW MATERIAL CHALLENGES ACROSS EUROPE
4.4.4 STRATEGIC OUTLOOK
4.4.5 CONCLUSION
4.5 VENDOR SELECTION CRITERIA
4.5.1 INTRODUCTION
4.5.2 RAW MATERIAL SOURCING AND COLLECTION STANDARDS
4.5.3 IMMUNOGLOBULIN (IGG) STANDARDIZATION AND BIOACTIVITY PRESERVATION
4.5.4 PROCESSING TECHNOLOGY CAPABILITIES
4.5.5 SUPPLY CHAIN STABILITY AND SCALABILITY
4.5.6 APPLICATION-SPECIFIC CUSTOMIZATION CAPABILITIES
4.5.7 CONCLUSION
4.6 BRAND OUTLOOK
4.6.1 INTRODUCTION
4.6.2 CONCLUSION
4.7 CONSUMER BUYING BEHAVIOR
4.7.1 INTRODUCTION
4.7.2 CONSUMER BUYING BEHAVIOUR ANALYSIS
4.7.3 CONCLUSION
4.8 CLIMATE CHANGE SCENARIO
4.8.1 INTRODUCTION
4.8.2 ENVIRONMENTAL CONCERNS
4.8.3 INDUSTRY RESPONSE
4.8.4 GOVERNMENT’S ROLE
4.8.5 ANALYST RECOMMENDATIONS
4.8.6 CONCLUSION
4.9 PRICING ANALYSIS
5 IMPACT OF WAR ON SUPPLY CHAIN, GEOGRAPHIC FOOTPRINT & STRUCTURAL SHIFTS AND ADAPTIVE STRATEGIES
5.1 INTRODUCTION
5.2 SUPPLY CHAIN RESILIENCE
5.2.1 STRATEGIC DECISIONS
5.2.1.1 DIVERSIFICATION OF RAW MATERIAL AND COMPONENT SOURCING ACROSS MULTIPLE GEOGRAPHIC REGIONS
5.2.1.2 REDUCTION OF DEPENDENCY ON SINGLE-COUNTRY SUPPLIERS FOR CRITICAL INPUTS AND COMMODITIES
5.2.1.3 STRATEGIC PARTNERSHIPS WITH REGIONAL AND GLOBAL SUPPLIERS TO ENSURE STABLE SUPPLY CONTINUITY
5.2.1.4 DEVELOPMENT OF ALTERNATIVE LOGISTICS ROUTES AND TRANSPORTATION CORRIDORS TO MITIGATE SHIPPING DISRUPTIONS
5.2.1.5 EXPANSION OF REGIONAL MANUFACTURING, PROCESSING, AND STORAGE FACILITIES TO STRENGTHEN SUPPLY SECURITY
5.2.1.6 STRENGTHENING SUPPLIER NETWORKS AND INCREASING SAFETY STOCK LEVELS FOR CRITICAL INPUTS
5.3 ENERGY & OPERATIONAL COST RISK
5.3.1 STRATEGIC DECISIONS
5.3.1.1 VOLATILITY IN FUEL, ELECTRICITY, AND NATURAL GAS PRICES IMPACTING PRODUCTION AND PROCESSING COSTS
5.3.1.2 INCREASED OPERATIONAL EXPENSES FOR ENERGY-INTENSIVE MANUFACTURING AND INDUSTRIAL OPERATIONS
5.3.1.3 LONG-TERM ENERGY PROCUREMENT AGREEMENTS TO STABILIZE PRODUCTION AND OPERATIONAL COSTS
5.3.1.4 OPTIMIZATION OF PRODUCTION PROCESSES TO REDUCE ENERGY CONSUMPTION AND IMPROVE EFFICIENCY
5.3.1.5 INVESTMENT IN ENERGY-EFFICIENT TECHNOLOGIES, EQUIPMENT, AND PROCESS IMPROVEMENTS
5.3.1.6 INTEGRATION OF RENEWABLE AND ALTERNATIVE ENERGY SOURCES INTO INDUSTRIAL OPERATIONS
5.4 GEOGRAPHIC FOOTPRINT REASSESSMENT
5.4.1 STRATEGIC DECISIONS
5.4.1.1 EXPANSION OF PRODUCTION AND MANUFACTURING FACILITIES IN POLITICALLY STABLE REGIONS
5.4.1.2 RELOCATION OF MANUFACTURING CLOSER TO RAW MATERIAL SOURCES AND KEY END-USE MARKETS
5.4.1.3 DIVERSIFICATION OF GLOBAL PRODUCTION HUBS ACROSS ASIA-PACIFIC, NORTH AMERICA, EUROPE, AND THE MIDDLE EAST
5.4.1.4 DEVELOPMENT OF REGIONAL SUPPLY AND DISTRIBUTION HUBS TO REDUCE CROSS-BORDER DEPENDENCY
5.4.1.5 ADOPTION OF DECENTRALIZED MANUFACTURING STRATEGIES TO REDUCE GEOPOLITICAL AND TRADE RISKS
5.5 SCENARIO PLANNING & RISK MANAGEMENT
5.5.1 STRATEGIC DECISIONS
5.5.1.1 CREATION OF STRATEGIC RESERVES FOR CRITICAL RAW MATERIALS, COMMODITIES, AND INDUSTRIAL INPUTS
5.5.1.2 IMPLEMENTATION OF REAL-TIME SUPPLY CHAIN MONITORING AND RISK ASSESSMENT SYSTEMS
5.5.1.3 MULTI-SOURCE PROCUREMENT STRATEGIES FOR KEY PRODUCTION INPUTS AND MATERIALS
5.5.1.4 DEVELOPMENT OF CONTINGENCY LOGISTICS PLANS TO ADDRESS TRANSPORTATION AND TRADE DISRUPTIONS
5.5.1.5 STRENGTHENING REGULATORY COMPLIANCE, SAFETY PROTOCOLS, AND OPERATIONAL RISK MANAGEMENT FRAMEWORKS
5.6 CASH & FINANCIAL PROTECTION
5.6.1 STRATEGIC DECISIONS
5.6.1.1 HEDGING STRATEGIES TO MITIGATE VOLATILITY IN COMMODITY, RAW MATERIAL, AND ENERGY PRICES
5.6.1.2 DIVERSIFICATION OF REVENUE STREAMS ACROSS MULTIPLE MARKETS AND END-USE INDUSTRIES
5.6.1.3 COST OPTIMIZATION THROUGH AUTOMATION, OPERATIONAL EFFICIENCY, AND DIGITALIZATION INITIATIVES
5.6.1.4 LONG-TERM SUPPLY AGREEMENTS WITH KEY CUSTOMERS AND STRATEGIC PARTNERS
5.6.1.5 IMPROVED WORKING CAPITAL MANAGEMENT AND INVENTORY OPTIMIZATION STRATEGIES
5.7 TECHNOLOGY ADOPTION & INDUSTRIAL AUTOMATION
5.7.1 STRATEGIC DECISIONS
5.7.1.1 ADOPTION OF AUTOMATION TECHNOLOGIES TO IMPROVE EFFICIENCY IN MANUFACTURING, PROCESSING, AND PRODUCTION OPERATIONS
5.7.1.2 INTEGRATION OF SMART MANUFACTURING SYSTEMS AND INDUSTRIAL IOT (IIOT) FOR REAL-TIME MONITORING AND OPERATIONAL CONTROL
5.7.1.3 IMPLEMENTATION OF ADVANCED PROCESS CONTROL SYSTEMS TO ENHANCE PRODUCTIVITY AND REDUCE DOWNTIME
5.7.1.4 DEPLOYMENT OF ROBOTICS AND AUTOMATED HANDLING SYSTEMS IN MANUFACTURING PLANTS, WAREHOUSES, AND DISTRIBUTION CENTERS
5.7.1.5 INVESTMENT IN PREDICTIVE MAINTENANCE TECHNOLOGIES TO IMPROVE EQUIPMENT RELIABILITY AND REDUCE OPERATIONAL DISRUPTIONS
5.7.1.6 DIGITAL INTEGRATION OF SUPPLY CHAIN, PRODUCTION, AND LOGISTICS OPERATIONS THROUGH CENTRALIZED MANAGEMENT PLATFORMS
5.7.1.7 IMPLEMENTATION OF DIGITAL TWIN TECHNOLOGIES TO SIMULATE PRODUCTION PROCESSES AND OPTIMIZE OPERATIONAL PERFORMANCE
5.7.1.8 ADOPTION OF AI-DRIVEN QUALITY CONTROL AND INSPECTION SYSTEMS TO IMPROVE PRODUCT CONSISTENCY AND REDUCE DEFECTS
5.7.1.9 INTEGRATION OF AUTOMATED WAREHOUSE MANAGEMENT AND SMART LOGISTICS SYSTEMS TO ENHANCE DISTRIBUTION EFFICIENCY
5.8 NEW BUSINESS & EMERGING REVENUE OPPORTUNITIES & FUTURE OUTLOOK
5.8.1 GROWTH IN REGIONAL MANUFACTURING ECOSYSTEMS AND LOCALIZED SUPPLY CHAINS
5.8.2 EXPANSION OF SUSTAINABLE AND LOW-CARBON PRODUCTION TECHNOLOGIES
5.8.3 RISING DEMAND FOR RESOURCE-EFFICIENT PRODUCTS, MATERIALS, AND INDUSTRIAL SOLUTIONS
5.8.4 INCREASED INVESTMENT IN RECYCLING TECHNOLOGIES AND CIRCULAR ECONOMY INITIATIVES
5.8.5 DEVELOPMENT OF ALTERNATIVE RAW MATERIALS AND NEXT-GENERATION INDUSTRIAL PRODUCTS
5.8.6 GROWING DEMAND DRIVEN BY INFRASTRUCTURE DEVELOPMENT, ENERGY TRANSITION, AND INDUSTRIAL MODERNIZATION
5.9 CONCLUSION
6 LIST OF BUYERS
6.1 LIST OF FOOD BUYERS
6.2 POTENTIAL BUYERS OF COLOSTRUM FOR FEED PREPARATION IN EUROPE
7 INNOVATION TRACKER AND STRATEGIC ANALYSIS
7.1 INTRODUCTION
7.2 MAJOR DEALS AND STRATEGIC ALLIANCES ANALYSIS
7.2.1 JOINT VENTURES
7.2.2 MERGERS AND ACQUISITIONS
7.2.3 LICENSING AND PARTNERSHIP
7.2.4 TECHNOLOGY COLLABORATIONS
7.2.5 STRATEGIC DIVESTMENTS
7.3 NUMBER OF PRODUCTS IN DEVELOPMENT
7.4 STAGE OF DEVELOPMENT
7.5 TIMELINES AND MILESTONES
7.6 INNOVATION STRATEGIES AND METHODOLOGIES
7.7 RISK ASSESSMENT AND MITIGATION
7.8 FUTURE OUTLOOK
7.9 CONCLUSION
8 TARIFFS
8.1 CURRENT TARIFF RATES IN TOP-5 COUNTRY MARKETS
8.2 OUTLOOK: LOCAL PRODUCTION VS IMPORT RELIANCE
8.3 VENDOR SELECTION CRITERIA DYNAMICS
8.4 IMPACT ON SUPPLY CHAIN
8.4.1 RAW MATERIAL PROCUREMENT
8.4.2 MANUFACTURING AND PRODUCTION
8.4.3 LOGISTICS AND DISTRIBUTION
8.4.4 PRICE PITCHING AND POSITION OF MARKET
8.5 INDUSTRY PARTICIPANTS: PROACTIVE MOVES
8.5.1 SUPPLY CHAIN OPTIMIZATION
8.5.2 JOINT VENTURE ESTABLISHMENTS
8.6 IMPACT ON PRICES
8.7 REGULATORY INCLINATION
8.7.1 GEOPOLITICAL SITUATION
8.7.2 TRADE PARTNERSHIPS BETWEEN THE COUNTRIES
9 REGULATON COVERAGE
9.1 PRODUCT CODES
9.2 CERTIFIED STANDARDS
9.3 SAFETY STANDARDS
9.3.1 MATERIAL HANDLING & STORAGE
9.3.2 TRANSPORT & PRECAUTIONS
9.3.3 HAZARD IDENTIFICATION
10 MARKET OVERVIEW
10.1 DRIVER
10.1.1 RISING DEMAND FOR IMMUNE-SUPPORT AND GUT-HEALTH NUTRITION
10.1.2 GROWTH IN SPORTS NUTRITION AND ACTIVE LIFESTYLE PRODUCTS
10.1.3 EXPANSION OF PREMIUM INFANT AND ADULT NUTRITION MARKETS
10.2 RESTRAINTS
10.2.1 STRICT EUROPEAN FOOD SAFETY AND REGULATORY REQUIREMENTS
10.2.2 LIMITED RAW MATERIAL AVAILABILITY AND SEASONAL SUPPLY CONSTRAINTS
10.3 OPPORTUNITIES
10.3.1 INCREASING CONSUMER PREFERENCE FOR NUTRITION SUPPLEMENT AND ACTIVE LIFESTYLE DIET PRODUCTS
10.3.2 INCLINATION TOWARDS CLEAN-LABEL AND NATURAL HEALTH PRODUCT
10.3.3 DEVELOPMENT OF SPECIALIZED MEDICAL AND ELDERLY NUTRITION PRODUCTS
10.4 CHALLENGES
10.4.1 MAINTAINING BIOACTIVE STABILITY DURING PROCESSING AND STORAGE
10.4.2 CONSUMER SKEPTICISM REGARDING EFFICACY AND ETHICAL SOURCING
11 EUROPE COLOSTRUM MARKET, BY SOURCE TYPE
11.1 OVERVIEW
11.2 EUROPE COLOSTRUM MARKET, BY SOURCE TYPE, 2018-2033 (USD THOUSAND)
11.2.1 BOVINE COLOSTRUM
11.2.2 GOAT COLOSTRUM
11.2.3 BUFFALO COLOSTRUM
11.2.4 SHEEP COLOSTRUM
11.2.5 MIXED ANIMAL COLOSTRUM
11.2.6 OTHERS
11.3 EUROPE COLOSTRUM MARKET, BY SOURCE TYPE, 2018-2033 (TONS)
11.3.1 BOVINE COLOSTRUM
11.3.2 GOAT COLOSTRUM
11.3.3 BUFFALO COLOSTRUM
11.3.4 SHEEP COLOSTRUM
11.3.5 MIXED ANIMAL COLOSTRUM
11.3.6 OTHERS
11.4 EUROPE BOVINE COLOSTRUM IN COLOSTRUM MARKET, BY TYPE, 2018-2033 (USD THOUSAND)
11.4.1 COW COLOSTRUM
11.4.2 ORGANIC BOVINE COLOSTRUM
11.4.3 GRASS-FED BOVINE COLOSTRUM
11.5 EUROPE COW COLOSTRUM IN COLOSTRUM MARKET, BY TYPE, 2018-2033 (USD THOUSAND)
11.5.1 FIRST MILKING COLOSTRUM
11.5.2 HIGH-IGG COLOSTRUM
11.5.3 STANDARDIZED COLOSTRUM
11.5.4 SECOND MILKING COLOSTRUM
12 EUROPE COLOSTRUM MARKET, BY NATURE
12.1 OVERVIEW
12.2 EUROPE COLOSTRUM MARKET, BY NATURE, 2018-2033 (USD THOUSAND)
12.2.1 CONVENTIONAL
12.2.2 ORGANIC
12.2.3 CLEAN LABEL
12.2.4 GRASS-FED
12.2.5 HORMONE-FREE
12.2.6 OTHERS
12.3 EUROPE COLOSTRUM MARKET, BY NATURE, 2018-2033 (TONS)
12.3.1 CONVENTIONAL
12.3.2 ORGANIC
12.3.3 CLEAN LABEL
12.3.4 GRASS-FED
12.3.5 HORMONE-FREE
12.3.6 OTHERS
12.4 EUROPE ORGANIC IN COLOSTRUM MARKET, BY TYPE, 2018-2033 (USD THOUSAND)
12.4.1 CERTIFIED ORGANIC
12.4.2 NON-GMO ORGANIC
12.4.3 ANTIBIOTIC-FREE ORGANIC
13 EUROPE COLOSTRUM MARKET, BY PRODUCT FORM
13.1 OVERVIEW
13.2 EUROPE COLOSTRUM MARKET, BY PRODUCT FORM, 2018-2033 (USD THOUSAND)
13.2.1 POWDER
13.2.2 CAPSULES
13.2.3 LIQUID
13.2.4 TABLETS
13.2.5 GUMMIES
13.2.6 SACHETS & STICK PACKS
13.2.7 SOFT GELS
13.2.8 CHEWABLES
13.2.9 GRANULES
13.2.10 OTHERS
13.3 EUROPE COLOSTRUM MARKET, BY PRODUCT FORM, 2018-2033 (TONS)
13.3.1 POWDER
13.3.2 CAPSULES
13.3.3 LIQUID
13.3.4 TABLETS
13.3.5 GUMMIES
13.3.6 SACHETS & STICK PACKS
13.3.7 SOFT GELS
13.3.8 CHEWABLES
13.3.9 GRANULES
13.3.10 OTHERS
13.4 EUROPE POWDER IN COLOSTRUM MARKET, BY TYPE, 2018-2033 (USD THOUSAND)
13.4.1 SPRAY-DRIED POWDER
13.4.2 WHOLE COLOSTRUM POWDER
13.4.3 INSTANTIZED POWDER
13.4.4 FREEZE-DRIED POWDER
13.4.5 SKIMMED COLOSTRUM POWDER
13.5 EUROPE LIQUID IN COLOSTRUM MARKET, BY TYPE, 2018-2033 (USD THOUSAND)
13.5.1 FROZEN LIQUID COLOSTRUM
13.5.2 CONCENTRATED LIQUID
13.5.3 READY-TO-DRINK LIQUID
14 EUROPE COLOSTRUM MARKET, BY IMMUNOGLOBULIN (IGG) CONCENTRATION
14.1 OVERVIEW
14.2 EUROPE COLOSTRUM MARKET, BY IMMUNOGLOBULIN (IGG) CONCENTRATION, 2018-2033 (USD THOUSAND)
14.2.1 BELOW 15%
14.2.2 15%–25%
14.2.3 25%–35%
14.2.4 35%–45%
14.2.5 ABOVE 45%
14.2.6 CUSTOMIZED IGG FORMULATIONS
14.2.7 OTHERS
14.3 EUROPE COLOSTRUM MARKET, BY IMMUNOGLOBULIN (IGG) CONCENTRATION, 2018-2033 (TONS)
14.3.1 BELOW 15%
14.3.2 15%–25%
14.3.3 25%–35%
14.3.4 35%–45%
14.3.5 ABOVE 45%
14.3.6 CUSTOMIZED IGG FORMULATIONS
14.3.7 OTHERS
15 EUROPE COLOSTRUM MARKET, BY PROCESSING TECHNOLOGY
15.1 OVERVIEW
15.2 EUROPE COLOSTRUM MARKET, BY PROCESSING TECHNOLOGY, 2018-2033 (USD THOUSAND)
15.2.1 SPRAY DRYING
15.2.2 FREEZE DRYING
15.2.3 PASTEURIZATION
15.2.4 MEMBRANE FILTRATION
15.2.5 LOW-TEMPERATURE PROCESSING
15.2.6 MICROFILTRATION
15.2.7 DEFATTING
15.2.8 FAT SEPARATION
15.2.9 NANO-FILTRATION
15.2.10 OTHERS
15.3 EUROPE COLOSTRUM MARKET, BY PROCESSING TECHNOLOGY, 2018-2033 (TONS)
15.3.1 SPRAY DRYING
15.3.2 FREEZE DRYING
15.3.3 PASTEURIZATION
15.3.4 MEMBRANE FILTRATION
15.3.5 LOW-TEMPERATURE PROCESSING
15.3.6 MICROFILTRATION
15.3.7 DEFATTING
15.3.8 FAT SEPARATION
15.3.9 NANO-FILTRATION
15.3.10 OTHERS
16 EUROPE COLOSTRUM MARKET, BY APPLICATION
16.1 OVERVIEW
16.2 EUROPE COLOSTRUM MARKET, BY APPLICATION, 2018-2033 (USD THOUSAND)
16.2.1 DIETARY SUPPLEMENTS
16.2.2 SPORTS NUTRITION
16.2.3 FUNCTIONAL FOOD & BEVERAGES
16.2.4 INFANT NUTRITION
16.2.5 PHARMACEUTICALS
16.2.6 ANIMAL NUTRITION
16.2.7 COSMETICS & PERSONAL CARE
16.2.8 VETERINARY APPLICATIONS
16.2.9 OTHERS
16.3 EUROPE COLOSTRUM MARKET, BY APPLICATION, 2018-2033 (TONS)
16.3.1 DIETARY SUPPLEMENTS
16.3.2 SPORTS NUTRITION
16.3.3 FUNCTIONAL FOOD & BEVERAGES
16.3.4 INFANT NUTRITION
16.3.5 PHARMACEUTICALS
16.3.6 ANIMAL NUTRITION
16.3.7 COSMETICS & PERSONAL CARE
16.3.8 VETERINARY APPLICATIONS
16.3.9 OTHERS
16.4 EUROPE DIETARY SUPPLEMENTS IN COLOSTRUM MARKET, BY TYPE, 2018-2033 (USD THOUSAND)
16.4.1 IMMUNITY SUPPORT
16.4.2 GUT HEALTH
16.4.3 DIGESTIVE WELLNESS
16.4.4 HEALTHY AGING
16.4.5 BONE & JOINT HEALTH
16.4.6 PEDIATRIC NUTRITION
16.4.7 WOMEN’S HEALTH
16.4.8 OTHERS
16.5 EUROPE SPORTS NUTRITION IN COLOSTRUM MARKET, BY TYPE, 2018-2033 (USD THOUSAND)
16.5.1 MUSCLE RECOVERY
16.5.2 ENDURANCE NUTRITION
16.5.3 PERFORMANCE ENHANCEMENT
16.5.4 OTHERS
16.6 EUROPE FUNCTIONAL FOOD & BEVERAGES IN COLOSTRUM MARKET, BY TYPE, 2018-2033 (USD THOUSAND)
16.6.1 FUNCTIONAL DAIRY
16.6.2 PROTEIN DRINKS
16.6.3 WELLNESS BEVERAGES
16.6.4 FORTIFIED FOODS
16.6.5 OTHERS
16.7 EUROPE INFANT NUTRITION IN COLOSTRUM MARKET, BY TYPE, 2018-2033 (USD THOUSAND)
16.7.1 INFANT FORMULA
16.7.2 BABY NUTRITION ADDITIVES
16.7.3 OTHERS
16.8 EUROPE PHARMACEUTICALS IN COLOSTRUM MARKET, BY TYPE, 2018-2033 (USD THOUSAND)
16.8.1 IMMUNE THERAPY
16.8.2 GASTROINTESTINAL HEALTH
16.8.3 CLINICAL NUTRITION
16.8.4 OTHERS
16.9 EUROPE ANIMAL NUTRITION IN COLOSTRUM MARKET, BY TYPE, 2018-2033 (USD THOUSAND)
16.9.1 CALF NUTRITION
16.9.2 PIGLET FEED
16.9.3 POULTRY FEED
16.9.4 PET NUTRITION
16.9.5 AQUACULTURE FEED
16.9.6 OTHERS
16.1 EUROPE COSMETICS & PERSONAL CARE IN COLOSTRUM MARKET, BY TYPE, 2018-2033 (USD THOUSAND)
16.10.1 ANTI-AGING PRODUCTS
16.10.2 SKIN REPAIR PRODUCTS
16.10.3 HAIR CARE PRODUCTS
16.10.4 OTHERS
17 EUROPE COLOSTRUM MARKET, BY END USER
17.1 OVERVIEW
17.2 EUROPE COLOSTRUM MARKET, BY END USER, 2018-2033 (USD THOUSAND)
17.2.1 FOOD
17.2.2 FEED
17.3 EUROPE COLOSTRUM MARKET, BY END USER, 2018-2033 (TONS)
17.3.1 FOOD
17.3.2 FEED
17.4 EUROPE FOOD IN COLOSTRUM MARKET, BY TYPE, 2018-2033 (USD THOUSAND)
17.4.1 ADULT SEGMENT
17.4.2 INFANT & PEDIATRIC SEGMENT
17.4.3 ELDERLY / GERIATRIC SEGMENT
17.4.4 NUTRACEUTICAL & INDUSTRIAL BUYERS
17.4.5 PHARMACEUTICAL & CLINICAL INSTITUTIONS
17.4.6 FOODSERVICE & INSTITUTIONAL USERS
17.4.7 OTHERS
17.5 EUROPE ADULT SEGMENT IN COLOSTRUM MARKET, BY TYPE, 2018-2033 (USD THOUSAND)
17.5.1 HEALTH-CONSCIOUS CONSUMERS
17.5.2 FITNESS & SPORTS CONSUMERS
17.5.3 LIFESTYLE SEGMENTS
17.5.4 CLINICAL & MEDICAL NUTRITION USERS
17.6 EUROPE INFANT & PEDIATRIC SEGMENT IN COLOSTRUM MARKET, BY TYPE, 2018-2033 (USD THOUSAND)
17.6.1 INFANTS (6–12 MONTHS)
17.6.2 TODDLERS (1–3 YEARS)
17.6.3 NEWBORN INFANTS (0–6 MONTHS)
17.6.4 EARLY CHILDHOOD (3–6 YEARS)
17.6.5 SCHOOL-AGE CHILDREN (6–12 YEARS)
17.6.6 OTHERS
17.7 EUROPE ELDERLY / GERIATRIC SEGMENT IN COLOSTRUM MARKET, BY TYPE, 2018-2033 (USD THOUSAND)
17.7.1 60–70 YEARS (ACTIVE ELDERLY)
17.7.2 AGE-RELATED IMMUNE DECLINE POPULATION
17.7.3 70–80 YEARS (MODERATE DEPENDENCY)
17.7.4 80+ YEARS (HIGH DEPENDENCY / FRAIL ELDERLY)
17.8 EUROPE FEED IN COLOSTRUM MARKET, BY TYPE, 2018-2033 (USD THOUSAND)
17.8.1 LIVESTOCK PRODUCERS
17.8.2 COMPANION ANIMAL OWNERS
17.8.3 EQUINE & PERFORMANCE ANIMAL SEGMENT
17.8.4 VETERINARY & CLINICAL ANIMAL CARE USERS
17.8.5 OTHERS
17.9 EUROPE LIVESTOCK PRODUCERS IN COLOSTRUM MARKET, BY TYPE, 2018-2033 (USD THOUSAND)
17.9.1 DAIRY INDUSTRY
17.9.2 BEEF CATTLE OPERATIONS
17.9.3 SHEEP & GOAT FARMING
17.9.4 PIG FARMING SEGMENT
17.9.5 POULTRY INDUSTRY
17.9.6 OTHERS
17.1 EUROPE COMPANION ANIMAL OWNERS IN COLOSTRUM MARKET, BY TYPE, 2018-2033 (USD THOUSAND)
17.10.1 DOG OWNERS
17.10.2 CAT OWNERS
17.10.3 OTHERS
17.11 EUROPE EQUINE & PERFORMANCE ANIMAL SEGMENT IN COLOSTRUM MARKET, BY TYPE, 2018-2033 (USD THOUSAND)
17.11.1 HORSE BREEDERS (FOALS)
17.11.2 RACING HORSE TRAINERS
17.11.3 SPORT HORSES
17.11.4 OTHERS
17.12 EUROPE VETERINARY & CLINICAL ANIMAL CARE USERS IN COLOSTRUM MARKET, BY TYPE, 2018-2033 (USD THOUSAND)
17.12.1 VETERINARY CLINICS
17.12.2 ANIMAL HOSPITALS
17.12.3 LIVESTOCK DISEASE PREVENTION PROGRAMS
17.12.4 OTHERS
18 EUROPE COLOSTRUM MARKET, BY DISTRIBUTION CHANNEL
18.1 OVERVIEW
18.2 EUROPE COLOSTRUM MARKET, BY DISTRIBUTION CHANNEL, 2018-2033 (USD THOUSAND)
18.2.1 DIRECT/B2B SALES
18.2.2 ONLINE RETAIL
18.2.3 PHARMACIES & MEDICAL STORES
18.2.4 SPECIALTY NUTRITION STORES
18.2.5 HEALTH & WELLNESS STORES
18.2.6 SUPERMARKETS & HYPERMARKETS
18.2.7 VETERINARY CLINICS & AGRI STORES
18.2.8 CONVENIENCE STORES
18.2.9 OTHERS
18.3 EUROPE COLOSTRUM MARKET, BY DISTRIBUTION CHANNEL, 2018-2033 (TONS)
18.3.1 DIRECT/B2B SALES
18.3.2 ONLINE RETAIL
18.3.3 PHARMACIES & MEDICAL STORES
18.3.4 SPECIALTY NUTRITION STORES
18.3.5 HEALTH & WELLNESS STORES
18.3.6 SUPERMARKETS & HYPERMARKETS
18.3.7 VETERINARY CLINICS & AGRI STORES
18.3.8 CONVENIENCE STORES
18.3.9 OTHERS
18.4 EUROPE DIRECT/B2B SALES IN COLOSTRUM MARKET, BY TYPE, 2018-2033 (USD THOUSAND)
18.4.1 NUTRACEUTICAL COMPANIES
18.4.2 INGREDIENT SUPPLIERS
18.4.3 CONTRACT MANUFACTURERS
18.4.4 OTHERS
18.5 EUROPE ONLINE RETAIL IN COLOSTRUM MARKET, BY TYPE, 2018-2033 (USD THOUSAND)
18.5.1 E-COMMERCE PLATFORMS
18.5.2 COMPANY WEBSITES
18.5.3 OTHERS
19 EUROPE COLOSTRUM MARKET, BY PACKAGING TYPE
19.1 OVERVIEW
19.2 EUROPE COLOSTRUM MARKET, BY PACKAGING TYPE, 2018-2033 (USD THOUSAND)
19.2.1 BULK PACKAGING
19.2.2 RETAIL PACKAGING
19.2.3 SINGLE-SERVE PACKAGING
19.2.4 OTHERS
19.3 EUROPE COLOSTRUM MARKET, BY PACKAGING TYPE, 2018-2033 (TONS)
19.3.1 BULK PACKAGING
19.3.2 RETAIL PACKAGING
19.3.3 SINGLE-SERVE PACKAGING
19.3.4 OTHERS
19.4 EUROPE BULK PACKAGING IN COLOSTRUM MARKET, BY TYPE, 2018-2033 (USD THOUSAND)
19.4.1 DRUMS
19.4.2 BAGS
19.4.3 INDUSTRIAL CONTAINERS
19.5 EUROPE RETAIL PACKAGING IN COLOSTRUM MARKET, BY TYPE, 2018-2033 (USD THOUSAND)
19.5.1 BOTTLES
19.5.2 JARS
19.5.3 SACHETS
19.5.4 POUCHES
19.5.5 BLISTERS
20 EUROPE COLOSTRUM MARKET, BY FUNCTIONALITY
20.1 OVERVIEW
20.2 EUROPE COLOSTRUM MARKET, BY FUNCTIONALITY, 2018-2033 (USD THOUSAND)
20.2.1 IMMUNE ENHANCEMENT
20.2.2 GUT MICROBIOME SUPPORT
20.2.3 NUTRITIONAL FORTIFICATION
20.2.4 MUSCLE RECOVERY
20.2.5 TISSUE REPAIR & RECOVERY
20.2.6 ANTI-INFLAMMATORY SUPPORT
20.2.7 DISEASE PREVENTION SUPPORT
20.2.8 ANTIOXIDANT SUPPORT
20.2.9 OTHERS
20.3 EUROPE COLOSTRUM MARKET, BY FUNCTIONALITY, 2018-2033 (TONS)
20.3.1 IMMUNE ENHANCEMENT
20.3.2 GUT MICROBIOME SUPPORT
20.3.3 NUTRITIONAL FORTIFICATION
20.3.4 MUSCLE RECOVERY
20.3.5 TISSUE REPAIR & RECOVERY
20.3.6 ANTI-INFLAMMATORY SUPPORT
20.3.7 DISEASE PREVENTION SUPPORT
20.3.8 ANTIOXIDANT SUPPORT
20.3.9 OTHERS
21 EUROPE COLOSTRUM MARKET, BY SALES MODEL
21.1 OVERVIEW
21.2 EUROPE COLOSTRUM MARKET, BY SALES MODEL, 2018-2033 (USD THOUSAND)
21.2.1 BRANDED PRODUCTS
21.2.2 INGREDIENT SUPPLY
21.2.3 CONTRACT MANUFACTURING
21.2.4 PRIVATE LABEL MANUFACTURING
21.2.5 OEM SUPPLY
21.2.6 WHITE LABEL PRODUCTS
21.2.7 OTHERS
21.3 EUROPE COLOSTRUM MARKET, BY SALES MODEL, 2018-2033 (TONS)
21.3.1 BRANDED PRODUCTS
21.3.2 INGREDIENT SUPPLY
21.3.3 CONTRACT MANUFACTURING
21.3.4 PRIVATE LABEL MANUFACTURING
21.3.5 OEM SUPPLY
21.3.6 WHITE LABEL PRODUCTS
21.3.7 OTHERS
22 EUROPE COLOSTRUM MARKET BY COUNTRIES
22.1 EUROPE
22.1.1 GERMANY
22.1.2 U.K.
22.1.3 FRANCE
22.1.4 ITALY
22.1.5 NETHERLANDS
22.1.6 SPAIN
22.1.7 RUSSIA
22.1.8 SWITZERLAND
22.1.9 SWEDEN
22.1.10 DENMARK
22.1.11 BELGIUM
22.1.12 TURKEY
22.1.13 NORWAY
22.1.14 FINLAND
22.1.15 REST OF EUROPE
23 EUROPE COLOSTRUM MARKET
23.1 COMPANY SHARE ANALYSIS: EUROPE
24 SWOT ANALYSIS
25 COMPANY PROFILES
25.1 COLOSTRUM BIOTEC GMBH
25.1.1 COMPANY SNAPSHOT
25.1.2 PRODUCT PORTFOLIO
25.1.3 RECENT UPDATES
25.2 INGREDIA S.A.
25.2.1 COMPANY SNAPSHOT
25.2.2 PRODUCT PORTFOLIO
25.2.3 RECENT DEVELOPMENT
25.3 BIONATIN B.V.
25.3.1 COMPANY SNAPSHOT
25.3.2 PRODUCT PORTFOLIO
25.3.3 RECENT DEVELOPMENT
25.4 BIOTARIS B.V.
25.4.1 COMPANY SNAPSHOT
25.4.2 PRODUCT PORTFOLIO
25.4.3 RECENT DEVELOPMENT
25.5 COLOSTRUM POLSKA SP. Z O. O.
25.5.1 COMPANY SNAPSHOT
25.5.2 PRODUCT PORTFOLIO
25.5.3 RECENT DEVELOPMENT
25.6 ARMACURA (PART OF COLOSTRUM BIOTEC GMBH)
25.6.1 COMPANY SNAPSHOT
25.6.2 PRODUCT PORTFOLIO
25.6.3 RECENT DEVELOPMENT
25.7 COLBIOM SP. Z O.O.
25.7.1 COMPANY SNAPSHOT
25.7.2 PRODUCT PORTFOLIO
25.7.3 RECENT UPDATES
25.8 EUROPEAN COLOSTRUM INDUSTRY
25.8.1 COMPANY SNAPSHOT
25.8.2 PRODUCT PORTFOLIO
25.8.3 RECENT DEVELOPMENT
25.9 GLANBIA PLC
25.9.1 COMPANY SNAPSHOT
25.9.2 REVENUE ANALYSIS
25.9.3 PRODUCT PORTFOLIO
25.9.4 RECENT DEVELOPMENT
25.1 GOAT SPECIALTY INGREDIENTS
25.10.1 COMPANY SNAPSHOT
25.10.2 PRODUCT PORTFOLIO
25.10.3 RECENT DEVELOPMENT
25.11 LACVITAL COLOSTRUM
25.11.1 COMPANY SNAPSHOT
25.11.2 PRODUCT PORTFOLIO
25.11.3 RECENT DEVELOPMENT
25.12 PEDERSEN BIOTECH
25.12.1 COMPANY SNAPSHOTS
25.12.2 PRODUCT PORTFOLIO
25.12.3 RECENT DEVELOPMENT
25.13 SWISSBIOCOLOSTRUM AG
25.13.1 COMPANY SNAPSHOT
25.13.2 PRODUCT PORTFOLIO
25.13.3 RECENT DEVELOPMENT
25.14 VITOMEGA COLOSTRUM B.V
25.14.1 COMPANY SNAPSHOT
25.14.2 PRODUCT PORTFOLIO
25.14.3 RECENT DEVELOPMENT
25.15 ZIEGENKRAFT
25.15.1 COMPANY SNAPSHOT
25.15.2 PRODUCT PORTFOLIO
25.15.3 RECENT DEVELOPMENT
26 QUESTIONNAIRE
27 RELATED REPORTS
List of Table
TABLE 1 KEY QUALITY PARAMETERS IN COLOSTRUM TESTING
TABLE 2 MAJOR PRODUCT FORMS AND APPLICATIONS
TABLE 3 STRATEGIC VENDOR EVALUATION FRAMEWORK FOR QUALITY, COMPLIANCE, AND FUNCTIONAL PERFORMANCE IN THE EUROPE COLOSTRUM MARKET
TABLE 4 BRAND COMPARATIVE ANALYSIS
TABLE 5 CONSUMER BUYING BEHAVIOUR MATRIX
TABLE 6 CLIMATE CHANGE IMPACT AREAS IN THE EUROPE COLOSTRUM MARKET
TABLE 8 POTENTIAL BUYERS OF COLOSTRUM FOR FEED PREPARATION IN EUROPE
TABLE 9 EUROPE COLOSTRUM MARKET, BY SOURCE TYPE, 2018-2033 (USD THOUSAND)
TABLE 10 EUROPE COLOSTRUM MARKET, BY SOURCE TYPE, 2018-2033 (TONS)
TABLE 11 EUROPE BOVINE COLOSTRUM IN COLOSTRUM MARKET, BY TYPE, 2018-2033 (USD THOUSAND)
TABLE 12 EUROPE COW COLOSTRUM IN COLOSTRUM MARKET, BY TYPE, 2018-2033 (USD THOUSAND)
TABLE 13 EUROPE COLOSTRUM MARKET, BY NATURE, 2018-2033 (USD THOUSAND)
TABLE 14 EUROPE COLOSTRUM MARKET, BY NATURE, 2018-2033 (TONS)
TABLE 15 EUROPE ORGANIC IN COLOSTRUM MARKET, BY TYPE, 2018-2033 (USD THOUSAND)
TABLE 16 EUROPE COLOSTRUM MARKET, BY PRODUCT FORM, 2018-2033 (USD THOUSAND)
TABLE 17 EUROPE COLOSTRUM MARKET, BY PRODUCT FORM, 2018-2033 (TONS)
TABLE 18 EUROPE POWDER IN COLOSTRUM MARKET, BY TYPE, 2018-2033 (USD THOUSAND)
TABLE 19 EUROPE LIQUID IN COLOSTRUM MARKET, BY TYPE, 2018-2033 (USD THOUSAND)
TABLE 20 EUROPE COLOSTRUM MARKET, BY IMMUNOGLOBULIN (IGG) CONCENTRATION, 2018-2033 (USD THOUSAND)
TABLE 21 EUROPE COLOSTRUM MARKET, BY IMMUNOGLOBULIN (IGG) CONCENTRATION, 2018-2033 (TONS)
TABLE 22 EUROPE COLOSTRUM MARKET, BY PROCESSING TECHNOLOGY, 2018-2033 (USD THOUSAND)
TABLE 23 EUROPE COLOSTRUM MARKET, BY PROCESSING TECHNOLOGY, 2018-2033 (TONS)
TABLE 24 EUROPE COLOSTRUM MARKET, BY APPLICATION, 2018-2033 (USD THOUSAND)
TABLE 25 EUROPE COLOSTRUM MARKET, BY APPLICATION, 2018-2033 (TONS)
TABLE 26 EUROPE DIETARY SUPPLEMENTS IN COLOSTRUM MARKET, BY TYPE, 2018-2033 (USD THOUSAND)
TABLE 27 EUROPE SPORTS NUTRITION IN COLOSTRUM MARKET, BY TYPE, 2018-2033 (USD THOUSAND)
TABLE 28 EUROPE FUNCTIONAL FOOD & BEVERAGES IN COLOSTRUM MARKET, BY TYPE, 2018-2033 (USD THOUSAND)
TABLE 29 EUROPE INFANT NUTRITION IN COLOSTRUM MARKET, BY TYPE, 2018-2033 (USD THOUSAND)
TABLE 30 EUROPE PHARMACEUTICALS IN COLOSTRUM MARKET, BY TYPE, 2018-2033 (USD THOUSAND)
TABLE 31 EUROPE ANIMAL NUTRITION IN COLOSTRUM MARKET, BY TYPE, 2018-2033 (USD THOUSAND)
TABLE 32 EUROPE COSMETICS & PERSONAL CARE IN COLOSTRUM MARKET, BY TYPE, 2018-2033 (USD THOUSAND)
TABLE 33 EUROPE COLOSTRUM MARKET, BY END USER, 2018-2033 (USD THOUSAND)
TABLE 34 EUROPE COLOSTRUM MARKET, BY END USER, 2018-2033 (TONS)
TABLE 35 EUROPE FOOD IN COLOSTRUM MARKET, BY TYPE, 2018-2033 (USD THOUSAND)
TABLE 36 EUROPE ADULT SEGMENT IN COLOSTRUM MARKET, BY TYPE, 2018-2033 (USD THOUSAND)
TABLE 37 EUROPE INFANT & PEDIATRIC SEGMENT IN COLOSTRUM MARKET, BY TYPE, 2018-2033 (USD THOUSAND)
TABLE 38 EUROPE ELDERLY / GERIATRIC SEGMENT IN COLOSTRUM MARKET, BY TYPE, 2018-2033 (USD THOUSAND)
TABLE 39 EUROPE FEED IN COLOSTRUM MARKET, BY TYPE, 2018-2033 (USD THOUSAND)
TABLE 40 EUROPE LIVESTOCK PRODUCERS IN COLOSTRUM MARKET, BY TYPE, 2018-2033 (USD THOUSAND)
TABLE 41 EUROPE COMPANION ANIMAL OWNERS IN COLOSTRUM MARKET, BY TYPE, 2018-2033 (USD THOUSAND)
TABLE 42 EUROPE EQUINE & PERFORMANCE ANIMAL SEGMENT IN COLOSTRUM MARKET, BY TYPE, 2018-2033 (USD THOUSAND)
TABLE 43 EUROPE VETERINARY & CLINICAL ANIMAL CARE USERS IN COLOSTRUM MARKET, BY TYPE, 2018-2033 (USD THOUSAND)
TABLE 44 EUROPE COLOSTRUM MARKET, BY DISTRIBUTION CHANNEL, 2018-2033 (USD THOUSAND)
TABLE 45 EUROPE COLOSTRUM MARKET, BY DISTRIBUTION CHANNEL, 2018-2033 (TONS)
TABLE 46 EUROPE DIRECT/B2B SALES IN COLOSTRUM MARKET, BY TYPE, 2018-2033 (USD THOUSAND)
TABLE 47 EUROPE ONLINE RETAIL IN COLOSTRUM MARKET, BY TYPE, 2018-2033 (USD THOUSAND)
TABLE 48 EUROPE COLOSTRUM MARKET, BY PACKAGING TYPE, 2018-2033 (USD THOUSAND)
TABLE 49 EUROPE COLOSTRUM MARKET, BY PACKAGING TYPE, 2018-2033 (TONS)
TABLE 50 EUROPE BULK PACKAGING IN COLOSTRUM MARKET, BY TYPE, 2018-2033 (USD THOUSAND)
TABLE 51 EUROPE RETAIL PACKAGING IN COLOSTRUM MARKET, BY TYPE, 2018-2033 (USD THOUSAND)
TABLE 52 EUROPE COLOSTRUM MARKET, BY FUNCTIONALITY, 2018-2033 (USD THOUSAND)
TABLE 53 EUROPE COLOSTRUM MARKET, BY FUNCTIONALITY, 2018-2033 (TONS)
TABLE 54 EUROPE COLOSTRUM MARKET, BY SALES MODEL, 2018-2033 (USD THOUSAND)
TABLE 55 EUROPE COLOSTRUM MARKET, BY SALES MODEL, 2018-2033 (TONS)
TABLE 56 EUROPE COLOSTRUM MARKET, BY TYPE, 2018-2033 (USD THOUSAND)
TABLE 57 EUROPE COLOSTRUM MARKET, BY TYPE, 2018-2033 (TONS)
TABLE 58 GERMANY COLOSTRUM MARKET, BY SOURCE TYPE, 2018-2033 (USD THOUSAND)
TABLE 59 GERMANY COLOSTRUM MARKET, BY SOURCE TYPE, 2018-2033 (TONS)
TABLE 60 GERMANY BOVINE COLOSTRUM IN COLOSTRUM MARKET, BY TYPE, 2018-2033 (USD THOUSAND)
TABLE 61 GERMANY COW COLOSTRUM IN COLOSTRUM MARKET, BY TYPE, 2018-2033 (USD THOUSAND)
TABLE 62 GERMANY COLOSTRUM MARKET, BY NATURE, 2018-2033 (USD THOUSAND)
TABLE 63 GERMANY COLOSTRUM MARKET, BY NATURE, 2018-2033 (TONS)
TABLE 64 GERMANY ORGANIC IN COLOSTRUM MARKET, BY TYPE, 2018-2033 (USD THOUSAND)
TABLE 65 GERMANY COLOSTRUM MARKET, BY PRODUCT FORM, 2018-2033 (USD THOUSAND)
TABLE 66 GERMANY COLOSTRUM MARKET, BY PRODUCT FORM, 2018-2033 (TONS)
TABLE 67 GERMANY POWDER IN COLOSTRUM MARKET, BY TYPE, 2018-2033 (USD THOUSAND)
TABLE 68 GERMANY LIQUID IN COLOSTRUM MARKET, BY TYPE, 2018-2033 (USD THOUSAND)
TABLE 69 GERMANY COLOSTRUM MARKET, BY IMMUNOGLOBULIN (IGG) CONCENTRATION, 2018-2033 (USD THOUSAND)
TABLE 70 GERMANY COLOSTRUM MARKET, BY IMMUNOGLOBULIN (IGG) CONCENTRATION, 2018-2033 (TONS)
TABLE 71 GERMANY COLOSTRUM MARKET, BY PROCESSING TECHNOLOGY, 2018-2033 (USD THOUSAND)
TABLE 72 GERMANY COLOSTRUM MARKET, BY PROCESSING TECHNOLOGY, 2018-2033 (TONS)
TABLE 73 GERMANY COLOSTRUM MARKET, BY APPLICATION, 2018-2033 (USD THOUSAND)
TABLE 74 GERMANY COLOSTRUM MARKET, BY APPLICATION, 2018-2033 (TONS)
TABLE 75 GERMANY DIETARY SUPPLEMENTS IN COLOSTRUM MARKET, BY TYPE, 2018-2033 (USD THOUSAND)
TABLE 76 GERMANY SPORTS NUTRITION IN COLOSTRUM MARKET, BY TYPE, 2018-2033 (USD THOUSAND)
TABLE 77 GERMANY FUNCTIONAL FOOD & BEVERAGES IN COLOSTRUM MARKET, BY TYPE, 2018-2033 (USD THOUSAND)
TABLE 78 GERMANY INFANT NUTRITION IN COLOSTRUM MARKET, BY TYPE, 2018-2033 (USD THOUSAND)
TABLE 79 GERMANY PHARMACEUTICALS IN COLOSTRUM MARKET, BY TYPE, 2018-2033 (USD THOUSAND)
TABLE 80 GERMANY ANIMAL NUTRITION IN COLOSTRUM MARKET, BY TYPE, 2018-2033 (USD THOUSAND)
TABLE 81 GERMANY COSMETICS & PERSONAL CARE IN COLOSTRUM MARKET, BY TYPE, 2018-2033 (USD THOUSAND)
TABLE 82 GERMANY COLOSTRUM MARKET, BY END USER, 2018-2033 (USD THOUSAND)
TABLE 83 GERMANY COLOSTRUM MARKET, BY END USER, 2018-2033 (TONS)
TABLE 84 GERMANY FOOD IN COLOSTRUM MARKET, BY TYPE, 2018-2033 (USD THOUSAND)
TABLE 85 GERMANY ADULT SEGMENT IN COLOSTRUM MARKET, BY TYPE, 2018-2033 (USD THOUSAND)
TABLE 86 GERMANY INFANT & PEDIATRIC SEGMENT IN COLOSTRUM MARKET, BY TYPE, 2018-2033 (USD THOUSAND)
TABLE 87 GERMANY ELDERLY / GERIATRIC SEGMENT IN COLOSTRUM MARKET, BY TYPE, 2018-2033 (USD THOUSAND)
TABLE 88 GERMANY FEED IN COLOSTRUM MARKET, BY TYPE, 2018-2033 (USD THOUSAND)
TABLE 89 GERMANY LIVESTOCK PRODUCERS IN COLOSTRUM MARKET, BY TYPE, 2018-2033 (USD THOUSAND)
TABLE 90 GERMANY COMPANION ANIMAL OWNERS IN COLOSTRUM MARKET, BY TYPE, 2018-2033 (USD THOUSAND)
TABLE 91 GERMANY EQUINE & PERFORMANCE ANIMAL SEGMENT IN COLOSTRUM MARKET, BY TYPE, 2018-2033 (USD THOUSAND)
TABLE 92 GERMANY VETERINARY & CLINICAL ANIMAL CARE USERS IN COLOSTRUM MARKET, BY TYPE, 2018-2033 (USD THOUSAND)
TABLE 93 GERMANY COLOSTRUM MARKET, BY DISTRIBUTION CHANNEL, 2018-2033 (USD THOUSAND)
TABLE 94 GERMANY COLOSTRUM MARKET, BY DISTRIBUTION CHANNEL, 2018-2033 (TONS)
TABLE 95 GERMANY DIRECT/B2B SALES IN COLOSTRUM MARKET, BY TYPE, 2018-2033 (USD THOUSAND)
TABLE 96 GERMANY ONLINE RETAIL IN COLOSTRUM MARKET, BY TYPE, 2018-2033 (USD THOUSAND)
TABLE 97 GERMANY COLOSTRUM MARKET, BY PACKAGING TYPE, 2018-2033 (USD THOUSAND)
TABLE 98 GERMANY COLOSTRUM MARKET, BY PACKAGING TYPE, 2018-2033 (TONS)
TABLE 99 GERMANY BULK PACKAGING IN COLOSTRUM MARKET, BY TYPE, 2018-2033 (USD THOUSAND)
TABLE 100 GERMANY RETAIL PACKAGING IN COLOSTRUM MARKET, BY TYPE, 2018-2033 (USD THOUSAND)
TABLE 101 GERMANY COLOSTRUM MARKET, BY FUNCTIONALITY, 2018-2033 (USD THOUSAND)
TABLE 102 GERMANY COLOSTRUM MARKET, BY FUNCTIONALITY, 2018-2033 (TONS)
TABLE 103 GERMANY COLOSTRUM MARKET, BY SALES MODEL, 2018-2033 (USD THOUSAND)
TABLE 104 GERMANY COLOSTRUM MARKET, BY SALES MODEL, 2018-2033 (TONS)
TABLE 105 U.K. COLOSTRUM MARKET, BY SOURCE TYPE, 2018-2033 (USD THOUSAND)
TABLE 106 U.K. COLOSTRUM MARKET, BY SOURCE TYPE, 2018-2033 (TONS)
TABLE 107 U.K. BOVINE COLOSTRUM IN COLOSTRUM MARKET, BY TYPE, 2018-2033 (USD THOUSAND)
TABLE 108 U.K. COW COLOSTRUM IN COLOSTRUM MARKET, BY TYPE, 2018-2033 (USD THOUSAND)
TABLE 109 U.K. COLOSTRUM MARKET, BY NATURE, 2018-2033 (USD THOUSAND)
TABLE 110 U.K. COLOSTRUM MARKET, BY NATURE, 2018-2033 (TONS)
TABLE 111 U.K. ORGANIC IN COLOSTRUM MARKET, BY TYPE, 2018-2033 (USD THOUSAND)
TABLE 112 U.K. COLOSTRUM MARKET, BY PRODUCT FORM, 2018-2033 (USD THOUSAND)
TABLE 113 U.K. COLOSTRUM MARKET, BY PRODUCT FORM, 2018-2033 (TONS)
TABLE 114 U.K. POWDER IN COLOSTRUM MARKET, BY TYPE, 2018-2033 (USD THOUSAND)
TABLE 115 U.K. LIQUID IN COLOSTRUM MARKET, BY TYPE, 2018-2033 (USD THOUSAND)
TABLE 116 U.K. COLOSTRUM MARKET, BY IMMUNOGLOBULIN (IGG) CONCENTRATION, 2018-2033 (USD THOUSAND)
TABLE 117 U.K. COLOSTRUM MARKET, BY IMMUNOGLOBULIN (IGG) CONCENTRATION, 2018-2033 (TONS)
TABLE 118 U.K. COLOSTRUM MARKET, BY PROCESSING TECHNOLOGY, 2018-2033 (USD THOUSAND)
TABLE 119 U.K. COLOSTRUM MARKET, BY PROCESSING TECHNOLOGY, 2018-2033 (TONS)
TABLE 120 U.K. COLOSTRUM MARKET, BY APPLICATION, 2018-2033 (USD THOUSAND)
TABLE 121 U.K. COLOSTRUM MARKET, BY APPLICATION, 2018-2033 (TONS)
TABLE 122 U.K. DIETARY SUPPLEMENTS IN COLOSTRUM MARKET, BY TYPE, 2018-2033 (USD THOUSAND)
TABLE 123 U.K. SPORTS NUTRITION IN COLOSTRUM MARKET, BY TYPE, 2018-2033 (USD THOUSAND)
TABLE 124 U.K. FUNCTIONAL FOOD & BEVERAGES IN COLOSTRUM MARKET, BY TYPE, 2018-2033 (USD THOUSAND)
TABLE 125 U.K. INFANT NUTRITION IN COLOSTRUM MARKET, BY TYPE, 2018-2033 (USD THOUSAND)
TABLE 126 U.K. PHARMACEUTICALS IN COLOSTRUM MARKET, BY TYPE, 2018-2033 (USD THOUSAND)
TABLE 127 U.K. ANIMAL NUTRITION IN COLOSTRUM MARKET, BY TYPE, 2018-2033 (USD THOUSAND)
TABLE 128 U.K. COSMETICS & PERSONAL CARE IN COLOSTRUM MARKET, BY TYPE, 2018-2033 (USD THOUSAND)
TABLE 129 U.K. COLOSTRUM MARKET, BY END USER, 2018-2033 (USD THOUSAND)
TABLE 130 U.K. COLOSTRUM MARKET, BY END USER, 2018-2033 (TONS)
TABLE 131 U.K. FOOD IN COLOSTRUM MARKET, BY TYPE, 2018-2033 (USD THOUSAND)
TABLE 132 U.K. ADULT SEGMENT IN COLOSTRUM MARKET, BY TYPE, 2018-2033 (USD THOUSAND)
TABLE 133 U.K. INFANT & PEDIATRIC SEGMENT IN COLOSTRUM MARKET, BY TYPE, 2018-2033 (USD THOUSAND)
TABLE 134 U.K. ELDERLY / GERIATRIC SEGMENT IN COLOSTRUM MARKET, BY TYPE, 2018-2033 (USD THOUSAND)
TABLE 135 U.K. FEED IN COLOSTRUM MARKET, BY TYPE, 2018-2033 (USD THOUSAND)
TABLE 136 U.K. LIVESTOCK PRODUCERS IN COLOSTRUM MARKET, BY TYPE, 2018-2033 (USD THOUSAND)
TABLE 137 U.K. COMPANION ANIMAL OWNERS IN COLOSTRUM MARKET, BY TYPE, 2018-2033 (USD THOUSAND)
TABLE 138 U.K. EQUINE & PERFORMANCE ANIMAL SEGMENT IN COLOSTRUM MARKET, BY TYPE, 2018-2033 (USD THOUSAND)
TABLE 139 U.K. VETERINARY & CLINICAL ANIMAL CARE USERS IN COLOSTRUM MARKET, BY TYPE, 2018-2033 (USD THOUSAND)
TABLE 140 U.K. COLOSTRUM MARKET, BY DISTRIBUTION CHANNEL, 2018-2033 (USD THOUSAND)
TABLE 141 U.K. COLOSTRUM MARKET, BY DISTRIBUTION CHANNEL, 2018-2033 (TONS)
TABLE 142 U.K. DIRECT/B2B SALES IN COLOSTRUM MARKET, BY TYPE, 2018-2033 (USD THOUSAND)
TABLE 143 U.K. ONLINE RETAIL IN COLOSTRUM MARKET, BY TYPE, 2018-2033 (USD THOUSAND)
TABLE 144 U.K. COLOSTRUM MARKET, BY PACKAGING TYPE, 2018-2033 (USD THOUSAND)
TABLE 145 U.K. COLOSTRUM MARKET, BY PACKAGING TYPE, 2018-2033 (TONS)
TABLE 146 U.K. BULK PACKAGING IN COLOSTRUM MARKET, BY TYPE, 2018-2033 (USD THOUSAND)
TABLE 147 U.K. RETAIL PACKAGING IN COLOSTRUM MARKET, BY TYPE, 2018-2033 (USD THOUSAND)
TABLE 148 U.K. COLOSTRUM MARKET, BY FUNCTIONALITY, 2018-2033 (USD THOUSAND)
TABLE 149 U.K. COLOSTRUM MARKET, BY FUNCTIONALITY, 2018-2033 (TONS)
TABLE 150 U.K. COLOSTRUM MARKET, BY SALES MODEL, 2018-2033 (USD THOUSAND)
TABLE 151 U.K. COLOSTRUM MARKET, BY SALES MODEL, 2018-2033 (TONS)
TABLE 152 FRANCE COLOSTRUM MARKET, BY SOURCE TYPE, 2018-2033 (USD THOUSAND)
TABLE 153 FRANCE COLOSTRUM MARKET, BY SOURCE TYPE, 2018-2033 (TONS)
TABLE 154 FRANCE BOVINE COLOSTRUM IN COLOSTRUM MARKET, BY TYPE, 2018-2033 (USD THOUSAND)
TABLE 155 FRANCE COW COLOSTRUM IN COLOSTRUM MARKET, BY TYPE, 2018-2033 (USD THOUSAND)
TABLE 156 FRANCE COLOSTRUM MARKET, BY NATURE, 2018-2033 (USD THOUSAND)
TABLE 157 FRANCE COLOSTRUM MARKET, BY NATURE, 2018-2033 (TONS)
TABLE 158 FRANCE ORGANIC IN COLOSTRUM MARKET, BY TYPE, 2018-2033 (USD THOUSAND)
TABLE 159 FRANCE COLOSTRUM MARKET, BY PRODUCT FORM, 2018-2033 (USD THOUSAND)
TABLE 160 FRANCE COLOSTRUM MARKET, BY PRODUCT FORM, 2018-2033 (TONS)
TABLE 161 FRANCE POWDER IN COLOSTRUM MARKET, BY TYPE, 2018-2033 (USD THOUSAND)
TABLE 162 FRANCE LIQUID IN COLOSTRUM MARKET, BY TYPE, 2018-2033 (USD THOUSAND)
TABLE 163 FRANCE COLOSTRUM MARKET, BY IMMUNOGLOBULIN (IGG) CONCENTRATION, 2018-2033 (USD THOUSAND)
TABLE 164 FRANCE COLOSTRUM MARKET, BY IMMUNOGLOBULIN (IGG) CONCENTRATION, 2018-2033 (TONS)
TABLE 165 FRANCE COLOSTRUM MARKET, BY PROCESSING TECHNOLOGY, 2018-2033 (USD THOUSAND)
TABLE 166 FRANCE COLOSTRUM MARKET, BY PROCESSING TECHNOLOGY, 2018-2033 (TONS)
TABLE 167 FRANCE COLOSTRUM MARKET, BY APPLICATION, 2018-2033 (USD THOUSAND)
TABLE 168 FRANCE COLOSTRUM MARKET, BY APPLICATION, 2018-2033 (TONS)
TABLE 169 FRANCE DIETARY SUPPLEMENTS IN COLOSTRUM MARKET, BY TYPE, 2018-2033 (USD THOUSAND)
TABLE 170 FRANCE SPORTS NUTRITION IN COLOSTRUM MARKET, BY TYPE, 2018-2033 (USD THOUSAND)
TABLE 171 FRANCE FUNCTIONAL FOOD & BEVERAGES IN COLOSTRUM MARKET, BY TYPE, 2018-2033 (USD THOUSAND)
TABLE 172 FRANCE INFANT NUTRITION IN COLOSTRUM MARKET, BY TYPE, 2018-2033 (USD THOUSAND)
TABLE 173 FRANCE PHARMACEUTICALS IN COLOSTRUM MARKET, BY TYPE, 2018-2033 (USD THOUSAND)
TABLE 174 FRANCE ANIMAL NUTRITION IN COLOSTRUM MARKET, BY TYPE, 2018-2033 (USD THOUSAND)
TABLE 175 FRANCE COSMETICS & PERSONAL CARE IN COLOSTRUM MARKET, BY TYPE, 2018-2033 (USD THOUSAND)
TABLE 176 FRANCE COLOSTRUM MARKET, BY END USER, 2018-2033 (USD THOUSAND)
TABLE 177 FRANCE COLOSTRUM MARKET, BY END USER, 2018-2033 (TONS)
TABLE 178 FRANCE FOOD IN COLOSTRUM MARKET, BY TYPE, 2018-2033 (USD THOUSAND)
TABLE 179 FRANCE ADULT SEGMENT IN COLOSTRUM MARKET, BY TYPE, 2018-2033 (USD THOUSAND)
TABLE 180 FRANCE INFANT & PEDIATRIC SEGMENT IN COLOSTRUM MARKET, BY TYPE, 2018-2033 (USD THOUSAND)
TABLE 181 FRANCE ELDERLY / GERIATRIC SEGMENT IN COLOSTRUM MARKET, BY TYPE, 2018-2033 (USD THOUSAND)
TABLE 182 FRANCE FEED IN COLOSTRUM MARKET, BY TYPE, 2018-2033 (USD THOUSAND)
TABLE 183 FRANCE LIVESTOCK PRODUCERS IN COLOSTRUM MARKET, BY TYPE, 2018-2033 (USD THOUSAND)
TABLE 184 FRANCE COMPANION ANIMAL OWNERS IN COLOSTRUM MARKET, BY TYPE, 2018-2033 (USD THOUSAND)
TABLE 185 FRANCE EQUINE & PERFORMANCE ANIMAL SEGMENT IN COLOSTRUM MARKET, BY TYPE, 2018-2033 (USD THOUSAND)
TABLE 186 FRANCE VETERINARY & CLINICAL ANIMAL CARE USERS IN COLOSTRUM MARKET, BY TYPE, 2018-2033 (USD THOUSAND)
TABLE 187 FRANCE COLOSTRUM MARKET, BY DISTRIBUTION CHANNEL, 2018-2033 (USD THOUSAND)
TABLE 188 FRANCE COLOSTRUM MARKET, BY DISTRIBUTION CHANNEL, 2018-2033 (TONS)
TABLE 189 FRANCE DIRECT/B2B SALES IN COLOSTRUM MARKET, BY TYPE, 2018-2033 (USD THOUSAND)
TABLE 190 FRANCE ONLINE RETAIL IN COLOSTRUM MARKET, BY TYPE, 2018-2033 (USD THOUSAND)
TABLE 191 FRANCE COLOSTRUM MARKET, BY PACKAGING TYPE, 2018-2033 (USD THOUSAND)
TABLE 192 FRANCE COLOSTRUM MARKET, BY PACKAGING TYPE, 2018-2033 (TONS)
TABLE 193 FRANCE BULK PACKAGING IN COLOSTRUM MARKET, BY TYPE, 2018-2033 (USD THOUSAND)
TABLE 194 FRANCE RETAIL PACKAGING IN COLOSTRUM MARKET, BY TYPE, 2018-2033 (USD THOUSAND)
TABLE 195 FRANCE COLOSTRUM MARKET, BY FUNCTIONALITY, 2018-2033 (USD THOUSAND)
TABLE 196 FRANCE COLOSTRUM MARKET, BY FUNCTIONALITY, 2018-2033 (TONS)
TABLE 197 FRANCE COLOSTRUM MARKET, BY SALES MODEL, 2018-2033 (USD THOUSAND)
TABLE 198 FRANCE COLOSTRUM MARKET, BY SALES MODEL, 2018-2033 (TONS)
TABLE 199 ITALY COLOSTRUM MARKET, BY SOURCE TYPE, 2018-2033 (USD THOUSAND)
TABLE 200 ITALY COLOSTRUM MARKET, BY SOURCE TYPE, 2018-2033 (TONS)
TABLE 201 ITALY BOVINE COLOSTRUM IN COLOSTRUM MARKET, BY TYPE, 2018-2033 (USD THOUSAND)
TABLE 202 ITALY COW COLOSTRUM IN COLOSTRUM MARKET, BY TYPE, 2018-2033 (USD THOUSAND)
TABLE 203 ITALY COLOSTRUM MARKET, BY NATURE, 2018-2033 (USD THOUSAND)
TABLE 204 ITALY COLOSTRUM MARKET, BY NATURE, 2018-2033 (TONS)
TABLE 205 ITALY ORGANIC IN COLOSTRUM MARKET, BY TYPE, 2018-2033 (USD THOUSAND)
TABLE 206 ITALY COLOSTRUM MARKET, BY PRODUCT FORM, 2018-2033 (USD THOUSAND)
TABLE 207 ITALY COLOSTRUM MARKET, BY PRODUCT FORM, 2018-2033 (TONS)
TABLE 208 ITALY POWDER IN COLOSTRUM MARKET, BY TYPE, 2018-2033 (USD THOUSAND)
TABLE 209 ITALY LIQUID IN COLOSTRUM MARKET, BY TYPE, 2018-2033 (USD THOUSAND)
TABLE 210 ITALY COLOSTRUM MARKET, BY IMMUNOGLOBULIN (IGG) CONCENTRATION, 2018-2033 (USD THOUSAND)
TABLE 211 ITALY COLOSTRUM MARKET, BY IMMUNOGLOBULIN (IGG) CONCENTRATION, 2018-2033 (TONS)
TABLE 212 ITALY COLOSTRUM MARKET, BY PROCESSING TECHNOLOGY, 2018-2033 (USD THOUSAND)
TABLE 213 ITALY COLOSTRUM MARKET, BY PROCESSING TECHNOLOGY, 2018-2033 (TONS)
TABLE 214 ITALY COLOSTRUM MARKET, BY APPLICATION, 2018-2033 (USD THOUSAND)
TABLE 215 ITALY COLOSTRUM MARKET, BY APPLICATION, 2018-2033 (TONS)
TABLE 216 ITALY DIETARY SUPPLEMENTS IN COLOSTRUM MARKET, BY TYPE, 2018-2033 (USD THOUSAND)
TABLE 217 ITALY SPORTS NUTRITION IN COLOSTRUM MARKET, BY TYPE, 2018-2033 (USD THOUSAND)
TABLE 218 ITALY FUNCTIONAL FOOD & BEVERAGES IN COLOSTRUM MARKET, BY TYPE, 2018-2033 (USD THOUSAND)
TABLE 219 ITALY INFANT NUTRITION IN COLOSTRUM MARKET, BY TYPE, 2018-2033 (USD THOUSAND)
TABLE 220 ITALY PHARMACEUTICALS IN COLOSTRUM MARKET, BY TYPE, 2018-2033 (USD THOUSAND)
TABLE 221 ITALY ANIMAL NUTRITION IN COLOSTRUM MARKET, BY TYPE, 2018-2033 (USD THOUSAND)
TABLE 222 ITALY COSMETICS & PERSONAL CARE IN COLOSTRUM MARKET, BY TYPE, 2018-2033 (USD THOUSAND)
TABLE 223 ITALY COLOSTRUM MARKET, BY END USER, 2018-2033 (USD THOUSAND)
TABLE 224 ITALY COLOSTRUM MARKET, BY END USER, 2018-2033 (TONS)
TABLE 225 ITALY FOOD IN COLOSTRUM MARKET, BY TYPE, 2018-2033 (USD THOUSAND)
TABLE 226 ITALY ADULT SEGMENT IN COLOSTRUM MARKET, BY TYPE, 2018-2033 (USD THOUSAND)
TABLE 227 ITALY INFANT & PEDIATRIC SEGMENT IN COLOSTRUM MARKET, BY TYPE, 2018-2033 (USD THOUSAND)
TABLE 228 ITALY ELDERLY / GERIATRIC SEGMENT IN COLOSTRUM MARKET, BY TYPE, 2018-2033 (USD THOUSAND)
TABLE 229 ITALY FEED IN COLOSTRUM MARKET, BY TYPE, 2018-2033 (USD THOUSAND)
TABLE 230 ITALY LIVESTOCK PRODUCERS IN COLOSTRUM MARKET, BY TYPE, 2018-2033 (USD THOUSAND)
TABLE 231 ITALY COMPANION ANIMAL OWNERS IN COLOSTRUM MARKET, BY TYPE, 2018-2033 (USD THOUSAND)
TABLE 232 ITALY EQUINE & PERFORMANCE ANIMAL SEGMENT IN COLOSTRUM MARKET, BY TYPE, 2018-2033 (USD THOUSAND)
TABLE 233 ITALY VETERINARY & CLINICAL ANIMAL CARE USERS IN COLOSTRUM MARKET, BY TYPE, 2018-2033 (USD THOUSAND)
TABLE 234 ITALY COLOSTRUM MARKET, BY DISTRIBUTION CHANNEL, 2018-2033 (USD THOUSAND)
TABLE 235 ITALY COLOSTRUM MARKET, BY DISTRIBUTION CHANNEL, 2018-2033 (TONS)
TABLE 236 ITALY DIRECT/B2B SALES IN COLOSTRUM MARKET, BY TYPE, 2018-2033 (USD THOUSAND)
TABLE 237 ITALY ONLINE RETAIL IN COLOSTRUM MARKET, BY TYPE, 2018-2033 (USD THOUSAND)
TABLE 238 ITALY COLOSTRUM MARKET, BY PACKAGING TYPE, 2018-2033 (USD THOUSAND)
TABLE 239 ITALY COLOSTRUM MARKET, BY PACKAGING TYPE, 2018-2033 (TONS)
TABLE 240 ITALY BULK PACKAGING IN COLOSTRUM MARKET, BY TYPE, 2018-2033 (USD THOUSAND)
TABLE 241 ITALY RETAIL PACKAGING IN COLOSTRUM MARKET, BY TYPE, 2018-2033 (USD THOUSAND)
TABLE 242 ITALY COLOSTRUM MARKET, BY FUNCTIONALITY, 2018-2033 (USD THOUSAND)
TABLE 243 ITALY COLOSTRUM MARKET, BY FUNCTIONALITY, 2018-2033 (TONS)
TABLE 244 ITALY COLOSTRUM MARKET, BY SALES MODEL, 2018-2033 (USD THOUSAND)
TABLE 245 ITALY COLOSTRUM MARKET, BY SALES MODEL, 2018-2033 (TONS)
TABLE 246 NETHERLANDS COLOSTRUM MARKET, BY SOURCE TYPE, 2018-2033 (USD THOUSAND)
TABLE 247 NETHERLANDS COLOSTRUM MARKET, BY SOURCE TYPE, 2018-2033 (TONS)
TABLE 248 NETHERLANDS BOVINE COLOSTRUM IN COLOSTRUM MARKET, BY TYPE, 2018-2033 (USD THOUSAND)
TABLE 249 NETHERLANDS COW COLOSTRUM IN COLOSTRUM MARKET, BY TYPE, 2018-2033 (USD THOUSAND)
TABLE 250 NETHERLANDS COLOSTRUM MARKET, BY NATURE, 2018-2033 (USD THOUSAND)
TABLE 251 NETHERLANDS COLOSTRUM MARKET, BY NATURE, 2018-2033 (TONS)
TABLE 252 NETHERLANDS ORGANIC IN COLOSTRUM MARKET, BY TYPE, 2018-2033 (USD THOUSAND)
TABLE 253 NETHERLANDS COLOSTRUM MARKET, BY PRODUCT FORM, 2018-2033 (USD THOUSAND)
TABLE 254 NETHERLANDS COLOSTRUM MARKET, BY PRODUCT FORM, 2018-2033 (TONS)
TABLE 255 NETHERLANDS POWDER IN COLOSTRUM MARKET, BY TYPE, 2018-2033 (USD THOUSAND)
TABLE 256 NETHERLANDS LIQUID IN COLOSTRUM MARKET, BY TYPE, 2018-2033 (USD THOUSAND)
TABLE 257 NETHERLANDS COLOSTRUM MARKET, BY IMMUNOGLOBULIN (IGG) CONCENTRATION, 2018-2033 (USD THOUSAND)
TABLE 258 NETHERLANDS COLOSTRUM MARKET, BY IMMUNOGLOBULIN (IGG) CONCENTRATION, 2018-2033 (TONS)
TABLE 259 NETHERLANDS COLOSTRUM MARKET, BY PROCESSING TECHNOLOGY, 2018-2033 (USD THOUSAND)
TABLE 260 NETHERLANDS COLOSTRUM MARKET, BY PROCESSING TECHNOLOGY, 2018-2033 (TONS)
TABLE 261 NETHERLANDS COLOSTRUM MARKET, BY APPLICATION, 2018-2033 (USD THOUSAND)
TABLE 262 NETHERLANDS COLOSTRUM MARKET, BY APPLICATION, 2018-2033 (TONS)
TABLE 263 NETHERLANDS DIETARY SUPPLEMENTS IN COLOSTRUM MARKET, BY TYPE, 2018-2033 (USD THOUSAND)
TABLE 264 NETHERLANDS SPORTS NUTRITION IN COLOSTRUM MARKET, BY TYPE, 2018-2033 (USD THOUSAND)
TABLE 265 NETHERLANDS FUNCTIONAL FOOD & BEVERAGES IN COLOSTRUM MARKET, BY TYPE, 2018-2033 (USD THOUSAND)
TABLE 266 NETHERLANDS INFANT NUTRITION IN COLOSTRUM MARKET, BY TYPE, 2018-2033 (USD THOUSAND)
TABLE 267 NETHERLANDS PHARMACEUTICALS IN COLOSTRUM MARKET, BY TYPE, 2018-2033 (USD THOUSAND)
TABLE 268 NETHERLANDS ANIMAL NUTRITION IN COLOSTRUM MARKET, BY TYPE, 2018-2033 (USD THOUSAND)
TABLE 269 NETHERLANDS COSMETICS & PERSONAL CARE IN COLOSTRUM MARKET, BY TYPE, 2018-2033 (USD THOUSAND)
TABLE 270 NETHERLANDS COLOSTRUM MARKET, BY END USER, 2018-2033 (USD THOUSAND)
TABLE 271 NETHERLANDS COLOSTRUM MARKET, BY END USER, 2018-2033 (TONS)
TABLE 272 NETHERLANDS FOOD IN COLOSTRUM MARKET, BY TYPE, 2018-2033 (USD THOUSAND)
TABLE 273 NETHERLANDS ADULT SEGMENT IN COLOSTRUM MARKET, BY TYPE, 2018-2033 (USD THOUSAND)
TABLE 274 NETHERLANDS INFANT & PEDIATRIC SEGMENT IN COLOSTRUM MARKET, BY TYPE, 2018-2033 (USD THOUSAND)
TABLE 275 NETHERLANDS ELDERLY / GERIATRIC SEGMENT IN COLOSTRUM MARKET, BY TYPE, 2018-2033 (USD THOUSAND)
TABLE 276 NETHERLANDS FEED IN COLOSTRUM MARKET, BY TYPE, 2018-2033 (USD THOUSAND)
TABLE 277 NETHERLANDS LIVESTOCK PRODUCERS IN COLOSTRUM MARKET, BY TYPE, 2018-2033 (USD THOUSAND)
TABLE 278 NETHERLANDS COMPANION ANIMAL OWNERS IN COLOSTRUM MARKET, BY TYPE, 2018-2033 (USD THOUSAND)
TABLE 279 NETHERLANDS EQUINE & PERFORMANCE ANIMAL SEGMENT IN COLOSTRUM MARKET, BY TYPE, 2018-2033 (USD THOUSAND)
TABLE 280 NETHERLANDS VETERINARY & CLINICAL ANIMAL CARE USERS IN COLOSTRUM MARKET, BY TYPE, 2018-2033 (USD THOUSAND)
TABLE 281 NETHERLANDS COLOSTRUM MARKET, BY DISTRIBUTION CHANNEL, 2018-2033 (USD THOUSAND)
TABLE 282 NETHERLANDS COLOSTRUM MARKET, BY DISTRIBUTION CHANNEL, 2018-2033 (TONS)
TABLE 283 NETHERLANDS DIRECT/B2B SALES IN COLOSTRUM MARKET, BY TYPE, 2018-2033 (USD THOUSAND)
TABLE 284 NETHERLANDS ONLINE RETAIL IN COLOSTRUM MARKET, BY TYPE, 2018-2033 (USD THOUSAND)
TABLE 285 NETHERLANDS COLOSTRUM MARKET, BY PACKAGING TYPE, 2018-2033 (USD THOUSAND)
TABLE 286 NETHERLANDS COLOSTRUM MARKET, BY PACKAGING TYPE, 2018-2033 (TONS)
TABLE 287 NETHERLANDS BULK PACKAGING IN COLOSTRUM MARKET, BY TYPE, 2018-2033 (USD THOUSAND)
TABLE 288 NETHERLANDS RETAIL PACKAGING IN COLOSTRUM MARKET, BY TYPE, 2018-2033 (USD THOUSAND)
TABLE 289 NETHERLANDS COLOSTRUM MARKET, BY FUNCTIONALITY, 2018-2033 (USD THOUSAND)
TABLE 290 NETHERLANDS COLOSTRUM MARKET, BY FUNCTIONALITY, 2018-2033 (TONS)
TABLE 291 NETHERLANDS COLOSTRUM MARKET, BY SALES MODEL, 2018-2033 (USD THOUSAND)
TABLE 292 NETHERLANDS COLOSTRUM MARKET, BY SALES MODEL, 2018-2033 (TONS)
TABLE 293 SPAIN COLOSTRUM MARKET, BY SOURCE TYPE, 2018-2033 (USD THOUSAND)
TABLE 294 SPAIN COLOSTRUM MARKET, BY SOURCE TYPE, 2018-2033 (TONS)
TABLE 295 SPAIN BOVINE COLOSTRUM IN COLOSTRUM MARKET, BY TYPE, 2018-2033 (USD THOUSAND)
TABLE 296 SPAIN COW COLOSTRUM IN COLOSTRUM MARKET, BY TYPE, 2018-2033 (USD THOUSAND)
TABLE 297 SPAIN COLOSTRUM MARKET, BY NATURE, 2018-2033 (USD THOUSAND)
TABLE 298 SPAIN COLOSTRUM MARKET, BY NATURE, 2018-2033 (TONS)
TABLE 299 SPAIN ORGANIC IN COLOSTRUM MARKET, BY TYPE, 2018-2033 (USD THOUSAND)
TABLE 300 SPAIN COLOSTRUM MARKET, BY PRODUCT FORM, 2018-2033 (USD THOUSAND)
TABLE 301 SPAIN COLOSTRUM MARKET, BY PRODUCT FORM, 2018-2033 (TONS)
TABLE 302 SPAIN POWDER IN COLOSTRUM MARKET, BY TYPE, 2018-2033 (USD THOUSAND)
TABLE 303 SPAIN LIQUID IN COLOSTRUM MARKET, BY TYPE, 2018-2033 (USD THOUSAND)
TABLE 304 SPAIN COLOSTRUM MARKET, BY IMMUNOGLOBULIN (IGG) CONCENTRATION, 2018-2033 (USD THOUSAND)
TABLE 305 SPAIN COLOSTRUM MARKET, BY IMMUNOGLOBULIN (IGG) CONCENTRATION, 2018-2033 (TONS)
TABLE 306 SPAIN COLOSTRUM MARKET, BY PROCESSING TECHNOLOGY, 2018-2033 (USD THOUSAND)
TABLE 307 SPAIN COLOSTRUM MARKET, BY PROCESSING TECHNOLOGY, 2018-2033 (TONS)
TABLE 308 SPAIN COLOSTRUM MARKET, BY APPLICATION, 2018-2033 (USD THOUSAND)
TABLE 309 SPAIN COLOSTRUM MARKET, BY APPLICATION, 2018-2033 (TONS)
TABLE 310 SPAIN DIETARY SUPPLEMENTS IN COLOSTRUM MARKET, BY TYPE, 2018-2033 (USD THOUSAND)
TABLE 311 SPAIN SPORTS NUTRITION IN COLOSTRUM MARKET, BY TYPE, 2018-2033 (USD THOUSAND)
TABLE 312 SPAIN FUNCTIONAL FOOD & BEVERAGES IN COLOSTRUM MARKET, BY TYPE, 2018-2033 (USD THOUSAND)
TABLE 313 SPAIN INFANT NUTRITION IN COLOSTRUM MARKET, BY TYPE, 2018-2033 (USD THOUSAND)
TABLE 314 SPAIN PHARMACEUTICALS IN COLOSTRUM MARKET, BY TYPE, 2018-2033 (USD THOUSAND)
TABLE 315 SPAIN ANIMAL NUTRITION IN COLOSTRUM MARKET, BY TYPE, 2018-2033 (USD THOUSAND)
TABLE 316 SPAIN COSMETICS & PERSONAL CARE IN COLOSTRUM MARKET, BY TYPE, 2018-2033 (USD THOUSAND)
TABLE 317 SPAIN COLOSTRUM MARKET, BY END USER, 2018-2033 (USD THOUSAND)
TABLE 318 SPAIN COLOSTRUM MARKET, BY END USER, 2018-2033 (TONS)
TABLE 319 SPAIN FOOD IN COLOSTRUM MARKET, BY TYPE, 2018-2033 (USD THOUSAND)
TABLE 320 SPAIN ADULT SEGMENT IN COLOSTRUM MARKET, BY TYPE, 2018-2033 (USD THOUSAND)
TABLE 321 SPAIN INFANT & PEDIATRIC SEGMENT IN COLOSTRUM MARKET, BY TYPE, 2018-2033 (USD THOUSAND)
TABLE 322 SPAIN ELDERLY / GERIATRIC SEGMENT IN COLOSTRUM MARKET, BY TYPE, 2018-2033 (USD THOUSAND)
TABLE 323 SPAIN FEED IN COLOSTRUM MARKET, BY TYPE, 2018-2033 (USD THOUSAND)
TABLE 324 SPAIN LIVESTOCK PRODUCERS IN COLOSTRUM MARKET, BY TYPE, 2018-2033 (USD THOUSAND)
TABLE 325 SPAIN COMPANION ANIMAL OWNERS IN COLOSTRUM MARKET, BY TYPE, 2018-2033 (USD THOUSAND)
TABLE 326 SPAIN EQUINE & PERFORMANCE ANIMAL SEGMENT IN COLOSTRUM MARKET, BY TYPE, 2018-2033 (USD THOUSAND)
TABLE 327 SPAIN VETERINARY & CLINICAL ANIMAL CARE USERS IN COLOSTRUM MARKET, BY TYPE, 2018-2033 (USD THOUSAND)
TABLE 328 SPAIN COLOSTRUM MARKET, BY DISTRIBUTION CHANNEL, 2018-2033 (USD THOUSAND)
TABLE 329 SPAIN COLOSTRUM MARKET, BY DISTRIBUTION CHANNEL, 2018-2033 (TONS)
TABLE 330 SPAIN DIRECT/B2B SALES IN COLOSTRUM MARKET, BY TYPE, 2018-2033 (USD THOUSAND)
TABLE 331 SPAIN ONLINE RETAIL IN COLOSTRUM MARKET, BY TYPE, 2018-2033 (USD THOUSAND)
TABLE 332 SPAIN COLOSTRUM MARKET, BY PACKAGING TYPE, 2018-2033 (USD THOUSAND)
TABLE 333 SPAIN COLOSTRUM MARKET, BY PACKAGING TYPE, 2018-2033 (TONS)
TABLE 334 SPAIN BULK PACKAGING IN COLOSTRUM MARKET, BY TYPE, 2018-2033 (USD THOUSAND)
TABLE 335 SPAIN RETAIL PACKAGING IN COLOSTRUM MARKET, BY TYPE, 2018-2033 (USD THOUSAND)
TABLE 336 SPAIN COLOSTRUM MARKET, BY FUNCTIONALITY, 2018-2033 (USD THOUSAND)
TABLE 337 SPAIN COLOSTRUM MARKET, BY FUNCTIONALITY, 2018-2033 (TONS)
TABLE 338 SPAIN COLOSTRUM MARKET, BY SALES MODEL, 2018-2033 (USD THOUSAND)
TABLE 339 SPAIN COLOSTRUM MARKET, BY SALES MODEL, 2018-2033 (TONS)
TABLE 340 RUSSIA COLOSTRUM MARKET, BY SOURCE TYPE, 2018-2033 (USD THOUSAND)
TABLE 341 RUSSIA COLOSTRUM MARKET, BY SOURCE TYPE, 2018-2033 (TONS)
TABLE 342 RUSSIA BOVINE COLOSTRUM IN COLOSTRUM MARKET, BY TYPE, 2018-2033 (USD THOUSAND)
TABLE 343 RUSSIA COW COLOSTRUM IN COLOSTRUM MARKET, BY TYPE, 2018-2033 (USD THOUSAND)
TABLE 344 RUSSIA COLOSTRUM MARKET, BY NATURE, 2018-2033 (USD THOUSAND)
TABLE 345 RUSSIA COLOSTRUM MARKET, BY NATURE, 2018-2033 (TONS)
TABLE 346 RUSSIA ORGANIC IN COLOSTRUM MARKET, BY TYPE, 2018-2033 (USD THOUSAND)
TABLE 347 RUSSIA COLOSTRUM MARKET, BY PRODUCT FORM, 2018-2033 (USD THOUSAND)
TABLE 348 RUSSIA COLOSTRUM MARKET, BY PRODUCT FORM, 2018-2033 (TONS)
TABLE 349 RUSSIA POWDER IN COLOSTRUM MARKET, BY TYPE, 2018-2033 (USD THOUSAND)
TABLE 350 RUSSIA LIQUID IN COLOSTRUM MARKET, BY TYPE, 2018-2033 (USD THOUSAND)
TABLE 351 RUSSIA COLOSTRUM MARKET, BY IMMUNOGLOBULIN (IGG) CONCENTRATION, 2018-2033 (USD THOUSAND)
TABLE 352 RUSSIA COLOSTRUM MARKET, BY IMMUNOGLOBULIN (IGG) CONCENTRATION, 2018-2033 (TONS)
TABLE 353 RUSSIA COLOSTRUM MARKET, BY PROCESSING TECHNOLOGY, 2018-2033 (USD THOUSAND)
TABLE 354 RUSSIA COLOSTRUM MARKET, BY PROCESSING TECHNOLOGY, 2018-2033 (TONS)
TABLE 355 RUSSIA COLOSTRUM MARKET, BY APPLICATION, 2018-2033 (USD THOUSAND)
TABLE 356 RUSSIA COLOSTRUM MARKET, BY APPLICATION, 2018-2033 (TONS)
TABLE 357 RUSSIA DIETARY SUPPLEMENTS IN COLOSTRUM MARKET, BY TYPE, 2018-2033 (USD THOUSAND)
TABLE 358 RUSSIA SPORTS NUTRITION IN COLOSTRUM MARKET, BY TYPE, 2018-2033 (USD THOUSAND)
TABLE 359 RUSSIA FUNCTIONAL FOOD & BEVERAGES IN COLOSTRUM MARKET, BY TYPE, 2018-2033 (USD THOUSAND)
TABLE 360 RUSSIA INFANT NUTRITION IN COLOSTRUM MARKET, BY TYPE, 2018-2033 (USD THOUSAND)
TABLE 361 RUSSIA PHARMACEUTICALS IN COLOSTRUM MARKET, BY TYPE, 2018-2033 (USD THOUSAND)
TABLE 362 RUSSIA ANIMAL NUTRITION IN COLOSTRUM MARKET, BY TYPE, 2018-2033 (USD THOUSAND)
TABLE 363 RUSSIA COSMETICS & PERSONAL CARE IN COLOSTRUM MARKET, BY TYPE, 2018-2033 (USD THOUSAND)
TABLE 364 RUSSIA COLOSTRUM MARKET, BY END USER, 2018-2033 (USD THOUSAND)
TABLE 365 RUSSIA COLOSTRUM MARKET, BY END USER, 2018-2033 (TONS)
TABLE 366 RUSSIA FOOD IN COLOSTRUM MARKET, BY TYPE, 2018-2033 (USD THOUSAND)
TABLE 367 RUSSIA ADULT SEGMENT IN COLOSTRUM MARKET, BY TYPE, 2018-2033 (USD THOUSAND)
TABLE 368 RUSSIA INFANT & PEDIATRIC SEGMENT IN COLOSTRUM MARKET, BY TYPE, 2018-2033 (USD THOUSAND)
TABLE 369 RUSSIA ELDERLY / GERIATRIC SEGMENT IN COLOSTRUM MARKET, BY TYPE, 2018-2033 (USD THOUSAND)
TABLE 370 RUSSIA FEED IN COLOSTRUM MARKET, BY TYPE, 2018-2033 (USD THOUSAND)
TABLE 371 RUSSIA LIVESTOCK PRODUCERS IN COLOSTRUM MARKET, BY TYPE, 2018-2033 (USD THOUSAND)
TABLE 372 RUSSIA COMPANION ANIMAL OWNERS IN COLOSTRUM MARKET, BY TYPE, 2018-2033 (USD THOUSAND)
TABLE 373 RUSSIA EQUINE & PERFORMANCE ANIMAL SEGMENT IN COLOSTRUM MARKET, BY TYPE, 2018-2033 (USD THOUSAND)
TABLE 374 RUSSIA VETERINARY & CLINICAL ANIMAL CARE USERS IN COLOSTRUM MARKET, BY TYPE, 2018-2033 (USD THOUSAND)
TABLE 375 RUSSIA COLOSTRUM MARKET, BY DISTRIBUTION CHANNEL, 2018-2033 (USD THOUSAND)
TABLE 376 RUSSIA COLOSTRUM MARKET, BY DISTRIBUTION CHANNEL, 2018-2033 (TONS)
TABLE 377 RUSSIA DIRECT/B2B SALES IN COLOSTRUM MARKET, BY TYPE, 2018-2033 (USD THOUSAND)
TABLE 378 RUSSIA ONLINE RETAIL IN COLOSTRUM MARKET, BY TYPE, 2018-2033 (USD THOUSAND)
TABLE 379 RUSSIA COLOSTRUM MARKET, BY PACKAGING TYPE, 2018-2033 (USD THOUSAND)
TABLE 380 RUSSIA COLOSTRUM MARKET, BY PACKAGING TYPE, 2018-2033 (TONS)
TABLE 381 RUSSIA BULK PACKAGING IN COLOSTRUM MARKET, BY TYPE, 2018-2033 (USD THOUSAND)
TABLE 382 RUSSIA RETAIL PACKAGING IN COLOSTRUM MARKET, BY TYPE, 2018-2033 (USD THOUSAND)
TABLE 383 RUSSIA COLOSTRUM MARKET, BY FUNCTIONALITY, 2018-2033 (USD THOUSAND)
TABLE 384 RUSSIA COLOSTRUM MARKET, BY FUNCTIONALITY, 2018-2033 (TONS)
TABLE 385 RUSSIA COLOSTRUM MARKET, BY SALES MODEL, 2018-2033 (USD THOUSAND)
TABLE 386 RUSSIA COLOSTRUM MARKET, BY SALES MODEL, 2018-2033 (TONS)
TABLE 387 SWITZERLAND COLOSTRUM MARKET, BY SOURCE TYPE, 2018-2033 (USD THOUSAND)
TABLE 388 SWITZERLAND COLOSTRUM MARKET, BY SOURCE TYPE, 2018-2033 (TONS)
TABLE 389 SWITZERLAND BOVINE COLOSTRUM IN COLOSTRUM MARKET, BY TYPE, 2018-2033 (USD THOUSAND)
TABLE 390 SWITZERLAND COW COLOSTRUM IN COLOSTRUM MARKET, BY TYPE, 2018-2033 (USD THOUSAND)
TABLE 391 SWITZERLAND COLOSTRUM MARKET, BY NATURE, 2018-2033 (USD THOUSAND)
TABLE 392 SWITZERLAND COLOSTRUM MARKET, BY NATURE, 2018-2033 (TONS)
TABLE 393 SWITZERLAND ORGANIC IN COLOSTRUM MARKET, BY TYPE, 2018-2033 (USD THOUSAND)
TABLE 394 SWITZERLAND COLOSTRUM MARKET, BY PRODUCT FORM, 2018-2033 (USD THOUSAND)
TABLE 395 SWITZERLAND COLOSTRUM MARKET, BY PRODUCT FORM, 2018-2033 (TONS)
TABLE 396 SWITZERLAND POWDER IN COLOSTRUM MARKET, BY TYPE, 2018-2033 (USD THOUSAND)
TABLE 397 SWITZERLAND LIQUID IN COLOSTRUM MARKET, BY TYPE, 2018-2033 (USD THOUSAND)
TABLE 398 SWITZERLAND COLOSTRUM MARKET, BY IMMUNOGLOBULIN (IGG) CONCENTRATION, 2018-2033 (USD THOUSAND)
TABLE 399 SWITZERLAND COLOSTRUM MARKET, BY IMMUNOGLOBULIN (IGG) CONCENTRATION, 2018-2033 (TONS)
TABLE 400 SWITZERLAND COLOSTRUM MARKET, BY PROCESSING TECHNOLOGY, 2018-2033 (USD THOUSAND)
TABLE 401 SWITZERLAND COLOSTRUM MARKET, BY PRODUCT FORM, 2018-2033 (TONS)
TABLE 402 SWITZERLAND COLOSTRUM MARKET, BY APPLICATION, 2018-2033 (USD THOUSAND)
TABLE 403 SWITZERLAND COLOSTRUM MARKET, BY APPLICATION, 2018-2033 (TONS)
TABLE 404 SWITZERLAND DIETARY SUPPLEMENTS IN COLOSTRUM MARKET, BY TYPE, 2018-2033 (USD THOUSAND)
TABLE 405 SWITZERLAND SPORTS NUTRITION IN COLOSTRUM MARKET, BY TYPE, 2018-2033 (USD THOUSAND)
TABLE 406 SWITZERLAND FUNCTIONAL FOOD & BEVERAGES IN COLOSTRUM MARKET, BY TYPE, 2018-2033 (USD THOUSAND)
TABLE 407 SWITZERLAND INFANT NUTRITION IN COLOSTRUM MARKET, BY TYPE, 2018-2033 (USD THOUSAND)
TABLE 408 SWITZERLAND PHARMACEUTICALS IN COLOSTRUM MARKET, BY TYPE, 2018-2033 (USD THOUSAND)
TABLE 409 SWITZERLAND ANIMAL NUTRITION IN COLOSTRUM MARKET, BY TYPE, 2018-2033 (USD THOUSAND)
TABLE 410 SWITZERLAND COSMETICS & PERSONAL CARE IN COLOSTRUM MARKET, BY TYPE, 2018-2033 (USD THOUSAND)
TABLE 411 SWITZERLAND COLOSTRUM MARKET, BY END USER, 2018-2033 (USD THOUSAND)
TABLE 412 SWITZERLAND COLOSTRUM MARKET, BY END USER, 2018-2033 (TONS)
TABLE 413 SWITZERLAND FOOD IN COLOSTRUM MARKET, BY TYPE, 2018-2033 (USD THOUSAND)
TABLE 414 SWITZERLAND ADULT SEGMENT IN COLOSTRUM MARKET, BY TYPE, 2018-2033 (USD THOUSAND)
TABLE 415 SWITZERLAND INFANT & PEDIATRIC SEGMENT IN COLOSTRUM MARKET, BY TYPE, 2018-2033 (USD THOUSAND)
TABLE 416 SWITZERLAND ELDERLY / GERIATRIC SEGMENT IN COLOSTRUM MARKET, BY TYPE, 2018-2033 (USD THOUSAND)
TABLE 417 SWITZERLAND FEED IN COLOSTRUM MARKET, BY TYPE, 2018-2033 (USD THOUSAND)
TABLE 418 SWITZERLAND LIVESTOCK PRODUCERS IN COLOSTRUM MARKET, BY TYPE, 2018-2033 (USD THOUSAND)
TABLE 419 SWITZERLAND COMPANION ANIMAL OWNERS IN COLOSTRUM MARKET, BY TYPE, 2018-2033 (USD THOUSAND)
TABLE 420 SWITZERLAND EQUINE & PERFORMANCE ANIMAL SEGMENT IN COLOSTRUM MARKET, BY TYPE, 2018-2033 (USD THOUSAND)
TABLE 421 SWITZERLAND VETERINARY & CLINICAL ANIMAL CARE USERS IN COLOSTRUM MARKET, BY TYPE, 2018-2033 (USD THOUSAND)
TABLE 422 SWITZERLAND COLOSTRUM MARKET, BY DISTRIBUTION CHANNEL, 2018-2033 (USD THOUSAND)
TABLE 423 SWITZERLAND COLOSTRUM MARKET, BY DISTRIBUTION CHANNEL, 2018-2033 (TONS)
TABLE 424 SWITZERLAND DIRECT/B2B SALES IN COLOSTRUM MARKET, BY TYPE, 2018-2033 (USD THOUSAND)
TABLE 425 SWITZERLAND ONLINE RETAIL IN COLOSTRUM MARKET, BY TYPE, 2018-2033 (USD THOUSAND)
TABLE 426 SWITZERLAND COLOSTRUM MARKET, BY PACKAGING TYPE, 2018-2033 (USD THOUSAND)
TABLE 427 SWITZERLAND COLOSTRUM MARKET, BY PACKAGING TYPE, 2018-2033 (TONS)
TABLE 428 SWITZERLAND BULK PACKAGING IN COLOSTRUM MARKET, BY TYPE, 2018-2033 (USD THOUSAND)
TABLE 429 SWITZERLAND RETAIL PACKAGING IN COLOSTRUM MARKET, BY TYPE, 2018-2033 (USD THOUSAND)
TABLE 430 SWITZERLAND COLOSTRUM MARKET, BY FUNCTIONALITY, 2018-2033 (USD THOUSAND)
TABLE 431 SWITZERLAND COLOSTRUM MARKET, BY FUNCTIONALITY, 2018-2033 (TONS)
TABLE 432 SWITZERLAND COLOSTRUM MARKET, BY SALES MODEL, 2018-2033 (USD THOUSAND)
TABLE 433 SWITZERLAND COLOSTRUM MARKET, BY SALES MODEL, 2018-2033 (TONS)
TABLE 434 SWEDEN COLOSTRUM MARKET, BY SOURCE TYPE, 2018-2033 (USD THOUSAND)
TABLE 435 SWEDEN COLOSTRUM MARKET, BY SOURCE TYPE, 2018-2033 (TONS)
TABLE 436 SWEDEN BOVINE COLOSTRUM IN COLOSTRUM MARKET, BY TYPE, 2018-2033 (USD THOUSAND)
TABLE 437 SWEDEN COW COLOSTRUM IN COLOSTRUM MARKET, BY TYPE, 2018-2033 (USD THOUSAND)
TABLE 438 SWEDEN COLOSTRUM MARKET, BY NATURE, 2018-2033 (USD THOUSAND)
TABLE 439 SWEDEN COLOSTRUM MARKET, BY NATURE, 2018-2033 (TONS)
TABLE 440 SWEDEN ORGANIC IN COLOSTRUM MARKET, BY TYPE, 2018-2033 (USD THOUSAND)
TABLE 441 SWEDEN COLOSTRUM MARKET, BY PRODUCT FORM, 2018-2033 (USD THOUSAND)
TABLE 442 SWEDEN COLOSTRUM MARKET, BY PRODUCT FORM, 2018-2033 (TONS)
TABLE 443 SWEDEN POWDER IN COLOSTRUM MARKET, BY TYPE, 2018-2033 (USD THOUSAND)
TABLE 444 SWEDEN LIQUID IN COLOSTRUM MARKET, BY TYPE, 2018-2033 (USD THOUSAND)
TABLE 445 SWEDEN COLOSTRUM MARKET, BY IMMUNOGLOBULIN (IGG) CONCENTRATION, 2018-2033 (USD THOUSAND)
TABLE 446 SWEDEN COLOSTRUM MARKET, BY IMMUNOGLOBULIN (IGG) CONCENTRATION, 2018-2033 (TONS)
TABLE 447 SWEDEN COLOSTRUM MARKET, BY PROCESSING TECHNOLOGY, 2018-2033 (USD THOUSAND)
TABLE 448 SWEDEN COLOSTRUM MARKET, BY PROCESSING TECHNOLOGY, 2018-2033 (TONS)
TABLE 449 SWEDEN COLOSTRUM MARKET, BY APPLICATION, 2018-2033 (USD THOUSAND)
TABLE 450 SWEDEN COLOSTRUM MARKET, BY APPLICATION, 2018-2033 (TONS)
TABLE 451 SWEDEN DIETARY SUPPLEMENTS IN COLOSTRUM MARKET, BY TYPE, 2018-2033 (USD THOUSAND)
TABLE 452 SWEDEN SPORTS NUTRITION IN COLOSTRUM MARKET, BY TYPE, 2018-2033 (USD THOUSAND)
TABLE 453 SWEDEN FUNCTIONAL FOOD & BEVERAGES IN COLOSTRUM MARKET, BY TYPE, 2018-2033 (USD THOUSAND)
TABLE 454 SWEDEN INFANT NUTRITION IN COLOSTRUM MARKET, BY TYPE, 2018-2033 (USD THOUSAND)
TABLE 455 SWEDEN PHARMACEUTICALS IN COLOSTRUM MARKET, BY TYPE, 2018-2033 (USD THOUSAND)
TABLE 456 SWEDEN ANIMAL NUTRITION IN COLOSTRUM MARKET, BY TYPE, 2018-2033 (USD THOUSAND)
TABLE 457 SWEDEN COSMETICS & PERSONAL CARE IN COLOSTRUM MARKET, BY TYPE, 2018-2033 (USD THOUSAND)
TABLE 458 SWEDEN COLOSTRUM MARKET, BY END USER, 2018-2033 (USD THOUSAND)
TABLE 459 SWEDEN COLOSTRUM MARKET, BY END USER, 2018-2033 (TONS)
TABLE 460 SWEDEN FOOD IN COLOSTRUM MARKET, BY TYPE, 2018-2033 (USD THOUSAND)
TABLE 461 SWEDEN ADULT SEGMENT IN COLOSTRUM MARKET, BY TYPE, 2018-2033 (USD THOUSAND)
TABLE 462 SWEDEN INFANT & PEDIATRIC SEGMENT IN COLOSTRUM MARKET, BY TYPE, 2018-2033 (USD THOUSAND)
TABLE 463 SWEDEN ELDERLY / GERIATRIC SEGMENT IN COLOSTRUM MARKET, BY TYPE, 2018-2033 (USD THOUSAND)
TABLE 464 SWEDEN FEED IN COLOSTRUM MARKET, BY TYPE, 2018-2033 (USD THOUSAND)
TABLE 465 SWEDEN LIVESTOCK PRODUCERS IN COLOSTRUM MARKET, BY TYPE, 2018-2033 (USD THOUSAND)
TABLE 466 SWEDEN COMPANION ANIMAL OWNERS IN COLOSTRUM MARKET, BY TYPE, 2018-2033 (USD THOUSAND)
TABLE 467 SWEDEN EQUINE & PERFORMANCE ANIMAL SEGMENT IN COLOSTRUM MARKET, BY TYPE, 2018-2033 (USD THOUSAND)
TABLE 468 SWEDEN VETERINARY & CLINICAL ANIMAL CARE USERS IN COLOSTRUM MARKET, BY TYPE, 2018-2033 (USD THOUSAND)
TABLE 469 SWEDEN COLOSTRUM MARKET, BY DISTRIBUTION CHANNEL, 2018-2033 (USD THOUSAND)
TABLE 470 SWEDEN COLOSTRUM MARKET, BY DISTRIBUTION CHANNEL, 2018-2033 (TONS)
TABLE 471 SWEDEN DIRECT/B2B SALES IN COLOSTRUM MARKET, BY TYPE, 2018-2033 (USD THOUSAND)
TABLE 472 SWEDEN ONLINE RETAIL IN COLOSTRUM MARKET, BY TYPE, 2018-2033 (USD THOUSAND)
TABLE 473 SWEDEN COLOSTRUM MARKET, BY PACKAGING TYPE, 2018-2033 (USD THOUSAND)
TABLE 474 SWEDEN COLOSTRUM MARKET, BY PACKAGING TYPE, 2018-2033 (TONS)
TABLE 475 SWEDEN BULK PACKAGING IN COLOSTRUM MARKET, BY TYPE, 2018-2033 (USD THOUSAND)
TABLE 476 SWEDEN RETAIL PACKAGING IN COLOSTRUM MARKET, BY TYPE, 2018-2033 (USD THOUSAND)
TABLE 477 SWEDEN COLOSTRUM MARKET, BY FUNCTIONALITY, 2018-2033 (USD THOUSAND)
TABLE 478 SWEDEN COLOSTRUM MARKET, BY FUNCTIONALITY, 2018-2033 (TONS)
TABLE 479 SWEDEN COLOSTRUM MARKET, BY SALES MODEL, 2018-2033 (USD THOUSAND)
TABLE 480 SWEDEN COLOSTRUM MARKET, BY SALES MODEL, 2018-2033 (TONS)
TABLE 481 DENMARK COLOSTRUM MARKET, BY SOURCE TYPE, 2018-2033 (USD THOUSAND)
TABLE 482 DENMARK COLOSTRUM MARKET, BY SOURCE TYPE, 2018-2033 (TONS)
TABLE 483 DENMARK BOVINE COLOSTRUM IN COLOSTRUM MARKET, BY TYPE, 2018-2033 (USD THOUSAND)
TABLE 484 DENMARK COW COLOSTRUM IN COLOSTRUM MARKET, BY TYPE, 2018-2033 (USD THOUSAND)
TABLE 485 DENMARK COLOSTRUM MARKET, BY NATURE, 2018-2033 (USD THOUSAND)
TABLE 486 DENMARK COLOSTRUM MARKET, BY NATURE, 2018-2033 (TONS)
TABLE 487 DENMARK ORGANIC IN COLOSTRUM MARKET, BY TYPE, 2018-2033 (USD THOUSAND)
TABLE 488 DENMARK COLOSTRUM MARKET, BY PRODUCT FORM, 2018-2033 (USD THOUSAND)
TABLE 489 DENMARK COLOSTRUM MARKET, BY PRODUCT FORM, 2018-2033 (TONS)
TABLE 490 DENMARK POWDER IN COLOSTRUM MARKET, BY TYPE, 2018-2033 (USD THOUSAND)
TABLE 491 DENMARK LIQUID IN COLOSTRUM MARKET, BY TYPE, 2018-2033 (USD THOUSAND)
TABLE 492 DENMARK COLOSTRUM MARKET, BY IMMUNOGLOBULIN (IGG) CONCENTRATION, 2018-2033 (USD THOUSAND)
TABLE 493 DENMARK COLOSTRUM MARKET, BY IMMUNOGLOBULIN (IGG) CONCENTRATION, 2018-2033 (TONS)
TABLE 494 DENMARK COLOSTRUM MARKET, BY PROCESSING TECHNOLOGY, 2018-2033 (USD THOUSAND)
TABLE 495 DENMARK COLOSTRUM MARKET, BY PROCESSING TECHNOLOGY, 2018-2033 (TONS)
TABLE 496 DENMARK COLOSTRUM MARKET, BY APPLICATION, 2018-2033 (USD THOUSAND)
TABLE 497 DENMARK COLOSTRUM MARKET, BY APPLICATION, 2018-2033 (TONS)
TABLE 498 DENMARK DIETARY SUPPLEMENTS IN COLOSTRUM MARKET, BY TYPE, 2018-2033 (USD THOUSAND)
TABLE 499 DENMARK SPORTS NUTRITION IN COLOSTRUM MARKET, BY TYPE, 2018-2033 (USD THOUSAND)
TABLE 500 DENMARK FUNCTIONAL FOOD & BEVERAGES IN COLOSTRUM MARKET, BY TYPE, 2018-2033 (USD THOUSAND)
TABLE 501 DENMARK INFANT NUTRITION IN COLOSTRUM MARKET, BY TYPE, 2018-2033 (USD THOUSAND)
TABLE 502 DENMARK PHARMACEUTICALS IN COLOSTRUM MARKET, BY TYPE, 2018-2033 (USD THOUSAND)
TABLE 503 DENMARK ANIMAL NUTRITION IN COLOSTRUM MARKET, BY TYPE, 2018-2033 (USD THOUSAND)
TABLE 504 DENMARK COSMETICS & PERSONAL CARE IN COLOSTRUM MARKET, BY TYPE, 2018-2033 (USD THOUSAND)
TABLE 505 DENMARK COLOSTRUM MARKET, BY END USER, 2018-2033 (USD THOUSAND)
TABLE 506 DENMARK COLOSTRUM MARKET, BY END USER, 2018-2033 (TONS)
TABLE 507 DENMARK FOOD IN COLOSTRUM MARKET, BY TYPE, 2018-2033 (USD THOUSAND)
TABLE 508 DENMARK ADULT SEGMENT IN COLOSTRUM MARKET, BY TYPE, 2018-2033 (USD THOUSAND)
TABLE 509 DENMARK INFANT & PEDIATRIC SEGMENT IN COLOSTRUM MARKET, BY TYPE, 2018-2033 (USD THOUSAND)
TABLE 510 DENMARK ELDERLY / GERIATRIC SEGMENT IN COLOSTRUM MARKET, BY TYPE, 2018-2033 (USD THOUSAND)
TABLE 511 DENMARK FEED IN COLOSTRUM MARKET, BY TYPE, 2018-2033 (USD THOUSAND)
TABLE 512 DENMARK LIVESTOCK PRODUCERS IN COLOSTRUM MARKET, BY TYPE, 2018-2033 (USD THOUSAND)
TABLE 513 DENMARK COMPANION ANIMAL OWNERS IN COLOSTRUM MARKET, BY TYPE, 2018-2033 (USD THOUSAND)
TABLE 514 DENMARK EQUINE & PERFORMANCE ANIMAL SEGMENT IN COLOSTRUM MARKET, BY TYPE, 2018-2033 (USD THOUSAND)
TABLE 515 DENMARK VETERINARY & CLINICAL ANIMAL CARE USERS IN COLOSTRUM MARKET, BY TYPE, 2018-2033 (USD THOUSAND)
TABLE 516 DENMARK COLOSTRUM MARKET, BY DISTRIBUTION CHANNEL, 2018-2033 (USD THOUSAND)
TABLE 517 DENMARK COLOSTRUM MARKET, BY DISTRIBUTION CHANNEL, 2018-2033 (TONS)
TABLE 518 DENMARK DIRECT/B2B SALES IN COLOSTRUM MARKET, BY TYPE, 2018-2033 (USD THOUSAND)
TABLE 519 DENMARK ONLINE RETAIL IN COLOSTRUM MARKET, BY TYPE, 2018-2033 (USD THOUSAND)
TABLE 520 DENMARK COLOSTRUM MARKET, BY PACKAGING TYPE, 2018-2033 (USD THOUSAND)
TABLE 521 DENMARK COLOSTRUM MARKET, BY PACKAGING TYPE, 2018-2033 (TONS)
TABLE 522 DENMARK BULK PACKAGING IN COLOSTRUM MARKET, BY TYPE, 2018-2033 (USD THOUSAND)
TABLE 523 DENMARK RETAIL PACKAGING IN COLOSTRUM MARKET, BY TYPE, 2018-2033 (USD THOUSAND)
TABLE 524 DENMARK COLOSTRUM MARKET, BY FUNCTIONALITY, 2018-2033 (USD THOUSAND)
TABLE 525 DENMARK COLOSTRUM MARKET, BY FUNCTIONALITY, 2018-2033 (TONS)
TABLE 526 DENMARK COLOSTRUM MARKET, BY SALES MODEL, 2018-2033 (USD THOUSAND)
TABLE 527 DENMARK COLOSTRUM MARKET, BY SALES MODEL, 2018-2033 (TONS)
TABLE 528 BELGIUM COLOSTRUM MARKET, BY SOURCE TYPE, 2018-2033 (USD THOUSAND)
TABLE 529 BELGIUM COLOSTRUM MARKET, BY SOURCE TYPE, 2018-2033 (TONS)
TABLE 530 BELGIUM BOVINE COLOSTRUM IN COLOSTRUM MARKET, BY TYPE, 2018-2033 (USD THOUSAND)
TABLE 531 BELGIUM COW COLOSTRUM IN COLOSTRUM MARKET, BY TYPE, 2018-2033 (USD THOUSAND)
TABLE 532 BELGIUM COLOSTRUM MARKET, BY NATURE, 2018-2033 (USD THOUSAND)
TABLE 533 BELGIUM COLOSTRUM MARKET, BY NATURE, 2018-2033 (TONS)
TABLE 534 BELGIUM ORGANIC IN COLOSTRUM MARKET, BY TYPE, 2018-2033 (USD THOUSAND)
TABLE 535 BELGIUM COLOSTRUM MARKET, BY PRODUCT FORM, 2018-2033 (USD THOUSAND)
TABLE 536 BELGIUM COLOSTRUM MARKET, BY PRODUCT FORM, 2018-2033 (TONS)
TABLE 537 BELGIUM POWDER IN COLOSTRUM MARKET, BY TYPE, 2018-2033 (USD THOUSAND)
TABLE 538 BELGIUM LIQUID IN COLOSTRUM MARKET, BY TYPE, 2018-2033 (USD THOUSAND)
TABLE 539 BELGIUM COLOSTRUM MARKET, BY IMMUNOGLOBULIN (IGG) CONCENTRATION, 2018-2033 (USD THOUSAND)
TABLE 540 BELGIUM COLOSTRUM MARKET, BY IMMUNOGLOBULIN (IGG) CONCENTRATION, 2018-2033 (TONS)
TABLE 541 BELGIUM COLOSTRUM MARKET, BY PROCESSING TECHNOLOGY, 2018-2033 (USD THOUSAND)
TABLE 542 BELGIUM COLOSTRUM MARKET, BY PROCESSING TECHNOLOGY, 2018-2033 (TONS)
TABLE 543 BELGIUM COLOSTRUM MARKET, BY APPLICATION, 2018-2033 (USD THOUSAND)
TABLE 544 BELGIUM COLOSTRUM MARKET, BY APPLICATION, 2018-2033 (TONS)
TABLE 545 BELGIUM DIETARY SUPPLEMENTS IN COLOSTRUM MARKET, BY TYPE, 2018-2033 (USD THOUSAND)
TABLE 546 BELGIUM SPORTS NUTRITION IN COLOSTRUM MARKET, BY TYPE, 2018-2033 (USD THOUSAND)
TABLE 547 BELGIUM FUNCTIONAL FOOD & BEVERAGES IN COLOSTRUM MARKET, BY TYPE, 2018-2033 (USD THOUSAND)
TABLE 548 BELGIUM INFANT NUTRITION IN COLOSTRUM MARKET, BY TYPE, 2018-2033 (USD THOUSAND)
TABLE 549 BELGIUM PHARMACEUTICALS IN COLOSTRUM MARKET, BY TYPE, 2018-2033 (USD THOUSAND)
TABLE 550 BELGIUM ANIMAL NUTRITION IN COLOSTRUM MARKET, BY TYPE, 2018-2033 (USD THOUSAND)
TABLE 551 BELGIUM COSMETICS & PERSONAL CARE IN COLOSTRUM MARKET, BY TYPE, 2018-2033 (USD THOUSAND)
TABLE 552 BELGIUM COLOSTRUM MARKET, BY END USER, 2018-2033 (USD THOUSAND)
TABLE 553 BELGIUM COLOSTRUM MARKET, BY END USER, 2018-2033 (TONS)
TABLE 554 BELGIUM FOOD IN COLOSTRUM MARKET, BY TYPE, 2018-2033 (USD THOUSAND)
TABLE 555 BELGIUM ADULT SEGMENT IN COLOSTRUM MARKET, BY TYPE, 2018-2033 (USD THOUSAND)
TABLE 556 BELGIUM INFANT & PEDIATRIC SEGMENT IN COLOSTRUM MARKET, BY TYPE, 2018-2033 (USD THOUSAND)
TABLE 557 BELGIUM ELDERLY / GERIATRIC SEGMENT IN COLOSTRUM MARKET, BY TYPE, 2018-2033 (USD THOUSAND)
TABLE 558 BELGIUM FEED IN COLOSTRUM MARKET, BY TYPE, 2018-2033 (USD THOUSAND)
TABLE 559 BELGIUM LIVESTOCK PRODUCERS IN COLOSTRUM MARKET, BY TYPE, 2018-2033 (USD THOUSAND)
TABLE 560 BELGIUM COMPANION ANIMAL OWNERS IN COLOSTRUM MARKET, BY TYPE, 2018-2033 (USD THOUSAND)
TABLE 561 BELGIUM EQUINE & PERFORMANCE ANIMAL SEGMENT IN COLOSTRUM MARKET, BY TYPE, 2018-2033 (USD THOUSAND)
TABLE 562 BELGIUM VETERINARY & CLINICAL ANIMAL CARE USERS IN COLOSTRUM MARKET, BY TYPE, 2018-2033 (USD THOUSAND)
TABLE 563 BELGIUM COLOSTRUM MARKET, BY DISTRIBUTION CHANNEL, 2018-2033 (USD THOUSAND)
TABLE 564 BELGIUM COLOSTRUM MARKET, BY DISTRIBUTION CHANNEL, 2018-2033 (TONS)
TABLE 565 BELGIUM DIRECT/B2B SALES IN COLOSTRUM MARKET, BY TYPE, 2018-2033 (USD THOUSAND)
TABLE 566 BELGIUM ONLINE RETAIL IN COLOSTRUM MARKET, BY TYPE, 2018-2033 (USD THOUSAND)
TABLE 567 BELGIUM COLOSTRUM MARKET, BY PACKAGING TYPE, 2018-2033 (USD THOUSAND)
TABLE 568 BELGIUM COLOSTRUM MARKET, BY PACKAGING TYPE, 2018-2033 (TONS)
TABLE 569 BELGIUM BULK PACKAGING IN COLOSTRUM MARKET, BY TYPE, 2018-2033 (USD THOUSAND)
TABLE 570 BELGIUM RETAIL PACKAGING IN COLOSTRUM MARKET, BY TYPE, 2018-2033 (USD THOUSAND)
TABLE 571 BELGIUM COLOSTRUM MARKET, BY FUNCTIONALITY, 2018-2033 (USD THOUSAND)
TABLE 572 BELGIUM COLOSTRUM MARKET, BY FUNCTIONALITY, 2018-2033 (TONS)
TABLE 573 BELGIUM COLOSTRUM MARKET, BY SALES MODEL, 2018-2033 (USD THOUSAND)
TABLE 574 BELGIUM COLOSTRUM MARKET, BY SALES MODEL, 2018-2033 (TONS)
TABLE 575 TURKEY COLOSTRUM MARKET, BY SOURCE TYPE, 2018-2033 (USD THOUSAND)
TABLE 576 TURKEY COLOSTRUM MARKET, BY SOURCE TYPE, 2018-2033 (TONS)
TABLE 577 TURKEY BOVINE COLOSTRUM IN COLOSTRUM MARKET, BY TYPE, 2018-2033 (USD THOUSAND)
TABLE 578 TURKEY COW COLOSTRUM IN COLOSTRUM MARKET, BY TYPE, 2018-2033 (USD THOUSAND)
TABLE 579 TURKEY COLOSTRUM MARKET, BY NATURE, 2018-2033 (USD THOUSAND)
TABLE 580 TURKEY COLOSTRUM MARKET, BY NATURE, 2018-2033 (TONS)
TABLE 581 TURKEY ORGANIC IN COLOSTRUM MARKET, BY TYPE, 2018-2033 (USD THOUSAND)
TABLE 582 TURKEY COLOSTRUM MARKET, BY PRODUCT FORM, 2018-2033 (USD THOUSAND)
TABLE 583 TURKEY COLOSTRUM MARKET, BY PRODUCT FORM, 2018-2033 (TONS)
TABLE 584 TURKEY POWDER IN COLOSTRUM MARKET, BY TYPE, 2018-2033 (USD THOUSAND)
TABLE 585 TURKEY LIQUID IN COLOSTRUM MARKET, BY TYPE, 2018-2033 (USD THOUSAND)
TABLE 586 TURKEY COLOSTRUM MARKET, BY IMMUNOGLOBULIN (IGG) CONCENTRATION, 2018-2033 (USD THOUSAND)
TABLE 587 TURKEY COLOSTRUM MARKET, BY IMMUNOGLOBULIN (IGG) CONCENTRATION, 2018-2033 (TONS)
TABLE 588 TURKEY COLOSTRUM MARKET, BY PROCESSING TECHNOLOGY, 2018-2033 (USD THOUSAND)
TABLE 589 TURKEY COLOSTRUM MARKET, BY PROCESSING TECHNOLOGY, 2018-2033 (TONS)
TABLE 590 TURKEY COLOSTRUM MARKET, BY APPLICATION, 2018-2033 (USD THOUSAND)
TABLE 591 TURKEY COLOSTRUM MARKET, BY APPLICATION, 2018-2033 (TONS)
TABLE 592 TURKEY DIETARY SUPPLEMENTS IN COLOSTRUM MARKET, BY TYPE, 2018-2033 (USD THOUSAND)
TABLE 593 TURKEY SPORTS NUTRITION IN COLOSTRUM MARKET, BY TYPE, 2018-2033 (USD THOUSAND)
TABLE 594 TURKEY FUNCTIONAL FOOD & BEVERAGES IN COLOSTRUM MARKET, BY TYPE, 2018-2033 (USD THOUSAND)
TABLE 595 TURKEY INFANT NUTRITION IN COLOSTRUM MARKET, BY TYPE, 2018-2033 (USD THOUSAND)
TABLE 596 TURKEY PHARMACEUTICALS IN COLOSTRUM MARKET, BY TYPE, 2018-2033 (USD THOUSAND)
TABLE 597 TURKEY ANIMAL NUTRITION IN COLOSTRUM MARKET, BY TYPE, 2018-2033 (USD THOUSAND)
TABLE 598 TURKEY COSMETICS & PERSONAL CARE IN COLOSTRUM MARKET, BY TYPE, 2018-2033 (USD THOUSAND)
TABLE 599 TURKEY COLOSTRUM MARKET, BY END USER, 2018-2033 (USD THOUSAND)
TABLE 600 TURKEY COLOSTRUM MARKET, BY END USER, 2018-2033 (TONS)
TABLE 601 TURKEY FOOD IN COLOSTRUM MARKET, BY TYPE, 2018-2033 (USD THOUSAND)
TABLE 602 TURKEY ADULT SEGMENT IN COLOSTRUM MARKET, BY TYPE, 2018-2033 (USD THOUSAND)
TABLE 603 TURKEY INFANT & PEDIATRIC SEGMENT IN COLOSTRUM MARKET, BY TYPE, 2018-2033 (USD THOUSAND)
TABLE 604 TURKEY ELDERLY / GERIATRIC SEGMENT IN COLOSTRUM MARKET, BY TYPE, 2018-2033 (USD THOUSAND)
TABLE 605 TURKEY FEED IN COLOSTRUM MARKET, BY TYPE, 2018-2033 (USD THOUSAND)
TABLE 606 TURKEY LIVESTOCK PRODUCERS IN COLOSTRUM MARKET, BY TYPE, 2018-2033 (USD THOUSAND)
TABLE 607 TURKEY COMPANION ANIMAL OWNERS IN COLOSTRUM MARKET, BY TYPE, 2018-2033 (USD THOUSAND)
TABLE 608 TURKEY EQUINE & PERFORMANCE ANIMAL SEGMENT IN COLOSTRUM MARKET, BY TYPE, 2018-2033 (USD THOUSAND)
TABLE 609 TURKEY VETERINARY & CLINICAL ANIMAL CARE USERS IN COLOSTRUM MARKET, BY TYPE, 2018-2033 (USD THOUSAND)
TABLE 610 TURKEY COLOSTRUM MARKET, BY DISTRIBUTION CHANNEL, 2018-2033 (USD THOUSAND)
TABLE 611 TURKEY COLOSTRUM MARKET, BY DISTRIBUTION CHANNEL, 2018-2033 (TONS)
TABLE 612 TURKEY DIRECT/B2B SALES IN COLOSTRUM MARKET, BY TYPE, 2018-2033 (USD THOUSAND)
TABLE 613 TURKEY ONLINE RETAIL IN COLOSTRUM MARKET, BY TYPE, 2018-2033 (USD THOUSAND)
TABLE 614 TURKEY COLOSTRUM MARKET, BY PACKAGING TYPE, 2018-2033 (USD THOUSAND)
TABLE 615 TURKEY COLOSTRUM MARKET, BY PACKAGING TYPE, 2018-2033 (TONS)
TABLE 616 TURKEY BULK PACKAGING IN COLOSTRUM MARKET, BY TYPE, 2018-2033 (USD THOUSAND)
TABLE 617 TURKEY RETAIL PACKAGING IN COLOSTRUM MARKET, BY TYPE, 2018-2033 (USD THOUSAND)
TABLE 618 TURKEY COLOSTRUM MARKET, BY FUNCTIONALITY, 2018-2033 (USD THOUSAND)
TABLE 619 TURKEY COLOSTRUM MARKET, BY FUNCTIONALITY, 2018-2033 (TONS)
TABLE 620 TURKEY COLOSTRUM MARKET, BY SALES MODEL, 2018-2033 (USD THOUSAND)
TABLE 621 TURKEY COLOSTRUM MARKET, BY SALES MODEL, 2018-2033 (TONS)
TABLE 622 NORWAY COLOSTRUM MARKET, BY SOURCE TYPE, 2018-2033 (USD THOUSAND)
TABLE 623 NORWAY COLOSTRUM MARKET, BY SOURCE TYPE, 2018-2033 (TONS)
TABLE 624 NORWAY BOVINE COLOSTRUM IN COLOSTRUM MARKET, BY TYPE, 2018-2033 (USD THOUSAND)
TABLE 625 NORWAY COW COLOSTRUM IN COLOSTRUM MARKET, BY TYPE, 2018-2033 (USD THOUSAND)
TABLE 626 NORWAY COLOSTRUM MARKET, BY NATURE, 2018-2033 (USD THOUSAND)
TABLE 627 NORWAY COLOSTRUM MARKET, BY NATURE, 2018-2033 (TONS)
TABLE 628 NORWAY ORGANIC IN COLOSTRUM MARKET, BY TYPE, 2018-2033 (USD THOUSAND)
TABLE 629 NORWAY COLOSTRUM MARKET, BY PRODUCT FORM, 2018-2033 (USD THOUSAND)
TABLE 630 NORWAY COLOSTRUM MARKET, BY PRODUCT FORM, 2018-2033 (TONS)
TABLE 631 NORWAY POWDER IN COLOSTRUM MARKET, BY TYPE, 2018-2033 (USD THOUSAND)
TABLE 632 NORWAY LIQUID IN COLOSTRUM MARKET, BY TYPE, 2018-2033 (USD THOUSAND)
TABLE 633 NORWAY COLOSTRUM MARKET, BY IMMUNOGLOBULIN (IGG) CONCENTRATION, 2018-2033 (USD THOUSAND)
TABLE 634 NORWAY COLOSTRUM MARKET, BY IMMUNOGLOBULIN (IGG) CONCENTRATION, 2018-2033 (TONS)
TABLE 635 NORWAY COLOSTRUM MARKET, BY PROCESSING TECHNOLOGY, 2018-2033 (USD THOUSAND)
TABLE 636 NORWAY COLOSTRUM MARKET, BY PROCESSING TECHNOLOGY, 2018-2033 (TONS)
TABLE 637 NORWAY COLOSTRUM MARKET, BY APPLICATION, 2018-2033 (USD THOUSAND)
TABLE 638 NORWAY COLOSTRUM MARKET, BY APPLICATION, 2018-2033 (TONS)
TABLE 639 NORWAY DIETARY SUPPLEMENTS IN COLOSTRUM MARKET, BY TYPE, 2018-2033 (USD THOUSAND)
TABLE 640 NORWAY SPORTS NUTRITION IN COLOSTRUM MARKET, BY TYPE, 2018-2033 (USD THOUSAND)
TABLE 641 NORWAY FUNCTIONAL FOOD & BEVERAGES IN COLOSTRUM MARKET, BY TYPE, 2018-2033 (USD THOUSAND)
TABLE 642 NORWAY INFANT NUTRITION IN COLOSTRUM MARKET, BY TYPE, 2018-2033 (USD THOUSAND)
TABLE 643 NORWAY PHARMACEUTICALS IN COLOSTRUM MARKET, BY TYPE, 2018-2033 (USD THOUSAND)
TABLE 644 NORWAY ANIMAL NUTRITION IN COLOSTRUM MARKET, BY TYPE, 2018-2033 (USD THOUSAND)
TABLE 645 NORWAY COSMETICS & PERSONAL CARE IN COLOSTRUM MARKET, BY TYPE, 2018-2033 (USD THOUSAND)
TABLE 646 NORWAY COLOSTRUM MARKET, BY END USER, 2018-2033 (USD THOUSAND)
TABLE 647 NORWAY COLOSTRUM MARKET, BY END USER, 2018-2033 (TONS)
TABLE 648 NORWAY FOOD IN COLOSTRUM MARKET, BY TYPE, 2018-2033 (USD THOUSAND)
TABLE 649 NORWAY ADULT SEGMENT IN COLOSTRUM MARKET, BY TYPE, 2018-2033 (USD THOUSAND)
TABLE 650 NORWAY INFANT & PEDIATRIC SEGMENT IN COLOSTRUM MARKET, BY TYPE, 2018-2033 (USD THOUSAND)
TABLE 651 NORWAY ELDERLY / GERIATRIC SEGMENT IN COLOSTRUM MARKET, BY TYPE, 2018-2033 (USD THOUSAND)
TABLE 652 NORWAY FEED IN COLOSTRUM MARKET, BY TYPE, 2018-2033 (USD THOUSAND)
TABLE 653 NORWAY LIVESTOCK PRODUCERS IN COLOSTRUM MARKET, BY TYPE, 2018-2033 (USD THOUSAND)
TABLE 654 NORWAY COMPANION ANIMAL OWNERS IN COLOSTRUM MARKET, BY TYPE, 2018-2033 (USD THOUSAND)
TABLE 655 NORWAY EQUINE & PERFORMANCE ANIMAL SEGMENT IN COLOSTRUM MARKET, BY TYPE, 2018-2033 (USD THOUSAND)
TABLE 656 NORWAY VETERINARY & CLINICAL ANIMAL CARE USERS IN COLOSTRUM MARKET, BY TYPE, 2018-2033 (USD THOUSAND)
TABLE 657 NORWAY COLOSTRUM MARKET, BY DISTRIBUTION CHANNEL, 2018-2033 (USD THOUSAND)
TABLE 658 NORWAY COLOSTRUM MARKET, BY DISTRIBUTION CHANNEL, 2018-2033 (TONS)
TABLE 659 NORWAY DIRECT/B2B SALES IN COLOSTRUM MARKET, BY TYPE, 2018-2033 (USD THOUSAND)
TABLE 660 NORWAY ONLINE RETAIL IN COLOSTRUM MARKET, BY TYPE, 2018-2033 (USD THOUSAND)
TABLE 661 NORWAY COLOSTRUM MARKET, BY PACKAGING TYPE, 2018-2033 (USD THOUSAND)
TABLE 662 NORWAY COLOSTRUM MARKET, BY PACKAGING TYPE, 2018-2033 (TONS)
TABLE 663 NORWAY BULK PACKAGING IN COLOSTRUM MARKET, BY TYPE, 2018-2033 (USD THOUSAND)
TABLE 664 NORWAY RETAIL PACKAGING IN COLOSTRUM MARKET, BY TYPE, 2018-2033 (USD THOUSAND)
TABLE 665 NORWAY COLOSTRUM MARKET, BY FUNCTIONALITY, 2018-2033 (USD THOUSAND)
TABLE 666 NORWAY COLOSTRUM MARKET, BY FUNCTIONALITY, 2018-2033 (TONS)
TABLE 667 NORWAY COLOSTRUM MARKET, BY SALES MODEL, 2018-2033 (USD THOUSAND)
TABLE 668 NORWAY COLOSTRUM MARKET, BY SALES MODEL, 2018-2033 (TONS)
TABLE 669 FINLAND COLOSTRUM MARKET, BY SOURCE TYPE, 2018-2033 (USD THOUSAND)
TABLE 670 FINLAND COLOSTRUM MARKET, BY SOURCE TYPE, 2018-2033 (TONS)
TABLE 671 FINLAND BOVINE COLOSTRUM IN COLOSTRUM MARKET, BY TYPE, 2018-2033 (USD THOUSAND)
TABLE 672 FINLAND COW COLOSTRUM IN COLOSTRUM MARKET, BY TYPE, 2018-2033 (USD THOUSAND)
TABLE 673 FINLAND COLOSTRUM MARKET, BY NATURE, 2018-2033 (USD THOUSAND)
TABLE 674 FINLAND COLOSTRUM MARKET, BY NATURE, 2018-2033 (TONS)
TABLE 675 FINLAND ORGANIC IN COLOSTRUM MARKET, BY TYPE, 2018-2033 (USD THOUSAND)
TABLE 676 FINLAND COLOSTRUM MARKET, BY PRODUCT FORM, 2018-2033 (USD THOUSAND)
TABLE 677 FINLAND COLOSTRUM MARKET, BY PRODUCT FORM, 2018-2033 (TONS)
TABLE 678 FINLAND POWDER IN COLOSTRUM MARKET, BY TYPE, 2018-2033 (USD THOUSAND)
TABLE 679 FINLAND LIQUID IN COLOSTRUM MARKET, BY TYPE, 2018-2033 (USD THOUSAND)
TABLE 680 FINLAND COLOSTRUM MARKET, BY IMMUNOGLOBULIN (IGG) CONCENTRATION, 2018-2033 (USD THOUSAND)
TABLE 681 FINLAND COLOSTRUM MARKET, BY IMMUNOGLOBULIN (IGG) CONCENTRATION, 2018-2033 (TONS)
TABLE 682 FINLAND COLOSTRUM MARKET, BY PROCESSING TECHNOLOGY, 2018-2033 (USD THOUSAND)
TABLE 683 FINLAND COLOSTRUM MARKET, BY PROCESSING TECHNOLOGY, 2018-2033 (TONS)
TABLE 684 FINLAND COLOSTRUM MARKET, BY APPLICATION, 2018-2033 (USD THOUSAND)
TABLE 685 FINLAND COLOSTRUM MARKET, BY APPLICATION, 2018-2033 (TONS)
TABLE 686 FINLAND DIETARY SUPPLEMENTS IN COLOSTRUM MARKET, BY TYPE, 2018-2033 (USD THOUSAND)
TABLE 687 FINLAND SPORTS NUTRITION IN COLOSTRUM MARKET, BY TYPE, 2018-2033 (USD THOUSAND)
TABLE 688 FINLAND FUNCTIONAL FOOD & BEVERAGES IN COLOSTRUM MARKET, BY TYPE, 2018-2033 (USD THOUSAND)
TABLE 689 FINLAND INFANT NUTRITION IN COLOSTRUM MARKET, BY TYPE, 2018-2033 (USD THOUSAND)
TABLE 690 FINLAND PHARMACEUTICALS IN COLOSTRUM MARKET, BY TYPE, 2018-2033 (USD THOUSAND)
TABLE 691 FINLAND ANIMAL NUTRITION IN COLOSTRUM MARKET, BY TYPE, 2018-2033 (USD THOUSAND)
TABLE 692 FINLAND COSMETICS & PERSONAL CARE IN COLOSTRUM MARKET, BY TYPE, 2018-2033 (USD THOUSAND)
TABLE 693 FINLAND COLOSTRUM MARKET, BY END USER, 2018-2033 (USD THOUSAND)
TABLE 694 FINLAND COLOSTRUM MARKET, BY END USER, 2018-2033 (TONS)
TABLE 695 FINLAND FOOD IN COLOSTRUM MARKET, BY TYPE, 2018-2033 (USD THOUSAND)
TABLE 696 FINLAND ADULT SEGMENT IN COLOSTRUM MARKET, BY TYPE, 2018-2033 (USD THOUSAND)
TABLE 697 FINLAND INFANT & PEDIATRIC SEGMENT IN COLOSTRUM MARKET, BY TYPE, 2018-2033 (USD THOUSAND)
TABLE 698 FINLAND ELDERLY / GERIATRIC SEGMENT IN COLOSTRUM MARKET, BY TYPE, 2018-2033 (USD THOUSAND)
TABLE 699 FINLAND FEED IN COLOSTRUM MARKET, BY TYPE, 2018-2033 (USD THOUSAND)
TABLE 700 FINLAND LIVESTOCK PRODUCERS IN COLOSTRUM MARKET, BY TYPE, 2018-2033 (USD THOUSAND)
TABLE 701 FINLAND COMPANION ANIMAL OWNERS IN COLOSTRUM MARKET, BY TYPE, 2018-2033 (USD THOUSAND)
TABLE 702 FINLAND EQUINE & PERFORMANCE ANIMAL SEGMENT IN COLOSTRUM MARKET, BY TYPE, 2018-2033 (USD THOUSAND)
TABLE 703 FINLAND VETERINARY & CLINICAL ANIMAL CARE USERS IN COLOSTRUM MARKET, BY TYPE, 2018-2033 (USD THOUSAND)
TABLE 704 FINLAND COLOSTRUM MARKET, BY DISTRIBUTION CHANNEL, 2018-2033 (USD THOUSAND)
TABLE 705 FINLAND COLOSTRUM MARKET, BY DISTRIBUTION CHANNEL, 2018-2033 (TONS)
TABLE 706 FINLAND DIRECT/B2B SALES IN COLOSTRUM MARKET, BY TYPE, 2018-2033 (USD THOUSAND)
TABLE 707 FINLAND ONLINE RETAIL IN COLOSTRUM MARKET, BY TYPE, 2018-2033 (USD THOUSAND)
TABLE 708 FINLAND COLOSTRUM MARKET, BY PACKAGING TYPE, 2018-2033 (USD THOUSAND)
TABLE 709 FINLAND COLOSTRUM MARKET, BY PACKAGING TYPE, 2018-2033 (TONS)
TABLE 710 FINLAND BULK PACKAGING IN COLOSTRUM MARKET, BY TYPE, 2018-2033 (USD THOUSAND)
TABLE 711 FINLAND RETAIL PACKAGING IN COLOSTRUM MARKET, BY TYPE, 2018-2033 (USD THOUSAND)
TABLE 712 FINLAND COLOSTRUM MARKET, BY FUNCTIONALITY, 2018-2033 (USD THOUSAND)
TABLE 713 FINLAND COLOSTRUM MARKET, BY FUNCTIONALITY, 2018-2033 (TONS)
TABLE 714 FINLAND COLOSTRUM MARKET, BY SALES MODEL, 2018-2033 (USD THOUSAND)
TABLE 715 FINLAND COLOSTRUM MARKET, BY SALES MODEL, 2018-2033 (TONS)
TABLE 716 REST OF EUROPE COLOSTRUM MARKET, BY SOURCE TYPE, 2018-2033 (USD THOUSAND)
TABLE 717 REST OF EUROPE COLOSTRUM MARKET, BY SOURCE TYPE, 2018-2033 (TONS)
TABLE 718 REST OF EUROPE BOVINE COLOSTRUM IN COLOSTRUM MARKET, BY TYPE, 2018-2033 (USD THOUSAND)
TABLE 719 REST OF EUROPE COW COLOSTRUM IN COLOSTRUM MARKET, BY TYPE, 2018-2033 (USD THOUSAND)
TABLE 720 REST OF EUROPE COLOSTRUM MARKET, BY NATURE, 2018-2033 (USD THOUSAND)
TABLE 721 REST OF EUROPE COLOSTRUM MARKET, BY NATURE, 2018-2033 (TONS)
TABLE 722 REST OF EUROPE ORGANIC IN COLOSTRUM MARKET, BY TYPE, 2018-2033 (USD THOUSAND)
TABLE 723 REST OF EUROPE COLOSTRUM MARKET, BY PRODUCT FORM, 2018-2033 (USD THOUSAND)
TABLE 724 REST OF EUROPE COLOSTRUM MARKET, BY PRODUCT FORM, 2018-2033 (TONS)
TABLE 725 REST OF EUROPE POWDER IN COLOSTRUM MARKET, BY TYPE, 2018-2033 (USD THOUSAND)
TABLE 726 REST OF EUROPE LIQUID IN COLOSTRUM MARKET, BY TYPE, 2018-2033 (USD THOUSAND)
TABLE 727 REST OF EUROPE COLOSTRUM MARKET, BY IMMUNOGLOBULIN (IGG) CONCENTRATION, 2018-2033 (USD THOUSAND)
TABLE 728 REST OF EUROPE COLOSTRUM MARKET, BY IMMUNOGLOBULIN (IGG) CONCENTRATION, 2018-2033 (TONS)
TABLE 729 REST OF EUROPE COLOSTRUM MARKET, BY PROCESSING TECHNOLOGY, 2018-2033 (USD THOUSAND)
TABLE 730 REST OF EUROPE COLOSTRUM MARKET, BY PROCESSING TECHNOLOGY, 2018-2033 (TONS)
TABLE 731 REST OF EUROPE COLOSTRUM MARKET, BY APPLICATION, 2018-2033 (USD THOUSAND)
TABLE 732 REST OF EUROPE COLOSTRUM MARKET, BY APPLICATION, 2018-2033 (TONS)
TABLE 733 REST OF EUROPE DIETARY SUPPLEMENTS IN COLOSTRUM MARKET, BY TYPE, 2018-2033 (USD THOUSAND)
TABLE 734 REST OF EUROPE SPORTS NUTRITION IN COLOSTRUM MARKET, BY TYPE, 2018-2033 (USD THOUSAND)
TABLE 735 REST OF EUROPE FUNCTIONAL FOOD & BEVERAGES IN COLOSTRUM MARKET, BY TYPE, 2018-2033 (USD THOUSAND)
TABLE 736 REST OF EUROPE INFANT NUTRITION IN COLOSTRUM MARKET, BY TYPE, 2018-2033 (USD THOUSAND)
TABLE 737 REST OF EUROPE PHARMACEUTICALS IN COLOSTRUM MARKET, BY TYPE, 2018-2033 (USD THOUSAND)
TABLE 738 REST OF EUROPE ANIMAL NUTRITION IN COLOSTRUM MARKET, BY TYPE, 2018-2033 (USD THOUSAND)
TABLE 739 REST OF EUROPE COSMETICS & PERSONAL CARE IN COLOSTRUM MARKET, BY TYPE, 2018-2033 (USD THOUSAND)
TABLE 740 REST OF EUROPE COLOSTRUM MARKET, BY END USER, 2018-2033 (USD THOUSAND)
TABLE 741 REST OF EUROPE COLOSTRUM MARKET, BY END USER, 2018-2033 (TONS)
TABLE 742 REST OF EUROPE FOOD IN COLOSTRUM MARKET, BY TYPE, 2018-2033 (USD THOUSAND)
TABLE 743 REST OF EUROPE ADULT SEGMENT IN COLOSTRUM MARKET, BY TYPE, 2018-2033 (USD THOUSAND)
TABLE 744 REST OF EUROPE INFANT & PEDIATRIC SEGMENT IN COLOSTRUM MARKET, BY TYPE, 2018-2033 (USD THOUSAND)
TABLE 745 REST OF EUROPE ELDERLY / GERIATRIC SEGMENT IN COLOSTRUM MARKET, BY TYPE, 2018-2033 (USD THOUSAND)
TABLE 746 REST OF EUROPE FEED IN COLOSTRUM MARKET, BY TYPE, 2018-2033 (USD THOUSAND)
TABLE 747 REST OF EUROPE LIVESTOCK PRODUCERS IN COLOSTRUM MARKET, BY TYPE, 2018-2033 (USD THOUSAND)
TABLE 748 REST OF EUROPE COMPANION ANIMAL OWNERS IN COLOSTRUM MARKET, BY TYPE, 2018-2033 (USD THOUSAND)
TABLE 749 REST OF EUROPE EQUINE & PERFORMANCE ANIMAL SEGMENT IN COLOSTRUM MARKET, BY TYPE, 2018-2033 (USD THOUSAND)
TABLE 750 REST OF EUROPE VETERINARY & CLINICAL ANIMAL CARE USERS IN COLOSTRUM MARKET, BY TYPE, 2018-2033 (USD THOUSAND)
TABLE 751 REST OF EUROPE COLOSTRUM MARKET, BY DISTRIBUTION CHANNEL, 2018-2033 (USD THOUSAND)
TABLE 752 REST OF EUROPE COLOSTRUM MARKET, BY DISTRIBUTION CHANNEL, 2018-2033 (TONS)
TABLE 753 REST OF EUROPE DIRECT/B2B SALES IN COLOSTRUM MARKET, BY TYPE, 2018-2033 (USD THOUSAND)
TABLE 754 REST OF EUROPE ONLINE RETAIL IN COLOSTRUM MARKET, BY TYPE, 2018-2033 (USD THOUSAND)
TABLE 755 REST OF EUROPE COLOSTRUM MARKET, BY PACKAGING TYPE, 2018-2033 (USD THOUSAND)
TABLE 756 REST OF EUROPE COLOSTRUM MARKET, BY PACKAGING TYPE, 2018-2033 (TONS)
TABLE 757 REST OF EUROPE BULK PACKAGING IN COLOSTRUM MARKET, BY TYPE, 2018-2033 (USD THOUSAND)
TABLE 758 REST OF EUROPE RETAIL PACKAGING IN COLOSTRUM MARKET, BY TYPE, 2018-2033 (USD THOUSAND)
TABLE 759 REST OF EUROPE COLOSTRUM MARKET, BY FUNCTIONALITY, 2018-2033 (USD THOUSAND)
TABLE 760 REST OF EUROPE COLOSTRUM MARKET, BY FUNCTIONALITY, 2018-2033 (TONS)
TABLE 761 REST OF EUROPE COLOSTRUM MARKET, BY SALES MODEL, 2018-2033 (USD THOUSAND)
TABLE 762 REST OF EUROPE COLOSTRUM MARKET, BY SALES MODEL, 2018-2033 (TONS)
List of Figure
FIGURE 1 COLOSTRUM MARKET: SEGMENTATION
FIGURE 2 COLOSTRUM MARKET: DATA TRIANGULATION
FIGURE 3 COLOSTRUM MARKET: DROC ANALYSIS
FIGURE 4 COLOSTRUM MARKET: GLOBAL VS REGIONAL MARKET ANALYSIS
FIGURE 5 COLOSTRUM MARKET: COMPANY RESEARCH ANALYSIS
FIGURE 6 COLOSTRUM MARKET: INTERVIEW DEMOGRAPHICS
FIGURE 7 COLOSTRUM MARKET: DBMR MARKET POSITION GRID
FIGURE 8 COLOSTRUM MARKET: VENDOR SHARE ANALYSIS
FIGURE 9 COLOSTRUM MARKET: MULTIVARIVATE MODELING
FIGURE 10 COLOSTRUM MARKET: END USER COVERAGE GRID
FIGURE 11 COLOSTRUM MARKET: SEGMENTATION
FIGURE 12 FIVE SEGMENTS COMPRISE THE COLOSTRUM MARKET, BY PRODUCT (2025)
FIGURE 13 COLOSTRUM MARKET: EXECUTIVE SUMMARY
FIGURE 14 RISING DEMAND FOR IMMUNE-SUPPORT AND GUT-HEALTH NUTRITION IS EXPECTED TO DRIVE THE COLOSTRUM MARKET DURING THE FORECAST PERIOD OF 2026 TO 2033
FIGURE 15 BOVINE COLOSTRUM SEGMENT IS EXPECTED TO ACCOUNT FOR THE LARGEST SHARE OF THE COLOSTRUM MARKET IN 2026 & 2033
FIGURE 16 STRATEGIC DECISIONS
FIGURE 17 SUPPLY CHAIN ANALYSIS
FIGURE 18 SUPPLY CHAIN ANALYSIS
FIGURE 19 EUROPE COLOSTRUM MARKET, 2025-2033, AVERAGE SELLING PRICE (USD/KG)
FIGURE 20 STRATEGIC ALLIANCE DISTRIBUTION IN THE EUROPE COLOSTRUM MARKET, BY DEAL TYPE (%)
FIGURE 21 DROC ANALYSIS
FIGURE 22 EUROPE COLOSTRUM MARKET: BY SOURCE TYPE, 2025
FIGURE 23 EUROPE COLOSTRUM MARKET: BY NATURE, 2025
FIGURE 24 EUROPE COLOSTRUM MARKET: BY PRODUCT FORM, 2025
FIGURE 25 EUROPE COLOSTRUM MARKET: BY IMMUNOGLOBULIN (IGG) CONCENTRATION, 2025
FIGURE 26 EUROPE COLOSTRUM MARKET: BY PROCESSING TECHNOLOGY, 2025
FIGURE 27 EUROPE COLOSTRUM MARKET: BY APPLICATION, 2025
FIGURE 28 EUROPE COLOSTRUM MARKET: BY END USER, 2025
FIGURE 29 EUROPE COLOSTRUM MARKET: BY DISTRIBUTION CHANNEL, 2025
FIGURE 30 EUROPE COLOSTRUM MARKET: BY PACKAGING TYPE, 2025
FIGURE 31 EUROPE COLOSTRUM MARKET: BY FUNCTIONALITY, 2025
FIGURE 32 EUROPE COLOSTRUM MARKET: BY SALES MODEL, 2025
FIGURE 33 EUROPE COLOSTRUM MARKET, SNAPSHOT (2025)
FIGURE 34 EUROPE COLOSTRUM MARKET: COMPANY SHARE 2025 (%)
Data collection and base year analysis are done using data collection modules with large sample sizes. The stage includes obtaining market information or related data through various sources and strategies. It includes examining and planning all the data acquired from the past in advance. It likewise envelops the examination of information inconsistencies seen across different information sources. The market data is analysed and estimated using market statistical and coherent models. Also, market share analysis and key trend analysis are the major success factors in the market report. To know more, please request an analyst call or drop down your inquiry.
The key research methodology used by DBMR research team is data triangulation which involves data mining, analysis of the impact of data variables on the market and primary (industry expert) validation. Data models include Vendor Positioning Grid, Market Time Line Analysis, Market Overview and Guide, Company Positioning Grid, Patent Analysis, Pricing Analysis, Company Market Share Analysis, Standards of Measurement, Global versus Regional and Vendor Share Analysis. To know more about the research methodology, drop in an inquiry to speak to our industry experts.
Data Bridge Market Research is a leader in advanced formative research. We take pride in servicing our existing and new customers with data and analysis that match and suits their goal. The report can be customized to include price trend analysis of target brands understanding the market for additional countries (ask for the list of countries), clinical trial results data, literature review, refurbished market and product base analysis. Market analysis of target competitors can be analyzed from technology-based analysis to market portfolio strategies. We can add as many competitors that you require data about in the format and data style you are looking for. Our team of analysts can also provide you data in crude raw excel files pivot tables (Fact book) or can assist you in creating presentations from the data sets available in the report.


