
Europe Compound Management Market
Market Size in USD Million
 USD
815.74 Million
USD
2,478.06 Million
2025
2033
USD
815.74 Million
USD
2,478.06 Million
2025
2033
| 2026 - 2033 | |
| USD 815.74 Million | |
| USD 2,478.06 Million | |
| % | |
|
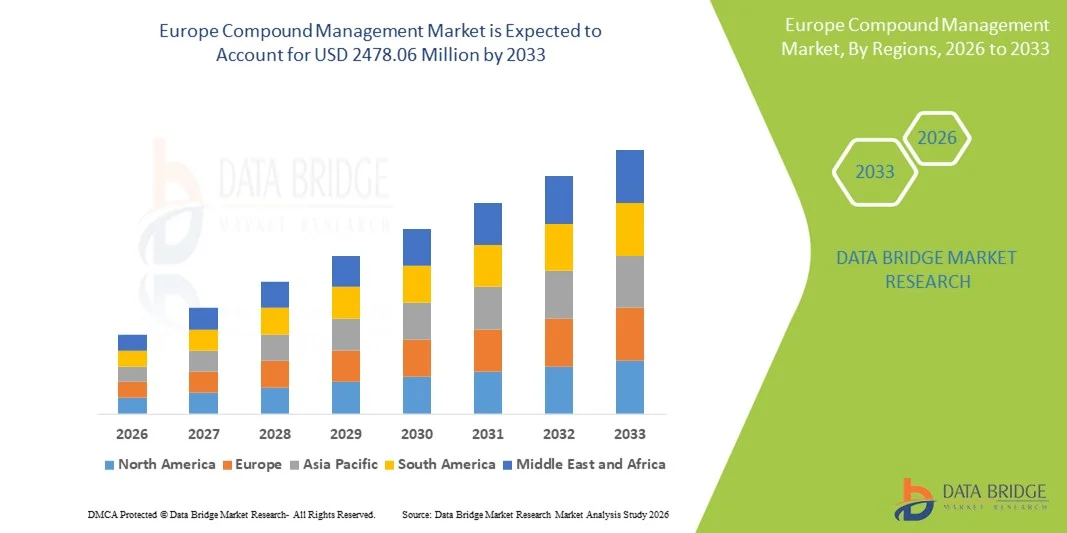
Europe Compound Management Market Size
- The Europe compound management market size was valued at USD 815.74 Million in 2025 and is expected to reach USD 2478.06 Million by 2033, at a CAGR of 14.90% during the forecast period
- The market growth is largely fueled by the increasing emphasis on efficient sample handling, storage, and tracking in pharmaceutical, biotechnology, and life sciences research, driven by rising R&D activities, expanding drug discovery pipelines, and the growing complexity of compound libraries across research organizations
- Furthermore, rising demand for automated, accurate, and integrated compound management solutions is establishing these systems as critical infrastructure in modern laboratories. These converging factors are accelerating the adoption of compound management solutions, thereby significantly boosting the overall growth of the Compound Management Market
Europe Compound Management Market Analysis
- Compound management solutions, including compound storage, tracking, retrieval, and data management systems, play a critical role in pharmaceutical, biotechnology, and life sciences research by ensuring sample integrity, improving workflow efficiency, and supporting large-scale drug discovery programs
- The growing demand for compound management systems is driven by expanding drug discovery pipelines, increased use of high-throughput screening, rising biologics and small-molecule research, and the need for automation, accuracy, and regulatory compliance in modern laboratories
- The U.K. dominated the compound management market with the largest revenue share of approximately 33.4% in 2025, driven by a strong pharmaceutical and biotechnology ecosystem, the presence of leading global CROs, advanced research infrastructure, high adoption of automated compound and sample management systems, and sustained government and private-sector investment in life sciences R&D
- Germany is expected to be the fastest-growing country in the compound management market during the forecast period, registering an estimated CAGR of around 8.7%, supported by rapid growth in drug discovery programs, expansion of biopharmaceutical manufacturing, increasing use of high-throughput screening technologies, and rising demand for efficient compound storage and tracking solutions across research institutes and industrial laboratories
- The chemical compounds segment dominated the market with a revenue share of about 62.1% in 2025, owing to its extensive use in early-stage drug discovery and screening programs
Report Scope and Compound Management Market Segmentation
|
Attributes |
Compound Management Key Market Insights |
|
Segments Covered |
|
|
Countries Covered |
Europe
|
|
Key Market Players |
• Hamilton Company (U.S.) |
|
Market Opportunities |
|
|
Value Added Data Infosets |
In addition to the insights on market scenarios such as market value, growth rate, segmentation, geographical coverage, and major players, the market reports curated by the Data Bridge Market Research also include in-depth expert analysis, patient epidemiology, pipeline analysis, pricing analysis, and regulatory framework. |
Europe Compound Management Market Trends
Growing Adoption of Digitized and Centralized Compound Security Management Systems
- A prominent and evolving trend in the global compound management market is the increasing shift from manual and fragmented security practices toward digitized, centralized systems that enable better monitoring and control of large residential, commercial, and industrial compounds
- These systems are increasingly deployed to manage access points, surveillance coordination, and perimeter security in a more structured manner
- For instance, in 2024, several large residential townships and industrial parks in Europe and the Middle East adopted centralized compound management platforms to streamline gate operations, visitor entry tracking, and security personnel coordination across multiple access points
- The integration of digital dashboards and centralized monitoring tools is enabling facility managers to gain real-time visibility into compound activities, improving response times and operational efficiency
- Rapid urbanization, the development of large gated communities, logistics hubs, and commercial campuses are further accelerating the demand for structured compound management solutions worldwide
- This trend reflects a broader movement toward modern infrastructure management, where safety, operational efficiency, and scalability are prioritized across both developed and emerging markets
- As a result, solution providers are increasingly focusing on modular and scalable compound management systems that can be customized for residential complexes, industrial facilities, government premises, and institutional campuses
Europe Compound Management Market Dynamics
Driver
Rising Security Requirements and Expansion of Large-Scale Infrastructure Projects
- The Compound Management market is primarily driven by the growing need for enhanced security and controlled access across expanding residential, commercial, and industrial infrastructures globally. Increasing incidents related to unauthorized access, theft, and safety breaches have heightened the importance of structured compound-level security management
- For instance, in 2025, infrastructure developers in North America and Europe increasingly incorporated advanced compound management solutions into new commercial parks and mixed-use developments to comply with stricter safety and regulatory standards
- Governments and private developers are investing heavily in smart cities, industrial corridors, logistics parks, and gated communities, all of which require efficient compound management to ensure safety and smooth operations
- The growing emphasis on regulatory compliance, safety audits, and standardized security protocols is further driving adoption, particularly in sectors such as healthcare, manufacturing, education, and government facilities
- In addition, the need to manage large volumes of residents, employees, visitors, and service providers efficiently is encouraging organizations to move toward structured compound management systems that reduce reliance on manual processes
Restraint/Challenge
High Implementation Costs and Operational Complexity
- Despite strong growth prospects, the Compound Management market faces challenges related to the high initial investment required for system deployment, including infrastructure upgrades, system integration, and ongoing maintenance. These costs can be a significant barrier, particularly for small residential complexes and facilities in cost-sensitive regions
- For instance, facility operators in parts of Latin America and Africa have reported delays in adopting comprehensive compound management solutions due to budget constraints and the high costs associated with upgrading legacy security infrastructure
- Operational complexity, including the need for trained personnel to manage and maintain compound management systems, also poses a challenge, especially in regions with limited technical expertise
- Inconsistent regulatory frameworks and varying security standards across countries further complicate system standardization and large-scale deployment for multinational operators
- Addressing these challenges through cost-effective solutions, simplified system designs, workforce training, and greater standardization of security practices will be critical for sustaining long-term growth in the global compound management market
Europe Compound Management Market Scope
The market is segmented on the basis of product & services, sample type, process, application, compound library size, end user, and distribution channel.
- By Product & Services
On the basis of product & services, the Compound Management market is segmented into compound/sample management products and outsourcing services. The compound/sample management products segment dominated the largest market revenue share of approximately 58.4% in 2025, driven by the widespread adoption of automated compound storage systems, liquid handling platforms, and inventory tracking software across pharmaceutical and biopharmaceutical companies. These products ensure compound integrity, stability, and traceability throughout the drug discovery lifecycle. Increasing regulatory scrutiny has accelerated investments in validated in-house systems. Large pharmaceutical companies prefer product-based solutions to protect intellectual property and sensitive compound libraries. Integration with robotics and laboratory information management systems improves efficiency. High-throughput screening programs require reliable product infrastructure. Expansion of biologics and small-molecule pipelines further supports demand. Continuous technological upgrades enhance accuracy and reproducibility. The growing volume of compounds generated annually reinforces dominance. Established suppliers provide long-term maintenance and customization. Rising R&D expenditure globally strengthens product adoption.
The outsourcing services segment is anticipated to witness the fastest growth, registering a CAGR of around 14.8% from 2026 to 2033, driven by the increasing trend of outsourcing non-core laboratory functions. Pharmaceutical companies are focusing on cost optimization and operational efficiency. Small and mid-sized biotech firms lack capital for in-house infrastructure. Outsourcing offers scalability and flexible service models. CROs provide advanced automation and standardized workflows. Rising clinical trial activity increases compound handling needs. Global expansion of CRO facilities supports adoption. Faster turnaround times improve project timelines. Increased confidence in third-party compliance drives demand. Growth in emerging markets accelerates service utilization. Technological parity with in-house systems boosts credibility.
- By Sample Type
On the basis of sample type, the Compound Management market is segmented into chemical compounds and biosamples. The chemical compounds segment dominated the market with a revenue share of about 62.1% in 2025, owing to its extensive use in early-stage drug discovery and screening programs. Chemical compound libraries are fundamental to medicinal chemistry efforts. They offer longer shelf life and easier storage conditions compared to biosamples. Compatibility with automated handling systems enhances efficiency. Pharmaceutical companies maintain vast synthetic libraries for lead identification. High-throughput screening relies heavily on chemical compounds. Lower storage costs support widespread adoption. Standardized handling protocols reduce contamination risks. Increased oncology and CNS research fuels demand. Strong presence in both academia and industry supports dominance. Continuous synthesis of novel compounds sustains growth.
The biosamples segment is expected to grow at the fastest CAGR of approximately 15.3% from 2026 to 2033, driven by the rapid expansion of biologics, cell therapies, and personalized medicine. Biosamples are critical for translational research and biomarker discovery. Rising investments in biobanking support storage infrastructure. Advances in cryopreservation technologies enhance sample viability. Growth in genomic and proteomic studies accelerates adoption. Increasing regulatory focus on sample traceability boosts demand. Academic and clinical collaborations strengthen usage. Expansion of precision medicine pipelines drives growth. Improved cold-chain logistics enable global handling.
- By Process
On the basis of process, the Compound Management market is segmented into high-throughput screening, fragment-based screening, and lead optimization. The high-throughput screening segment held the largest market revenue share of approximately 46.7% in 2025, driven by its ability to rapidly evaluate thousands of compounds efficiently. Pharmaceutical companies rely on HTS to accelerate lead identification. Automation reduces time-to-results and operational costs. Integration with AI-based analytics enhances hit accuracy. Large compound libraries support scalability. HTS is widely used in oncology, infectious diseases, and metabolic disorders. Standardized workflows improve reproducibility. Increasing R&D budgets support widespread adoption. Continuous technological advancements sustain dominance. High demand from CROs reinforces market leadership.
The fragment-based screening segment is projected to witness the fastest CAGR of around 16.2% from 2026 to 2033, driven by its efficiency in identifying high-quality leads using smaller libraries. Lower compound consumption reduces costs. Higher binding efficiency improves success rates. Growing adoption in precision drug discovery fuels demand. Advances in structural biology support implementation. Integration with computational modeling enhances outcomes. Increasing academic research strengthens adoption. Pharma interest continues to rise. Fragment-based approaches complement HTS strategies. Improved validation techniques accelerate growth.
- By Application
On the basis of application, the Compound Management market is segmented into drug discovery, preclinical discovery, gene synthesis, bio banking, and others. The drug discovery segment dominated the market with a revenue share of nearly 49.5% in 2025, driven by continuous demand for novel therapeutics. Rising prevalence of chronic and rare diseases accelerates pipeline development. Compound integrity is critical for screening accuracy. Automation improves throughput and data reliability. Increasing biologics development supports demand. Pharmaceutical investments strengthen dominance. Regulatory compliance requirements reinforce robust management. High compound turnover sustains usage. Global R&D expansion fuels adoption. Integration with AI-driven discovery enhances efficiency.
The biobanking segment is expected to grow at the fastest CAGR of approximately 17.1% from 2026 to 2033, driven by increasing biosample storage needs. Growth in personalized medicine fuels demand. Expansion of population-based studies supports growth. Improved cryogenic storage technologies enhance reliability. Rising academic research activity strengthens adoption. Government-funded research initiatives contribute to expansion. Increased focus on rare disease research accelerates growth. Long-term sample preservation requirements boost demand.
- By Compound Library Size
On the basis of compound library size, the Compound Management market is segmented into small & medium libraries and large libraries. The large libraries segment accounted for the largest revenue share of around 55.8% in 2025, driven by large pharmaceutical companies maintaining extensive compound collections to support multi-therapeutic drug discovery pipelines. Large libraries enable screening across a wide range of biological targets and disease areas. Pharmaceutical giants rely on vast repositories to ensure long-term R&D continuity. Automation and robotic storage systems significantly improve handling efficiency and compound traceability. High capital investment capacity allows enterprises to maintain and upgrade large-scale infrastructure. Regulatory compliance requirements necessitate validated storage and monitoring systems. Increased high-throughput screening (HTS) activity directly supports the demand for large libraries. Continuous acquisition of novel compounds sustains library expansion. Integration with AI and machine learning tools enhances compound utilization and hit identification. Global R&D expansion further strengthens dominance. Centralized compound management reduces operational risk. Established quality systems reinforce leadership in this segment.
The small & medium libraries segment is projected to grow at the fastest CAGR of nearly 14.6% from 2026 to 2033, driven primarily by the rapid rise of biotech startups, virtual pharma companies, and academic research institutions. These organizations favor smaller, focused libraries due to cost efficiency and operational flexibility. Limited capital investment encourages lean compound management strategies. Focused libraries often deliver higher hit rates in early-stage discovery. Fragment-based and target-specific screening approaches support adoption. Increasing venture capital funding boosts startup R&D activity. Academic collaborations contribute to compound utilization growth. Easier storage and handling requirements reduce infrastructure burden. Outsourcing compatibility further accelerates growth. Rising innovation in early discovery fuels demand. Growth of precision medicine research strengthens adoption. Expanding CRO support models enhance scalability.
- By End User
On the basis of end user, the Compound Management market is segmented into pharmaceutical companies, biopharmaceutical companies, contract research organizations, research and academic institutes, and others. The pharmaceutical companies segment dominated the market with a revenue share of approximately 44.9% in 2025, owing to extensive internal R&D activities and large-scale drug development pipelines. These companies manage massive volumes of chemical compounds and biosamples. Robust compound management systems are essential for maintaining integrity and compliance. High screening volumes necessitate automated and scalable solutions. Continuous pipeline development across oncology, CNS, and rare diseases sustains demand. Regulatory scrutiny drives investment in validated storage and tracking systems. Advanced automation adoption enhances efficiency and reproducibility. Global operational presence increases compound handling scale. Strong financial capacity enables continuous system upgrades. In-house control over intellectual property reinforces dominance. Integration with digital discovery platforms supports leadership.
The contract research organizations (CROs) segment is anticipated to grow at the fastest CAGR of around 18.3% from 2026 to 2033, driven by the increasing outsourcing of drug discovery and preclinical activities. Pharmaceutical and biotech companies seek operational efficiency and cost optimization. CROs offer specialized compound management expertise and infrastructure. Expansion of CRO facilities in emerging markets supports growth. Rising clinical trial volumes increase compound handling requirements. Flexible service models attract small and mid-sized sponsors. Advanced automation capabilities enhance competitiveness. Increasing reliance on external partners accelerates adoption. Growth in virtual pharma companies supports outsourcing trends. CRO scalability enables rapid project execution. Regulatory compliance expertise strengthens client trust. Technological parity with in-house systems fuels demand.
- By Distribution Channel
On the basis of distribution channel, the Compound Management market is segmented into direct sales and third-party distributor. The direct sales segment dominated the market with a revenue share of nearly 61.2% in 2025, driven by strong demand for customized compound management solutions and comprehensive technical support. Complex storage and automation systems require tailored implementation. Large pharmaceutical and biopharmaceutical companies prefer direct vendor engagement. Long-term supplier relationships enhance system reliability and trust. Integration with existing laboratory infrastructure is critical. Direct sales enable customized software and hardware configurations. Vendors provide training, validation, and after-sales support. Regulatory compliance assistance strengthens value propositions. High-ticket purchases favor direct procurement models. Continuous system upgrades reinforce dominance. Strategic partnerships support long-term adoption.
The third-party distributor segment is expected to grow at the fastest CAGR of about 13.9% from 2026 to 2033, driven by expanding demand in emerging and underpenetrated markets. Distributors enhance regional reach for global manufacturers. Cost-effective procurement models attract smaller organizations. Growing biotech and academic presence boosts demand. Simplified logistics and faster delivery improve adoption. Local technical support strengthens customer confidence. Distributors facilitate market entry for new vendors. Expansion of R&D infrastructure in Europe and Latin America supports growth. Flexible pricing models attract startups. Increasing awareness of compound management solutions accelerates uptake. Strategic local partnerships improve penetration. Rising outsourcing trends further support distributor growth.
Europe Compound Management Market Regional Analysis
- The Europe compound management market is expected to witness strong growth during the forecast period of 2026 to 2033, driven by rising investments in pharmaceutical and biotechnology research, increasing drug discovery and preclinical activities, and the rapid expansion of contract research organizations (CROs) across the region
- The growing need for efficient compound storage, tracking, and retrieval solutions is accelerating the adoption of automated compound management systems in both academic and industrial research settings
- The region’s position as a global hub for pharmaceutical innovation and manufacturing is further supporting market expansion, as companies increasingly adopt advanced compound management platforms to enhance operational efficiency, regulatory compliance, and data integrity throughout the drug development lifecycle
U.K. Compound Management Market Insight
The U.K. compound management market dominated the European compound management market, accounting for the largest revenue share of approximately 33.4% in 2025. This dominance is attributed to the country’s well-established pharmaceutical and biotechnology ecosystem, the strong presence of leading global CROs, advanced research infrastructure, and high adoption of automated compound and sample management systems. Continuous government and private-sector investment in life sciences R&D, along with a strong focus on innovation-driven drug discovery, continues to reinforce the U.K.’s leading position in the regional market.
Germany Compound Management Market Insight
Germany compound management market is expected to be the fastest-growing country in the European compound management market during the forecast period, registering an estimated CAGR of around 8.7%. Market growth is supported by the rapid expansion of drug discovery programs, increasing biopharmaceutical manufacturing activities, and the growing use of high-throughput screening technologies. In addition, rising demand for efficient compound storage, tracking, and data management solutions across research institutes, pharmaceutical companies, and industrial laboratories is accelerating the adoption of advanced compound management systems in the country.
Europe Compound Management Market Share
The Compound Management industry is primarily led by well-established companies, including:
• Hamilton Company (U.S.)
• Thermo Fisher Scientific (U.S.)
• Tecan Group Ltd. (Switzerland)
• PerkinElmer (U.S.)
• Beckman Coulter Life Sciences (U.S.)
• LabWare (U.S.)
• HighRes Biosolutions (U.S.)
• Titian Software (U.K.)
• Evotec SE (Germany)
• Wuxi AppTec (China)
• Azenta Life Sciences (U.S.)
• SPT Labtech (U.K.)
• Bruker Corporation (U.S.)
• BioAscent Discovery (U.K.)
• Charles River Laboratories (U.S.)
• Eurofins Scientific (Luxembourg)
• Syngene International (India)
• Curia Global (U.S.)
• Recipharm AB (Sweden)
Latest Developments in Europe Compound Management Market
- In April 2021, SPT Labtech, a UK-based provider of laboratory automation solutions, announced the acquisition of BioMicroLab, a robotics automation provider for sample handling, aimed at strengthening its compound management automation portfolio and expanding its capabilities in high-throughput sample processing and management workflows. This strategic acquisition expanded SPT Labtech’s product offerings, improved its automated sample handling technology, and helped broaden its geographic presence in the compound management sector
- In March 2023, Brooks Automation announced the completion of its acquisition of Aim Lab Automation Technologies Pty Ltd, integrating precision automation technology into its compound management and sample handling solutions to offer broader capabilities spanning drug discovery, clinical diagnostics, and lab automation workflows. This acquisition reinforced Brooks’ compound management footprint and enabled enhanced support for complex sample management needs across pharmaceutical and biotechnology research labs
- In August 2023, research and market reports noted that high-density automated storage systems significantly increased storage capacity (by over 24%) without expanding laboratory footprint, supporting rapid growth in compound and biosample inventories at major research institutions. These innovations reflect ongoing investment in next-generation compound storage technologies to support growing drug discovery libraries
- In August 2023, Agilent Technologies, Inc. secured European In Vitro Diagnostic Regulation (IVDR) certification for its diagnostic solutions relevant to compound and sample tracking, reinforcing its regulatory compliance framework and enabling further expansion of precision laboratory workflows that intersect with compound management ecosystems. This regulatory milestone underscored the increasing importance of compliance in integrated laboratory informatics and management systems
- In October 2024, BioDuro opened a new Compound Management Centre in Shanghai, China, expanding its drug discovery and compound handling services in the Europe region to support both local and global pharmaceutical research programs. This expansion highlighted growing investment in compound management infrastructure in high-growth biotech markets
SKU-

- Interactive Data Analysis Dashboard
- Company Analysis Dashboard for high growth potential opportunities
- Research Analyst Access for customization & queries
- Competitor Analysis with Interactive dashboard
- Latest News, Updates & Trend analysis
- Harness the Power of Benchmark Analysis for Comprehensive Competitor Tracking
Data collection and base year analysis are done using data collection modules with large sample sizes. The stage includes obtaining market information or related data through various sources and strategies. It includes examining and planning all the data acquired from the past in advance. It likewise envelops the examination of information inconsistencies seen across different information sources. The market data is analysed and estimated using market statistical and coherent models. Also, market share analysis and key trend analysis are the major success factors in the market report. To know more, please request an analyst call or drop down your inquiry.
The key research methodology used by DBMR research team is data triangulation which involves data mining, analysis of the impact of data variables on the market and primary (industry expert) validation. Data models include Vendor Positioning Grid, Market Time Line Analysis, Market Overview and Guide, Company Positioning Grid, Patent Analysis, Pricing Analysis, Company Market Share Analysis, Standards of Measurement, Global versus Regional and Vendor Share Analysis. To know more about the research methodology, drop in an inquiry to speak to our industry experts.
Data Bridge Market Research is a leader in advanced formative research. We take pride in servicing our existing and new customers with data and analysis that match and suits their goal. The report can be customized to include price trend analysis of target brands understanding the market for additional countries (ask for the list of countries), clinical trial results data, literature review, refurbished market and product base analysis. Market analysis of target competitors can be analyzed from technology-based analysis to market portfolio strategies. We can add as many competitors that you require data about in the format and data style you are looking for. Our team of analysts can also provide you data in crude raw excel files pivot tables (Fact book) or can assist you in creating presentations from the data sets available in the report.


