
Market Analysis and Insights: Europe Data Centre Busway Market
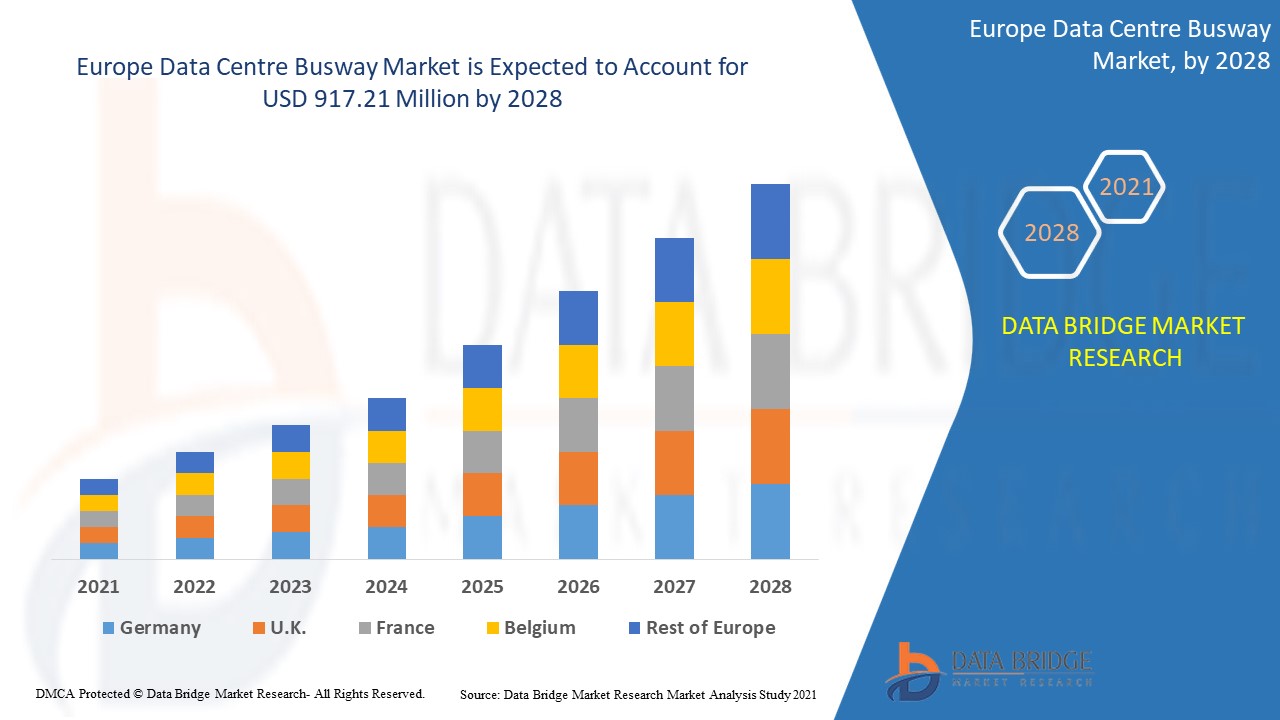
The Europe data centre busway market is expected to gain market growth in the forecast period of 2021 to 2028. Data Bridge Market Research analyses that the market is growing with a CAGR of 8.7% in the forecast period of 2021 to 2028 and is expected to reach USD 917.21 million by 2028.
Data center busways are straight length power distribution components used for supplying power to electronic components in mission critical facilities such as data centers, manufacturing units, IT facilities, residential buildings and others. In a power distribution system busways are integrated with intelligent PDUs, monitoring systems, UPS and others. Busways provide advantages over the conventional wire & cable system of power distribution as once installed the cable & wire assemblies are difficult to change. Busways are pre-fabricated or can be customised according to the facility. Copper or aluminium is used as a conductor in the busways. Busways are usually employed where high power transmission is required as they are more efficient, scalable and safe as compared to the wire & cable system. Busways are preferred in the facilities where high power distribution system is required as for high power transmission the cable & wire installation becomes cluttered and takes more space apart from that the maintaining the busways is less costly as compared to the cables & wires.
The major factors driving the growth of the data center busway market are increasing adoption of data centers, adoption of new technologies in data center busway, rising demand for compact power distribution solutions for data center. Rising growth in digitalization is leading to cross-border data center busway products and creating opportunities for the growth of the market. High Installation cost is acting as the major restraint for data center busway market. Alternate power solutions are acting as a major challenge for the growth of the market.
This Europe data centre busway market report provides details of market share, new developments, and product pipeline analysis, impact of domestic and localised market players, analyses opportunities in terms of emerging revenue pockets, changes in market regulations, product approvals, strategic decisions, product launches, geographic expansions, and technological innovations in the market. To understand the analysis and the market scenario contact us for an Analyst Brief, our team will help you create a revenue impact solution to achieve your desired goal.
Europe Data Centre Busway Market Scope and Market Size
Europe data centre busway market is segmented into six notable segments based on product type, type, implementation, data center type, current ampere, and vertical.
- On the basis of product type, the Europe data center busway market has been segmented into air splicing busway (BMC), intensive insulation plug busway (CMC), high strength enclosed busway (CFW), power distribution units (PDUs) and others. In 2021, power distribution units (PDUs) is expected to dominate the segment as it can handle larger amounts of energy than an ordinary power strip and typically provides power to multiple equipment racks.
- On the basis of type, the Europe data center busway market has been segmented into 3-phase 4-wire, 3-phase 5-wire and others. In 2021, 3-phase 4-wire is expected to dominate the market as it offers easy detection of faults and phase balance.
- On the basis of implementation, the Europe data center busway market has been segmented into raised floor and ceiling overhead. In 2021, ceiling overhead segment is expected to dominate the market as it offers easy moving, changing, and adding of receptacles.
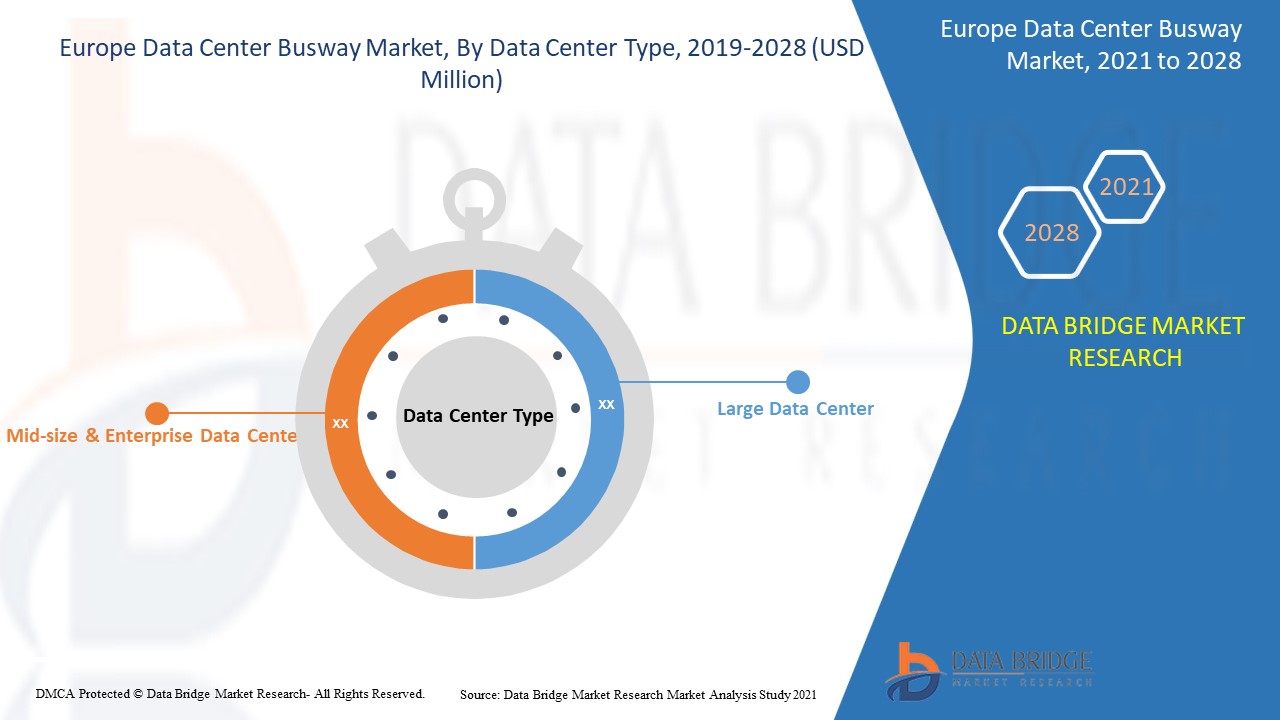
- On the basis of data center type, the Europe Data center busway market has been segmented into mid-size & enterprise data center and large data center. In 2021, large data center is expected to dominate the segment as the cost gets reduced for the organization as they do not have to maintain and build their own data center.
- On the basis of current ampere, the Europe data center busway market has been segmented into low and high current ampere. In 2021, low ampere current is expected to dominate the segment as the need for energy-efficient systems is increasing.
- On the basis of vertical, Europe data center busway market has been segmented into banking, financial services and insurance (BFSI), IT & telecom, government and defense, healthcare, retail & ecommerce, research & academia, energy & utilities, manufacturing and others. In 2021, IT & telecom is expected to dominate the segment as the industry is creating huge demands for data centers to handle high data volume and low latency needs.
Europe Data Centre Busway Market Country Level Analysis
Europe data centre busway market is analysed and market size information is provided by country, product type, type, implementation, data center type, current ampere and vertical. The countries covered in Europe data centre busway market report are Germany, France, U.K., Italy, Spain, Russia, Turkey, Belgium, Netherlands, Switzerland and Rest of Europe.
U.K. is dominating the European region for data centre busway market due to high presence of data centers in the region.
The country section of the report also provides individual market impacting factors and changes in regulation in the market domestically that impacts the current and future trends of the market. Data points such as new sales, replacement sales, country demographics, regulatory acts and import-export tariffs are some of the major pointers used to forecast the market scenario for individual countries. Also, presence and availability of Europe brands and their challenges faced due to large or scarce competition from local and domestic brands, impact of sales channels are considered while providing forecast analysis of the country data.
Rising Demand of Data Centre Busway
Europe data centre busway market also provides you with detailed market analysis for every country growth in industry with sales, components sales, impact of technological development in Data centre busway and changes in regulatory scenarios with their support for the Data centre busway market. The data is available for historic period 2010 to 2019.
Competitive Landscape and Europe Data Centre Busway Market Share Analysis
Europe data centre busway market competitive landscape provides details by competitor. Details included are company overview, company financials, revenue generated, market potential, investment in research and development, new market initiatives, Europe presence, production sites and facilities, company strengths and weaknesses, product launch, product trials pipelines, product approvals, patents, product width and breadth, application dominance, technology lifeline curve. The above data points provided are only related to the companies’ focus related to Europe Data centre busway market.
The major players covered in the report EAE Inc., Vass Electrical Industries, Anord Mardix, ABB, Schneider Electric, Eaton, Siemens, Legrand, Delta Power Solutions, Megabarre Group, Ltd., TAIAN-ECOBAR TECHNOLOGY, FURUKAWA ELECTRIC CO.LTD., Vertiv Group Corp., Lapp Connecto Oy, Wetown, Rittal GmbH & Co. KG among other domestic players. DBMR analysts understand competitive strengths and provide competitive analysis for each competitor separately.
Many product developments are also initiated by the companies worldwide which are also accelerating the growth of Europe data centre busway market.
For instance,
- In March 2021, Anord Mardix partnered with Schneider Electric to design, manufacture and install bespoke switchgear and busbar for a Cloud Computing Client in Dublin. The company overcame the challenge of integrating with the already existing products in the building and space optimization. This helped the company to strengthen its product portfolio for the cloud computing clients and enhance the market reach.
- In February 2020, Lapp Connecto Oy installed a charging station employing busbar trunking system for a parking unit for car charging in Finland. Busbar units with tap-off provisions are used in case of further expansion. This project enhanced the company’s product portfolio and increased its offerings in the market.
Partnership, joint ventures and other strategies enhances the company market share with increased coverage and presence. It also provides the benefit for organisation to improve their offering for data centre busway through expanded range of size.
SKU-

- Interactive Data Analysis Dashboard
- Company Analysis Dashboard for high growth potential opportunities
- Research Analyst Access for customization & queries
- Competitor Analysis with Interactive dashboard
- Latest News, Updates & Trend analysis
- Harness the Power of Benchmark Analysis for Comprehensive Competitor Tracking
Table of Content
1 INTRODUCTION
1.1 OBJECTIVES OF THE STUDY
1.2 MARKET DEFINITION
1.3 OVERVIEW OF EUROPE DATA CENTER BUSWAY MARKET
1.4 CURRENCY AND PRICING
1.5 LIMITATIONS
1.6 MARKETS COVERED
2 MARKET SEGMENTATION
2.1 MARKETS COVERED
2.2 GEOGRAPHICAL SCOPE
2.3 YEARS CONSIDERED FOR THE STUDY
2.4 DBMR TRIPOD DATA VALIDATION MODEL
2.5 PRIMARY INTERVIEWS WITH KEY OPINION LEADERS
2.6 DBMR MARKET POSITION GRID
2.7 VENDOR SHARE ANALYSIS
2.8 MULTIVARIATE MODELING
2.9 PRODUCT TYPE TIMELINE CURVE
2.1 MARKET VERTICAL COVERAGE GRID
2.11 SECONDARY SOURCES
2.12 ASSUMPTIONS
3 EXECUTIVE SUMMARY
4 PREMIUM INSIGHTS
5 CASE STUDY
5.1 CASE STUDY 1- EXPANSION OF FUJITSU’S NORTH LONDON DATA CENTER FACILITY
5.2 CASE STUDY 2- NORTH CAROLINA BASED GIGA DATA CENTRE SERVICE PROVIDER CHOOSE ABB’S POWER DISTRIBUTION SOLUTIONS FOR ITS NEW DATA CENTRE
5.3 CASE STUDY 3- EATON’S BUSWAY ENABLES SMOOTH OPERATIONS AND NEW LEVELS OF DATA CENTER FLEXIBILITY
6 MARKET OVERVIEW
6.1 DRIVERS
6.1.1 HIGH BENEFITS OFFERED BY BUSWAY SYSTEMS ACTING AS AN ALTERNATIVE TO TRADITIONAL CABLE SYSTEM
6.1.2 HIGH POWER CONSUMPTION REQUIREMENT BY DATA CENTERS
6.1.3 RISING DEMANDS FOR COMPACT POWER DISTRIBUTION SYSTEMS
6.1.4 SURGING DEMAND FOR DATA CENTERS
6.1.5 EASE OF MONITORING THE POWER DISTRIBUTION SYSTEMS
6.2 RESTRAINTS
6.2.1 HIGH INSTALLATION COSTS
6.2.2 AVAILABILITY OF CHEAPER ALTERNATIVE POWER DISTRIBUTION SYSTEMS
6.3 OPPORTUNITIES
6.3.1 GROWING EMPHASIS ON DIGITALIZATION AND CLOUD COMPUTING
6.3.2 INCREASING INVESTMENTS IN THE DEVELOPMENT OF IT INFRASTRUCTURE
6.3.3 RAPID EMERGENCE OF ADVANCED TECHNOLOGIES
6.3.4 RISE IN BIG DATA GENERATION
6.4 CHALLENGES
6.4.1 LACK OF SKILLED LABOR FOR INSTALLATION OF BUSWAY SYSTEMS
6.4.2 HIGH COMPLEXITY OF DATA CENTER DESIGNS
7 IMPACT OF COVID-19 ON EUROPE DATA CENTER BUSWAY MARKET
7.1 ANALYSIS ON IMPACT OF COVID-19 ON THE MARKET
7.2 AFTERMATH OF COVID-19 AND GOVERNMENT INITIATIVE TO BOOST THE MARKET
7.3 STRATEGIC DECISIONS FOR MANUFACTURERS AFTER COVID-19 TO GAIN COMPETITIVE MARKET SHARE
7.4 IMPACT ON DEMAND
7.5 IMPACT ON SUPPLY CHAIN
7.6 IMPACT ON PRICE
7.7 CONCLUSION
8 EUROPE DATA CENTER BUSWAY MARKET, BY PRODUCT TYPE
8.1 OVERVIEW
8.2 POWER DISTRIBUTION UNITS (PDUS)
8.3 HIGH STRENGTH ENCLOSED BUSWAY (CFW)
8.4 INTENSIVE INSULATION PLUG BUSWAY (CMC)
8.5 AIR SPLICING BUSWAY (BMC)
8.6 OTHERS
9 EUROPE DATA CENTER BUSWAY MARKET, BY TYPE
9.1 OVERVIEW
9.2 3-PHASE 4-WIRE
9.2.1 CEILING OVERHEAD
9.2.2 RAISED FLOOR
9.3 3-PHASE 5-WIRE
9.3.1 CEILING OVERHEAD
9.3.2 RAISED FLOOR
9.4 OTHERS
10 EUROPE DATA CENTER BUSWAY MARKET, BY IMPLEMENTATION
10.1 OVERVIEW
10.2 CEILING OVERHEAD
10.3 RAISED FLOOR
11 EUROPE DATA CENTER BUSWAY MARKET, BY DATA CENTER TYPE
11.1 OVERVIEW
11.2 LARGE DATA CENTER
11.2.1 CEILING OVERHEAD
11.2.2 RAISED FLOOR
11.3 MID-SIZE & ENTERPRISE DATA CENTER
11.3.1 CEILING OVERHEAD
11.3.2 RAISED FLOOR
12 EUROPE DATA CENTER BUSWAY MARKET, BY CURRENT AMPERE
12.1 OVERVIEW
12.2 LOW
12.3 HIGH
13 EUROPE DATA CENTER BUSWAY MARKET, BY VERTICAL
13.1 OVERVIEW
13.2 IT & TELECOM
13.3 BANKING, FINANCIAL SERVICES AND INSURANCE (BFSI)
13.4 GOVERNMENT & DEFENSE
13.5 MANUFACTURING
13.6 RETAIL & ECOMMERCE
13.7 ENERGY & UTILITIES
13.8 HEALTHCARE
13.9 RESEARCH & ACADEMIA
13.1 OTHERS
14 EUROPE DATA CENTER BUSWAY MARKET, BY REGION
14.1 EUROPE
14.1.1 U.K.
14.1.2 GERMANY
14.1.3 FRANCE
14.1.4 NETHERLANDS
14.1.5 SWITZERLAND
14.1.6 ITALY
14.1.7 SPAIN
14.1.8 TURKEY
14.1.9 RUSSIA
14.1.10 BELGIUM
14.1.11 REST OF EUROPE
15 EUROPE DATA CENTER BUSWAY MARKET: COMPANY LANDSCAPE
15.1 COMPANY SHARE ANALYSIS: EUROPE
16 SWOT ANALYSIS
17 COMPANY PROFILE
17.1 ABB
17.1.1 COMPANY SNAPSHOT
17.1.2 REVENUE ANALYSIS
17.1.3 COMPANY SHARE ANALYSIS
17.1.4 PRODUCT PORTFOLIO
17.1.5 RECENT DEVELOPMENTS
17.2 SCHNEIDER ELECTRIC
17.2.1 COMPANY SNAPSHOT
17.2.2 REVENUE ANALYSIS
17.2.3 COMPANY SHARE ANALYSIS
17.2.4 PRODUCT PORTFOLIO
17.2.5 RECENT DEVELOPMENTS
17.3 SIEMENS
17.3.1 COMPANY SNAPSHOT
17.3.2 REVENUE ANALYSIS
17.3.3 COMPANY SHARE ANALYSIS
17.3.4 PRODUCT PORTFOLIO
17.3.5 RECENT DEVELOPMENTS
17.4 EATON
17.4.1 COMPANY SNAPSHOT
17.4.2 REVENUE ANALYSIS
17.4.3 COMPANY SHARE ANALYSIS
17.4.4 PRODUCT PORTFOLIO
17.4.5 RECENT DEVELOPMENTS
17.5 LEGRAND SA
17.5.1 COMPANY SNAPSHOT
17.5.2 REVENUE ANALYSIS
17.5.3 COMPANY SHARE ANALYSIS
17.5.4 PRODUCT PORTFOLIO
17.5.5 RECENT DEVELOPMENTS
17.6 VERTIV GROUP CORP.
17.6.1 COMPANY SNAPSHOT
17.6.2 REVENUE ANALYSIS
17.6.3 PRODUCT PORTFOLIO
17.6.4 RECENT DEVELOPMENTS
17.7 DELTA POWER SOLUTIONS
17.7.1 COMPANY SNAPSHOT
17.7.2 PRODUCT PORTFOLIO
17.7.3 RECENT DEVELOPMENTS
17.8 ANORD MARDIX
17.8.1 COMPANY SNAPSHOT
17.8.2 PRODUCT PORTFOLIO
17.8.3 RECENT DEVELOPMENTS
17.9 DINGSHENG GROUP
17.9.1 COMPANY SNAPSHOT
17.9.2 PRODUCT PORTFOLIO
17.9.3 RECENT DEVELOPMENT
17.1 EAE INC.
17.10.1 COMPANY SNAPSHOT
17.10.2 PRODUCT PORTFOLIO
17.10.3 RECENT DEVELOPMENTS
17.11 FURUKAWA ELECTRIC CO., LTD.
17.11.1 COMPANY SNAPSHOT
17.11.2 REVENUE ANALYSIS
17.11.3 PRODUCT PORTFOLIO
17.11.4 RECENT DEVELOPMENT
17.12 FURUTEC ELECTRICAL SDN BHD
17.12.1 COMPANY SNAPSHOT
17.12.2 PRODUCT PORTFOLIO
17.12.3 RECENT DEVELOPMENT
17.13 LAPP CONNECTO OY
17.13.1 COMPANY SNAPSHOT
17.13.2 PRODUCT PORTFOLIO
17.13.3 RECENT DEVELOPMENTS
17.14 MEGABARRE GROUP, LTD.
17.14.1 COMPANY SNAPSHOT
17.14.2 PRODUCT PORTFOLIO
17.14.3 RECENT DEVELOPMENTS
17.15 POWER PLUG BUSDUCT SDN. BHD.
17.15.1 COMPANY SNAPSHOT
17.15.2 PRODUCT PORTFOLIO
17.15.3 RECENT DEVELOPMENT
17.16 RITTAL GMBH & CO. KG
17.16.1 COMPANY SNAPSHOT
17.16.2 PRODUCT PORTFOLIO
17.16.3 RECENT DEVELOPMENT
17.17 TAIAN-ECOBAR TECHNOLOGY
17.17.1 COMPANY SNAPSHOT
17.17.2 PRODUCT PORTFOLIO
17.17.3 RECENT DEVELOPMENTS
17.18 TAI SIN ELECTRIC LIMITED
17.18.1 COMPANY SNAPSHOT
17.18.2 REVENUE ANALYSIS
17.18.3 PRODUCT PORTFOLIO
17.18.4 RECENT DEVELOPMENT
17.19 VASS ELECTRICAL INDISTRIES
17.19.1 COMPANY SNAPSHOT
17.19.2 PRODUCT PORTFOLIO
17.19.3 RECENT DEVELOPMENT
17.2 WETOWN
17.20.1 COMPANY SNAPSHOT
17.20.2 PRODUCT PORTFOLIO
17.20.3 RECENT DEVELOPMENT
18 QUESTIONNAIRE
19 RELATED REPORTS
List of Table
TABLE 1 EUROPE DATA CENTER BUSWAY MARKET, BY PRODUCT TYPE, 2019-2028 (USD MILLION)
TABLE 2 EUROPE POWER DISTRIBUTION UNITS (PDUS) IN DATA CENTER BUSWAY MARKET, BY REGION, 2019-2028 (USD MILLION)
TABLE 3 EUROPE HIGH STRENGTH ENCLOSED BUSWAY (CFW) IN DATA CENTER BUSWAY MARKET, BY REGION, 2019-2028 (USD MILLION)
TABLE 4 EUROPE INTENSIVE INSULATION PLUG BUSWAY (CMC) IN DATA CENTER BUSWAY MARKET, BY REGION, 2019-2028 (USD MILLION)
TABLE 5 EUROPE AIR SPLICING BUSWAY (BMC) IN DATA CENTER BUSWAY MARKET, BY REGION, 2019-2028 (USD MILLION)
TABLE 6 EUROPE OTHERS IN DATA CENTER BUSWAY MARKET, BY REGION, 2019-2028 (USD MILLION)
TABLE 7 EUROPE DATA CENTER BUSWAY MARKET, BY TYPE, 2019-2028 (USD MILLION)
TABLE 8 EUROPE 3-PHASE 4-WIRE IN DATA CENTER BUSWAY MARKET, BY REGION, 2019-2028 (USD MILLION)
TABLE 9 EUROPE 3-PHASE 4-WIRE IN DATA CENTER BUSWAY MARKET, BY IMPLEMENTATION, 2019-2028 (USD MILLION)
TABLE 10 EUROPE 3-PHASE 5-WIRE IN DATA CENTER BUSWAY MARKET, BY REGION, 2019-2028 (USD MILLION)
TABLE 11 EUROPE 3-PHASE 5-WIRE IN DATA CENTER BUSWAY MARKET, BY IMPLEMENTATION, 2019-2028 (USD MILLION)
TABLE 12 EUROPE OTHERS IN DATA CENTER BUSWAY MARKET, BY REGION, 2019-2028 (USD MILLION)
TABLE 13 EUROPE DATA CENTER BUSWAY MARKET, BY IMPLEMENTATION, 2019-2028 (USD MILLION)
TABLE 14 EUROPE CEILING OVERHEAD IN DATA CENTER BUSWAY MARKET, BY REGION, 2019-2028 (USD MILLION)
TABLE 15 EUROPE RAISED FLOOR IN DATA CENTER BUSWAY MARKET, BY REGION, 2019-2028 (USD MILLION)
TABLE 16 EUROPE DATA CENTER BUSWAY MARKET, BY DATA CENTER TYPE, 2019-2028 (USD MILLION)
TABLE 17 EUROPE LARGE DATA CENTER IN DATA CENTER BUSWAY MARKET, BY REGION, 2019-2028 (USD MILLION)
TABLE 18 EUROPE LARGE DATA CENTER IN DATA CENTER BUSWAY MARKET, BY IMPLEMENTATION, 2019-2028 (USD MILLION)
TABLE 19 EUROPE MID-SIZE & ENTERPRISE DATA CENTER IN DATA CENTER BUSWAY MARKET, BY REGION, 2019-2028 (USD MILLION)
TABLE 20 EUROPE MID-SIZE & ENTERPRISE DATA CENTER IN DATA CENTER BUSWAY MARKET, BY IMPLEMENTATION, 2019-2028 (USD MILLION)
TABLE 21 EUROPE DATA CENTER BUSWAY MARKET, BY CURRENT AMPERE, 2019-2028 (USD MILLION)
TABLE 22 EUROPE LOW IN DATA CENTER BUSWAY MARKET, BY REGION, 2019-2028 (USD MILLION)
TABLE 23 EUROPE HIGH IN DATA CENTER BUSWAY MARKET, BY REGION, 2019-2028 (USD MILLION)
TABLE 24 EUROPE DATA CENTER BUSWAY MARKET, BY VERTICAL, 2019-2028 (USD MILLION)
TABLE 25 EUROPE IT & TELECOM IN DATA CENTER BUSWAY MARKET, BY REGION, 2019-2028 (USD MILLION)
TABLE 26 EUROPE BANKING, FINANCIAL SERVICES AND INSURANCE (BFSI) IN DATA CENTER BUSWAY MARKET, BY REGION, 2019-2028 (USD MILLION)
TABLE 27 EUROPE GOVERNMENT & DEFENSE IN DATA CENTER BUSWAY MARKET, BY REGION, 2019-2028 (USD MILLION)
TABLE 28 EUROPE MANUFACTURING IN DATA CENTER BUSWAY MARKET, BY REGION, 2019-2028 (USD MILLION)
TABLE 29 EUROPE RETAIL & ECOMMERCE IN DATA CENTER BUSWAY MARKET, BY REGION, 2019-2028 (USD MILLION)
TABLE 30 EUROPE ENERGY & UTILITIES IN DATA CENTER BUSWAY MARKET, BY REGION, 2019-2028 (USD MILLION)
TABLE 31 EUROPE HEALTHCARE IN DATA CENTER BUSWAY MARKET, BY REGION, 2019-2028 (USD MILLION)
TABLE 32 EUROPE RESEARCH & ACADEMIA IN DATA CENTER BUSWAY MARKET, BY REGION, 2019-2028 (USD MILLION)
TABLE 33 EUROPE OTHERS IN DATA CENTER BUSWAY MARKET, BY REGION, 2019-2028 (USD MILLION)
TABLE 34 EUROPE DATA CENTER BUSWAY MARKET, BY COUNTRY, 2019-2028 (USD MILLION)
TABLE 35 EUROPE DATA CENTER BUSWAY MARKET, BY PRODUCT TYPE, 2019-2028 (USD MILLION)
TABLE 36 EUROPE DATA CENTER BUSWAY MARKET, BY TYPE, 2019-2028 (USD MILLION)
TABLE 37 EUROPE 3-PHASE 4-WIRE IN DATA CENTER BUSWAY MARKET, BY IMPLEMENTATION, 2019-2028 (USD MILLION)
TABLE 38 EUROPE 3-PHASE 5-WIRE IN DATA CENTER BUSWAY MARKET, BY IMPLEMENTATION, 2019-2028 (USD MILLION)
TABLE 39 EUROPE DATA CENTER BUSWAY MARKET, BY IMPLEMENTATION, 2019-2028 (USD MILLION)
TABLE 40 EUROPE DATA CENTER BUSWAY MARKET, BY DATA CENTER TYPE, 2019-2028 (USD MILLION)
TABLE 41 EUROPE LARGE DATA CENTER IN DATA CENTER BUSWAY MARKET, BY IMPLEMENTATION, 2019-2028 (USD MILLION)
TABLE 42 EUROPE MID-SIZE & ENTERPRISE DATA CENTER IN DATA CENTER BUSWAY MARKET, BY IMPLEMENTATION, 2019-2028 (USD MILLION)
TABLE 43 EUROPE DATA CENTER BUSWAY MARKET, BY CURRENT AMPERE, 2019-2028 (USD MILLION)
TABLE 44 EUROPE DATA CENTER BUSWAY MARKET, BY VERTICAL, 2019-2028 (USD MILLION)
TABLE 45 U.K. DATA CENTER BUSWAY MARKET, BY PRODUCT TYPE, 2019-2028 (USD MILLION)
TABLE 46 U.K. DATA CENTER BUSWAY MARKET, BY TYPE, 2019-2028 (USD MILLION)
TABLE 47 U.K. 3-PHASE 4-WIRE IN DATA CENTER BUSWAY MARKET, BY IMPLEMENTATION, 2019-2028 (USD MILLION)
TABLE 48 U.K. 3-PHASE 5-WIRE IN DATA CENTER BUSWAY MARKET, BY IMPLEMENTATION, 2019-2028 (USD MILLION)
TABLE 49 U.K. DATA CENTER BUSWAY MARKET, BY IMPLEMENTATION, 2019-2028 (USD MILLION)
TABLE 50 U.K. DATA CENTER BUSWAY MARKET, BY DATA CENTER TYPE, 2019-2028 (USD MILLION)
TABLE 51 U.K. LARGE DATA CENTER IN DATA CENTER BUSWAY MARKET, BY IMPLEMENTATION, 2019-2028 (USD MILLION)
TABLE 52 U.K. MID-SIZE & ENTERPRISE DATA CENTER IN DATA CENTER BUSWAY MARKET, BY IMPLEMENTATION, 2019-2028 (USD MILLION)
TABLE 53 U.K. DATA CENTER BUSWAY MARKET, BY CURRENT AMPERE, 2019-2028 (USD MILLION)
TABLE 54 U.K. DATA CENTER BUSWAY MARKET, BY VERTICAL, 2019-2028 (USD MILLION)
TABLE 55 GERMANY DATA CENTER BUSWAY MARKET, BY PRODUCT TYPE, 2019-2028 (USD MILLION)
TABLE 56 GERMANY DATA CENTER BUSWAY MARKET, BY TYPE, 2019-2028 (USD MILLION)
TABLE 57 GERMANY 3-PHASE 4-WIRE IN DATA CENTER BUSWAY MARKET, BY IMPLEMENTATION, 2019-2028 (USD MILLION)
TABLE 58 GERMANY 3-PHASE 5-WIRE IN DATA CENTER BUSWAY MARKET, BY IMPLEMENTATION, 2019-2028 (USD MILLION)
TABLE 59 GERMANY DATA CENTER BUSWAY MARKET, BY IMPLEMENTATION, 2019-2028 (USD MILLION)
TABLE 60 GERMANY DATA CENTER BUSWAY MARKET, BY DATA CENTER TYPE, 2019-2028 (USD MILLION)
TABLE 61 GERMANY LARGE DATA CENTER IN DATA CENTER BUSWAY MARKET, BY IMPLEMENTATION, 2019-2028 (USD MILLION)
TABLE 62 GERMANY MID-SIZE & ENTERPRISE DATA CENTER IN DATA CENTER BUSWAY MARKET, BY IMPLEMENTATION, 2019-2028 (USD MILLION)
TABLE 63 GERMANY DATA CENTER BUSWAY MARKET, BY CURRENT AMPERE, 2019-2028 (USD MILLION)
TABLE 64 GERMANY DATA CENTER BUSWAY MARKET, BY VERTICAL, 2019-2028 (USD MILLION)
TABLE 65 FRANCE DATA CENTER BUSWAY MARKET, BY PRODUCT TYPE, 2019-2028 (USD MILLION)
TABLE 66 FRANCE DATA CENTER BUSWAY MARKET, BY TYPE, 2019-2028 (USD MILLION)
TABLE 67 FRANCE 3-PHASE 4-WIRE IN DATA CENTER BUSWAY MARKET, BY IMPLEMENTATION, 2019-2028 (USD MILLION)
TABLE 68 FRANCE 3-PHASE 5-WIRE IN DATA CENTER BUSWAY MARKET, BY IMPLEMENTATION, 2019-2028 (USD MILLION)
TABLE 69 FRANCE DATA CENTER BUSWAY MARKET, BY IMPLEMENTATION, 2019-2028 (USD MILLION)
TABLE 70 FRANCE DATA CENTER BUSWAY MARKET, BY DATA CENTER TYPE, 2019-2028 (USD MILLION)
TABLE 71 FRANCE LARGE DATA CENTER IN DATA CENTER BUSWAY MARKET, BY IMPLEMENTATION, 2019-2028 (USD MILLION)
TABLE 72 FRANCE MID-SIZE & ENTERPRISE DATA CENTER IN DATA CENTER BUSWAY MARKET, BY IMPLEMENTATION, 2019-2028 (USD MILLION)
TABLE 73 FRANCE DATA CENTER BUSWAY MARKET, BY CURRENT AMPERE, 2019-2028 (USD MILLION)
TABLE 74 FRANCE DATA CENTER BUSWAY MARKET, BY VERTICAL, 2019-2028 (USD MILLION)
TABLE 75 NETHERLANDS DATA CENTER BUSWAY MARKET, BY PRODUCT TYPE, 2019-2028 (USD MILLION)
TABLE 76 NETHERLANDS DATA CENTER BUSWAY MARKET, BY TYPE, 2019-2028 (USD MILLION)
TABLE 77 NETHERLANDS 3-PHASE 4-WIRE IN DATA CENTER BUSWAY MARKET, BY IMPLEMENTATION, 2019-2028 (USD MILLION)
TABLE 78 NETHERLANDS 3-PHASE 5-WIRE IN DATA CENTER BUSWAY MARKET, BY IMPLEMENTATION, 2019-2028 (USD MILLION)
TABLE 79 NETHERLANDS DATA CENTER BUSWAY MARKET, BY IMPLEMENTATION, 2019-2028 (USD MILLION)
TABLE 80 NETHERLANDS DATA CENTER BUSWAY MARKET, BY DATA CENTER TYPE, 2019-2028 (USD MILLION)
TABLE 81 NETHERLANDS LARGE DATA CENTER IN DATA CENTER BUSWAY MARKET, BY IMPLEMENTATION, 2019-2028 (USD MILLION)
TABLE 82 NETHERLANDS MID-SIZE & ENTERPRISE DATA CENTER IN DATA CENTER BUSWAY MARKET, BY IMPLEMENTATION, 2019-2028 (USD MILLION)
TABLE 83 NETHERLANDS DATA CENTER BUSWAY MARKET, BY CURRENT AMPERE, 2019-2028 (USD MILLION)
TABLE 84 NETHERLANDS DATA CENTER BUSWAY MARKET, BY VERTICAL, 2019-2028 (USD MILLION)
TABLE 85 SWITZERLAND DATA CENTER BUSWAY MARKET, BY PRODUCT TYPE, 2019-2028 (USD MILLION)
TABLE 86 SWITZERLAND DATA CENTER BUSWAY MARKET, BY TYPE, 2019-2028 (USD MILLION)
TABLE 87 SWITZERLAND 3-PHASE 4-WIRE IN DATA CENTER BUSWAY MARKET, BY IMPLEMENTATION, 2019-2028 (USD MILLION)
TABLE 88 SWITZERLAND 3-PHASE 5-WIRE IN DATA CENTER BUSWAY MARKET, BY IMPLEMENTATION, 2019-2028 (USD MILLION)
TABLE 89 SWITZERLAND DATA CENTER BUSWAY MARKET, BY IMPLEMENTATION, 2019-2028 (USD MILLION)
TABLE 90 SWITZERLAND DATA CENTER BUSWAY MARKET, BY DATA CENTER TYPE, 2019-2028 (USD MILLION)
TABLE 91 SWITZERLAND LARGE DATA CENTER IN DATA CENTER BUSWAY MARKET, BY IMPLEMENTATION, 2019-2028 (USD MILLION)
TABLE 92 SWITZERLAND MID-SIZE & ENTERPRISE DATA CENTER IN DATA CENTER BUSWAY MARKET, BY IMPLEMENTATION, 2019-2028 (USD MILLION)
TABLE 93 SWITZERLAND DATA CENTER BUSWAY MARKET, BY CURRENT AMPERE, 2019-2028 (USD MILLION)
TABLE 94 SWITZERLAND DATA CENTER BUSWAY MARKET, BY VERTICAL, 2019-2028 (USD MILLION)
TABLE 95 ITALY DATA CENTER BUSWAY MARKET, BY PRODUCT TYPE, 2019-2028 (USD MILLION)
TABLE 96 ITALY DATA CENTER BUSWAY MARKET, BY TYPE, 2019-2028 (USD MILLION)
TABLE 97 ITALY 3-PHASE 4-WIRE IN DATA CENTER BUSWAY MARKET, BY IMPLEMENTATION, 2019-2028 (USD MILLION)
TABLE 98 ITALY 3-PHASE 5-WIRE IN DATA CENTER BUSWAY MARKET, BY IMPLEMENTATION, 2019-2028 (USD MILLION)
TABLE 99 ITALY DATA CENTER BUSWAY MARKET, BY IMPLEMENTATION, 2019-2028 (USD MILLION)
TABLE 100 ITALY DATA CENTER BUSWAY MARKET, BY DATA CENTER TYPE, 2019-2028 (USD MILLION)
TABLE 101 ITALY LARGE DATA CENTER IN DATA CENTER BUSWAY MARKET, BY IMPLEMENTATION, 2019-2028 (USD MILLION)
TABLE 102 ITALY MID-SIZE & ENTERPRISE DATA CENTER IN DATA CENTER BUSWAY MARKET, BY IMPLEMENTATION, 2019-2028 (USD MILLION)
TABLE 103 ITALY DATA CENTER BUSWAY MARKET, BY CURRENT AMPERE, 2019-2028 (USD MILLION)
TABLE 104 ITALY DATA CENTER BUSWAY MARKET, BY VERTICAL, 2019-2028 (USD MILLION)
TABLE 105 SPAIN DATA CENTER BUSWAY MARKET, BY PRODUCT TYPE, 2019-2028 (USD MILLION)
TABLE 106 SPAIN DATA CENTER BUSWAY MARKET, BY TYPE, 2019-2028 (USD MILLION)
TABLE 107 SPAIN 3-PHASE 4-WIRE IN DATA CENTER BUSWAY MARKET, BY IMPLEMENTATION, 2019-2028 (USD MILLION)
TABLE 108 SPAIN 3-PHASE 5-WIRE IN DATA CENTER BUSWAY MARKET, BY IMPLEMENTATION, 2019-2028 (USD MILLION)
TABLE 109 SPAIN DATA CENTER BUSWAY MARKET, BY IMPLEMENTATION, 2019-2028 (USD MILLION)
TABLE 110 SPAIN DATA CENTER BUSWAY MARKET, BY DATA CENTER TYPE, 2019-2028 (USD MILLION)
TABLE 111 SPAIN LARGE DATA CENTER IN DATA CENTER BUSWAY MARKET, BY IMPLEMENTATION, 2019-2028 (USD MILLION)
TABLE 112 SPAIN MID-SIZE & ENTERPRISE DATA CENTER IN DATA CENTER BUSWAY MARKET, BY IMPLEMENTATION, 2019-2028 (USD MILLION)
TABLE 113 SPAIN DATA CENTER BUSWAY MARKET, BY CURRENT AMPERE, 2019-2028 (USD MILLION)
TABLE 114 SPAIN DATA CENTER BUSWAY MARKET, BY VERTICAL, 2019-2028 (USD MILLION)
TABLE 115 TURKEY DATA CENTER BUSWAY MARKET, BY PRODUCT TYPE, 2019-2028 (USD MILLION)
TABLE 116 TURKEY DATA CENTER BUSWAY MARKET, BY TYPE, 2019-2028 (USD MILLION)
TABLE 117 TURKEY 3-PHASE 4-WIRE IN DATA CENTER BUSWAY MARKET, BY IMPLEMENTATION, 2019-2028 (USD MILLION)
TABLE 118 TURKEY 3-PHASE 5-WIRE IN DATA CENTER BUSWAY MARKET, BY IMPLEMENTATION, 2019-2028 (USD MILLION)
TABLE 119 TURKEY DATA CENTER BUSWAY MARKET, BY IMPLEMENTATION, 2019-2028 (USD MILLION)
TABLE 120 TURKEY DATA CENTER BUSWAY MARKET, BY DATA CENTER TYPE, 2019-2028 (USD MILLION)
TABLE 121 TURKEY LARGE DATA CENTER IN DATA CENTER BUSWAY MARKET, BY IMPLEMENTATION, 2019-2028 (USD MILLION)
TABLE 122 TURKEY MID-SIZE & ENTERPRISE DATA CENTER IN DATA CENTER BUSWAY MARKET, BY IMPLEMENTATION, 2019-2028 (USD MILLION)
TABLE 123 TURKEY DATA CENTER BUSWAY MARKET, BY CURRENT AMPERE, 2019-2028 (USD MILLION)
TABLE 124 TURKEY DATA CENTER BUSWAY MARKET, BY VERTICAL, 2019-2028 (USD MILLION)
TABLE 125 RUSSIA DATA CENTER BUSWAY MARKET, BY PRODUCT TYPE, 2019-2028 (USD MILLION)
TABLE 126 RUSSIA DATA CENTER BUSWAY MARKET, BY TYPE, 2019-2028 (USD MILLION)
TABLE 127 RUSSIA 3-PHASE 4-WIRE IN DATA CENTER BUSWAY MARKET, BY IMPLEMENTATION, 2019-2028 (USD MILLION)
TABLE 128 RUSSIA 3-PHASE 5-WIRE IN DATA CENTER BUSWAY MARKET, BY IMPLEMENTATION, 2019-2028 (USD MILLION)
TABLE 129 RUSSIA DATA CENTER BUSWAY MARKET, BY IMPLEMENTATION, 2019-2028 (USD MILLION)
TABLE 130 RUSSIA DATA CENTER BUSWAY MARKET, BY DATA CENTER TYPE, 2019-2028 (USD MILLION)
TABLE 131 RUSSIA LARGE DATA CENTER IN DATA CENTER BUSWAY MARKET, BY IMPLEMENTATION, 2019-2028 (USD MILLION)
TABLE 132 RUSSIA MID-SIZE & ENTERPRISE DATA CENTER IN DATA CENTER BUSWAY MARKET, BY IMPLEMENTATION, 2019-2028 (USD MILLION)
TABLE 133 RUSSIA DATA CENTER BUSWAY MARKET, BY CURRENT AMPERE, 2019-2028 (USD MILLION)
TABLE 134 RUSSIA DATA CENTER BUSWAY MARKET, BY VERTICAL, 2019-2028 (USD MILLION)
TABLE 135 BELGIUM DATA CENTER BUSWAY MARKET, BY PRODUCT TYPE, 2019-2028 (USD MILLION)
TABLE 136 BELGIUM DATA CENTER BUSWAY MARKET, BY TYPE, 2019-2028 (USD MILLION)
TABLE 137 BELGIUM 3-PHASE 4-WIRE IN DATA CENTER BUSWAY MARKET, BY IMPLEMENTATION, 2019-2028 (USD MILLION)
TABLE 138 BELGIUM 3-PHASE 5-WIRE IN DATA CENTER BUSWAY MARKET, BY IMPLEMENTATION, 2019-2028 (USD MILLION)
TABLE 139 BELGIUM DATA CENTER BUSWAY MARKET, BY IMPLEMENTATION, 2019-2028 (USD MILLION)
TABLE 140 BELGIUM DATA CENTER BUSWAY MARKET, BY DATA CENTER TYPE, 2019-2028 (USD MILLION)
TABLE 141 BELGIUM LARGE DATA CENTER IN DATA CENTER BUSWAY MARKET, BY IMPLEMENTATION, 2019-2028 (USD MILLION)
TABLE 142 BELGIUM MID-SIZE & ENTERPRISE DATA CENTER IN DATA CENTER BUSWAY MARKET, BY IMPLEMENTATION, 2019-2028 (USD MILLION)
TABLE 143 BELGIUM DATA CENTER BUSWAY MARKET, BY CURRENT AMPERE, 2019-2028 (USD MILLION)
TABLE 144 BELGIUM DATA CENTER BUSWAY MARKET, BY VERTICAL, 2019-2028 (USD MILLION)
TABLE 145 REST OF EUROPE DATA CENTER BUSWAY MARKET, BY PRODUCT TYPE, 2019-2028 (USD MILLION)
List of Figure
FIGURE 1 EUROPE DATA CENTER BUSWAY MARKET: SEGMENTATION
FIGURE 2 EUROPE DATA CENTER BUSWAY MARKET: DATA TRIANGULATION
FIGURE 3 EUROPE DATA CENTER BUSWAY MARKET: DROC ANALYSIS
FIGURE 4 EUROPE DATA CENTER BUSWAY MARKET: EUROPE VS REGIONAL MARKET ANALYSIS
FIGURE 5 EUROPE DATA CENTER BUSWAY MARKET: COMPANY RESEARCH ANALYSIS
FIGURE 6 EUROPE DATA CENTER BUSWAY MARKET: INTERVIEW DEMOGRAPHICS
FIGURE 7 EUROPE DATA CENTER BUSWAY MARKET: DBMR MARKET POSITION GRID
FIGURE 8 EUROPE DATA CENTER BUSWAY MARKET: VENDOR SHARE ANALYSIS
FIGURE 9 EUROPE DATA CENTER BUSWAY MARKET: MARKET VERTICAL COVERAGE GRID
FIGURE 10 EUROPE DATA CENTER BUSWAY MARKET: SEGMENTATION
FIGURE 11 RISING DEMAND FOR COMPACT POWER DISTRIBUTION SYSTEMS IS EXPECTED TO DRIVE EUROPE DATA CENTER BUSWAY MARKET IN THE FORECAST PERIOD OF 2021 TO 2028
FIGURE 12 POWER DISTRIBUTION UNITS (PDUS) SEGMENT IS EXPECTED TO ACCOUNT FOR THE LARGEST SHARE OF EUROPE DATA CENTER BUSWAY MARKET IN 2021 & 2028
FIGURE 13 DRIVERS, RESTRAINTS, OPPORTUNITIES AND CHALLENGES OF EUROPE DATA CENTER BUSWAY MARKET
FIGURE 14 EUROPE DATA CENTER BUSWAY MARKET: BY PRODUCT TYPE, 2020
FIGURE 15 EUROPE DATA CENTER BUSWAY MARKET: BY TYPE, 2020
FIGURE 16 EUROPE DATA CENTER BUSWAY MARKET: BY IMPLEMENTATION, 2020
FIGURE 17 EUROPE DATA CENTER BUSWAY MARKET: BY DATA CENTER TYPE, 2020
FIGURE 18 EUROPE DATA CENTER BUSWAY MARKET: BY CURRENT AMPERE, 2020
FIGURE 19 EUROPE DATA CENTER BUSWAY MARKET: BY VERTICAL, 2020
FIGURE 20 EUROPE DATA CENTER BUSWAY MARKET: SNAPSHOT (2020)
FIGURE 21 EUROPE DATA CENTER BUSWAY MARKET: BY COUNTRY (2020)
FIGURE 22 EUROPE DATA CENTER BUSWAY MARKET: BY COUNTRY (2021 & 2028)
FIGURE 23 EUROPE DATA CENTER BUSWAY MARKET: BY COUNTRY (2020 & 2028)
FIGURE 24 EUROPE DATA CENTER BUSWAY MARKET: BY PRODUCT TYPE (2021-2028)
FIGURE 25 EUROPE DATA CENTER BUSWAY MARKET: COMPANY SHARE 2020 (%)
Data collection and base year analysis are done using data collection modules with large sample sizes. The stage includes obtaining market information or related data through various sources and strategies. It includes examining and planning all the data acquired from the past in advance. It likewise envelops the examination of information inconsistencies seen across different information sources. The market data is analysed and estimated using market statistical and coherent models. Also, market share analysis and key trend analysis are the major success factors in the market report. To know more, please request an analyst call or drop down your inquiry.
The key research methodology used by DBMR research team is data triangulation which involves data mining, analysis of the impact of data variables on the market and primary (industry expert) validation. Data models include Vendor Positioning Grid, Market Time Line Analysis, Market Overview and Guide, Company Positioning Grid, Patent Analysis, Pricing Analysis, Company Market Share Analysis, Standards of Measurement, Global versus Regional and Vendor Share Analysis. To know more about the research methodology, drop in an inquiry to speak to our industry experts.
Data Bridge Market Research is a leader in advanced formative research. We take pride in servicing our existing and new customers with data and analysis that match and suits their goal. The report can be customized to include price trend analysis of target brands understanding the market for additional countries (ask for the list of countries), clinical trial results data, literature review, refurbished market and product base analysis. Market analysis of target competitors can be analyzed from technology-based analysis to market portfolio strategies. We can add as many competitors that you require data about in the format and data style you are looking for. Our team of analysts can also provide you data in crude raw excel files pivot tables (Fact book) or can assist you in creating presentations from the data sets available in the report.


