
Europe Fitness App Market
Market Size in USD Billion
 USD
3.76 Billion
USD
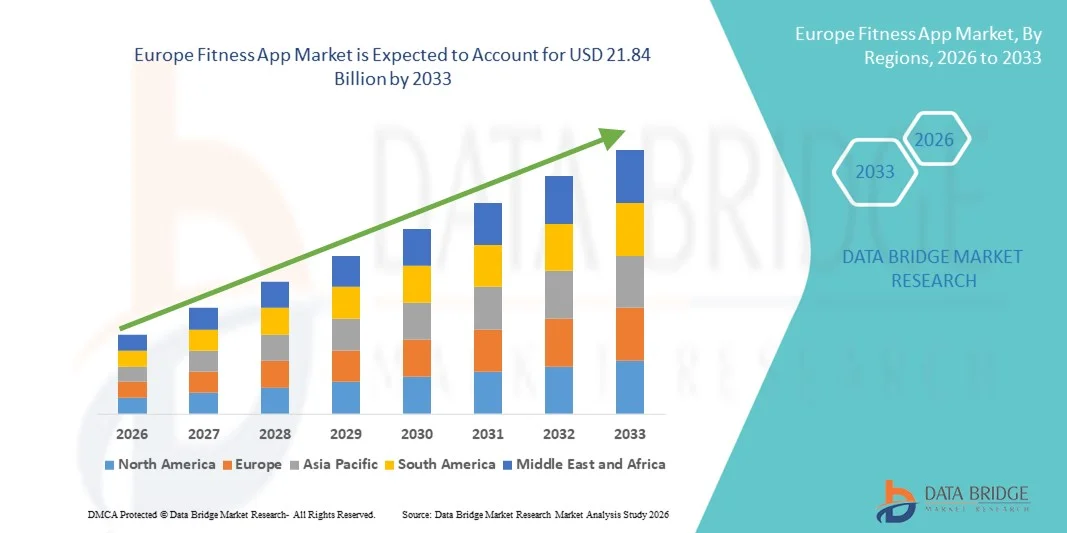
21.84 Billion
2025
2033
USD
3.76 Billion
USD
21.84 Billion
2025
2033
| 2026 - 2033 | |
| USD 3.76 Billion | |
| USD 21.84 Billion | |
| % | |
|
Europe Fitness App Market Size
- The Europe Fitness App market size was valued at USD 3.76 billion in 2025 and is expected to reach USD 21.84 billion by 2033, at a CAGR of 24.60% during the forecast period
- The market growth is largely fueled by the increasing global focus on preventive healthcare, rising awareness of physical fitness, and the rapid proliferation of smartphones and wearable devices, leading to higher digital engagement in both individual and corporate wellness programs
- Furthermore, growing consumer demand for personalized workout plans, real-time health tracking, nutrition guidance, and integrated wellness solutions is establishing fitness apps as a preferred digital health companion. These converging factors are accelerating the adoption of Fitness App platforms across diverse age groups, thereby significantly boosting the overall industry growth
Europe Fitness App Market Analysis
- Fitness apps, offering digital platforms for workout tracking, personalized exercise plans, calorie monitoring, and overall wellness management, are increasingly becoming integral components of modern preventive healthcare in both individual and corporate settings due to their accessibility, real-time performance insights, and seamless integration with smartphones and wearable devices
- The escalating demand for fitness apps is primarily fueled by rising health awareness, increasing prevalence of lifestyle-related diseases, growing smartphone penetration, and a strong consumer shift toward convenient, on-demand digital health and wellness solutions
- U.K. dominated the fitness app market with the largest revenue share of 34.2% in 2025, supported by its vast smartphone user base, strong digital ecosystem, high adoption of mobile payment subscriptions, and the growing popularity of app-based workout programs, live-streamed fitness sessions, and AI-enabled health tracking features across urban populations.
- Germany is expected to be the fastest-growing market in the fitness app industry during the forecast period, projected to register a CAGR from 2026 to 2033, driven by increasing health consciousness among young consumers, rapid internet penetration, expansion of affordable data services, rising disposable incomes, and the growing popularity of subscription-based and vernacular-language fitness platforms
- The Android segment held the largest revenue share of 68.4% in 2025, attributed to its extensive global smartphone user base and affordability across developing regions
Report Scope and Fitness App Market Segmentation
|
Attributes |
Fitness App Key Market Insights |
|
Segments Covered |
|
|
Countries Covered |
Europe
|
|
Key Market Players |
|
|
Market Opportunities |
|
|
Value Added Data Infosets |
In addition to the insights on market scenarios such as market value, growth rate, segmentation, geographical coverage, and major players, the market reports curated by the Data Bridge Market Research also include in-depth expert analysis, patient epidemiology, pipeline analysis, pricing analysis, and regulatory framework. |
Europe Fitness App Market Trends
AI-Powered Personalization and Data-Driven Wellness Ecosystems
- A significant and accelerating trend in the global fitness app market is the deep integration of artificial intelligence (AI), machine learning, and advanced data analytics to deliver highly personalized workout and wellness experiences. Fitness apps are increasingly leveraging AI algorithms to analyze user behavior, health metrics, and activity history to provide customized workout plans, nutrition guidance, and progress tracking
- For instance, platforms such as MyFitnessPal and Strava use data insights to offer personalized recommendations and performance analytics, enhancing user engagement and retention. Similarly, Nike Training Club provides adaptive training programs based on user goals and fitness levels
- AI integration enables features such as predictive performance analysis, real-time coaching feedback, and adaptive difficulty adjustments. Some advanced fitness platforms now incorporate wearable device synchronization to monitor heart rate, sleep patterns, and calorie expenditure, enabling holistic health management
- The seamless integration of fitness apps with wearables and digital health ecosystems facilitates centralized tracking of workouts, diet, and wellness metrics through a single interface. This interconnected approach enhances user convenience and creates a comprehensive digital fitness environment
- This shift toward intelligent, adaptive, and user-centric fitness solutions is reshaping consumer expectations globally. Consequently, companies such as Fitbit and Peloton are continuously enhancing AI-driven capabilities within their digital platforms to strengthen customer loyalty and subscription growth
- The demand for personalized, data-driven fitness applications is expanding rapidly across North America, Europe, Asia-Pacific, and emerging markets, as consumers increasingly prioritize preventive healthcare, remote wellness access, and measurable fitness outcomes
Europe Fitness App Market Dynamics
Driver
Rising Health Awareness and Growing Adoption of Digital Fitness Solutions
- The increasing global awareness regarding preventive healthcare, lifestyle diseases, and physical well-being is a major driver accelerating the demand for fitness applications. Rising cases of obesity, diabetes, and cardiovascular disorders are encouraging individuals to actively monitor their fitness levels through digital tools
- For instance, growing participation in virtual fitness programs and online workout subscriptions has significantly increased since the post-pandemic period, with companies such as Centr and Freeletics reporting strong global subscriber growth
- The widespread adoption of smartphones and improved internet penetration, particularly in Asia-Pacific and Latin America, has further expanded access to app-based fitness solutions. Consumers increasingly prefer flexible, on-demand workout programs that can be accessed anytime and anywhere
- Corporate wellness initiatives and partnerships between employers and digital fitness platforms are also contributing to market expansion. Many organizations are integrating fitness apps into employee wellness programs to improve productivity and reduce healthcare costs
- The convenience of home-based workouts, virtual coaching, progress tracking, and social fitness communities continues to propel global adoption across both developed and developing economies
Restraint/Challenge
Data Privacy Concerns and Subscription Fatigue
- Concerns regarding data privacy and the protection of sensitive health information pose a significant challenge to the broader adoption of fitness applications. As these platforms collect personal health data, location information, and biometric metrics, users are increasingly cautious about data misuse or breaches
- For instance, in recent years, regulatory scrutiny on digital health platforms has increased globally, and companies such as Strava have previously faced public criticism regarding the exposure of user location data through heatmaps, raising awareness about potential privacy risks associated with fitness tracking applications
- In addition, subscription fatigue represents another restraint in the global Fitness App market. Many advanced fitness platforms operate on monthly or annual subscription models, which can discourage long-term retention, particularly among price-sensitive consumers
- While freemium models offer basic features at no cost, premium functionalities such as personalized coaching, advanced analytics, and exclusive training content often require paid subscriptions, limiting adoption in developing regions
- Overcoming these challenges through enhanced cybersecurity frameworks, transparent data policies, flexible pricing strategies, and value-driven subscription models will be essential to sustaining long-term global market growth
Europe Fitness App Market Scope
The market is segmented on the basis of product, type, application, therapeutic area, operating system, mode of purchase, end user, and distribution channel.
- By Product
On the basis of product, the Fitness App market is segmented into care management apps, vital sign monitoring apps, health and wellness apps, women health apps, medication management apps, consultancy apps, and others. The health and wellness apps segment dominated the largest market revenue share of 34.6% in 2025, driven by the growing global focus on preventive healthcare and lifestyle management. Increasing awareness regarding obesity, stress, and sedentary habits has significantly boosted adoption. These apps offer personalized workout routines, calorie tracking, hydration reminders, and mental wellness programs. Integration with wearable devices such as smartwatches enhances real-time monitoring capabilities. Corporate wellness programs are increasingly incorporating such apps to improve employee health and productivity. The availability of subscription-based premium features further supports revenue generation. Gamification, AI-based coaching, and virtual fitness communities increase user engagement and retention. Rising smartphone penetration across emerging markets strengthens accessibility. Continuous innovation in user interface design improves customer experience. The segment benefits from rising health consciousness among millennials and Gen Z populations. Partnerships between app developers and healthcare providers further expand credibility.
The vital sign monitoring apps segment is anticipated to witness the fastest growth rate with a CAGR of 22.4% from 2026 to 2033, fueled by increasing demand for remote health tracking and chronic disease management. Rising cases of hypertension, diabetes, and cardiovascular diseases are accelerating adoption. These apps enable continuous monitoring of heart rate, blood pressure, oxygen saturation, and glucose levels. Integration with Bluetooth-enabled medical devices enhances accuracy and reliability. Telehealth expansion is creating strong demand for digital patient monitoring tools. Governments are promoting digital health ecosystems to reduce hospital burden. Aging populations globally further contribute to segment expansion. Data-sharing capabilities with physicians improve treatment outcomes. AI-powered analytics provide predictive health insights. Increased awareness of preventive care is encouraging early diagnosis. Growing investments in digital therapeutics also strengthen the segment’s rapid growth trajectory.
- By Type
On the basis of type, the Fitness App market is segmented into connected apps and in-built devices apps. The connected apps segment held the largest market revenue share of 61.8% in 2025, driven by seamless synchronization with wearables and IoT-enabled devices. Consumers increasingly prefer apps that integrate with fitness bands and smartwatches. Cloud-based storage enables long-term tracking of health metrics. Advanced analytics and AI-driven recommendations improve personalization. Healthcare providers leverage connected apps for remote monitoring programs. High-speed internet penetration further supports adoption. Continuous software updates enhance functionality and security. Interoperability with multiple operating systems increases accessibility. Corporate and insurance wellness initiatives drive additional usage. The ability to share reports with medical professionals strengthens value proposition. Growing health data awareness contributes to sustained dominance.
The in-built devices apps segment is expected to witness the fastest CAGR of 19.9% from 2026 to 2033, supported by smartphone manufacturers embedding health-tracking features directly into devices. Consumers favor pre-installed applications requiring minimal setup. Advancements in sensor technology improve accuracy of data collection. Built-in AI tools offer instant feedback without third-party downloads. Enhanced battery optimization supports continuous tracking. Privacy-focused features improve user trust. Increased adoption of smart devices globally accelerates growth. Hardware-software integration enhances overall performance.
- By Application
On the basis of application, the Fitness App market is segmented into training, tracking, fitness games, and others. The tracking segment accounted for the largest market revenue share of 38.3% in 2025, driven by strong consumer demand for real-time performance and health monitoring. Users increasingly rely on tracking features such as step counting, calorie expenditure measurement, distance tracking, sleep monitoring, hydration logs, and heart rate analysis. Growing awareness regarding preventive healthcare and daily fitness targets significantly boosts engagement levels. Integration with wearable devices such as smartwatches and fitness bands enhances data accuracy and seamless synchronization. Long-term progress visualization through dashboards and performance analytics encourages consistent usage. Healthcare professionals recommend tracking tools for managing obesity, hypertension, and other lifestyle-related conditions. Cloud-based storage ensures secure data backup and cross-device accessibility. Corporate wellness initiatives further promote adoption among working professionals. AI-driven insights provide customized activity suggestions. Increasing health consciousness across millennials and aging populations sustains dominance. Rising smartphone penetration in emerging markets also contributes to the segment’s leadership position.
The fitness games segment is expected to witness the fastest CAGR of 23.1% from 2026 to 2033, fueled by the rising popularity of gamification and immersive workout experiences. Users are increasingly attracted to interactive platforms that combine entertainment with physical activity. Integration of augmented reality (AR) and virtual reality (VR) technologies enhances engagement and motivation. Younger demographics prefer competitive fitness challenges, virtual races, and leaderboard-based rewards. Social sharing features strengthen community participation and peer motivation. Fitness gaming platforms improve adherence rates compared to traditional workout apps. Partnerships between fitness developers and gaming companies accelerate innovation. Subscription-based gaming fitness models contribute to higher revenue growth. Increasing demand for home-based digital fitness solutions post-pandemic further boosts expansion. Continuous advancements in motion-sensing and AI tracking improve gameplay accuracy. The segment is also gaining traction in corporate wellness and educational fitness programs. Rising demand for hybrid entertainment-fitness experiences supports rapid CAGR growth.
- By Therapeutic Area
On the basis of therapeutic area, the Fitness App market is segmented into cardiovascular, dermatology & skin cancer, ophthalmology, diabetes, respiratory, audiology, sleep disorders, nutrition, and others. The diabetes segment dominated with a 27.5% revenue share in 2025, driven by the increasing global prevalence of diabetes and prediabetes conditions. Fitness apps designed for diabetes management offer glucose tracking, insulin logging, carbohydrate counting, medication reminders, and diet planning features. Growing adoption of continuous glucose monitoring (CGM) devices integrated with apps enhances real-time data tracking. Healthcare providers increasingly encourage digital tools for better glycemic control. Rising awareness regarding lifestyle modifications strengthens adoption. Government initiatives promoting digital health solutions also contribute to growth. AI-powered alerts help prevent hyperglycemia and hypoglycemia episodes. Remote monitoring capabilities allow physicians to track patient progress efficiently. Increasing investment in digital therapeutics further expands the segment. Smartphone accessibility improves patient engagement and compliance. Growing aging population and sedentary lifestyles sustain long-term demand.
The sleep disorders segment is projected to witness the fastest CAGR of 21.3% from 2026 to 2033, supported by rising awareness about sleep quality and mental well-being. Increasing stress levels, work pressure, and screen exposure are contributing to sleep-related issues globally. Fitness apps now provide sleep cycle tracking, snore detection, relaxation sounds, meditation modules, and breathing exercises. Integration with wearable sensors enhances accuracy in monitoring REM and deep sleep stages. Consumers are prioritizing holistic health, including rest and recovery metrics. Mental health awareness campaigns are also supporting segment growth. Employers are incorporating sleep wellness programs in corporate initiatives. Subscription-based premium sleep analytics features drive revenue expansion. AI-based personalized sleep improvement suggestions enhance user retention. Rising cases of insomnia and anxiety disorders accelerate demand. Continuous innovation in bio-sensing technologies further strengthens the segment’s rapid growth trajectory.
- By Operating System
On the basis of operating system, the Fitness App market is segmented into iOS, Android, and Windows. The Android segment held the largest revenue share of 68.4% in 2025, attributed to its extensive global smartphone user base and affordability across developing regions. Android devices dominate emerging markets such as Asia-Pacific, Latin America, and parts of Africa. The open-source ecosystem encourages rapid development and deployment of fitness applications. Compatibility with a wide range of wearable brands enhances accessibility. Frequent software updates improve security and performance. App store flexibility enables diverse pricing models including freemium and ad-supported formats. Rising digital literacy further supports adoption. Strong penetration among middle-income consumers strengthens revenue generation. Integration with third-party health devices ensures broader functionality. Increasing government digitalization initiatives also boost Android usage. Growing youth population in emerging economies sustains market leadership.
The iOS segment is expected to witness the fastest CAGR of 20.6% from 2026 to 2033, driven by higher consumer spending capacity and strong ecosystem integration. iOS users demonstrate greater willingness to pay for premium subscriptions and in-app purchases. Seamless connectivity with Apple Watch and other Apple health devices enhances user experience. Advanced privacy and data protection features increase consumer trust. Optimized app performance ensures smoother analytics and tracking. Growing adoption in developed markets such as North America and Europe supports expansion. Continuous innovation in wearable hardware strengthens ecosystem dependency. Corporate executives and health-conscious professionals increasingly prefer premium iOS-based solutions. Developer focus on high-quality UI/UX design enhances engagement. Rising adoption of AI-driven health insights also contributes to faster growth.
- By Mode of Purchase
On the basis of mode of purchase, the Fitness App market is segmented into subscription-based and non-subscription-based. The subscription-based segment dominated with a 57.9% revenue share in 2025, supported by recurring revenue models and premium service offerings. Users increasingly prefer structured workout programs, personalized coaching, and advanced analytics available under paid plans. Subscription models ensure continuous feature updates and content refreshment. Ad-free experiences enhance user satisfaction. Monthly and annual pricing flexibility supports broader adoption. Fitness influencers and trainers often collaborate with app providers to deliver exclusive content. Integration with wearable ecosystems strengthens premium service value. Predictable revenue streams encourage companies to invest in innovation. Corporate wellness contracts also favor subscription models. Rising demand for customized diet and training plans further sustains dominance.
The non-subscription-based segment is projected to grow at a CAGR of 18.7% from 2026 to 2033, driven by freemium strategies and one-time purchase options. Cost-sensitive users prefer flexible payment structures. Ad-supported models attract large user bases in emerging markets. Basic tracking features remain accessible without mandatory subscriptions. Increasing competition among app developers promotes affordable pricing. Expansion into price-sensitive demographics supports CAGR growth. The availability of lightweight app versions optimized for low-storage smartphones further enhances adoption in developing regions. In addition, periodic promotional pricing and bundled offers with device manufacturers contribute to steady user acquisition and sustained segment expansion.
- By End User
On the basis of end user, the Fitness App market is segmented into providers, home healthcare, and others. The home healthcare segment dominated with 49.2% revenue share in 2025, driven by growing demand for remote health monitoring and self-managed fitness routines. Rising aging population increases need for home-based health solutions. Chronic disease management programs encourage continuous app usage. Telehealth integration strengthens home healthcare adoption. Consumers value convenience and privacy of home-based monitoring. Increasing awareness regarding preventive healthcare fuels demand. Wearable connectivity enhances continuous tracking at home. Growth in digital literacy further accelerates usage. Government initiatives promoting remote care strengthen expansion.
The providers segment is expected to witness the fastest CAGR of 21.5% from 2026 to 2033, supported by clinical integration and telemedicine expansion. Hospitals and clinics increasingly recommend app-based tracking for patient engagement. Data-sharing features enhance treatment accuracy. Insurance companies support digital monitoring solutions. Growing investment in digital health infrastructure accelerates institutional adoption. The integration of fitness apps with electronic health records (EHR) systems further improves continuity of care and real-time clinical decision-making. In addition, value-based care models are encouraging providers to adopt digital fitness monitoring tools to enhance patient outcomes while reducing long-term healthcare costs.
- By Distribution Channel
On the basis of distribution channel, the Fitness App market is segmented into direct tenders and third-party distributors. The third-party distributors segment held the largest share of 63.7% in 2025, driven by the dominance of digital app marketplaces such as Google Play and Apple App Store. These platforms offer global accessibility, allowing developers to reach millions of users across regions without physical distribution barriers. Simplified and secure payment gateways support seamless subscription and in-app purchase transactions. Strong marketing visibility through featured listings, ratings, and user reviews enhances download rates. Regular updates and automated deployment systems improve user retention and app performance. The availability of multiple pricing models, including freemium and premium tiers, strengthens monetization strategies. App store algorithms support targeted user acquisition based on preferences and search behavior. Integration with wearable ecosystems is streamlined through centralized platforms. Consumers prefer trusted marketplaces due to enhanced security and privacy controls. Cross-border payment compatibility further expands revenue opportunities. High smartphone penetration globally continues to reinforce the dominance of third-party distributors in 2025.
The direct tenders segment is anticipated to grow at a CAGR of 19.8% from 2026 to 2033, supported by increasing corporate wellness contracts and partnerships with healthcare providers. Institutional procurement of customized fitness applications is rising across hospitals, insurance firms, and large enterprises. Organizations prefer tailored solutions that integrate with internal health management systems. Government-backed public health initiatives are encouraging bulk procurement of digital fitness platforms. Employers are investing in workforce wellness programs to improve productivity and reduce healthcare costs. Direct agreements allow app developers to offer specialized dashboards and analytics tools. Data security customization and compliance with healthcare regulations strengthen institutional confidence. Growing adoption of value-based care models supports digital monitoring solutions. Educational institutions and sports academies are also adopting direct contracts for structured fitness tracking. Expansion of telehealth infrastructure further accelerates institutional demand. Long-term service contracts ensure recurring revenue stability. Increasing enterprise digitalization globally is expected to sustain the rapid CAGR growth of this segment.
Europe Fitness App Market Regional Analysis
The Europe fitness app market is projected to expand at a substantial CAGR throughout the forecast period, primarily driven by increasing health awareness, rising smartphone penetration, and the growing adoption of digital wellness solutions across the region. The surge in preventive healthcare initiatives, coupled with expanding internet connectivity and wearable device usage, is fostering the adoption of fitness apps. European consumers are increasingly attracted to personalized workout programs, real-time performance tracking, and subscription-based wellness platforms. The region is witnessing strong growth across individual users, corporate wellness programs, and online fitness communities, with fitness apps being integrated into daily health routines and broader digital health ecosystems.
U.K. Fitness App Market Insight
The U.K. fitness app market dominated the European region with the largest revenue share of 34.2% in 2025, supported by its vast smartphone user base, strong digital ecosystem, and high adoption of mobile payment subscriptions. The growing popularity of app-based workout programs, live-streamed fitness sessions, and AI-enabled health tracking features across urban populations is significantly driving market expansion. Additionally, increasing consumer preference for flexible home-based workouts and personalized digital coaching solutions continues to stimulate demand. The presence of established fitness brands and technology-driven startups further strengthens the U.K.’s leadership position in the regional market.
Germany Fitness App Market Insight
The Germany fitness app market is expected to be the fastest-growing in Europe during the forecast period, projected to register a CAGR from 2026 to 2033, driven by rising health consciousness among young consumers and working professionals. Rapid internet penetration, expansion of affordable mobile data services, and increasing disposable incomes are supporting broader adoption of subscription-based fitness platforms. Germany’s strong emphasis on preventive healthcare, structured fitness programs, and integration of digital health tools with wearable devices is accelerating market growth. Furthermore, the growing demand for personalized training plans, nutrition guidance, and performance analytics is positioning Germany as a high-growth market within the European fitness app industry.
Europe Fitness App Market Share
The Fitness App industry is primarily led by well-established companies, including:
- Strava (U.S.)
- Nike, Inc. (U.S.)
- Fitbit (U.S.)
- MyFitnessPal (U.S.)
- Under Armour, Inc. (U.S.)
- Apple Inc. (U.S.)
- Google (U.S.)
- Samsung Electronics (South Korea)
- Adidas AG (Germany)
- Peloton Interactive, Inc. (U.S.)
- ASICS Corporation (Japan)
- Huawei Technologies Co., Ltd. (China)
- Xiaomi Corporation (China)
- Cure.fit (India)
- HealthifyMe (India)
- Zwift, Inc. (U.S.)
- Sweat (Australia)
- Garmin Ltd. (U.S.)
- Freeletics (Germany)
- Noom, Inc. (U.S.)
Latest Developments in Europe Fitness App Market
- In December 2024, Peloton launched Peloton Strength+, expanding beyond cycling to offer a standalone strength training fitness app with gym-style programming and accessible strength workouts designed for users of all levels, marking Peloton’s strategic expansion in the fitness app space
- In December 2024, FlexIt introduced FlexTogether™, a virtual fitness community platform powered by AI Class Creator technology that personalizes workouts and social engagement, aiming to democratize fitness participation through collaborative training and tech-enabled group features
- In August 2024, Reebok launched its subscription-based Reebok Fitness App, offering on-demand workouts, GPS features, nutrition guidance, and community fitness challenges, positioning it as a comprehensive lifestyle wellness platform
- In February 2025, MyFitnessPal completed the acquisition of Intent, an AI-driven meal planning app, to integrate advanced personalization and grocery planning tools into its 270 million-plus user base, strengthening its ecosystem of adaptive nutrition and fitness guidance
- In October 2025, Noom rolled out Face Scan and Future Me, two major AI-powered features aimed at preventive health insights and long-term wellness planning, along with a strategic partnership with Highmark to deliver its weight management services to nearly 2 million insurance members starting in 2026
- In April 2025, Strava, a leading global fitness tracking platform, acquired Runna, a rapidly growing AI-powered run-coaching app known for personalized training plans and expanded user reach across 180+ countries. The acquisition aims to integrate Runna’s training plan features into Strava’s ecosystem, enhancing guided training and expanding overall premium offerings for runners and fitness enthusiasts worldwide
- In April 2025, Olympic gold-medalist Sir Mo Farah partnered with former professional runner Adam Clarke to launch Urunn, an AI-powered running app designed to rival existing platforms by delivering personalized training plans tailored to individual fitness goals and performance levels, positioning it as a “running coach in your pocket”
SKU-

- Interactive Data Analysis Dashboard
- Company Analysis Dashboard for high growth potential opportunities
- Research Analyst Access for customization & queries
- Competitor Analysis with Interactive dashboard
- Latest News, Updates & Trend analysis
- Harness the Power of Benchmark Analysis for Comprehensive Competitor Tracking
Data collection and base year analysis are done using data collection modules with large sample sizes. The stage includes obtaining market information or related data through various sources and strategies. It includes examining and planning all the data acquired from the past in advance. It likewise envelops the examination of information inconsistencies seen across different information sources. The market data is analysed and estimated using market statistical and coherent models. Also, market share analysis and key trend analysis are the major success factors in the market report. To know more, please request an analyst call or drop down your inquiry.
The key research methodology used by DBMR research team is data triangulation which involves data mining, analysis of the impact of data variables on the market and primary (industry expert) validation. Data models include Vendor Positioning Grid, Market Time Line Analysis, Market Overview and Guide, Company Positioning Grid, Patent Analysis, Pricing Analysis, Company Market Share Analysis, Standards of Measurement, Global versus Regional and Vendor Share Analysis. To know more about the research methodology, drop in an inquiry to speak to our industry experts.
Data Bridge Market Research is a leader in advanced formative research. We take pride in servicing our existing and new customers with data and analysis that match and suits their goal. The report can be customized to include price trend analysis of target brands understanding the market for additional countries (ask for the list of countries), clinical trial results data, literature review, refurbished market and product base analysis. Market analysis of target competitors can be analyzed from technology-based analysis to market portfolio strategies. We can add as many competitors that you require data about in the format and data style you are looking for. Our team of analysts can also provide you data in crude raw excel files pivot tables (Fact book) or can assist you in creating presentations from the data sets available in the report.


