
Europe Frozen Fruits and Vegetable Mix Market Analysis and Insights
Growing urbanization and increased adoption of a healthy lifestyle is driving the growth of the Europe frozen fruit and vegetable mix market. In addition, increasing consumption of canned and frozen food further enhances the market growth. Furthermore, the increasing vegan population is boosting the sales and profit of the players operating in the market.
The major restraint impacting the market growth is the growing awareness regarding the consumption of fresh vegetables and fruits. Further, a high lack of cold chain infrastructure will also restrain the market growth. On the other hand, increasing demand for fruits and vegetables with a longer shelf-life is expected to act as an opportunity for the growth of the Europe frozen fruit and vegetable mix market. Whereas, the challenge for the market growth is the high investment cost for the production of frozen vegetables and fruits mix.
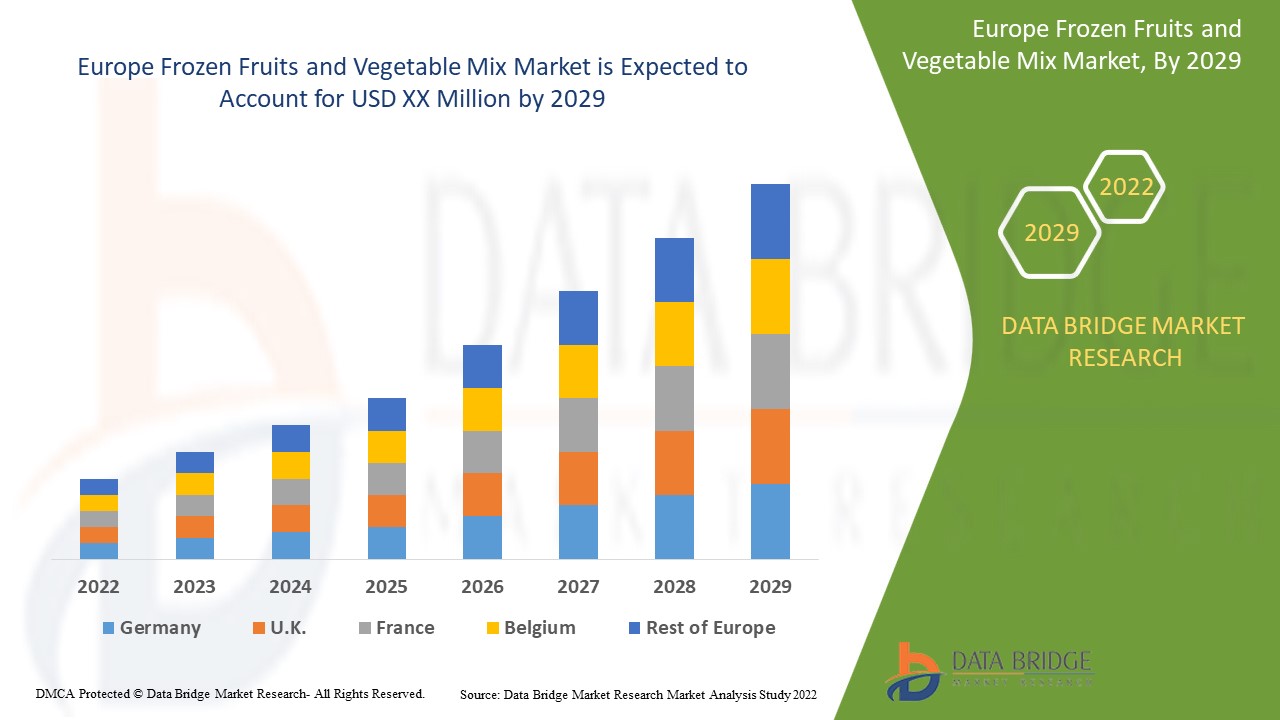
Data Bridge Market Research analyses that the Europe frozen fruits and vegetable mix market will grow at a CAGR of 6.9% during the forecast period of 2022 to 2029.
|
Report Metric |
Details |
|
Forecast Period |
2022 to 2029 |
|
Base Year |
2021 |
|
Historic Years |
2020 (Customizable to 2019 - 2015) |
|
Quantitative Units |
Revenue in USD Million, Pricing in USD |
|
Segments Covered |
By Type (Frozen Vegetable Mix and Frozen Fruit Mix), Category (Organic And Conventional), Technology (Flash-Freezing/ Individual Quick Freezing (IQF), Belt Freezing, High Pressure-Assisted Freezing and Others), End User (Food Service Sector and Household/Retail Sector), Distribution Channel (Store Based Retailer and Non-Store Retailers) |
|
Countries Covered |
Italy, U.K., Germany, France, Spain, Belgium, Netherlands, Poland, Russia, Denmark, Sweden, Switzerland, Turkey and Rest of Europe |
|
Market Players Covered |
Conagra Brands, Inc, Ardo, Bonduelle, Goya Foods, Inc., Hanover Foods, Grupo Virto, Alasko Foods Inc., Cascadian Farm Organic, Findus Sverige Ab, Healthy Pac Corp, SFI LLC, Stahlbush Island Farms, Sunopta, Axus International, Dole Packaged Food LLC, Frutex Asutralia, Coloma Frozen Foods, Shimlahills, Brecon Foods and B&G-Green Giant |
Market Definition
Frozen fruit is when fruit is frozen, it is picked at the peak of ripeness and flash-frozen soon after to preserve the optimal nutrition benefits. Frozen fruit often lasts several months and may be more economical than buying fresh fruit that goes bad quicker. Frozen vegetables are vegetables that have had their temperature reduced and maintained to below their freezing point for storage and transportation until they are ready to be eaten. They may be commercially packaged or frozen at home.
Europe Frozen Fruits and Vegetable Mix Market Dynamics
This section deals with understanding the market drivers, opportunities, restraints, and challenges. All of this is discussed in detail below:
Drivers
-
Growth in the urbanization and increased adoption of healthy lifestyle
Nowadays, people are becoming more aware of the health benefits of vegetables and fruits, boosting the market demand. Also, the increasing urbanization involving the high disposable income shifts the consumer's preference toward healthy food alternatives. Vegetarian Food such as vegetables and fruits is more suitable owing to their health benefits. People are more concerned about food content such as low cholesterols and calorie's which increases the demand for vegetables and fruits.
Thus, various health benefits associated with the consumption of vegetables and fruits are thus attracting many health-conscious consumers towards its consumption and boosting the market's growth.
-
Increase in the consumption of canned and frozen food
The changing lifestyle and busy schedules of individuals have pushed the market consumption trend toward the canned and frozen Food. This consumption has increased further due to the unfortunate spread of Coronavirus worldwide as consumers stockpiled their freezer with longer shelf items during lockdowns. This increased consumption has prompted manufacturers to develop new innovative launches and various healthy alternatives. Among all the innovations, vegetables and fruits are used exclusively as an ingredient in various canned and frozen Foods.
Thus with so many launches and expansion of manufacturers towards innovation in frozen and canned vegetables and fruits, the market for vegetables and fruits will grow globally. Moreover, as the frozen and canned food market grows, the industry will see more new and innovative launches and developments of these products, thus, driving the market towards a positive escalation.
Opportunities
-
Digitalization of the retail industry
Digital transformation of the food retail industry to improve their service and facilities to stay ahead of the curve and to cater to the customers' demand will provide immense opportunity to frozen fruits and vegetable mix manufacturers. The increase in the inclination of consumers towards online shopping of food products due to its convenience coupled with the availability of a wide variety of frozen fruits and vegetables on online platforms is creating a huge opportunity for the frozen fruit and vegetable market.
The increase in online grocery shopping due to features of a wide variety of options and convenience is expected to boost the growth of the market and will create a great opportunity for the growth of Europe frozen fruit and vegetable mix market.
Restraint/Challenge
- Growth in the awareness regarding the consumption of fresh vegetables and fruits
The changing and stagnant lifestyle has made consumers aware about their health, due to which consumers have been considering what they eat. This change has brought in the trend of growing demand for healthy Food, which is gluten-free, low-calorie, sugar free, dairy-free and plant-based Food among consumers.
With this growing trend, consumers have been significantly adopting products such as fresh vegetables and fruits, as they are nutrition dense and have low calories, reducing the risk of various health issues compared to frozen fruit and vegetables mix, thus restraining the market growth globally.
Post COVID-19 Impact on Europe Frozen Fruits and Vegetable Mix Market
The COVID-19 has affected the market to some extent due to lockdown the manufacturing and production of many small and large companies was halted as well as the demand from the frozen fruits and vegetable mix also had increased which influenced the market. Post-pandemic, the demand for frozen fruits and vegetable mix has increased due to increasing demand for ready to eat, easy serve and nutritious food. Due to the change in many mandates and regulation, manufactures are enabled to design and launch new products in the market, which will help the growth of the market.
Recent Development
- In June 2022, Conagra Brands, Inc. Had an investment of approximately $300 million in Waseca, Minn. For its new state-of-the-art vegetable processing plant facility. This has helped the company to modernize production capabilities
Europe Frozen Fruits and Vegetable Mix Market Scope
Europe frozen fruits and vegetable mix market is segmented into notable segments based on testing type, category, technology, end user, and distribution channel. The growth amongst these segments will help you analyze major growth segments in the industries and provide the users with a valuable market overview and market insights to make strategic decisions to identify core market applications.
Type
- Frozen Vegetable Mix
- Frozen Fruit Mix
Based on type, the Europe frozen fruit and vegetable mix market is further segmented into frozen fruit mix and frozen vegetable mix.
Category
- Organic
- Conventional
Based on category, the Europe frozen fruit and vegetable mix market is classified into organic and conventional.
Technology
- Flash-Freezing/ Individual Quick Freezing (IQF)
- Belt Freezing
- High Pressure-Assisted Freezing
- Others
Based on technology, the Europe frozen fruit and vegetable mix market is classified into flash-freezing/ individual quick freezing (IQF), belt freezing, high pressure-assisted freezing, and others.
End User
- Food Service Sector
- Household/Retail Sector
Based on end user, the Europe frozen fruit and vegetable mix market is further segmented into food service sector and household sector.
Distribution Channel
- Store based retailers
- Non-store based retailers
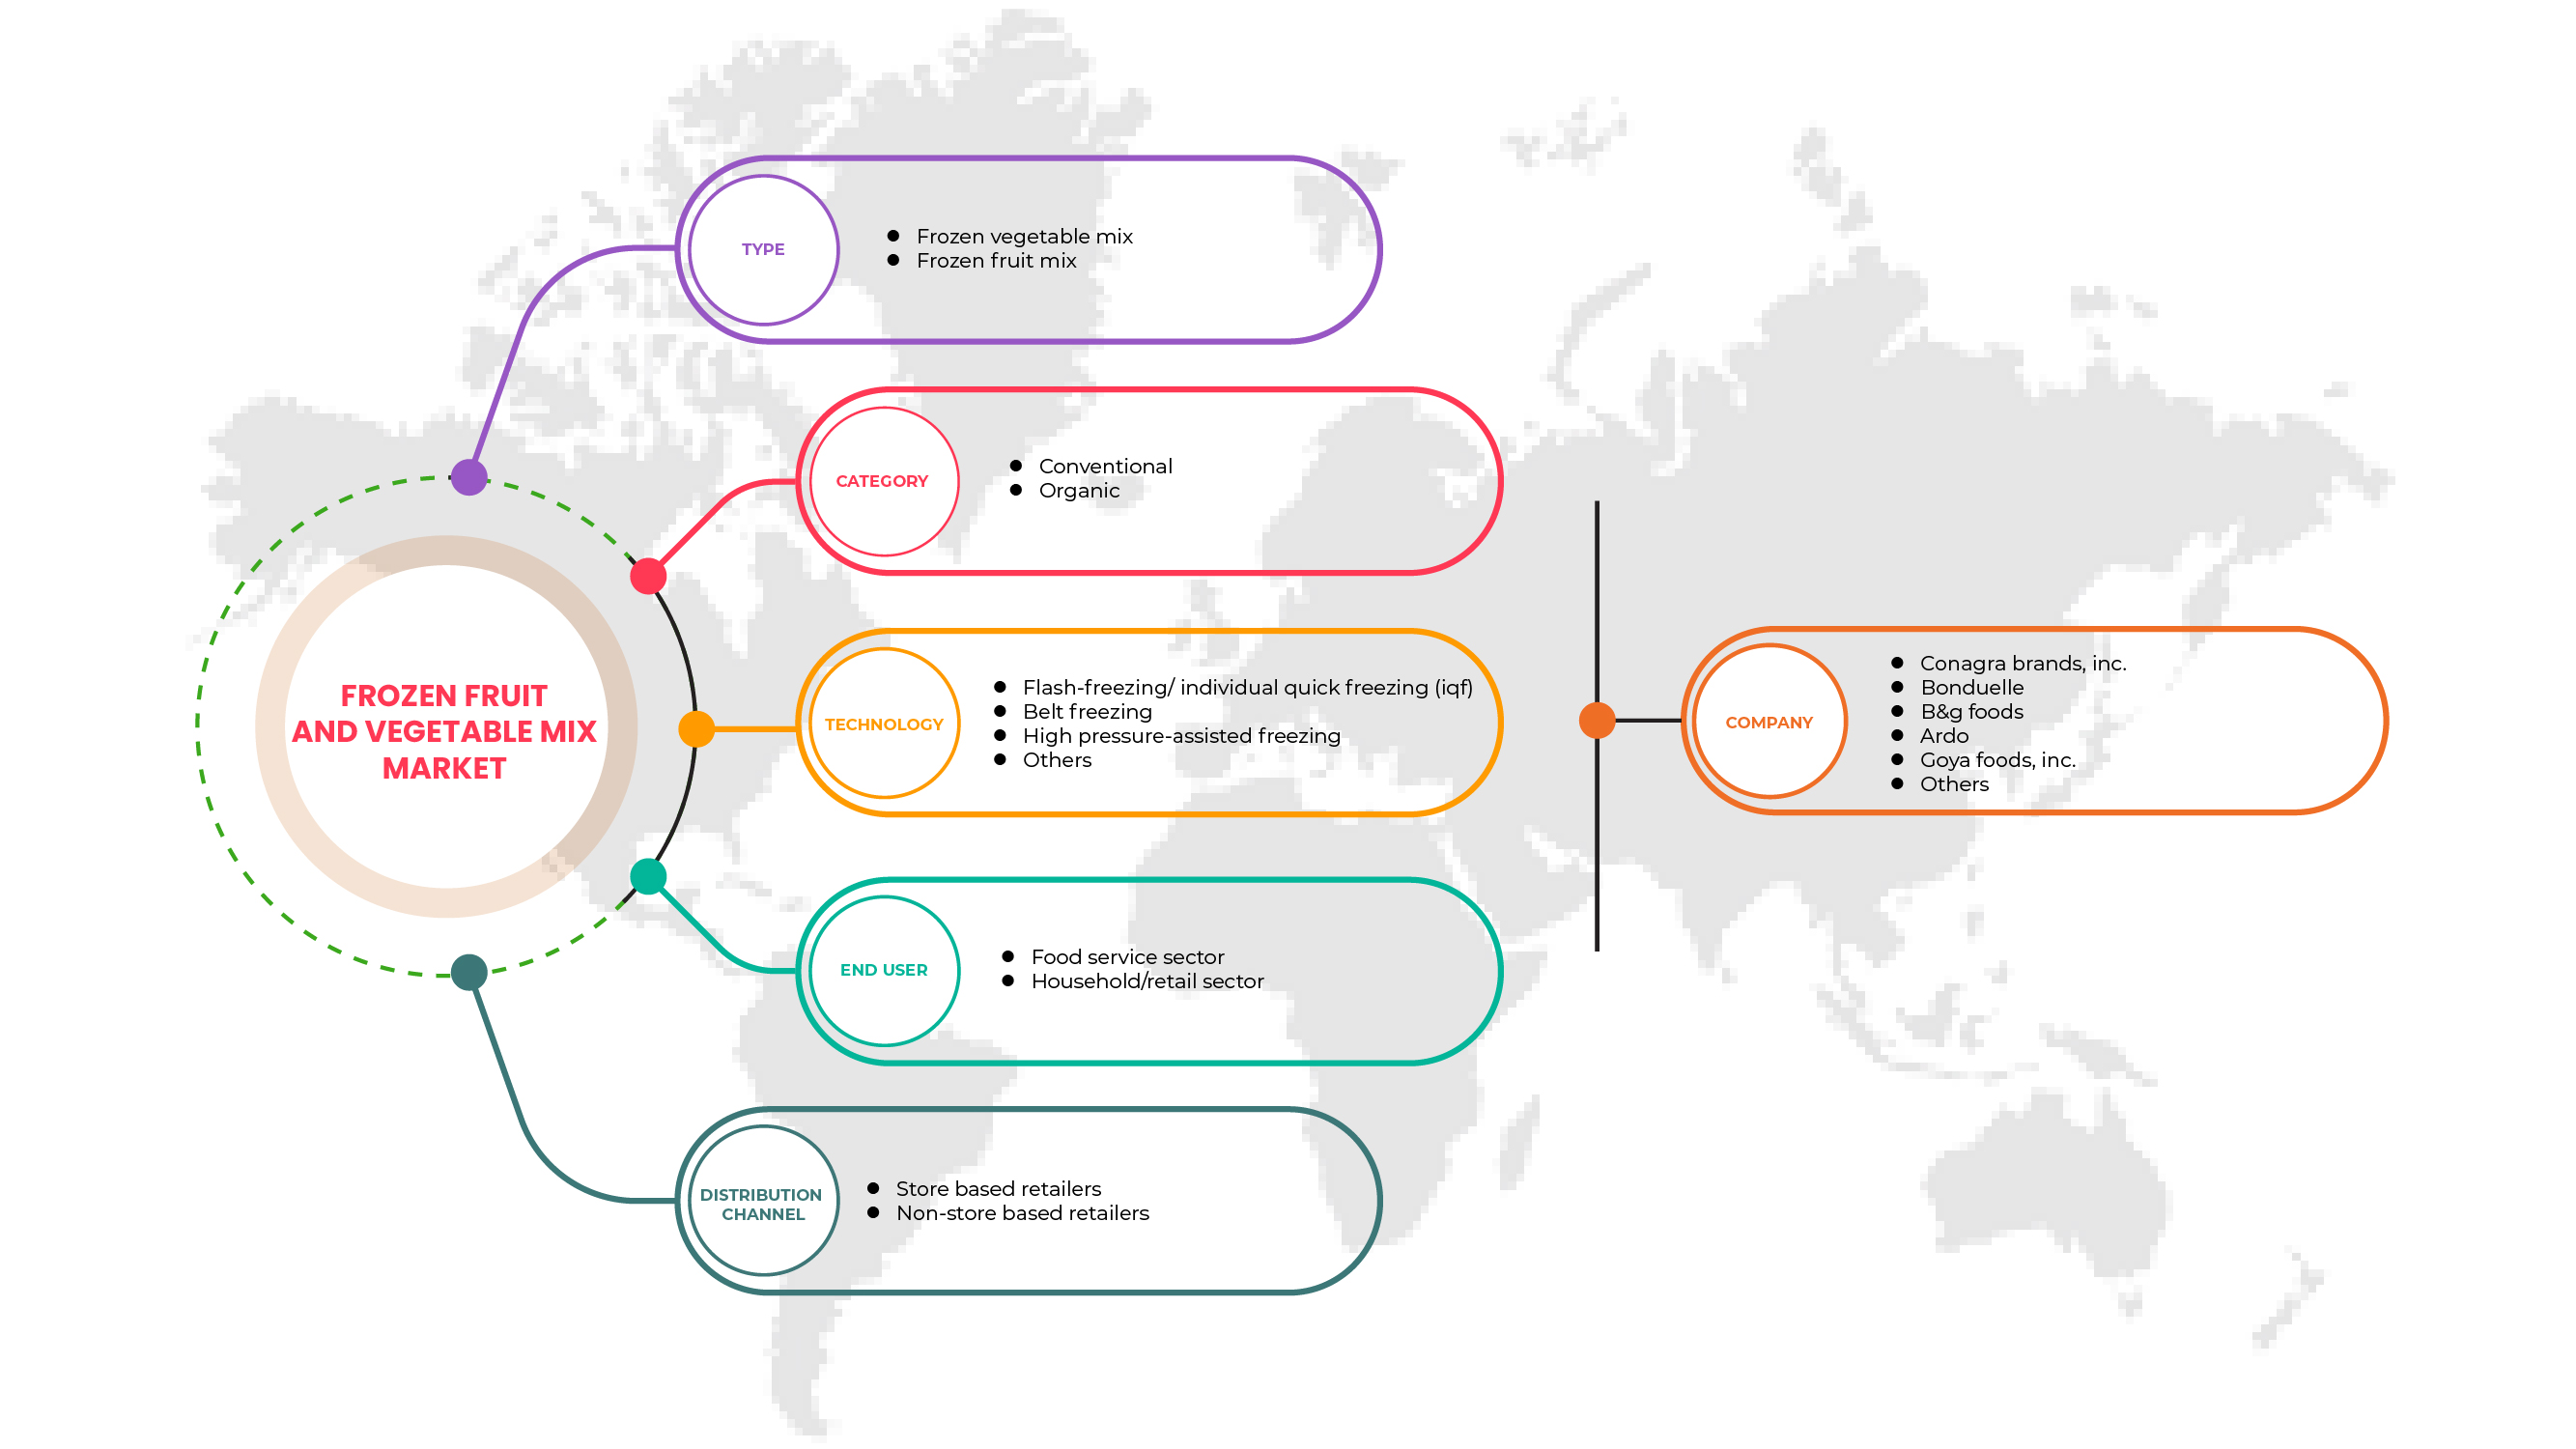
On the basis of distribution channel, the Europe frozen fruit and vegetable mix market is segmented into the store based retailers and non-store based retailers.
Europe Frozen Fruits and Vegetable Mix Market Regional Analysis/Insights
The Europe frozen fruits and vegetable mix market is analyzed and market size insights and trends are provided based on as referenced above.
The countries covered in the Europe frozen fruits and vegetable mix market report are Italy, U.K., Germany, France, Spain, Belgium, Netherlands, Poland, Russia, Denmark, Sweden, Switzerland, Turkey and Rest of Europe.
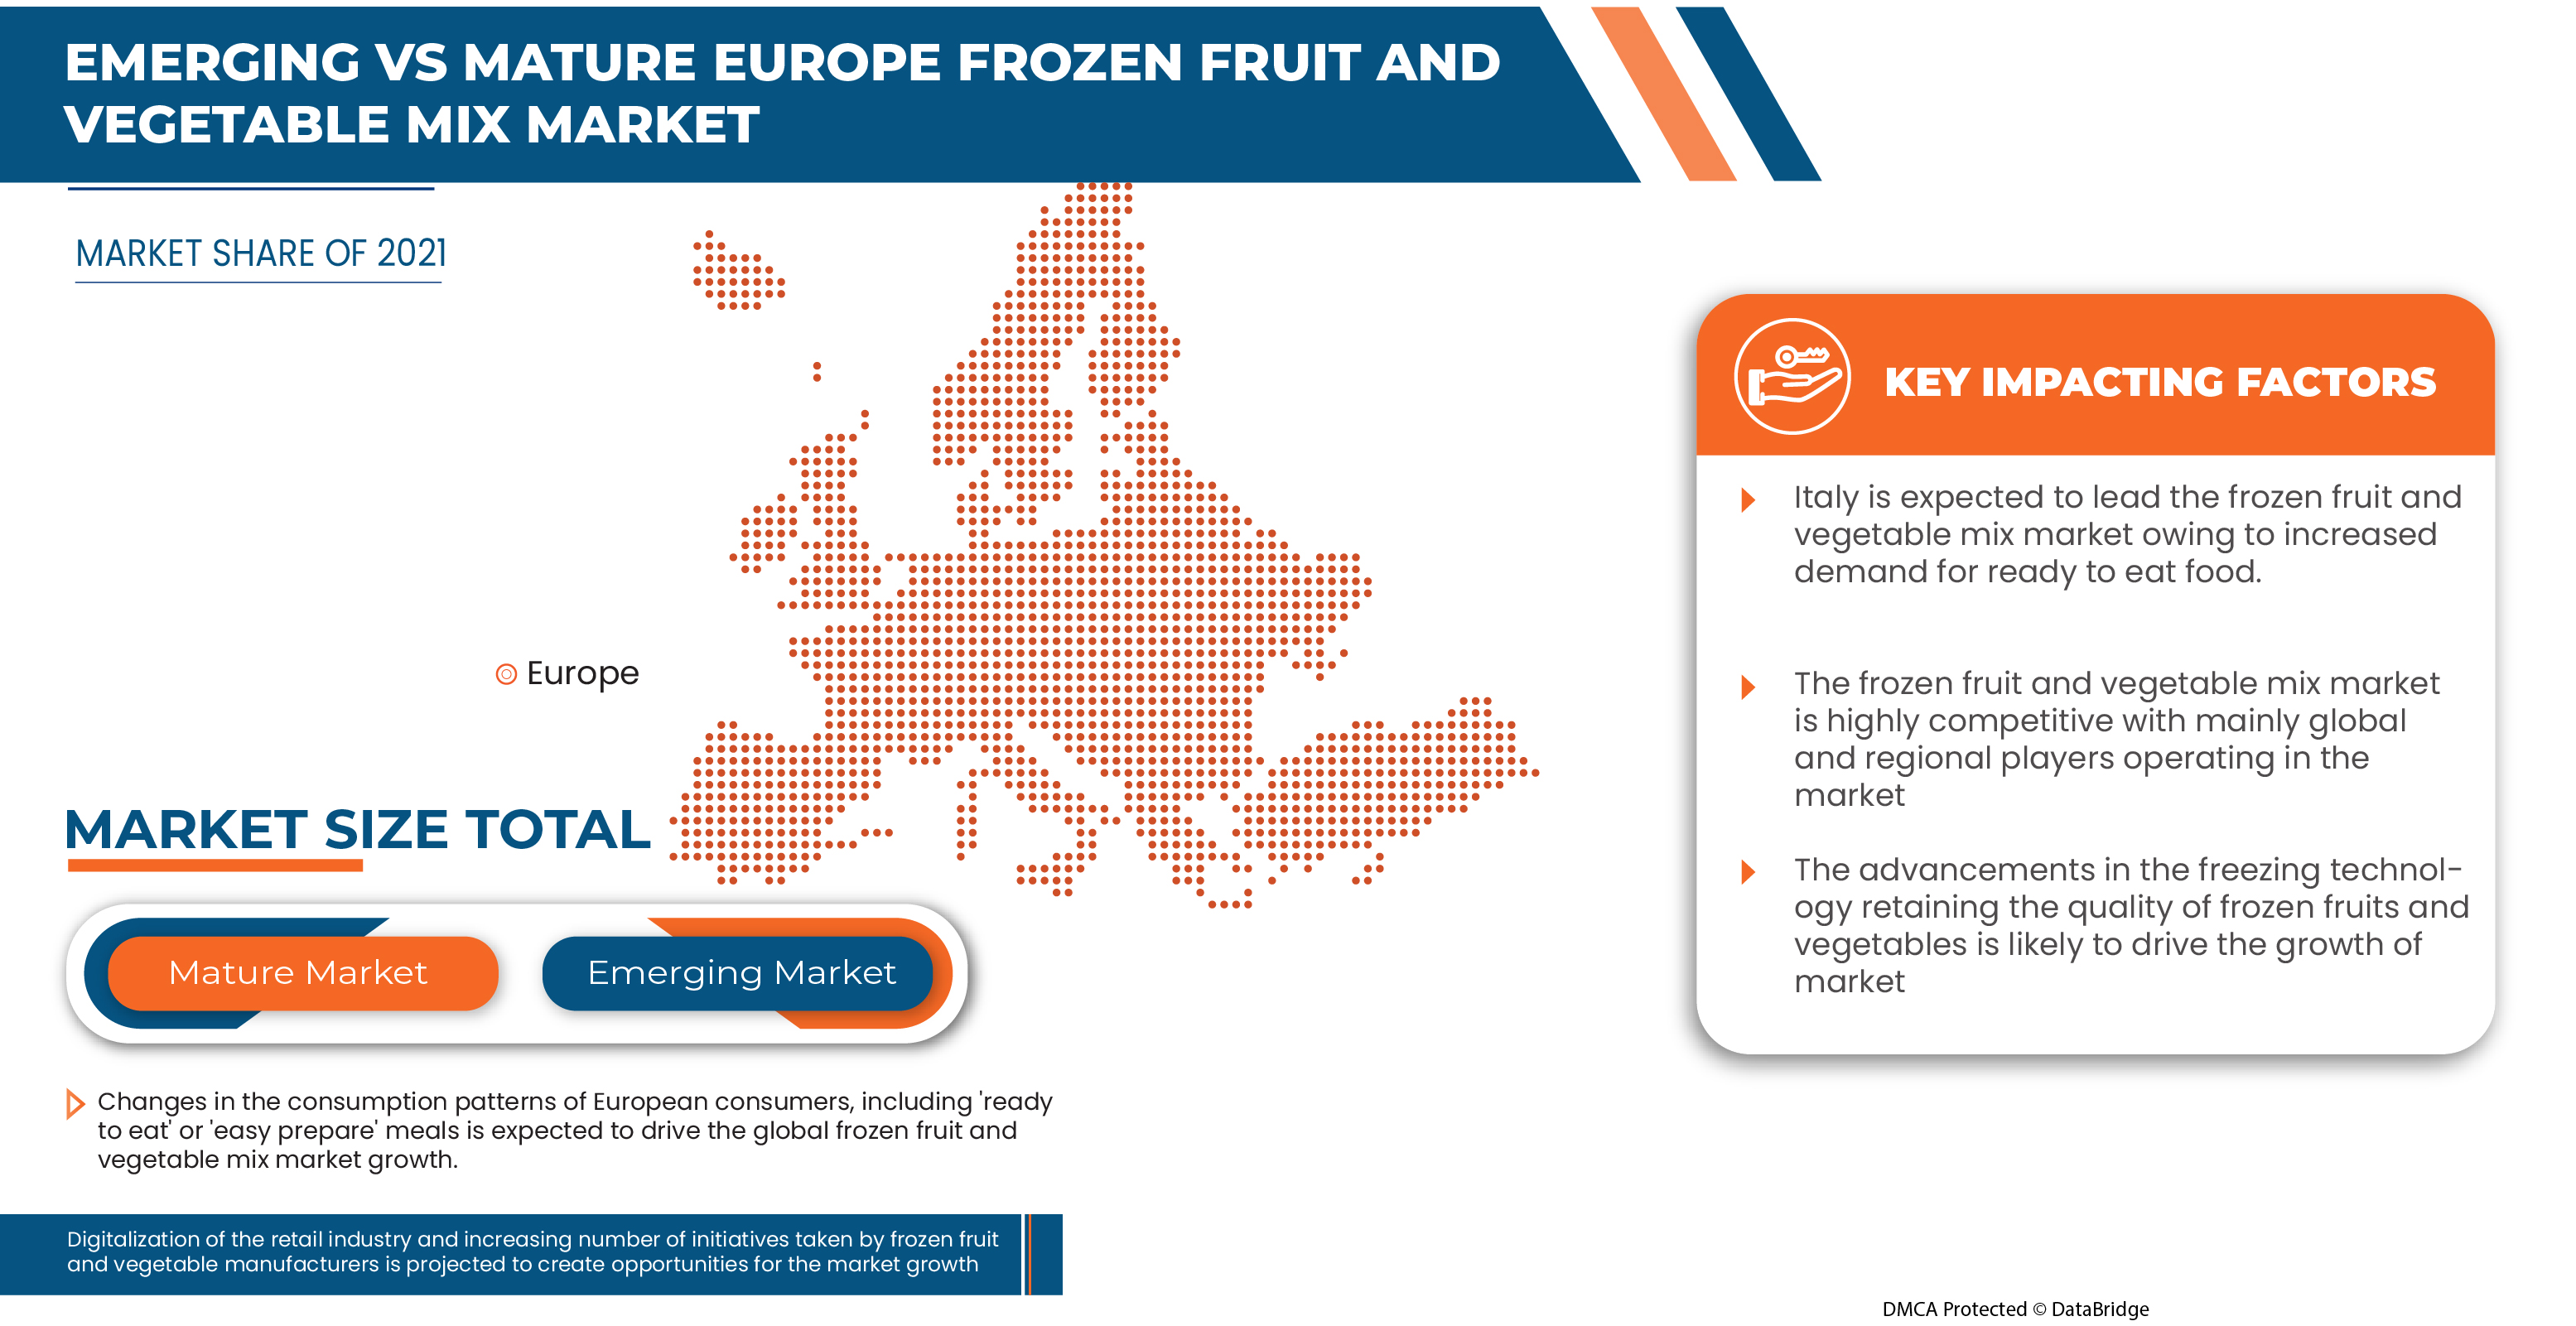
Italy is dominating the Europe market as frozen berries are widely used as a key ingredient for preparing smoothies and similar products in the country.
The region section of the report also provides individual market impacting factors and changes in regulations in the market that impact the current and future trends of the market. Data points, such as new and replacement sales, country demographics, and import-export tariffs, are some of the major pointers used to forecast the market scenario for individual countries. In addition, the presence and availability of Europe brands and their challenges faced due to high competition from local and domestic brands, and the impact of sales channels are considered while providing forecast analysis of the country data.
Competitive Landscape and Europe Frozen Fruits and Vegetable Mix Market Share Analysis
Europe frozen fruits and vegetable mix market competitive landscape provides details by the competitors. Details included are company overview, company financials, revenue generated, market potential, investment in research and development, new market initiatives, Europe presence, production sites and facilities, production capacities, company strengths and weaknesses, product launch, product width and breadth, and application dominance. The above data points provided are only related to the companies' focus on Europe frozen fruits and vegetable mix market.
Some of the major players operating in frozen fruit and vegetables mix market are Conagra Brands, Inc, Ardo, Bonduelle, Goya Foods, Inc., Hanover Foods, Grupo Virto, Alasko Foods Inc., Cascadian Farm Organic, Findus Sverige Ab, Healthy Pac Corp, SFI LLC, Stahlbush Island Farms, Sunopta, Axus International, Dole Packaged Food LLC, Frutex Asutralia, Coloma Frozen Foods, Shimlahills, Brecon Foods and B&G-Green Giant among others.
Research Methodology
Data collection and base year analysis are done using data collection modules with large sample sizes. The market data is analyzed and estimated using market statistical and coherent models. In addition, market share analysis and key trend analysis are the major success factors in the market report. The key research methodology used by DBMR research team is data triangulation which involves data mining, analysis of the impact of data variables on the market, and primary (industry expert) validation. Apart from this, data models include Vendor Positioning Grid, Market Time Line Analysis, Market Overview and Guide, Company Positioning Grid, Company Market Share Analysis, Standards of Measurement, Europe Vs Regional and Vendor Share Analysis. Please request analyst call in case of further inquiry.
SKU-

- Interactive Data Analysis Dashboard
- Company Analysis Dashboard for high growth potential opportunities
- Research Analyst Access for customization & queries
- Competitor Analysis with Interactive dashboard
- Latest News, Updates & Trend analysis
- Harness the Power of Benchmark Analysis for Comprehensive Competitor Tracking
Table of Content
1 INTRODUCTION
1.1 OBJECTIVES OF THE STUDY
1.2 MARKET DEFINITION
1.3 OVERVIEW OF EUROPE FROZEN FRUIT AND VEGETABLE MIX MARKET
1.4 LIMITATIONS
1.5 MARKETS COVERED
2 MARKET SEGMENTATION
2.1 MARKETS COVERED
2.2 GEOGRAPHICAL SCOPE
2.3 YEARS CONSIDERED FOR THE STUDY
2.4 CURRENCY AND PRICING
2.5 DBMR TRIPOD DATA VALIDATION MODEL
2.6 MULTIVARIATE MODELLING
2.7 TYPE LIFELINE CURVE
2.8 PRIMARY INTERVIEWS WITH KEY OPINION LEADERS
2.9 DBMR MARKET POSITION GRID
2.1 SECONDARY SOURCES
2.11 ASSUMPTIONS
3 EXECUTIVE SUMMARY
4 PREMIUM INSIGHTS
4.1 TOP EXPORTING COMPANIES
4.1.1 EUROPE FROZEN FRUIT MIX MARKET
4.1.2 EUROPE FROZEN VEGETABLE MIX MARKET
4.2 EXPORT & IMPORT ANALYSIS- EUROPE FROZEN FRUIT AND VEGETABLE MIX MARKET
4.3 MARKET TRENDS – 2010-2022
4.4 PRODUCTION CAPACITY
4.5 PRODUCTION BY TOP MANUFACTURERS
4.6 RETAIL TRENDS
4.6.1 INCREASED INVESTMENT IN THE FREEZER
4.6.2 LAUNCH OF IN-STORE FROZEN FRUITS AND VEGETABLE BRANDS
4.6.3 STOCKING BESTSELLERS AND NEW LAUNCHES
4.7 PER CAPITA CONSUMPTION BY COUNTRY
5 MARKET OVERVIEW
5.1 DRIVERS
5.1.1 GROWING URBANIZATION AND INCREASED ADOPTION OF HEALTHY LIFESTYLE
5.1.2 INCREASING CONSUMPTION OF CANNED AND FROZEN FOOD
5.1.3 THE INCREASING VEGAN POPULATION IS EXPECTED TO DRIVE THE MARKET GROWTH
5.1.4 EXPANSIONS OF CONVENIENCE STORES
5.2 RESTRAINTS
5.2.1 GROWING AWARENESS REGARDING THE CONSUMPTION OF FRESH VEGETABLES AND FRUITS
5.2.2 HIGHER AMOUNT OF VEGETABLE AND FRUIT WASTAGE
5.2.3 LACK OF COLD CHAIN INFRASTRUCTURE
5.3 OPPORTUNITIES
5.3.1 DIGITALIZATION OF THE RETAIL INDUSTRY
5.3.2 INCREASING NUMBER OF INITIATIVES TAKEN BY FROZEN FRUIT AND VEGETABLE MANUFACTURERS
5.3.3 INCREASING DEMAND FOR FRUITS AND VEGETABLES WITH LONGER SHELF-LIFE
5.3.4 ADVANCEMENTS IN FREEZING TECHNOLOGY TO RETAIN THE QUALITY OF FRUITS AND VEGETABLES
5.4 CHALLENGES
5.4.1 HIGH COMPETITION AMONG THE MARKET PLAYERS
5.4.2 HIGH INVESTMENT COST FOR THE PRODUCTION OF CANNED AND FROZEN VEGETABLES AND FRUITS
6 EUROPE FROZEN FRUIT AND VEGETABLE MIX MARKET, BY TYPE
6.1 OVERVIEW
6.2 FROZEN VEGETABLE MIX
6.2.1 CARROTS, CORN AND BEANS
6.2.2 CARROTS, CORN, BEANS AND PEAS
6.2.3 BROCCOLI, CAULIFLOWER AND CARROT
6.2.4 PEAS, CAULIFLOWER AND CARROT
6.2.5 ONIONS, GREEN PEPPERS, RED PEPPERS AND YELLOW PEPPERS
6.2.6 AVOCADO WITH KALE
6.2.7 OTHER
6.3 FROZEN FRUIT MIX
6.3.1 BERRY MIX (RASPBERRIES, BLACKBERRIES, BLUEBERRIES AND STRAWBERRIES)
6.3.2 PINEAPPLE, STRAWBERRIES, PEACHES AND MANGO
6.3.3 PINEAPPLE, KIWI, MANGO, PAPAYA, STRAWBERRIES
6.3.4 BERRIES AND CHERRY
6.3.5 BERRIES AND MANGO
6.3.6 OTHERS
7 EUROPE FROZEN FRUIT AND VEGETABLE MIX MARKET, BY CATEGORY
7.1 OVERVIEW
7.2 CONVENTIONAL
7.3 ORGANIC
8 EUROPE FROZEN FRUIT AND VEGETABLE MIX MARKET, BY TECHNOLOGY
8.1 OVERVIEW
8.2 FLASH-FREEZING/INDIVIDUAL QUICK FREEZING(IQF)
8.3 BELT FREEZING
8.4 HIGH-PRESSURE-ASSISTED FREEZING
8.5 OTHERS
9 EUROPE FROZEN FRUIT AND VEGETABLE MIX MARKET, BY END USER
9.1 OVERVIEW
9.2 FOOD SERVICE SECTOR
9.2.1 RESTAURANTS
9.2.1.1 QUICK SERVICE RESTAURANTS
9.2.1.2 DINING RESTAURANTS
9.2.1.3 GHOST RESTAURANTS (DELIVERY ONLY RESTAURANTS)
9.2.1.4 OTHERS
9.2.2 CAFES
9.2.3 HOTEL
9.2.4 OTHERS
9.3 HOUSEHOLD/RETAIL SECTOR
10 EUROPE FROZEN FRUIT AND VEGETABLE MIX MARKET, BY DISTRIBUTION CHANNEL
10.1 OVERVIEW
10.2 STORE BASED RETAILER
10.2.1 SUPERMARKETS/HYPERMARKETS
10.2.2 CONVENIENCE STORES
10.2.3 FROZEN DAIRY PRODUCTS SHOPS/PARLORS
10.2.4 SPECIALITY STORES
10.2.5 WHOLESALERS
10.2.6 GROCERY RETAILERS
10.2.7 OTHERS
10.3 NON-STORE RETAILER
10.3.1 ONLINE
10.3.2 COMPANY WEBSITES
11 EUROPE FROZEN FRUIT AND VEGETABLE MIX MARKET, BY REGION
11.1 EUROPE
11.1.1 ITALY
11.1.2 U.K.
11.1.3 GERMANY
11.1.4 FRANCE
11.1.5 SPAIN
11.1.6 BELGIUM
11.1.7 NETHERLANDS
11.1.8 POLAND
11.1.9 RUSSIA
11.1.10 DENMARK
11.1.11 SWEDEN
11.1.12 SWITZERLAND
11.1.13 TURKEY
11.1.14 REST OF EUROPE
12 COMPANY LANDSCAPE
12.1 COMPANY SHARE ANALYSIS: EUROPE
13 SWOT ANALYSIS
14 COMPANY PROFILE
14.1 ARDO
14.1.1 COMPANY SNAPSHOT
14.1.2 COMPANY SHARE ANALYSIS
14.1.3 PRODUCT PORTFOLIO
14.1.4 RECENT DEVELOPMENTS
14.2 BONDUELLE
14.2.1 COMPANY SNAPSHOT
14.2.2 REVENUE ANALYSIS
14.2.3 COMPANY SHARE ANALYSIS
14.2.4 PRODUCT PORTFOLIO
14.2.5 RECENT DEVELOPMENTS
14.3 CONAGRA BRANDS, INC.
14.3.1 COMPANY SNAPSHOT
14.3.2 REVENUE ANALYSIS
14.3.3 COMPANY SHARE ANALYSIS
14.3.4 PRODUCT PORTFOLIO
14.3.5 RECENT DEVELOPMENTS
14.4 HANOVER FOODS
14.4.1 COMPANY SNAPSHOT
14.4.2 COMPANY SHARE ANALYSIS
14.4.3 PRODUCT PORTFOLIO
14.4.4 RECENT DEVELOPMENTS
14.5 FINDUS SVERIGE AB
14.5.1 COMPANY SNAPSHOT
14.5.2 COMPANY SHARE ANALYSIS
14.5.3 PRODUCT PORTFOLIO
14.5.4 RECENT DEVELOPMENTS
14.6 DOLE PLC
14.6.1 COMPANY SNAPSHOT
14.6.2 REVENUS ANALYSIS
14.6.3 PRODUCT PORTFOLIO
14.6.4 RECENT DEVELOPMENTS
14.7 GOYA FOODS, INC.
14.7.1 COMPANY SNAPSHOT
14.7.2 PRODUCT PORTFOLIO
14.7.3 RECENT DEVELOPMENTS
14.8 SUNOPTA
14.8.1 COMPANY SNAPSHOT
14.8.2 REVENUE ANALYSIS
14.8.3 PRODUCT PORTFOLIO
14.8.4 RECENT DEVELOPMENT
14.9 B&G FOODS
14.9.1 COMPANY SNAPSHOT
14.9.2 REVENUS ANALYSIS
14.9.3 PRODUCT PORTFOLIO
14.9.4 RECENT DEVELOPMENTS
14.1 STAHLBUSH ISLAND FARMS
14.10.1 COMPANY SNAPSHOT
14.10.2 PRODUCT PORTFOLIO
14.10.3 RECENT DEVELOPMENTS
14.11 ALASKO FOODS INC.
14.11.1 COMPANY SNAPSHOT
14.11.2 PRODUCT PORTFOLIO
14.11.3 RECENT DEVELOPMENT
14.12 AXUS INTERNATIONAL, LLC.
14.12.1 COMPANY SNAPSHOT
14.12.2 PRODUCT PORTFOLIO
14.12.3 RECENT DEVELOPMENTS
14.13 BRECON FOODS
14.13.1 COMPANY SNAPSHOT
14.13.2 PRODUCT PORTFOLIO
14.13.3 RECENT DEVELOPMENTS
14.14 CASCADIAN FARM ORGANIC.
14.14.1 COMPANY SNAPSHOT
14.14.2 PRODUCT PORTFOLIO
14.14.3 RECENT DEVELOPMENT
14.15 COLOMA FROZEN FOODS
14.15.1 COMPANY SNAPSHOT
14.15.2 PRODUCT PORTFOLIO
14.15.3 RECENT DEVELOPMENTS
14.16 FRUTEX AUSTRALIA
14.16.1 COMPANY SNAPSHOT
14.16.2 PRODUCT PORTFOLIO
14.16.3 RECENT DEVELOPMENTS
14.17 VIRTO GROUP
14.17.1 COMPANY SNAPSHOT
14.17.2 PRODUCT PORTFOLIO
14.17.3 RECENT DEVELOPMENTS
14.18 HEALTHY PAC CORP
14.18.1 COMPANY SNAPSHOT
14.18.2 PRODUCT PORTFOLIO
14.18.3 RECENT DEVELOPMENTS
14.19 SFI LLC.
14.19.1 COMPANY SNAPSHOT
14.19.2 PRODUCT PORTFOLIO
14.19.3 RECENT DEVELOPMENTS
14.2 SHIMLAHILLS
14.20.1 COMPANY SNAPSHOT
14.20.2 PRODUCT PORTFOLIO
14.20.3 RECENT DEVELOPMENTS
15 QUESTIONNAIRE
16 RELATED REPORTS
List of Table
TABLE 1 EUROPE FROZEN FRUIT AND VEGETABLE MIX MARKET, BY TYPE, 2020-2029 (USD MILLION)
TABLE 2 EUROPE FROZEN VEGETABLE MIX IN FROZEN FRUIT AND VEGETABLE MIX MARKET, BY REGION, 2020-2029 (USD MILLION)
TABLE 3 EUROPE FROZEN VEGETABLE MIX IN FROZEN FRUIT AND VEGETABLE MIX MARKET, BY TYPE, 2020-2029 (USD MILLION)
TABLE 4 EUROPE FROZEN FRUIT MIX IN FROZEN FRUIT AND VEGETABLE MIX MARKET, BY REGION, 2020-2029 (USD MILLION)
TABLE 5 EUROPE FROZEN FRUIT MIX IN FROZEN FRUIT AND VEGETABLE MIX MARKET, BY TYPE, 2020-2029 (USD MILLION)
TABLE 6 EUROPE FROZEN FRUIT AND VEGETABLE MIX MARKET, BY CATEGORY, 2020-2029 (USD MILLION)
TABLE 7 EUROPE CONVENTIONAL IN FROZEN FRUIT AND VEGETABLE MIX MARKET, BY REGION, 2020-2029 (USD MILLION)
TABLE 8 EUROPE ORGANIC IN FROZEN FRUIT AND VEGETABLE MIX MARKET, BY REGION, 2020-2029 (USD MILLION)
TABLE 9 EUROPE FROZEN FRUIT AND VEGETABLE MIX MARKET, BY TECHNOLOGY, 2020-2029 (USD MILLION)
TABLE 10 EUROPE FLASH-FREEZING/INDIVIDUAL QUICK FREEZING (IQF) IN FROZEN FRUIT AND VEGETABLE MIX MARKET, BY REGION, 2020-2029 (USD MILLION)
TABLE 11 EUROPE BELT FREEZING IN FROZEN FRUIT AND VEGETABLE MIX MARKET, BY REGION, 2020-2029 (USD MILLION)
TABLE 12 EUROPE HIGH-PRESSURE-ASSISTED FREEZING IN FROZEN FRUIT AND VEGETABLE MIX MARKET, BY REGION, 2020-2029 (USD MILLION)
TABLE 13 EUROPE OTHERS IN FROZEN FRUIT AND VEGETABLE MIX MARKET, BY REGION, 2020-2029 (USD MILLION)
TABLE 14 EUROPE FROZEN FRUIT AND VEGETABLE MIX MARKET, BY END USER, 2020-2029 (USD MILLION)
TABLE 15 EUROPE FOOD SERVICE SECTOR IN FROZEN FRUIT AND VEGETABLE MIX MARKET, BY REGION, 2020-2029 (USD MILLION)
TABLE 16 EUROPE FOOD SERVICE SECTOR IN FROZEN FRUIT AND VEGETABLE MIX MARKET, BY END USER, 2020-2029 (USD MILLION)
TABLE 17 EUROPE RESTAURANTS IN FROZEN FRUIT MIX IN FROZEN FRUIT AND VEGETABLE MIX MARKET, BY END USER, 2020-2029 (USD MILLION)
TABLE 18 EUROPE HOUSEHOLD/RETAIL SECTOR IN FROZEN FRUIT AND VEGETABLE MIX MARKET, BY REGION, 2020-2029 (USD MILLION)
TABLE 19 EUROPE FROZEN FRUIT MIX IN FROZEN FRUIT AND VEGETABLE MIX MARKET, BY DISTRIBUTION CHANNEL, 2020-2029 (USD MILLION)
TABLE 20 EUROPE STORE BASED RETAILER IN FROZEN FRUIT AND VEGETABLE MIX MARKET, BY REGION, 2020-2029 (USD MILLION)
TABLE 21 EUROPE STORE BASED RETAILER IN FROZEN FRUIT AND VEGETABLE MIX MARKET, BY DISTRIBUTION CHANNEL, 2020-2029 (USD MILLION)
TABLE 22 EUROPE NON-STORE RETAILER IN FROZEN FRUIT AND VEGETABLE MIX MARKET, BY REGION, 2020-2029 (USD MILLION)
TABLE 23 EUROPE NON-STORE RETAILER IN FROZEN FRUIT AND VEGETABLE MIX MARKET, BY DISTRIBUTION CHANNEL, 2020-2029 (USD MILLION)
TABLE 24 EUROPE FROZEN FRUIT AND VEGETABLE MIX MARKET, BY COUNTRY, 2020-2029 (USD MILLION)
TABLE 25 EUROPE FROZEN FRUIT AND VEGETABLE MIX MARKET, BY COUNTRY, 2020-2029 (KILO TONS)
TABLE 26 EUROPE FROZEN FRUIT AND VEGETABLE MIX MARKET, BY TYPE, 2020-2029 (USD MILLION)
TABLE 27 EUROPE FROZEN FRUIT AND VEGETABLE MIX MARKET, BY TYPE, 2020-2029 (KILO TONS)
TABLE 28 EUROPE FROZEN FRUIT AND VEGETABLE MIX MARKET, BY TYPE, 2020-2029 (PRICE PER TON)
TABLE 29 EUROPE FROZEN FRUIT MIX IN FROZEN FRUIT AND VEGETABLE MIX MARKET, BY TYPE, 2020-2029 (USD MILLION)
TABLE 30 EUROPE FROZEN FRUIT MIX IN FROZEN FRUIT AND VEGETABLE MIX MARKET, BY TYPE, 2020-2029 (KILO TONS)
TABLE 31 EUROPE FROZEN VEGETABLE MIX IN FROZEN FRUIT AND VEGETABLE MIX MARKET, BY TYPE, 2020-2029 (USD MILLION)
TABLE 32 EUROPE FROZEN VEGETABLE MIX IN FROZEN FRUIT AND VEGETABLE MIX MARKET, BY TYPE, 2020-2029 (KILO TONS)
TABLE 33 EUROPE FROZEN FRUIT AND VEGETABLE MIX MARKET, BY CATEGORY, 2020-2029 (USD MILLION)
TABLE 34 EUROPE FROZEN FRUIT AND VEGETABLE MIX MARKET, BY TECHNOLOGY, 2020-2029 (USD MILLION)
TABLE 35 EUROPE FROZEN FRUIT AND VEGETABLE MIX MARKET, BY END-USER, 2020-2029 (USD MILLION)
TABLE 36 EUROPE FOOD SERVICE SECTOR IN FROZEN FRUIT AND VEGETABLE MIX MARKET, BY END-USER, 2020-2029 (USD MILLION)
TABLE 37 EUROPE RESTAURANTS IN FROZEN FRUIT AND VEGETABLE MIX MARKET, BY END-USER, 2020-2029 (USD MILLION)
TABLE 38 EUROPE FROZEN FRUIT AND VEGETABLE MIX MARKET, BY DISTRIBUTION CHANNEL, 2020-2029 (USD MILLION)
TABLE 39 EUROPE STORE-BASED RETAILERS IN FROZEN FRUIT AND VEGETABLE MIX MARKET, BY DISTRIBUTION CHANNEL, 2020-2029 (USD MILLION)
TABLE 40 EUROPE NON-STORE RETAILERS IN FROZEN FRUIT AND VEGETABLE MIX MARKET, BY DISTRIBUTION CHANNEL, 2020-2029 (USD MILLION)
TABLE 41 ITALY FROZEN FRUIT AND VEGETABLE MIX MARKET, BY TYPE, 2020-2029 (USD MILLION)
TABLE 42 ITALY FROZEN FRUIT AND VEGETABLE MIX MARKET, BY TYPE, 2020-2029 (KILO TONS)
TABLE 43 ITALY FROZEN FRUIT AND VEGETABLE MIX MARKET, BY TYPE, 2020-2029 (PRICE PER TON)
TABLE 44 ITALY FROZEN FRUIT MIX IN FROZEN FRUIT AND VEGETABLE MIX MARKET, BY TYPE, 2020-2029 (USD MILLION)
TABLE 45 ITALY FROZEN FRUIT MIX IN FROZEN FRUIT AND VEGETABLE MIX MARKET, BY TYPE, 2020-2029 (KILO TONS)
TABLE 46 ITALY FROZEN VEGETABLE MIX IN FROZEN FRUIT AND VEGETABLE MIX MARKET, BY TYPE, 2020-2029 (USD MILLION)
TABLE 47 ITALY FROZEN VEGETABLE MIX IN FROZEN FRUIT AND VEGETABLE MIX MARKET, BY TYPE, 2020-2029 (KILO TONS)
TABLE 48 ITALY FROZEN FRUIT AND VEGETABLE MIX MARKET, BY CATEGORY, 2020-2029 (USD MILLION)
TABLE 49 ITALY FROZEN FRUIT AND VEGETABLE MIX MARKET, BY TECHNOLOGY, 2020-2029 (USD MILLION)
TABLE 50 ITALY FROZEN FRUIT AND VEGETABLE MIX MARKET, BY END-USER, 2020-2029 (USD MILLION)
TABLE 51 ITALY FOOD SERVICE SECTOR IN FROZEN FRUIT AND VEGETABLE MIX MARKET, BY END-USER, 2020-2029 (USD MILLION)
TABLE 52 ITALY RESTAURANTS IN FROZEN FRUIT AND VEGETABLE MIX MARKET, BY END-USER, 2020-2029 (USD MILLION)
TABLE 53 ITALY FROZEN FRUIT AND VEGETABLE MIX MARKET, BY DISTRIBUTION CHANNEL, 2020-2029 (USD MILLION)
TABLE 54 ITALY STORE-BASED RETAILERS IN FROZEN FRUIT AND VEGETABLE MIX MARKET, BY DISTRIBUTION CHANNEL, 2020-2029 (USD MILLION)
TABLE 55 ITALY NON-STORE RETAILERS IN FROZEN FRUIT AND VEGETABLE MIX MARKET, BY DISTRIBUTION CHANNEL, 2020-2029 (USD MILLION)
TABLE 56 U.K. FROZEN FRUIT AND VEGETABLE MIX MARKET, BY TYPE, 2020-2029 (USD MILLION)
TABLE 57 U.K. FROZEN FRUIT AND VEGETABLE MIX MARKET, BY TYPE, 2020-2029 (KILO TONS)
TABLE 58 U.K. FROZEN FRUIT AND VEGETABLE MIX MARKET, BY TYPE, 2020-2029 (PRICE PER TON)
TABLE 59 U.K. FROZEN FRUIT AND VEGETABLE MIX MARKET, BY TYPE, 2020-2029 (PRICE PER TON)
TABLE 60 U.K. FROZEN FRUIT MIX IN FROZEN FRUIT AND VEGETABLE MIX MARKET, BY TYPE, 2020-2029 (KILO TONS)
TABLE 61 U.K. FROZEN VEGETABLE MIX IN FROZEN FRUIT AND VEGETABLE MIX MARKET, BY TYPE, 2020-2029 (USD MILLION)
TABLE 62 U.K. FROZEN VEGETABLE MIX IN FROZEN FRUIT AND VEGETABLE MIX MARKET, BY TYPE, 2020-2029 (KILO TONS)
TABLE 63 U.K. FROZEN FRUIT AND VEGETABLE MIX MARKET, BY CATEGORY, 2020-2029 (USD MILLION)
TABLE 64 U.K. FROZEN FRUIT AND VEGETABLE MIX MARKET, BY TECHNOLOGY, 2020-2029 (USD MILLION)
TABLE 65 U.K. FROZEN FRUIT AND VEGETABLE MIX MARKET, BY END-USER, 2020-2029 (USD MILLION)
TABLE 66 U.K. FOOD SERVICE SECTOR IN FROZEN FRUIT AND VEGETABLE MIX MARKET, BY END-USER, 2020-2029 (USD MILLION)
TABLE 67 U.K. RESTAURANTS IN FROZEN FRUIT AND VEGETABLE MIX MARKET, BY END-USER, 2020-2029 (USD MILLION)
TABLE 68 U.K. FROZEN FRUIT AND VEGETABLE MIX MARKET, BY DISTRIBUTION CHANNEL, 2020-2029 (USD MILLION)
TABLE 69 U.K. STORE-BASED RETAILERS IN FROZEN FRUIT AND VEGETABLE MIX MARKET, BY DISTRIBUTION CHANNEL, 2020-2029 (USD MILLION)
TABLE 70 U.K. NON-STORE RETAILERS IN FROZEN FRUIT AND VEGETABLE MIX MARKET, BY DISTRIBUTION CHANNEL, 2020-2029 (USD MILLION)
TABLE 71 GERMANY FROZEN FRUIT AND VEGETABLE MIX MARKET, BY TYPE, 2020-2029 (USD MILLION)
TABLE 72 GERMANY FROZEN FRUIT AND VEGETABLE MIX MARKET, BY TYPE, 2020-2029 (KILO TONS)
TABLE 73 GERMANY FROZEN FRUIT AND VEGETABLE MIX MARKET, BY TYPE, 2020-2029 (PRICE PER TON)
TABLE 74 GERMANY FROZEN FRUIT MIX IN FROZEN FRUIT AND VEGETABLE MIX MARKET, BY TYPE, 2020-2029 (USD MILLION)
TABLE 75 GERMANY FROZEN FRUIT MIX IN FROZEN FRUIT AND VEGETABLE MIX MARKET, BY TYPE, 2020-2029 (KILO TONS)
TABLE 76 GERMANY FROZEN VEGETABLE MIX IN FROZEN FRUIT AND VEGETABLE MIX MARKET, BY TYPE, 2020-2029 (USD MILLION)
TABLE 77 GERMANY FROZEN VEGETABLE MIX IN FROZEN FRUIT AND VEGETABLE MIX MARKET, BY TYPE, 2020-2029 (KILO TONS)
TABLE 78 GERMANY FROZEN FRUIT AND VEGETABLE MIX MARKET, BY CATEGORY, 2020-2029 (USD MILLION)
TABLE 79 GERMANY FROZEN FRUIT AND VEGETABLE MIX MARKET, BY TECHNOLOGY, 2020-2029 (USD MILLION)
TABLE 80 GERMANY FROZEN FRUIT AND VEGETABLE MIX MARKET, BY END-USER, 2020-2029 (USD MILLION)
TABLE 81 GERMANY FOOD SERVICE SECTOR IN FROZEN FRUIT AND VEGETABLE MIX MARKET, BY END-USER, 2020-2029 (USD MILLION)
TABLE 82 GERMANY RESTAURANTS IN FROZEN FRUIT AND VEGETABLE MIX MARKET, BY END-USER, 2020-2029 (USD MILLION)
TABLE 83 GERMANY FROZEN FRUIT AND VEGETABLE MIX MARKET, BY DISTRIBUTION CHANNEL, 2020-2029 (USD MILLION)
TABLE 84 GERMANY STORE-BASED RETAILERS IN FROZEN FRUIT AND VEGETABLE MIX MARKET, BY DISTRIBUTION CHANNEL, 2020-2029 (USD MILLION)
TABLE 85 GERMANY NON-STORE RETAILERS IN FROZEN FRUIT AND VEGETABLE MIX MARKET, BY DISTRIBUTION CHANNEL, 2020-2029 (USD MILLION)
TABLE 86 FRANCE FROZEN FRUIT AND VEGETABLE MIX MARKET, BY TYPE, 2020-2029 (USD MILLION)
TABLE 87 FRANCE FROZEN FRUIT AND VEGETABLE MIX MARKET, BY TYPE, 2020-2029 (KILO TONS)
TABLE 88 FRANCE FROZEN FRUIT AND VEGETABLE MIX MARKET, BY TYPE, 2020-2029 (PRICE PER TON)
TABLE 89 FRANCE FROZEN FRUIT MIX IN FROZEN FRUIT AND VEGETABLE MIX MARKET, BY TYPE, 2020-2029 (USD MILLION)
TABLE 90 FRANCE FROZEN FRUIT MIX IN FROZEN FRUIT AND VEGETABLE MIX MARKET, BY TYPE, 2020-2029 (KILO TONS)
TABLE 91 FRANCE FROZEN VEGETABLE MIX IN FROZEN FRUIT AND VEGETABLE MIX MARKET, BY TYPE, 2020-2029 (USD MILLION)
TABLE 92 FRANCE FROZEN VEGETABLE MIX IN FROZEN FRUIT AND VEGETABLE MIX MARKET, BY TYPE, 2020-2029 (KILO TONS)
TABLE 93 FRANCE FROZEN FRUIT AND VEGETABLE MIX MARKET, BY CATEGORY, 2020-2029 (USD MILLION)
TABLE 94 FRANCE FROZEN FRUIT AND VEGETABLE MIX MARKET, BY TECHNOLOGY, 2020-2029 (USD MILLION)
TABLE 95 FRANCE FROZEN FRUIT AND VEGETABLE MIX MARKET, BY END-USER, 2020-2029 (USD MILLION)
TABLE 96 FRANCE FOOD SERVICE SECTOR IN FROZEN FRUIT AND VEGETABLE MIX MARKET, BY END-USER, 2020-2029 (USD MILLION)
TABLE 97 FRANCE RESTAURANTS IN FROZEN FRUIT AND VEGETABLE MIX MARKET, BY END-USER, 2020-2029 (USD MILLION)
TABLE 98 FRANCE FROZEN FRUIT AND VEGETABLE MIX MARKET, BY DISTRIBUTION CHANNEL, 2020-2029 (USD MILLION)
TABLE 99 FRANCE STORE-BASED RETAILERS IN FROZEN FRUIT AND VEGETABLE MIX MARKET, BY DISTRIBUTION CHANNEL, 2020-2029 (USD MILLION)
TABLE 100 FRANCE NON-STORE RETAILERS IN FROZEN FRUIT AND VEGETABLE MIX MARKET, BY DISTRIBUTION CHANNEL, 2020-2029 (USD MILLION)
TABLE 101 SPAIN FROZEN FRUIT AND VEGETABLE MIX MARKET, BY TYPE, 2020-2029 (USD MILLION)
TABLE 102 SPAIN FROZEN FRUIT AND VEGETABLE MIX MARKET, BY TYPE, 2020-2029 (KILO TONS)
TABLE 103 SPAIN FROZEN FRUIT AND VEGETABLE MIX MARKET, BY TYPE, 2020-2029 (PRICE PER TON)
TABLE 104 SPAIN FROZEN FRUIT MIX IN FROZEN FRUIT AND VEGETABLE MIX MARKET, BY TYPE, 2020-2029 (USD MILLION)
TABLE 105 SPAIN FROZEN FRUIT MIX IN FROZEN FRUIT AND VEGETABLE MIX MARKET, BY TYPE, 2020-2029 (KILO TONS)
TABLE 106 SPAIN FROZEN VEGETABLE MIX IN FROZEN FRUIT AND VEGETABLE MIX MARKET, BY TYPE, 2020-2029 (USD MILLION)
TABLE 107 SPAIN FROZEN VEGETABLE MIX IN FROZEN FRUIT AND VEGETABLE MIX MARKET, BY TYPE, 2020-2029 (KILO TONS)
TABLE 108 SPAIN FROZEN FRUIT AND VEGETABLE MIX MARKET, BY CATEGORY, 2020-2029 (USD MILLION)
TABLE 109 SPAIN FROZEN FRUIT AND VEGETABLE MIX MARKET, BY TECHNOLOGY, 2020-2029 (USD MILLION)
TABLE 110 SPAIN FROZEN FRUIT AND VEGETABLE MIX MARKET, BY END-USER, 2020-2029 (USD MILLION)
TABLE 111 SPAIN FOOD SERVICE SECTOR IN FROZEN FRUIT AND VEGETABLE MIX MARKET, BY END-USER, 2020-2029 (USD MILLION)
TABLE 112 SPAIN RESTAURANTS IN FROZEN FRUIT AND VEGETABLE MIX MARKET, BY END-USER, 2020-2029 (USD MILLION)
TABLE 113 SPAIN FROZEN FRUIT AND VEGETABLE MIX MARKET, BY DISTRIBUTION CHANNEL, 2020-2029 (USD MILLION)
TABLE 114 SPAIN STORE-BASED RETAILERS IN FROZEN FRUIT AND VEGETABLE MIX MARKET, BY DISTRIBUTION CHANNEL, 2020-2029 (USD MILLION)
TABLE 115 SPAIN NON-STORE RETAILERS IN FROZEN FRUIT AND VEGETABLE MIX MARKET, BY DISTRIBUTION CHANNEL, 2020-2029 (USD MILLION)
TABLE 116 BELGIUM FROZEN FRUIT AND VEGETABLE MIX MARKET, BY TYPE, 2020-2029 (USD MILLION)
TABLE 117 BELGIUM FROZEN FRUIT AND VEGETABLE MIX MARKET, BY TYPE, 2020-2029 (KILO TONS)
TABLE 118 BELGIUM FROZEN FRUIT AND VEGETABLE MIX MARKET, BY TYPE, 2020-2029 (PRICE PER TON)
TABLE 119 BELGIUM FROZEN FRUIT MIX IN FROZEN FRUIT AND VEGETABLE MIX MARKET, BY TYPE, 2020-2029 (USD MILLION)
TABLE 120 BELGIUM FROZEN FRUIT MIX IN FROZEN FRUIT AND VEGETABLE MIX MARKET, BY TYPE, 2020-2029 (KILO TONS)
TABLE 121 TABLE 123 BELGIUM FROZEN VEGETABLE MIX IN FROZEN FRUIT AND VEGETABLE MIX MARKET, BY TYPE, 2020-2029 (USD MILLION)
TABLE 122 BELGIUM FROZEN VEGETABLE MIX IN FROZEN FRUIT AND VEGETABLE MIX MARKET, BY TYPE, 2020-2029 (KILO TONS)
TABLE 123 BELGIUM FROZEN FRUIT AND VEGETABLE MIX MARKET, BY CATEGORY, 2020-2029 (USD MILLION)
TABLE 124 BELGIUM FROZEN FRUIT AND VEGETABLE MIX MARKET, BY TECHNOLOGY, 2020-2029 (USD MILLION)
TABLE 125 BELGIUM FROZEN FRUIT AND VEGETABLE MIX MARKET, BY END-USER, 2020-2029 (USD MILLION)
TABLE 126 BELGIUM FOOD SERVICE SECTOR IN FROZEN FRUIT AND VEGETABLE MIX MARKET, BY END-USER, 2020-2029 (USD MILLION)
TABLE 127 BELGIUM RESTAURANTS IN FROZEN FRUIT AND VEGETABLE MIX MARKET, BY END-USER, 2020-2029 (USD MILLION)
TABLE 128 BELGIUM FROZEN FRUIT AND VEGETABLE MIX MARKET, BY DISTRIBUTION CHANNEL, 2020-2029 (USD MILLION)
TABLE 129 BELGIUM STORE-BASED RETAILERS IN FROZEN FRUIT AND VEGETABLE MIX MARKET, BY DISTRIBUTION CHANNEL, 2020-2029 (USD MILLION)
TABLE 130 BELGIUM NON-STORE RETAILERS IN FROZEN FRUIT AND VEGETABLE MIX MARKET, BY DISTRIBUTION CHANNEL, 2020-2029 (USD MILLION)
TABLE 131 NETHERLANDS FROZEN FRUIT AND VEGETABLE MIX MARKET, BY TYPE, 2020-2029 (USD MILLION)
TABLE 132 NETHERLANDS FROZEN FRUIT AND VEGETABLE MIX MARKET, BY TYPE, 2020-2029 (KILO TONS)
TABLE 133 NETHERLANDS FROZEN FRUIT AND VEGETABLE MIX MARKET, BY TYPE, 2020-2029 (PRICE PER TON)
TABLE 134 NETHERLANDS FROZEN FRUIT MIX IN FROZEN FRUIT AND VEGETABLE MIX MARKET, BY TYPE, 2020-2029 (USD MILLION)
TABLE 135 NETHERLANDS FROZEN FRUIT MIX IN FROZEN FRUIT AND VEGETABLE MIX MARKET, BY TYPE, 2020-2029 (KILO TONS)
TABLE 136 NETHERLANDS FROZEN VEGETABLE MIX IN FROZEN FRUIT AND VEGETABLE MIX MARKET, BY TYPE, 2020-2029 (USD MILLION)
TABLE 137 NETHERLANDS FROZEN VEGETABLE MIX IN FROZEN FRUIT AND VEGETABLE MIX MARKET, BY TYPE, 2020-2029 (KILO TONS)
TABLE 138 NETHERLANDS FROZEN FRUIT AND VEGETABLE MIX MARKET, BY CATEGORY, 2020-2029 (USD MILLION)
TABLE 139 NETHERLANDS FROZEN FRUIT AND VEGETABLE MIX MARKET, BY TECHNOLOGY, 2020-2029 (USD MILLION)
TABLE 140 NETHERLANDS FROZEN FRUIT AND VEGETABLE MIX MARKET, BY END-USER, 2020-2029 (USD MILLION)
TABLE 141 TABLE 144 NETHERLANDS FOOD SERVICE SECTOR IN FROZEN FRUIT AND VEGETABLE MIX MARKET, BY END-USER, 2020-2029 (USD MILLION)
TABLE 142 NETHERLANDS RESTAURANTS IN FROZEN FRUIT AND VEGETABLE MIX MARKET, BY END-USER, 2020-2029 (USD MILLION)
TABLE 143 NETHERLANDS FROZEN FRUIT AND VEGETABLE MIX MARKET, BY DISTRIBUTION CHANNEL, 2020-2029 (USD MILLION)
TABLE 144 NETHERLANDS STORE-BASED RETAILERS IN FROZEN FRUIT AND VEGETABLE MIX MARKET, BY DISTRIBUTION CHANNEL, 2020-2029 (USD MILLION)
TABLE 145 NETHERLANDS NON-STORE RETAILERS IN FROZEN FRUIT AND VEGETABLE MIX MARKET, BY DISTRIBUTION CHANNEL, 2020-2029 (USD MILLION)
TABLE 146 POLAND FROZEN FRUIT AND VEGETABLE MIX MARKET, BY TYPE, 2020-2029 (USD MILLION)
TABLE 147 POLAND FROZEN FRUIT AND VEGETABLE MIX MARKET, BY TYPE, 2020-2029 (KILO TONS)
TABLE 148 POLAND FROZEN FRUIT AND VEGETABLE MIX MARKET, BY TYPE, 2020-2029 (PRICE PER TON)
TABLE 149 POLAND FROZEN FRUIT MIX IN FROZEN FRUIT AND VEGETABLE MIX MARKET, BY TYPE, 2020-2029 (USD MILLION)
TABLE 150 POLAND FROZEN FRUIT MIX IN FROZEN FRUIT AND VEGETABLE MIX MARKET, BY TYPE, 2020-2029 (KILO TONS)
TABLE 151 POLAND FROZEN VEGETABLE MIX IN FROZEN FRUIT AND VEGETABLE MIX MARKET, BY TYPE, 2020-2029 (USD MILLION)
TABLE 152 POLAND FROZEN VEGETABLE MIX IN FROZEN FRUIT AND VEGETABLE MIX MARKET, BY TYPE, 2020-2029 (KILO TONS)
TABLE 153 POLAND FROZEN FRUIT AND VEGETABLE MIX MARKET, BY CATEGORY, 2020-2029 (USD MILLION)
TABLE 154 POLAND FROZEN FRUIT AND VEGETABLE MIX MARKET, BY TECHNOLOGY, 2020-2029 (USD MILLION)
TABLE 155 POLAND FROZEN FRUIT AND VEGETABLE MIX MARKET, BY END-USER, 2020-2029 (USD MILLION)
TABLE 156 POLAND FOOD SERVICE SECTOR IN FROZEN FRUIT AND VEGETABLE MIX MARKET, BY END-USER, 2020-2029 (USD MILLION)
TABLE 157 POLAND RESTAURANTS IN FROZEN FRUIT AND VEGETABLE MIX MARKET, BY END-USER, 2020-2029 (USD MILLION)
TABLE 158 POLAND FROZEN FRUIT AND VEGETABLE MIX MARKET, BY DISTRIBUTION CHANNEL, 2020-2029 (USD MILLION)
TABLE 159 POLAND STORE-BASED RETAILERS IN FROZEN FRUIT AND VEGETABLE MIX MARKET, BY DISTRIBUTION CHANNEL, 2020-2029 (USD MILLION)
TABLE 160 POLAND NON-STORE RETAILERS IN FROZEN FRUIT AND VEGETABLE MIX MARKET, BY DISTRIBUTION CHANNEL, 2020-2029 (USD MILLION)
TABLE 161 RUSSIA FROZEN FRUIT AND VEGETABLE MIX MARKET, BY TYPE, 2020-2029 (USD MILLION)
TABLE 162 RUSSIA FROZEN FRUIT AND VEGETABLE MIX MARKET, BY TYPE, 2020-2029 (KILO TONS)
TABLE 163 RUSSIA FROZEN FRUIT AND VEGETABLE MIX MARKET, BY TYPE, 2020-2029 (PRICE PER TON)
TABLE 164 RUSSIA FROZEN FRUIT MIX IN FROZEN FRUIT AND VEGETABLE MIX MARKET, BY TYPE, 2020-2029 (USD MILLION)
TABLE 165 RUSSIA FROZEN FRUIT MIX IN FROZEN FRUIT AND VEGETABLE MIX MARKET, BY TYPE, 2020-2029 (KILO TONS)
TABLE 166 RUSSIA FROZEN VEGETABLE MIX IN FROZEN FRUIT AND VEGETABLE MIX MARKET, BY TYPE, 2020-2029 (USD MILLION)
TABLE 167 RUSSIA FROZEN VEGETABLE MIX IN FROZEN FRUIT AND VEGETABLE MIX MARKET, BY TYPE, 2020-2029 (KILO TONS)
TABLE 168 RUSSIA FROZEN FRUIT AND VEGETABLE MIX MARKET, BY CATEGORY, 2020-2029 (USD MILLION)
TABLE 169 RUSSIA FROZEN FRUIT AND VEGETABLE MIX MARKET, BY TECHNOLOGY, 2020-2029 (USD MILLION)
TABLE 170 RUSSIA FROZEN FRUIT AND VEGETABLE MIX MARKET, BY END-USER, 2020-2029 (USD MILLION)
TABLE 171 RUSSIA FOOD SERVICE SECTOR IN FROZEN FRUIT AND VEGETABLE MIX MARKET, BY END-USER, 2020-2029 (USD MILLION)
TABLE 172 RUSSIA RESTAURANTS IN FROZEN FRUIT AND VEGETABLE MIX MARKET, BY END-USER, 2020-2029 (USD MILLION)
TABLE 173 RUSSIA FROZEN FRUIT AND VEGETABLE MIX MARKET, BY DISTRIBUTION CHANNEL, 2020-2029 (USD MILLION)
TABLE 174 RUSSIA STORE-BASED RETAILERS IN FROZEN FRUIT AND VEGETABLE MIX MARKET, BY DISTRIBUTION CHANNEL, 2020-2029 (USD MILLION)
TABLE 175 RUSSIA NON-STORE RETAILERS IN FROZEN FRUIT AND VEGETABLE MIX MARKET, BY DISTRIBUTION CHANNEL, 2020-2029 (USD MILLION)
TABLE 176 DENMARK FROZEN FRUIT AND VEGETABLE MIX MARKET, BY TYPE, 2020-2029 (USD MILLION)
TABLE 177 DENMARK FROZEN FRUIT AND VEGETABLE MIX MARKET, BY TYPE, 2020-2029 (KILO TONS)
TABLE 178 DENMARK FROZEN FRUIT AND VEGETABLE MIX MARKET, BY TYPE, 2020-2029 (PRICE PER TON)
TABLE 179 DENMARK FROZEN FRUIT MIX IN FROZEN FRUIT AND VEGETABLE MIX MARKET, BY TYPE, 2020-2029 (USD MILLION)
TABLE 180 DENMARK FROZEN FRUIT MIX IN FROZEN FRUIT AND VEGETABLE MIX MARKET, BY TYPE, 2020-2029 (KILO TONS)
TABLE 181 DENMARK FROZEN VEGETABLE MIX IN FROZEN FRUIT AND VEGETABLE MIX MARKET, BY TYPE, 2020-2029 (USD MILLION)
TABLE 182 DENMARK FROZEN VEGETABLE MIX IN FROZEN FRUIT AND VEGETABLE MIX MARKET, BY TYPE, 2020-2029 (KILO TONS)
TABLE 183 DENMARK FROZEN FRUIT AND VEGETABLE MIX MARKET, BY CATEGORY, 2020-2029 (USD MILLION)
TABLE 184 DENMARK FROZEN FRUIT AND VEGETABLE MIX MARKET, BY TECHNOLOGY, 2020-2029 (USD MILLION)
TABLE 185 DENMARK FROZEN FRUIT AND VEGETABLE MIX MARKET, BY END-USER, 2020-2029 (USD MILLION)
TABLE 186 DENMARK FOOD SERVICE SECTOR IN FROZEN FRUIT AND VEGETABLE MIX MARKET, BY END-USER, 2020-2029 (USD MILLION)
TABLE 187 DENMARK RESTAURANTS IN FROZEN FRUIT AND VEGETABLE MIX MARKET, BY END-USER, 2020-2029 (USD MILLION)
TABLE 188 DENMARK FROZEN FRUIT AND VEGETABLE MIX MARKET, BY DISTRIBUTION CHANNEL, 2020-2029 (USD MILLION)
TABLE 189 DENMARK STORE-BASED RETAILERS IN FROZEN FRUIT AND VEGETABLE MIX MARKET, BY DISTRIBUTION CHANNEL, 2020-2029 (USD MILLION)
TABLE 190 DENMARK NON-STORE RETAILERS IN FROZEN FRUIT AND VEGETABLE MIX MARKET, BY DISTRIBUTION CHANNEL, 2020-2029 (USD MILLION)
TABLE 191 SWEDEN FROZEN FRUIT AND VEGETABLE MIX MARKET, BY TYPE, 2020-2029 (USD MILLION)
TABLE 192 SWEDEN FROZEN FRUIT AND VEGETABLE MIX MARKET, BY TYPE, 2020-2029 (KILO TONS)
TABLE 193 SWEDEN FROZEN FRUIT AND VEGETABLE MIX MARKET, BY TYPE, 2020-2029 (PRICE PER TON)
TABLE 194 SWEDEN FROZEN FRUIT MIX IN FROZEN FRUIT AND VEGETABLE MIX MARKET, BY TYPE, 2020-2029 (USD MILLION)
TABLE 195 SWEDEN FROZEN FRUIT MIX IN FROZEN FRUIT AND VEGETABLE MIX MARKET, BY TYPE, 2020-2029 (KILO TONS)
TABLE 196 SWEDEN FROZEN VEGETABLE MIX IN FROZEN FRUIT AND VEGETABLE MIX MARKET, BY TYPE, 2020-2029 (USD MILLION)
TABLE 197 TABLE 204 SWEDEN FROZEN VEGETABLE MIX IN FROZEN FRUIT AND VEGETABLE MIX MARKET, BY TYPE, 2020-2029 (KILO TONS)
TABLE 198 SWEDEN FROZEN FRUIT AND VEGETABLE MIX MARKET, BY CATEGORY, 2020-2029 (USD MILLION)
TABLE 199 SWEDEN FROZEN FRUIT AND VEGETABLE MIX MARKET, BY TECHNOLOGY, 2020-2029 (USD MILLION)
TABLE 200 SWEDEN FROZEN FRUIT AND VEGETABLE MIX MARKET, BY END-USER, 2020-2029 (USD MILLION)
TABLE 201 SWEDEN FOOD SERVICE SECTOR IN FROZEN FRUIT AND VEGETABLE MIX MARKET, BY END-USER, 2020-2029 (USD MILLION)
TABLE 202 SWEDEN RESTAURANTS IN FROZEN FRUIT AND VEGETABLE MIX MARKET, BY END-USER, 2020-2029 (USD MILLION)
TABLE 203 SWEDEN FROZEN FRUIT AND VEGETABLE MIX MARKET, BY DISTRIBUTION CHANNEL, 2020-2029 (USD MILLION)
TABLE 204 SWEDEN STORE-BASED RETAILERS IN FROZEN FRUIT AND VEGETABLE MIX MARKET, BY DISTRIBUTION CHANNEL, 2020-2029 (USD MILLION)
TABLE 205 SWEDEN NON-STORE RETAILERS IN FROZEN FRUIT AND VEGETABLE MIX MARKET, BY DISTRIBUTION CHANNEL, 2020-2029 (USD MILLION)
TABLE 206 SWITZERLAND FROZEN FRUIT AND VEGETABLE MIX MARKET, BY TYPE, 2020-2029 (USD MILLION)
TABLE 207 SWITZERLAND FROZEN FRUIT AND VEGETABLE MIX MARKET, BY TYPE, 2020-2029 (KILO TONS)
TABLE 208 SWITZERLAND FROZEN FRUIT AND VEGETABLE MIX MARKET, BY TYPE, 2020-2029 (PRICE PER TON)
TABLE 209 SWITZERLAND FROZEN FRUIT MIX IN FROZEN FRUIT AND VEGETABLE MIX MARKET, BY TYPE, 2020-2029 (USD MILLION)
TABLE 210 SWITZERLAND FROZEN FRUIT MIX IN FROZEN FRUIT AND VEGETABLE MIX MARKET, BY TYPE, 2020-2029 (KILO TONS)
TABLE 211 SWITZERLAND FROZEN VEGETABLE MIX IN FROZEN FRUIT AND VEGETABLE MIX MARKET, BY TYPE, 2020-2029 (USD MILLION)
TABLE 212 SWITZERLAND FROZEN VEGETABLE MIX IN FROZEN FRUIT AND VEGETABLE MIX MARKET, BY TYPE, 2020-2029 (KILO TONS)
TABLE 213 SWITZERLAND FROZEN FRUIT AND VEGETABLE MIX MARKET, BY CATEGORY, 2020-2029 (USD MILLION)
TABLE 214 SWITZERLAND FROZEN FRUIT AND VEGETABLE MIX MARKET, BY TECHNOLOGY, 2020-2029 (USD MILLION)
TABLE 215 SWITZERLAND FROZEN FRUIT AND VEGETABLE MIX MARKET, BY END-USER, 2020-2029 (USD MILLION)
TABLE 216 SWITZERLAND FOOD SERVICE SECTOR IN FROZEN FRUIT AND VEGETABLE MIX MARKET, BY END-USER, 2020-2029 (USD MILLION)
TABLE 217 SWITZERLAND RESTAURANTS IN FROZEN FRUIT AND VEGETABLE MIX MARKET, BY END-USER, 2020-2029 (USD MILLION)
TABLE 218 SWITZERLAND FROZEN FRUIT AND VEGETABLE MIX MARKET, BY DISTRIBUTION CHANNEL, 2020-2029 (USD MILLION)
TABLE 219 SWITZERLAND STORE-BASED RETAILERS IN FROZEN FRUIT AND VEGETABLE MIX MARKET, BY DISTRIBUTION CHANNEL, 2020-2029 (USD MILLION)
TABLE 220 SWITZERLAND NON-STORE RETAILERS IN FROZEN FRUIT AND VEGETABLE MIX MARKET, BY DISTRIBUTION CHANNEL, 2020-2029 (USD MILLION)
TABLE 221 TURKEY FROZEN FRUIT AND VEGETABLE MIX MARKET, BY TYPE, 2020-2029 (USD MILLION)
TABLE 222 TURKEY FROZEN FRUIT AND VEGETABLE MIX MARKET, BY TYPE, 2020-2029 (KILO TONS)
TABLE 223 TURKEY FROZEN FRUIT AND VEGETABLE MIX MARKET, BY TYPE, 2020-2029 (PRICE PER TON)
TABLE 224 TURKEY FROZEN FRUIT MIX IN FROZEN FRUIT AND VEGETABLE MIX MARKET, BY TYPE, 2020-2029 (USD MILLION)
TABLE 225 TURKEY FROZEN FRUIT MIX IN FROZEN FRUIT AND VEGETABLE MIX MARKET, BY TYPE, 2020-2029 (KILO TONS)
TABLE 226 TURKEY FROZEN VEGETABLE MIX IN FROZEN FRUIT AND VEGETABLE MIX MARKET, BY TYPE, 2020-2029 (USD MILLION)
TABLE 227 TURKEY FROZEN VEGETABLE MIX IN FROZEN FRUIT AND VEGETABLE MIX MARKET, BY TYPE, 2020-2029 (KILO TONS)
TABLE 228 TURKEY FROZEN FRUIT AND VEGETABLE MIX MARKET, BY CATEGORY, 2020-2029 (USD MILLION)
TABLE 229 TURKEY FROZEN FRUIT AND VEGETABLE MIX MARKET, BY TECHNOLOGY, 2020-2029 (USD MILLION)
TABLE 230 TURKEY FROZEN FRUIT AND VEGETABLE MIX MARKET, BY END-USER, 2020-2029 (USD MILLION)
TABLE 231 TURKEY FOOD SERVICE SECTOR IN FROZEN FRUIT AND VEGETABLE MIX MARKET, BY END-USER, 2020-2029 (USD MILLION)
TABLE 232 TURKEY RESTAURANTS IN FROZEN FRUIT AND VEGETABLE MIX MARKET, BY END-USER, 2020-2029 (USD MILLION)
TABLE 233 TURKEY FROZEN FRUIT AND VEGETABLE MIX MARKET, BY DISTRIBUTION CHANNEL, 2020-2029 (USD MILLION)
TABLE 234 TURKEY STORE-BASED RETAILERS IN FROZEN FRUIT AND VEGETABLE MIX MARKET, BY DISTRIBUTION CHANNEL, 2020-2029 (USD MILLION)
TABLE 235 TURKEY NON-STORE RETAILERS IN FROZEN FRUIT AND VEGETABLE MIX MARKET, BY DISTRIBUTION CHANNEL, 2020-2029 (USD MILLION)
TABLE 236 REST OF EUROPE FROZEN FRUIT AND VEGETABLE MIX MARKET, BY TYPE, 2020-2029 (USD MILLION)
TABLE 237 REST OF EUROPE FROZEN FRUIT AND VEGETABLE MIX MARKET, BY TYPE, 2020-2029 (KILO TONS)
TABLE 238 REST OF EUROPE FROZEN FRUIT AND VEGETABLE MIX MARKET, BY TYPE, 2020-2029 (PRICE PER TON)
List of Figure
FIGURE 1 EUROPE FROZEN FRUIT AND VEGETABLE MIX MARKET: SEGMENTATION
FIGURE 2 EUROPE FRUIT AND VEGETABLE MIX MARKET: DATA TRIANGULATION
FIGURE 3 EUROPE FROZEN FRUIT AND VEGETABLE MIX MARKET: DROC ANALYSIS
FIGURE 4 EUROPE FROZEN FRUIT AND VEGETABLE MIX MARKET: EUROPE VS REGIONAL MARKET ANALYSIS
FIGURE 5 EUROPE FROZEN FRUIT AND VEGETABLE MIX MARKET: COMPANY RESEARCH ANALYSIS
FIGURE 6 EUROPE FROZEN FRUITS AND VEGETABLE MIX MARKET: INTERVIEW DEMOGRAPHICS
FIGURE 7 EUROPE FROZEN FRUIT AND VEGETABLE MIX MARKET: DBMR MARKET POSITION GRID
FIGURE 8 EUROPE FROZEN FRUIT AND VEGETABLE MIX MARKET: SEGMENTATION
FIGURE 9 GROWING URBANIZATION AND INCREASED ADOPTION OF HEALTHY LIFESTYLES COUPLED WITH INCREASING DEMAND FOR FRUITS AND VEGETABLES WITH LONGER SHELF-LIFE IS LEADING THE GROWTH OF THE EUROPE FROZEN FRUIT AND VEGETABLE MIX MARKET IN THE FORECAST PERIOD OF 2022 TO 2029
FIGURE 10 FROZEN VEGETABLE MIX SEGMENT IS EXPECTED TO ACCOUNT FOR THE LARGEST SHARE OF THE EUROPE FROZEN FRUIT AND VEGETABLE MIX MARKET IN 2022 & 2029
FIGURE 11 DRIVERS, RESTRAINTS, OPPORTUNITIES, AND CHALLENGES OF EUROPE FROZEN FRUIT AND VEGETABLE MIX MARKET
FIGURE 12 EUROPE FROZEN FRUIT AND VEGETABLE MIX MARKET: BY TYPE, 2021
FIGURE 13 EUROPE FROZEN FRUIT AND VEGETABLE MIX MARKET: BY CATEGORY, 2021
FIGURE 14 EUROPE FROZEN FRUIT AND VEGETABLE MIX MARKET: BY TECHNOLOGY, 2021
FIGURE 15 EUROPE FROZEN FRUIT AND VEGETABLE MIX MARKET: BY END USER (2021)
FIGURE 16 EUROPE FROZEN FRUIT AND VEGETABLE MIX MARKET: BY DISTRIBUTION CHANNEL, 2021
FIGURE 17 EUROPE FROZEN FRUIT AND VEGETABLE MIX MARKET: SNAPSHOT (2021)
FIGURE 18 EUROPE FROZEN FRUIT AND VEGETABLE MIX MARKET: BY COUNTRY (2021)
FIGURE 19 EUROPE FROZEN FRUIT AND VEGETABLE MIX MARKET: BY COUNTRY (2022 & 2029)
FIGURE 20 EUROPE FROZEN FRUIT AND VEGETABLE MIX MARKET: BY COUNTRY (2021 & 2029)
FIGURE 21 EUROPE FROZEN FRUIT AND VEGETABLE MIX MARKET: BY TYPE (2022 & 2029)
FIGURE 22 EUROPE FROZEN FRUIT AND VEGETABLE MIX MARKET: COMPANY SHARE 2021 (%)
Europe Frozen Fruit And Vegetables Mix Market, Supply Chain Analysis and Ecosystem Framework
To support market growth and help clients navigate the impact of geopolitical shifts, DBMR has integrated in-depth supply chain analysis into its Europe Frozen Fruit And Vegetables Mix Market research reports. This addition empowers clients to respond effectively to global changes affecting their industries. The supply chain analysis section includes detailed insights such as Europe Frozen Fruit And Vegetables Mix Market consumption and production by country, price trend analysis, the impact of tariffs and geopolitical developments, and import and export trends by country and HSN code. It also highlights major suppliers with data on production capacity and company profiles, as well as key importers and exporters. In addition to research, DBMR offers specialized supply chain consulting services backed by over a decade of experience, providing solutions like supplier discovery, supplier risk assessment, price trend analysis, impact evaluation of inflation and trade route changes, and comprehensive market trend analysis.
Data collection and base year analysis are done using data collection modules with large sample sizes. The stage includes obtaining market information or related data through various sources and strategies. It includes examining and planning all the data acquired from the past in advance. It likewise envelops the examination of information inconsistencies seen across different information sources. The market data is analysed and estimated using market statistical and coherent models. Also, market share analysis and key trend analysis are the major success factors in the market report. To know more, please request an analyst call or drop down your inquiry.
The key research methodology used by DBMR research team is data triangulation which involves data mining, analysis of the impact of data variables on the market and primary (industry expert) validation. Data models include Vendor Positioning Grid, Market Time Line Analysis, Market Overview and Guide, Company Positioning Grid, Patent Analysis, Pricing Analysis, Company Market Share Analysis, Standards of Measurement, Global versus Regional and Vendor Share Analysis. To know more about the research methodology, drop in an inquiry to speak to our industry experts.
Data Bridge Market Research is a leader in advanced formative research. We take pride in servicing our existing and new customers with data and analysis that match and suits their goal. The report can be customized to include price trend analysis of target brands understanding the market for additional countries (ask for the list of countries), clinical trial results data, literature review, refurbished market and product base analysis. Market analysis of target competitors can be analyzed from technology-based analysis to market portfolio strategies. We can add as many competitors that you require data about in the format and data style you are looking for. Our team of analysts can also provide you data in crude raw excel files pivot tables (Fact book) or can assist you in creating presentations from the data sets available in the report.


