
Europe Handheld Spectrum Analyzer Market
Market Size in USD Million
 USD
136.40 Million
USD
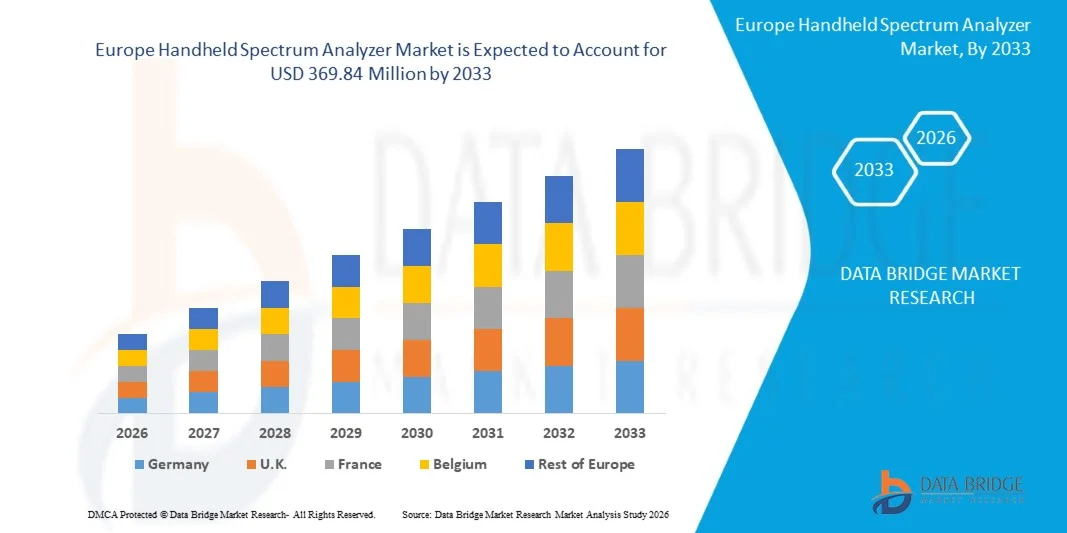
369.84 Million
2025
2033
USD
136.40 Million
USD
369.84 Million
2025
2033
| 2026 - 2033 | |
| USD 136.40 Million | |
| USD 369.84 Million | |
| % | |
|
Europe Handheld Spectrum Analyzer Market Size
- The Europe Handheld Spectrum Analyzer Market size was valued at USD 136.40 million in 2025 and is expected to reach USD 369.84 million by 2033, at a CAGR of 13.27% during the forecast period
- The market growth is largely fueled by the rapid expansion of wireless communication networks, including 4G, 5G, satellite, and IoT infrastructure, leading to increased demand for accurate and portable RF testing solutions across field environments
- Furthermore, rising investments in aerospace, defense, and telecommunications sectors, coupled with the growing need for real-time signal monitoring and interference detection, are positioning handheld spectrum analyzers as essential tools for efficient spectrum management and network optimization. These converging factors are accelerating product adoption, thereby significantly boosting overall market growth
Europe Handheld Spectrum Analyzer Market Analysis
- Handheld spectrum analyzers, designed for portable radio frequency measurement and signal analysis, are becoming critical instruments in field testing, maintenance, and troubleshooting activities across telecommunications, aerospace, defense, and industrial applications due to their compact design, mobility, and advanced real-time analysis capabilities
- The escalating demand for handheld spectrum analyzers is primarily driven by continuous advancements in wireless technologies, increasing complexity of RF environments, and the growing need for efficient on-site testing solutions that ensure signal integrity and regulatory compliance
- Germany dominated the Europe Handheld Spectrum Analyzer Market in 2025, due to its advanced telecommunications infrastructure, strong industrial automation sector, and significant investments in aerospace and automotive electronics testing
- U.K. is expected to be the fastest growing country in the Europe Handheld Spectrum Analyzer Market during the forecast period due to rapid expansion of 5G networks, defense communication upgrades, and rising adoption of wireless technologies across telecom and aerospace sectors
- Real-time spectrum analyzer segment dominated the market with a market share of 39.1% in 2025, due to its ability to capture transient and rapidly changing signals without missing events. These analyzers provide continuous spectrum monitoring with advanced triggering capabilities, making them essential for interference detection and complex signal environments
Report Scope and Europe Handheld Spectrum Analyzer Market Segmentation
|
Attributes |
Handheld Spectrum Analyzer Key Market Insights |
|
Segments Covered |
|
|
Countries Covered |
Europe
|
|
Key Market Players |
|
|
Market Opportunities |
|
|
Value Added Data Infosets |
In addition to the insights on market scenarios such as market value, growth rate, segmentation, geographical coverage, and major players, the market reports curated by the Data Bridge Market Research also include in-depth expert analysis, geographically represented company-wise production and capacity, network layouts of distributors and partners, detailed and updated price trend analysis and deficit analysis of supply chain and demand. |
Europe Handheld Spectrum Analyzer Market Trends
“Increasing Integration of Real-Time Analysis and High-Frequency Capabilities”
- A major trend in the Europe Handheld Spectrum Analyzer Market is the growing integration of real-time spectrum analysis and expanded high-frequency measurement capabilities to support modern wireless environments. This advancement is enhancing field testing efficiency and enabling engineers to detect intermittent signals, interference sources, and complex modulation patterns with greater accuracy across telecom, aerospace, and defense sectors
- For instance, Keysight Technologies and Rohde & Schwarz offer handheld spectrum analyzers with real-time analysis and frequency coverage extending into millimeter-wave bands to support advanced network validation. These devices allow technicians to perform precise on-site measurements and maintain signal integrity in increasingly dense radio frequency environments
- The demand for portable solutions capable of analyzing high-frequency bands is expanding as communication systems migrate toward higher spectrum ranges. This is positioning handheld analyzers as essential tools for installation, maintenance, and troubleshooting of next-generation wireless networks
- Compact form factors combined with enhanced battery performance are improving operational flexibility in field conditions where mobility and rapid diagnostics are critical. This is encouraging broader adoption across remote infrastructure projects and mission-critical communication setups
- The integration of advanced signal processing software is strengthening measurement precision by enabling real-time visualization, interference hunting, and automated reporting functions. These software-driven capabilities are elevating user efficiency and minimizing diagnostic time in complex network environments
- The market is witnessing steady growth as industries prioritize faster deployment and accurate spectrum monitoring across evolving communication infrastructures. The increasing combination of portability, high-frequency coverage, and real-time analytics is reinforcing the strategic importance of handheld spectrum analyzers in modern wireless ecosystems
Europe Handheld Spectrum Analyzer Market Dynamics
Driver
“Expansion of 5G and Advanced Wireless Communication Infrastructure”
- The rapid expansion of 5G networks and advanced wireless communication systems is significantly driving demand for handheld spectrum analyzers capable of validating high-frequency and wide-bandwidth signals. These instruments support accurate testing, interference detection, and performance optimization during network rollout and maintenance activities
- For instance, Ericsson deploys advanced testing and measurement solutions during 5G infrastructure implementation to ensure network reliability and spectrum efficiency. Such large-scale deployments require portable spectrum analyzers to perform field validation and maintain signal performance standards
- The increasing density of base stations and small cell installations is raising the need for efficient on-site spectrum analysis to manage interference and ensure seamless connectivity. Handheld analyzers provide technicians with the capability to verify signal strength and identify frequency overlaps in complex urban deployments
- The adoption of advanced wireless technologies in industries such as manufacturing, defense, and transportation is further strengthening the requirement for precise radio frequency testing tools. These sectors depend on stable and secure wireless communication that must be continuously monitored and optimized
- The continuous global rollout of high-speed wireless communication systems remains a fundamental growth driver for the market. The need for accurate spectrum management, performance assurance, and efficient network troubleshooting is reinforcing long-term demand for advanced handheld spectrum analyzers
Restraint/Challenge
“High Cost of Advanced Handheld Spectrum Analyzers”
- The Europe Handheld Spectrum Analyzer Market faces challenges due to the high cost associated with advanced models that incorporate real-time analysis, extended frequency coverage, and enhanced signal processing capabilities. These sophisticated features significantly increase product pricing and limit accessibility for small enterprises and independent technicians
- For instance, Anritsu manufactures high-performance handheld spectrum analyzers designed for 5G and millimeter-wave testing, which involve complex engineering and premium components. The incorporation of high-frequency modules and advanced software architectures contributes to elevated procurement costs
- Developing analyzers capable of operating across wide bandwidths requires specialized components and rigorous calibration processes that increase manufacturing complexity. These requirements elevate overall production expenses and impact pricing flexibility in competitive markets
- The integration of high-resolution displays, durable ruggedized enclosures, and extended battery systems further adds to design and material costs. This makes it challenging for manufacturers to balance performance enhancement with affordability
- The ongoing pressure to deliver high-precision measurement capabilities while maintaining competitive pricing continues to challenge market participants. Managing cost structures without compromising performance remains a critical restraint influencing the growth trajectory of the Europe Handheld Spectrum Analyzer Market
Europe Handheld Spectrum Analyzer Market Scope
The market is segmented on the basis of product type, frequency type, size, power source, network technology, and end use.
• By Product Type
On the basis of product type, the Europe Handheld Spectrum Analyzer Market is segmented into swept-tuned spectrum analyzer, vector signal spectrum analyzer, and real-time spectrum analyzer. The real-time spectrum analyzer segment dominated the market with the largest revenue share of 39.1% in 2025, driven by its ability to capture transient and rapidly changing signals without missing events. These analyzers provide continuous spectrum monitoring with advanced triggering capabilities, making them essential for interference detection and complex signal environments. Industries such as aerospace, defense, and telecommunications increasingly rely on real-time analysis to ensure signal integrity and compliance with stringent standards. The growing deployment of wireless technologies and dense RF environments further supports the dominance of this segment.
The vector signal spectrum analyzer segment is anticipated to witness the fastest growth rate from 2026 to 2033, fueled by rising demand for advanced modulation analysis in 5G and next-generation communication systems. These analyzers enable precise measurement of amplitude, phase, and frequency parameters, supporting complex digital signal testing. Increasing R&D activities in semiconductor and telecom sectors drive adoption of vector signal models for detailed performance validation. Their capability to evaluate error vector magnitude and signal quality makes them crucial for modern communication device development.
• By Frequency Type
On the basis of frequency type, the Europe Handheld Spectrum Analyzer Market is segmented into less than 6 GHz, 6 GHz–18 GHz, and more than 18 GHz. The less than 6 GHz segment dominated the market with the largest revenue share in 2025, supported by extensive usage across commercial wireless communication, broadcasting, and industrial applications. Most legacy communication systems and a significant portion of current 4G and sub-6 GHz 5G networks operate within this range, creating consistent demand for compatible analyzers. Cost-effectiveness and wide applicability further enhance its market position. The segment benefits from continuous infrastructure upgrades in telecom and public safety networks.
The 6 GHz–18 GHz segment is projected to grow at the fastest rate during the forecast period, driven by expanding deployment of advanced radar systems, satellite communication, and higher-frequency 5G applications. Increasing adoption of microwave backhaul and defense communication systems contributes to demand in this frequency band. Technological advancements enabling compact high-frequency measurement solutions also accelerate growth. The need for precise high-frequency testing in aerospace and defense sectors strengthens this segment’s outlook.
• By Size
On the basis of size, the Europe Handheld Spectrum Analyzer Market is segmented into less than 1 kg and more than 1 kg. The less than 1 kg segment dominated the market in 2025 due to its portability and suitability for field testing applications. Lightweight analyzers are preferred by technicians for on-site maintenance, tower inspections, and mobile network troubleshooting. Their compact design enhances operational convenience without compromising essential measurement capabilities. Increasing field-based diagnostics in telecom and industrial sectors reinforces this segment’s dominance.
The more than 1 kg segment is expected to register the fastest growth rate from 2026 to 2033, supported by demand for higher-performance handheld devices with extended features and broader frequency coverage. These models often incorporate advanced processing power and larger displays, improving measurement accuracy and user experience. Industries requiring robust and ruggedized equipment for harsh environments favor slightly heavier devices. Growing complexity of RF testing requirements contributes to increased adoption of feature-rich analyzers.
• By Power Source
On the basis of power source, the Europe Handheld Spectrum Analyzer Market is segmented into battery, line, and others. The battery-powered segment dominated the market with the highest revenue share in 2025, driven by the need for mobility and uninterrupted field operations. Battery-operated analyzers enable technicians to conduct measurements in remote locations without dependence on fixed power infrastructure. Improvements in lithium-ion battery efficiency and extended operating hours further enhance usability. The increasing emphasis on outdoor testing in telecom and defense applications supports this segment’s leading position.
The line-powered segment is projected to witness the fastest growth during the forecast period, fueled by demand for stable and continuous power supply in laboratory and industrial testing environments. Line-powered analyzers provide consistent performance for prolonged analysis and calibration tasks. Research institutions and manufacturing facilities prefer such models for precision testing and validation processes. Expansion of electronics manufacturing and R&D activities contributes to segment growth.
• By Network Technology
On the basis of network technology, the Europe Handheld Spectrum Analyzer Market is segmented into wired and wireless. The wired segment dominated the market in 2025, supported by its reliability and secure data transmission capabilities during critical testing procedures. Wired connectivity ensures minimal signal interference and stable communication between devices and analysis software. Many industrial and defense applications prioritize wired interfaces to maintain data integrity and cybersecurity compliance. The established infrastructure of wired systems strengthens its continued dominance.
The wireless segment is anticipated to grow at the fastest rate from 2026 to 2033, driven by increasing demand for remote monitoring and cloud-based data sharing. Wireless-enabled analyzers allow seamless integration with mobile devices and centralized management platforms. This capability enhances operational efficiency and flexibility for field engineers. Growing adoption of IoT-enabled testing environments accelerates the shift toward wireless connectivity solutions.
• By End Use
On the basis of end use, the Europe Handheld Spectrum Analyzer Market is segmented into automotive & transportation, aerospace & defense, IT & telecommunication, medical & healthcare, semiconductors & electronics, industrial & energy, educational institutes, government sector, and others. The IT & telecommunication segment dominated the market with the largest revenue share in 2025, driven by rapid expansion of wireless communication networks and continuous upgrades to 5G infrastructure. Telecom operators rely heavily on handheld analyzers for network installation, optimization, and interference management. Increasing data traffic and demand for seamless connectivity further reinforce adoption in this sector. Ongoing investments in next-generation communication technologies sustain its leadership position.
The aerospace & defense segment is expected to witness the fastest growth rate during the forecast period, fueled by rising investments in advanced radar, satellite, and electronic warfare systems. Handheld spectrum analyzers play a critical role in testing and maintaining mission-critical RF communication equipment. Stringent regulatory standards and the need for precise frequency management drive demand in defense applications. Modernization of defense communication infrastructure supports strong growth potential in this segment.
Europe Handheld Spectrum Analyzer Market Regional Analysis
- Germany dominated the Europe Handheld Spectrum Analyzer Market with the largest revenue share in 2025, driven by its advanced telecommunications infrastructure, strong industrial automation sector, and significant investments in aerospace and automotive electronics testing
- Germany’s well-established measurement and instrumentation ecosystem, supported by companies such as Rohde & Schwarz and Deutsche Telekom, reinforces steady deployment of portable spectrum analyzers for 5G validation, RF compliance testing, and network optimization
- Increasing focus on Industry 4.0 implementation, private 5G network deployment, and secure defense communication systems strengthens Germany’s leading position in the Europe Handheld Spectrum Analyzer Market
U.K. Europe Handheld Spectrum Analyzer Market Insight
The U.K. is projected to register the fastest CAGR in the Europe Handheld Spectrum Analyzer Market during the forecast period, supported by rapid expansion of 5G networks, defense communication upgrades, and rising adoption of wireless technologies across telecom and aerospace sectors. Growing investments in spectrum management, increasing demand for field testing solutions, and strong presence of test equipment providers accelerate market growth. The U.K.’s focus on advanced wireless infrastructure development and regulatory compliance positions it as the fastest-growing market in Europe.
France Europe Handheld Spectrum Analyzer Market Insight
France is expected to witness steady growth during the forecast period, driven by consistent demand from telecommunications, defense, and broadcasting sectors requiring reliable RF testing and monitoring solutions. The country’s emphasis on expanding fiber and 5G infrastructure, along with support from technology companies such as Thales Group, sustains adoption of portable spectrum analyzers. Ongoing modernization of communication networks, investments in aerospace electronics, and regulatory focus on spectrum efficiency support stable market expansion. Sustained emphasis on performance, mobility, and compliance reinforces France’s steady growth within the Europe Handheld Spectrum Analyzer Market.
Europe Handheld Spectrum Analyzer Market Share
The handheld spectrum analyzer industry is primarily led by well-established companies, including:
- RIGOL TECHNOLOGIES, Co. LTD. (China)
- Keysight Technologies (U.S.)
- Good Will Instrument Co., Ltd. (Taiwan)
- TEKTRONIX, INC. (U.S.)
- ANRITSU CORPORATION (Japan)
- Bird (U.S.)
- Savitri Telecom Services (India)
- HUBER+SUHNER (Switzerland)
- VIAVI Solutions Inc. (U.S.)
- Aaronia AG (Germany)
- B&K Precision Corporation (U.S.)
- Narda Safety Test Solutions GmbH (Germany)
- Aim and Thurlby Thandar Instruments (U.K.)
- BERKELEY NUCLEONICS CORPORATION (U.S.)
- CRFS (U.K.)
- Saluki Technology (Taiwan)
Latest Developments in Europe Handheld Spectrum Analyzer Market
- In March 2025, HAROGIC launched the HAROGIC PXN-400Z handheld spectrum analyzer with frequency coverage up to 40 GHz and 100 MHz bandwidth. Built on the Windows 11 operating system and powered by the AMD Z1 Extreme CPU, the device enhances field computing and real-time analysis capabilities for high-frequency applications. This launch strengthens HAROGIC’s competitive positioning in the high-band spectrum analysis segment by addressing growing demand for advanced 5G, aerospace, and microwave testing solutions while expanding its technological footprint in portable RF instruments
- In May 2024, Siglent Technologies released the SHN900A series handheld vector network analyzer with a frequency range up to 26.5 GHz. The device integrates vector network analysis, time domain analysis, spectrum analysis, and cable and antenna testing into a unified portable solution tailored for field and laboratory environments. This development enhances Siglent’s market presence by offering a comprehensive and flexible RF testing platform, supporting adoption across telecommunications, automotive electronics, production, and R&D sectors while strengthening its share in multifunction handheld analysis equipment
- In July 2023, Keysight Technologies expanded its FieldFox portfolio with the introduction of the N9912C FieldFox Handheld Analyzer, a software-defined RF testing platform. The solution provides field engineers with more than 20 upgradeable options across vector network analysis, cable and antenna testing, and spectrum analysis, enabling scalable functionality. This expansion reinforces Keysight’s leadership in modular and upgradeable handheld RF solutions, enhancing customer retention and positioning the company to capture increasing demand for flexible and future-ready field testing technologies
- In September 2021, Tektronix entered into a strategic partnership with a leading telecommunications provider to co-develop next-generation spectrum analysis solutions. This collaboration strengthens Tektronix’s position in the Europe Handheld Spectrum Analyzer Market by accelerating innovation cycles and enhancing solution capabilities tailored for evolving telecom infrastructure. By leveraging shared expertise, the company improves its competitiveness in advanced 5G and high-frequency testing applications while expanding its influence across modern network deployment projects
- In August 2021, Keysight Technologies announced the launch of its latest handheld spectrum analyzer featuring advanced signal analysis capabilities designed for 5G applications. This product introduction enhances Keysight’s competitive standing by directly addressing the increasing demand for accurate 5G field testing and validation. The launch supports revenue growth potential by strengthening customer loyalty and reinforcing the company’s technological leadership in next-generation wireless testing solutions
SKU-

- Interactive Data Analysis Dashboard
- Company Analysis Dashboard for high growth potential opportunities
- Research Analyst Access for customization & queries
- Competitor Analysis with Interactive dashboard
- Latest News, Updates & Trend analysis
- Harness the Power of Benchmark Analysis for Comprehensive Competitor Tracking
Europe Handheld Spectrum Analyzer Market, Supply Chain Analysis and Ecosystem Framework
To support market growth and help clients navigate the impact of geopolitical shifts, DBMR has integrated in-depth supply chain analysis into its Europe Handheld Spectrum Analyzer Market research reports. This addition empowers clients to respond effectively to global changes affecting their industries. The supply chain analysis section includes detailed insights such as Europe Handheld Spectrum Analyzer Market consumption and production by country, price trend analysis, the impact of tariffs and geopolitical developments, and import and export trends by country and HSN code. It also highlights major suppliers with data on production capacity and company profiles, as well as key importers and exporters. In addition to research, DBMR offers specialized supply chain consulting services backed by over a decade of experience, providing solutions like supplier discovery, supplier risk assessment, price trend analysis, impact evaluation of inflation and trade route changes, and comprehensive market trend analysis.
Data collection and base year analysis are done using data collection modules with large sample sizes. The stage includes obtaining market information or related data through various sources and strategies. It includes examining and planning all the data acquired from the past in advance. It likewise envelops the examination of information inconsistencies seen across different information sources. The market data is analysed and estimated using market statistical and coherent models. Also, market share analysis and key trend analysis are the major success factors in the market report. To know more, please request an analyst call or drop down your inquiry.
The key research methodology used by DBMR research team is data triangulation which involves data mining, analysis of the impact of data variables on the market and primary (industry expert) validation. Data models include Vendor Positioning Grid, Market Time Line Analysis, Market Overview and Guide, Company Positioning Grid, Patent Analysis, Pricing Analysis, Company Market Share Analysis, Standards of Measurement, Global versus Regional and Vendor Share Analysis. To know more about the research methodology, drop in an inquiry to speak to our industry experts.
Data Bridge Market Research is a leader in advanced formative research. We take pride in servicing our existing and new customers with data and analysis that match and suits their goal. The report can be customized to include price trend analysis of target brands understanding the market for additional countries (ask for the list of countries), clinical trial results data, literature review, refurbished market and product base analysis. Market analysis of target competitors can be analyzed from technology-based analysis to market portfolio strategies. We can add as many competitors that you require data about in the format and data style you are looking for. Our team of analysts can also provide you data in crude raw excel files pivot tables (Fact book) or can assist you in creating presentations from the data sets available in the report.


