
Europe Industrial Display Market
Market Size in USD Million
 USD
169.48 Million
USD
258.13 Million
2025
2033
USD
169.48 Million
USD
258.13 Million
2025
2033
| 2026 - 2033 | |
| USD 169.48 Million | |
| USD 258.13 Million | |
| % | |
|
Europe Industrial Display Market Size
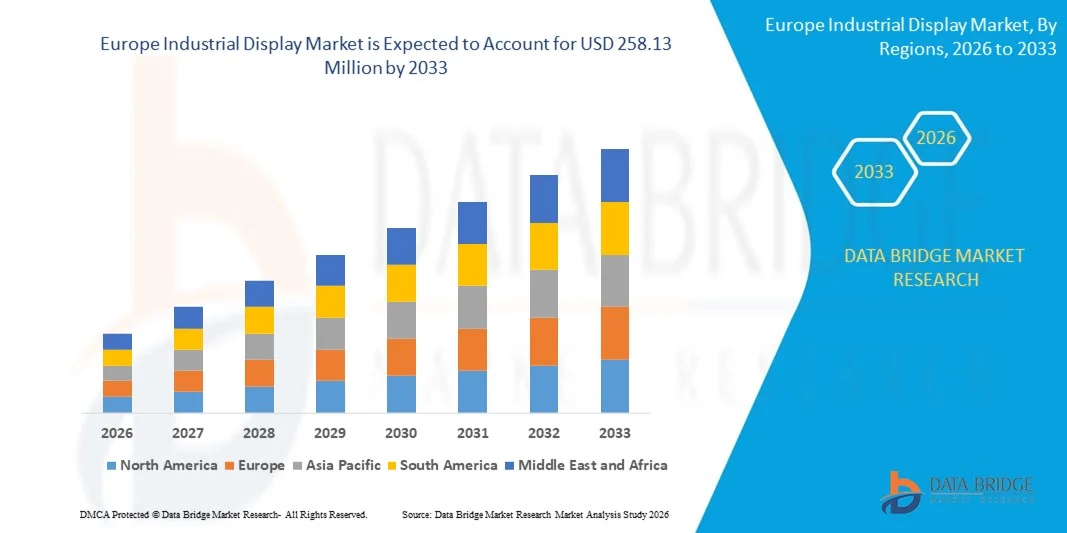
- The Europe industrial display market size was valued at USD 169.48 million in 2025 and is expected to reach USD 258.13 million by 2033, at a CAGR of 5.40% during the forecast period
- The market growth is largely fuelled by the rising adoption of automation in manufacturing and industrial processes
- Increasing demand for real-time monitoring and control systems in industries such as automotive, healthcare, and logistics
Europe Industrial Display Market Analysis
- The market is witnessing strong technological advancements, including the integration of touchscreens, high-resolution displays, and IoT connectivity
- Rising emphasis on smart factories and Industry 4.0 initiatives is boosting demand for industrial display solutions
- Germany dominated the Europe industrial display market with the largest revenue share in 2025, driven by high adoption of smart factories, automation, and connected industrial systems
- U.K. is expected to witness the highest compound annual growth rate (CAGR) in the Europe industrial display market due to increasing investment in digital manufacturing, industrial IoT adoption, and rising demand for high-performance and rugged HMI displays
- The Rugged Displays segment held the largest market revenue share in 2025, driven by their durability and ability to operate in harsh industrial environments. These displays are widely used in manufacturing plants, logistics facilities, and industrial automation systems for reliable real-time monitoring. Their resistance to extreme temperatures, dust, and vibration makes them a preferred choice for heavy machinery interfaces. Industrial operators also favor rugged displays for long-term cost efficiency and reduced maintenance requirements
Report Scope and Europe Industrial Display Market Segmentation
|
Attributes |
Europe Industrial Display Key Market Insights |
|
Segments Covered |
|
|
Countries Covered |
Europe
|
|
Key Market Players |
|
|
Market Opportunities |
|
|
Value Added Data Infosets |
In addition to the insights on market scenarios such as market value, growth rate, segmentation, geographical coverage, and major players, the market reports curated by the Data Bridge Market Research also include in-depth expert analysis, geographically represented company-wise production and capacity, network layouts of distributors and partners, detailed and updated price trend analysis and deficit analysis of supply chain and demand. |
Europe Industrial Display Market Trends
Rising Demand for Smart And High-Performance Industrial Displays
- The growing adoption of automation, real-time monitoring, and connected industrial systems is significantly shaping the industrial display market, as manufacturers increasingly prefer displays that are durable, high-resolution, and energy-efficient. Industrial displays are gaining traction due to their ability to improve operational efficiency, safety, and process control without compromising system reliability. This trend strengthens their adoption across manufacturing, logistics, and healthcare sectors, encouraging companies to innovate with advanced display solutions that cater to evolving industrial requirements
- Increasing awareness around Industry 4.0, smart factories, and operational efficiency has accelerated the demand for industrial displays in production lines, control rooms, and industrial machinery. Manufacturers and facility operators are actively seeking displays that offer high visibility, touch capabilities, and IoT connectivity, prompting suppliers to prioritize durability, modular designs, and seamless integration with industrial systems
- Technological advancements and smart factory trends are influencing purchasing decisions, with companies emphasizing ruggedness, scalability, and energy efficiency. These factors are helping brands differentiate products in a competitive market and build client trust, while also driving the adoption of customizable and application-specific display solutions. Companies are increasingly using marketing campaigns and demonstrations to highlight these benefits to reinforce brand positioning and appeal to industrial clients
- For instance, in 2024, Siemens expanded its industrial automation product line by integrating high-resolution industrial displays into control panels, enhancing monitoring and operational efficiency. Similarly, Rockwell Automation launched touchscreen-enabled displays for its industrial control systems, targeting manufacturing and logistics applications
- Continuous innovation in display technologies, including touchscreens, sunlight-readable panels, and multi-interface compatibility, is expanding product offerings. Manufacturers are introducing solutions that cater to complex industrial requirements such as hazardous environments, vibration resistance, and 24/7 operational reliability
While demand for industrial displays is growing, sustained market expansion depends on continuous R&D, cost-effective production, and maintaining functional performance under harsh industrial conditions. Suppliers are also focusing on improving supply chain reliability, scalable manufacturing, and developing innovative solutions that balance cost, quality, and technological sophistication for broader adoption
Europe Industrial Display Market Dynamics
Driver
Growing Adoption Of Automation And Industry 4.0 Initiatives
- Rising industrial digitization and the shift toward smart manufacturing are major drivers for the industrial display market. Manufacturers are increasingly replacing conventional displays with high-performance solutions to meet operational requirements, enhance process visibility, and comply with safety standards. This trend is also pushing research into advanced display technologies, supporting product diversification
- Expanding applications in manufacturing, logistics, healthcare, and control systems are influencing market growth. Industrial displays help improve operational efficiency, real-time monitoring, and process control while maintaining system reliability, enabling manufacturers to meet industry standards and client expectations. The increasing use of connected and automated systems globally further reinforces this trend
- Industrial equipment manufacturers are actively promoting advanced display-based solutions through product innovation, demonstrations, and industry certifications. These efforts are supported by the growing focus on operational efficiency, safety, and sustainability, and they also encourage partnerships between display suppliers and industrial solution providers to improve performance and reduce downtime
- For instance, in 2023, Schneider Electric introduced sunlight-readable industrial monitors for automation systems, improving visibility in manufacturing operations. ABB also upgraded its industrial control panels with multi-touch displays for enhanced process monitoring and operator efficiency
- Although rising automation and digitalization trends support growth, wider adoption depends on cost optimization, technological reliability, and scalable production processes. Investment in R&D, supply chain efficiency, and advanced display technologies will be critical for meeting global demand and maintaining competitive advantage
Restraint/Challenge
Higher Cost And Limited Awareness Compared To Conventional Displays
- The relatively higher cost of advanced industrial displays compared to conventional screens remains a key challenge, limiting adoption among price-sensitive manufacturers. High component costs, sophisticated manufacturing, and complex integration contribute to elevated pricing. In addition, fluctuating supply of specialized materials can further affect cost stability and market penetration
- Awareness of advanced display benefits remains uneven, particularly in industries still reliant on legacy systems. Limited understanding of functional advantages restricts adoption across certain sectors. This also leads to slower innovation uptake in organizations where educational initiatives on industrial display technologies are minimal
- Supply chain and integration challenges also impact market growth, as industrial displays require sourcing from specialized suppliers and adherence to strict quality standards. Logistical complexities and installation requirements increase operational costs. Companies must invest in training, handling, and efficient deployment networks to maintain system reliability
- For instance, some industrial facilities reported delays in adopting high-performance displays due to higher prices and lack of operator familiarity, affecting upgrades in control room operations. Integration of new touchscreen displays in existing systems also required additional training and setup costs
- Overcoming these challenges will require cost-efficient production, expanded distribution networks, and focused educational initiatives for manufacturers and end-users. Collaboration with industrial integrators, technology providers, and certification bodies can help unlock the long-term growth potential of the European industrial display market. Furthermore, developing cost-competitive, rugged, and high-performance solutions will be essential for widespread adoption
Europe Industrial Display Market Scope
The market is segmented on the basis of type, panel size, technology, communication type, and application.
- By Type
On the basis of type, the Europe industrial display market is segmented into Rugged Displays, Open Frame Monitors, Multi-Touch (P-Cap) Display, Front Display, USB Type-C Display, SDI Display, Rear Mount Display, Panel Mount Monitors, Marine Displays, Video Walls, and Others. The Rugged Displays segment held the largest market revenue share in 2025, driven by their durability and ability to operate in harsh industrial environments. These displays are widely used in manufacturing plants, logistics facilities, and industrial automation systems for reliable real-time monitoring. Their resistance to extreme temperatures, dust, and vibration makes them a preferred choice for heavy machinery interfaces. Industrial operators also favor rugged displays for long-term cost efficiency and reduced maintenance requirements.
The Multi-Touch (P-Cap) Display segment is expected to witness the fastest growth rate from 2026 to 2033, fueled by rising demand for interactive control panels and advanced operator interfaces. Multi-touch displays offer precise input, enhanced user experience, and compatibility with modern industrial software, making them increasingly popular for smart factories and automation applications. Their ability to support multiple gestures simultaneously enables more complex controls and better visualization of operational data. Industries adopting lean manufacturing and Industry 4.0 technologies are likely to increase deployment of these displays for process optimization.
- By Panel Size
On the basis of panel size, the market is segmented into Up to 14 Inches, 14 Inches to 21 Inches, 21 to 40 Inches, and 40 Inches and Above. The 21 to 40 Inches segment held the largest share in 2025 due to its ideal balance of visibility, functionality, and integration in industrial control rooms and monitoring systems. These displays provide sufficient screen area for multiple data inputs, real-time analytics, and control dashboards without occupying excessive space. They are extensively deployed in manufacturing floors, energy plants, and logistics hubs for operational monitoring.
The 14 Inches to 21 Inches segment is expected to witness the fastest growth rate from 2026 to 2033, supported by the rising deployment of compact yet high-performance displays for machinery interfaces, HMI panels, and modular industrial systems. Smaller form factors are increasingly preferred for limited-space applications and portable equipment. Their affordability, coupled with high resolution and touchscreen capabilities, makes them suitable for smaller factories, automated kiosks, and mobile industrial solutions.
- By Technology
On the basis of technology, the market is segmented into LCD, LED, OLED, and E-Paper Display. The LCD segment held the largest revenue share in 2025 owing to its cost-effectiveness, reliability, and widespread adoption across various industrial applications. LCD panels are known for their high brightness, energy efficiency, and long operational lifespan, making them ideal for 24/7 industrial use. They are commonly integrated into machinery, control panels, and monitoring stations.
The OLED segment is expected to witness the fastest growth rate from 2026 to 2033, driven by its superior contrast ratio, low power consumption, and flexibility for advanced industrial solutions such as wearable displays and high-end control panels. OLED displays enable thinner and lighter designs, offering better color accuracy and viewing angles. Their flexibility supports innovative installations in industrial environments, including curved panels and portable devices for dynamic operational needs.
- By Communication Type
On the basis of communication type, the market is segmented into Serial, Ethernet, Mobile Network, Industrial Communication, RF/Zigbee/IR, Jason/MQTT, and Others. The Ethernet segment held the largest market share in 2025 due to its robust connectivity, low latency, and widespread use in industrial networking and automation systems. Ethernet-enabled displays allow seamless integration with industrial control systems, real-time data transmission, and reliable remote monitoring. This communication type is widely preferred for large-scale factories and automated production lines.
The Industrial Communication segment is expected to witness the fastest growth rate from 2026 to 2033, driven by the increasing adoption of smart factories and Industry 4.0 systems that rely on real-time, secure, and reliable communication protocols for connected industrial displays. These protocols support predictive maintenance, asset tracking, and automated reporting. Manufacturers increasingly prioritize Industrial Communication-enabled displays to enable faster decision-making and improve overall operational efficiency.
- By Application
On the basis of application, the market is segmented into HMI, Remote Monitoring, Interactive Display, Digital Signage, and Imaging. The HMI segment held the largest share in 2025, as human-machine interfaces are essential for monitoring, controlling, and optimizing industrial operations across production lines and machinery. HMIs facilitate data visualization, system alerts, and operational commands, allowing operators to manage complex industrial processes efficiently. Their integration with sensors and controllers enhances safety and productivity.
The Interactive Display segment is expected to witness the fastest growth from 2026 to 2033, owing to rising demand for intuitive, touchscreen-enabled industrial displays that enhance operator efficiency, reduce errors, and support advanced automation systems. Interactive displays allow multi-user operations, real-time collaboration, and integration with IoT devices. Industries implementing smart manufacturing and connected workspaces increasingly deploy interactive displays to enable better human-machine interaction and streamlined workflow management.
Europe Industrial Display Market Regional Analysis
- Germany dominated the Europe industrial display market with the largest revenue share in 2025, driven by high adoption of smart factories, automation, and connected industrial systems
- Industrial operators in the country highly value rugged, high-resolution, and energy-efficient displays that enable real-time monitoring, predictive maintenance, and seamless integration with IoT-enabled control systems
- This widespread adoption is further supported by a technologically skilled workforce, strong industrial infrastructure, and increasing focus on operational efficiency, establishing industrial displays as a critical component across manufacturing, logistics, and healthcare sectors
U.K. Industrial Display Market Insight
The U.K. industrial display market is expected to witness the fastest growth rate from 2026 to 2033, fueled by rising smart factory adoption and Industry 4.0 initiatives. Manufacturers are increasingly deploying interactive, touchscreen-enabled displays to optimize workflow, reduce errors, and enhance operator efficiency. The demand for energy-efficient, customizable, and rugged display solutions, combined with advanced industrial automation projects, is significantly contributing to market expansion across manufacturing and logistics applications
Europe Industrial Display Market Share
The Europe industrial display industry is primarily led by well-established companies, including:
- Barco (Belgium)
- DATA MODUL (Germany)
- Zytronic (U.K.)
- Kontron (Austria)
- Beijer Electronics (Sweden)
- Pepperl+Fuchs (Germany)
- Q‑Lite (Netherlands)
- Riverdi (Poland)
- Texim Europe (Netherlands)
- Stone Technologies (U.K.)
- Bluestone Technology (U.K.)
- Phoenix Mecano (Switzerland)
- Dyna Scan (U.K.)
- AZ Display (Switzerland)
- TELEREX (Netherlands)
SKU-

- Interactive Data Analysis Dashboard
- Company Analysis Dashboard for high growth potential opportunities
- Research Analyst Access for customization & queries
- Competitor Analysis with Interactive dashboard
- Latest News, Updates & Trend analysis
- Harness the Power of Benchmark Analysis for Comprehensive Competitor Tracking
Europe Industrial Display Market, Supply Chain Analysis and Ecosystem Framework
To support market growth and help clients navigate the impact of geopolitical shifts, DBMR has integrated in-depth supply chain analysis into its Europe Industrial Display Market research reports. This addition empowers clients to respond effectively to global changes affecting their industries. The supply chain analysis section includes detailed insights such as Europe Industrial Display Market consumption and production by country, price trend analysis, the impact of tariffs and geopolitical developments, and import and export trends by country and HSN code. It also highlights major suppliers with data on production capacity and company profiles, as well as key importers and exporters. In addition to research, DBMR offers specialized supply chain consulting services backed by over a decade of experience, providing solutions like supplier discovery, supplier risk assessment, price trend analysis, impact evaluation of inflation and trade route changes, and comprehensive market trend analysis.
Data collection and base year analysis are done using data collection modules with large sample sizes. The stage includes obtaining market information or related data through various sources and strategies. It includes examining and planning all the data acquired from the past in advance. It likewise envelops the examination of information inconsistencies seen across different information sources. The market data is analysed and estimated using market statistical and coherent models. Also, market share analysis and key trend analysis are the major success factors in the market report. To know more, please request an analyst call or drop down your inquiry.
The key research methodology used by DBMR research team is data triangulation which involves data mining, analysis of the impact of data variables on the market and primary (industry expert) validation. Data models include Vendor Positioning Grid, Market Time Line Analysis, Market Overview and Guide, Company Positioning Grid, Patent Analysis, Pricing Analysis, Company Market Share Analysis, Standards of Measurement, Global versus Regional and Vendor Share Analysis. To know more about the research methodology, drop in an inquiry to speak to our industry experts.
Data Bridge Market Research is a leader in advanced formative research. We take pride in servicing our existing and new customers with data and analysis that match and suits their goal. The report can be customized to include price trend analysis of target brands understanding the market for additional countries (ask for the list of countries), clinical trial results data, literature review, refurbished market and product base analysis. Market analysis of target competitors can be analyzed from technology-based analysis to market portfolio strategies. We can add as many competitors that you require data about in the format and data style you are looking for. Our team of analysts can also provide you data in crude raw excel files pivot tables (Fact book) or can assist you in creating presentations from the data sets available in the report.


