
Europe Iron Ore Pellets Market
Market Size in USD Billion
 USD
13.11 Billion
USD
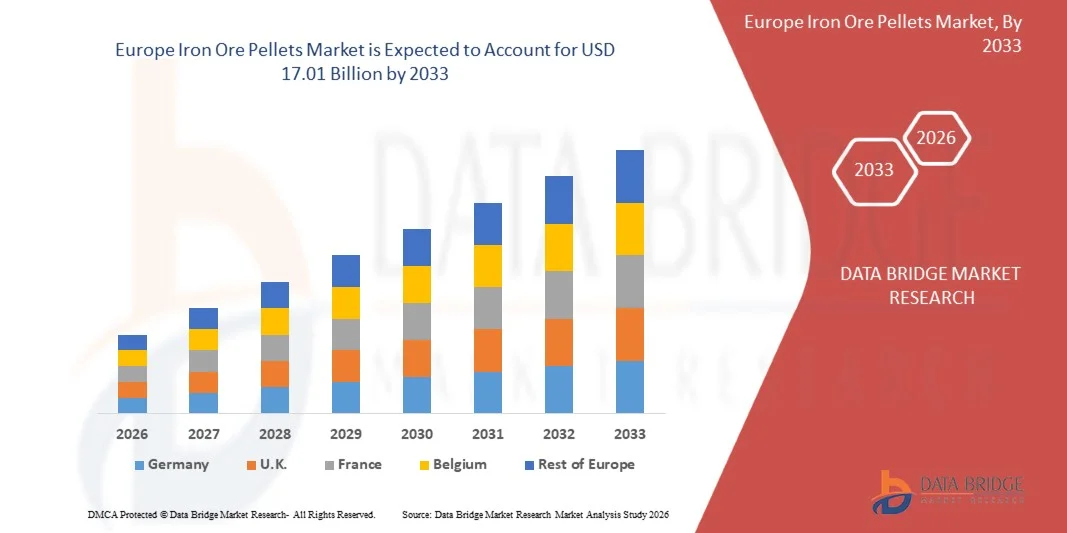
17.01 Billion
2025
2033
USD
13.11 Billion
USD
17.01 Billion
2025
2033
| 2026 - 2033 | |
| USD 13.11 Billion | |
| USD 17.01 Billion | |
| % | |
|
Europe Iron Ore Pellets Market Size
- The Europe Iron Ore Pellets Market size was valued at USD 13.11 billion in 2025 and is expected to reach USD 17.01 billion by 2033, at a CAGR of 3.3% during the forecast period
- The market growth is largely fueled by the increasing demand for high-quality raw materials in steelmaking, supported by rising global steel production across construction, automotive, and infrastructure projects. As steel producers seek consistent, energy-efficient, and high-performance inputs, iron ore pellets are gaining preference over traditional lump ore due to their superior metallurgical properties and reduced impurity levels, thereby strengthening overall market expansion
- Furthermore, the growing adoption of low-carbon and energy-efficient steelmaking technologies is significantly boosting the demand for iron ore pellets, which enable better furnace productivity and lower emissions compared with sinter-based processes. These converging factors are accelerating pellet consumption in both blast furnace and direct reduction routes, positioning pellets as a critical feedstock for modern steel production and driving substantial market growth
Europe Iron Ore Pellets Market Analysis
- Iron ore pellets, produced by agglomerating fine iron ore concentrates, are essential raw materials in steelmaking due to their uniform size, high iron content, and superior performance in both blast furnace and direct reduction processes. Their ability to enhance fuel efficiency, reduce emissions, and improve furnace stability makes them integral to modern steel manufacturing, especially as industries adopt more sustainable production practices
- The escalating demand for iron ore pellets is primarily driven by expanding steel capacities worldwide, increasing preference for high-grade feedstock, and global efforts to transition toward cleaner steelmaking technologies. As producers prioritize efficiency and environmental compliance, pellets play an increasingly important role in enabling consistent, cost-effective, and eco-friendly steel output
- Germany dominated the Europe Iron Ore Pellets Market in 2025, due to its strong steel production capacity, well-established industrial base, and adoption of high-quality pellet feed for blast furnace and direct reduction operations
- U.K. is expected to be the fastest growing country in the Europe Iron Ore Pellets Market during the forecast period due to modernization of steelmaking infrastructure and increasing focus on low-carbon and electric arc furnace (EAF) production routes
- Hematite segment dominated the market with a market share of 60.5% in 2025, due to its high availability, ease of mining, and lower processing cost compared with magnetite or taconite ores. Industries prefer hematite-based pellets because they offer higher iron content and reduce the energy required during pelletizing, yielding operational efficiency. The segment also benefits from the large-scale exploitation of hematite reserves, especially in countries with mature mining industries. Its widespread use in blast furnace operations further strengthens its position and makes it the preferred input material across steel manufacturers. Growing investments in hematite ore beneficiation plants continue to support production volumes and ensure stable supply for pellet manufacturers
Report Scope and Europe Iron Ore Pellets Market Segmentation
|
Attributes |
Iron Ore Pellets Key Market Insights |
|
Segments Covered |
|
|
Countries Covered |
Europe
|
|
Key Market Players |
|
|
Market Opportunities |
|
|
Value Added Data Infosets |
In addition to the insights on market scenarios such as market value, growth rate, segmentation, geographical coverage, and major players, the market reports curated by the Data Bridge Market Research also include import export analysis, production capacity overview, production consumption analysis, price trend analysis, climate change scenario, supply chain analysis, value chain analysis, raw material/consumables overview, vendor selection criteria, PESTLE Analysis, Porter Analysis, and regulatory framework. |
Europe Iron Ore Pellets Market Trends
“Adoption of Low-Carbon and Hydrogen-Based Steelmaking”
- A strong trend shaping the Europe Iron Ore Pellets Market is the accelerated adoption of low-carbon and hydrogen-based steelmaking technologies. As global steelmakers target deep decarbonization and compliance with climate mandates, demand for DR-grade iron ore pellets with high iron content and ultra-low impurities is surging, enabling direct reduction processes that use hydrogen as a reductant instead of coal
- For instance, steel producers such as ArcelorMittal and Vale S.A. have invested in hydrogen-ready pelletizing plants and fossil-free pellet innovations in Europe and Latin America. Their projects focus on high-purity feedstock to supply green steel facilities, achieving up to 95% reduction in carbon dioxide emissions compared to conventional blast furnace operations
- Ongoing innovations in pelletizing technology and process efficiency are facilitating the scale-up of fossil-free and renewable energy-based pellet production. These advancements support circular manufacturing, lower energy intensity, and compliance with stricter environmental standards in both mature and emerging markets
- The rising adoption of hydrogen-based steelmaking is being supported by policy incentives, infrastructure investment, and strategic partnerships across the steel value chain. Governments and industry consortia are backing demonstration projects to accelerate commercial readiness and reduce the carbon footprint of heavy industry
- In addition, growing use of automated process control and real-time analytics is optimizing pellet production, ensuring consistent quality, and supporting advanced steel applications such as in offshore wind turbine components and electric vehicles
- The overall industry shift toward low-carbon and hydrogen-based processes is elevating the status of premium DR-grade iron ore pellets. As the green transition intensifies, these pellets are expected to become central feedstock in next-generation steelmaking, redefining product standards and market growth for the sectors
Europe Iron Ore Pellets Market Dynamics
Driver
“Rising Demand for High-Grade Pellets in Steel Production”
- The increasing requirement for high-grade iron ore pellets in steel production acts as a major growth driver for the market. Pellets with higher Fe content and lower impurities enhance blast furnace and direct reduction process efficiency, delivering better yield, reduced energy consumption, and improved environmental performance
- For instance, Rio Tinto and Vale S.A. have expanded their pelletizing capacity to meet rising demand from steel makers, supporting rapid urbanization, infrastructure build-out, and automobile manufacturing. Their efforts also address the performance needs of specialty steel used in renewable energy and high-tech engineering sectors
- The shift from sinter and lump ore to high-grade pellets is driven by productivity gains, lower maintenance requirements, and environmental advantages such as reduced coke consumption and lower sulfur emissions. This transition is being further propelled by steelmakers' pursuit of resource optimization and carbon reduction strategies
- Growing investment in mega infrastructure projects, renewable energy installations, and advanced manufacturing is boosting demand for premium steel grades, amplifying the importance of pelletized iron ore as a core feedstock
- In addition, as emission regulations and environmental standards become more rigorous, the market for high-grade iron ore pellets is set to expand, supporting the dual goals of technological advancement and sustainable production within the steel industry
Restraint/Challenge
“Volatile Iron Ore Prices and Supply Uncertainty”
- Volatile iron ore prices and supply uncertainty present significant challenges for the Europe Iron Ore Pellets Market. Global price swings are influenced by trade tensions, resource nationalism, logistics bottlenecks, and sudden shifts in demand, disrupting long-term supply agreements and planning for steel producers
- For instance, companies such as LKAB and Cleveland-Cliffs have faced operational challenges due to iron ore price fluctuations and unpredictable supply from major producing regions such as Brazil and Australia. These factors have resulted in margin compression, higher input costs, and market instability for pellet producers and their downstream steel customers
- Supply disruptions due to adverse weather, infrastructure failures, or shifting export policies further aggravate availability issues, impacting production schedules and delivery reliability for large pelletizing operations
- In addition, the transition to low-carbon steelmaking and stricter ESG standards is increasing competition for premium-grade pellet feedstocks, amplifying supply risk across regions with limited pelletizing infrastructure
- Mitigating supply and price volatility will require robust risk management frameworks, strategic diversification of sourcing, long-term supplier partnerships, and flexible contract structures. Adoption of digital supply chain monitoring and price hedging tools will be key to supporting operational stability and securing growth for iron ore pellet producers in a dynamic market environment
Europe Iron Ore Pellets Market Scope
The market is segmented on the basis of source, grade, technology, pelletizing process, balling technology, application, and industry.
• By Source
On the basis of source, the Europe Iron Ore Pellets Market is segmented into hematite, magnetite, taconite, and others. The hematite segment dominated the market with the largest revenue share of 60.5% in 2025 due to its high availability, ease of mining, and lower processing cost compared with magnetite or taconite ores. Industries prefer hematite-based pellets because they offer higher iron content and reduce the energy required during pelletizing, yielding operational efficiency. The segment also benefits from the large-scale exploitation of hematite reserves, especially in countries with mature mining industries. Its widespread use in blast furnace operations further strengthens its position and makes it the preferred input material across steel manufacturers. Growing investments in hematite ore beneficiation plants continue to support production volumes and ensure stable supply for pellet manufacturers.
The magnetite segment is projected to witness the fastest growth rate from 2026 to 2033 driven by rising adoption in high-grade pellet production. Magnetite ore offers superior metallurgical performance due to its uniform composition, making it highly suitable for direct reduction applications. Its magnetic properties simplify separation and beneficiation processes, enhancing the overall yield and reducing waste. Demand has surged among steelmakers seeking low-impurity pellets that support energy-efficient steelmaking routes. Increasing preference for ultra-low emission production technologies is further promoting magnetite’s use. As global sustainability mandates strengthen, magnetite-based pellets are increasingly positioned as a premium choice for environmentally conscious steel producers.
• By Grade
On the basis of grade, the market is segmented into blast furnace and direct reduction pellets. The blast furnace grade segment dominated the market in 2025 due to its widespread adoption in traditional ironmaking facilities worldwide. These pellets offer high uniformity, strength, and thermal stability, ensuring efficient operations in large-volume blast furnaces. Steel manufacturers rely heavily on these pellets due to their ability to optimize fuel consumption and support continuous, stable smelting. Their well-established supply chain and cost-effective production enable consistent use across developing and mature markets. In addition, blast furnace pellets continue to be the preferred raw material in regions with legacy steelmaking infrastructure.
The direct reduction grade segment is expected to record the fastest CAGR from 2026 to 2033, driven by rising global preference for low-emission steelmaking processes. Direct reduction pellets offer higher iron content and lower impurities, making them ideal for electric arc furnace steel manufacturing. Increasing investments in green steel initiatives, hydrogen-based DRI plants, and environmentally friendly metallurgical technologies are accelerating their adoption. Markets are rapidly scaling DRI facilities, strengthening demand for this grade. With more countries transitioning toward carbon-neutral steel production pathways, direct reduction pellets are gaining strategic significance across the supply chain.
• By Technology
On the basis of technology, the market is categorized into oxygen-based/blast furnace, electric arc furnace, and electric induction furnace. The oxygen-based/blast furnace segment held the largest revenue share in 2025 due to its longstanding dominance in primary steelmaking. This method offers large-scale production capacity and compatibility with both sinter and pellet feed, ensuring operational flexibility. Steelmakers favor blast furnace technology as it supports high output volumes and established process control systems. Its widespread use keeps demand stable for pellets tailored to this technology. The continuing modernization of integrated steel plants further strengthens this segment’s dominance.
The electric arc furnace segment is projected to experience the fastest growth through 2033 driven by increasing adoption of recycled steel and low-carbon production technologies. EAF operations benefit significantly from direct reduction pellets, which enhance melting efficiency and reduce power consumption. Governments and manufacturers are prioritizing EAF installations to meet carbon reduction targets and improve sustainability metrics. The flexibility of EAFs to accommodate varying feedstock compositions further improves their appeal in modern steelmaking. Rapid industrialization and upgrades in mini-mills are supporting accelerated uptake of this technology globally.
• By Pelletizing Process
On the basis of pelletizing process, the market includes grate kiln and straight travelling grate systems. The straight travelling grate process dominated the market in 2025 due to its ability to handle large production volumes with consistent quality output. This method is preferred for hematite ore pelletizing because it ensures uniform heat treatment and superior mechanical strength of pellets. Large-scale pellet plants rely on this technology for its high efficiency, lower maintenance requirements, and continuous operation capability. The established presence of straight travelling grate installations in major mining hubs ensures steady adoption. Its proven reliability in large mining operations continues to drive market preference.
The grate kiln segment is expected to witness the highest growth rate through 2033 driven by its suitability for magnetite-based pellet production. This process ensures better temperature control, resulting in high-grade pellets with uniform metallurgical characteristics. Mining companies are increasingly adopting grate kiln systems due to their fuel flexibility and ability to achieve superior pellet quality. The technology’s adaptability to varying ore compositions makes it ideal for modern beneficiation plants. Growing investment in high-efficiency pelletizing infrastructure is advancing the popularity of grate kiln systems across emerging markets.
• By Balling Technology
On the basis of balling technology, market is divided into balling disc and balling drum. The balling drum segment dominated in 2025 owing to its suitability for large-scale pellet production and its ability to generate uniform green balls. Industries prefer balling drums due to their high throughput capacity and stability in handling varying feedstock moisture levels. Their robust design improves operational consistency and ensures smooth downstream processing. Large industrial pellet plants utilize drums to maintain continuous production, strengthening market demand. The technology’s long service life and reliability further support its strong market position.
The balling disc segment is poised to grow at the fastest rate from 2026 to 2033 due to its flexibility in adjusting pellet size and moisture control. Pellet manufacturers favor discs for producing high-quality green balls with precise size distribution, enhancing overall pellet integrity. Their modular design and easier maintenance requirements make them well-suited for new pelletizing facilities. Growing adoption of magnetite pellet plants is boosting disc-based balling due to better adaptability with fine concentrates. As producers shift toward advanced pellet quality specifications, balling discs are gaining wider acceptance.
• By Application
On the basis of application, the market is segmented into iron-based chemicals and steel production. The steel production segment dominated the market in 2025 due to the high requirement of iron ore pellets as a primary raw material in both blast furnace and direct reduction steelmaking. Global steel output growth across construction, automotive, and machinery industries continues to fuel demand. Pellets offer high efficiency, reduced energy usage, and improved furnace productivity, making them preferred over lump ore. Continuous investments in modern steel plants further reinforce dependence on pellets. Expanding infrastructure development globally ensures this segment’s long-term dominance.
The iron-based chemicals segment is expected to grow at the fastest pace through 2033 supported by increasing demand for high-purity iron compounds in water treatment, pigments, catalysts, and electronics. Iron ore pellets provide consistent iron content, making them suitable for chemical processing applications requiring controlled composition. Growing industrialization in emerging economies is driving the need for iron salts and specialty chemicals. Technological advancements in chemical synthesis processes are enabling wider use of pellet-derived intermediates. This segment’s growth is further stimulated by innovation in environmental chemicals and advanced materials.
• By Industry
On the basis of industry, the market includes construction, automotive, railway, consumer goods, shipping, industrial, aerospace, and others. The construction segment dominated the market in 2025 due to its large reliance on steel for structures, buildings, and infrastructure projects. Rapid urbanization and government-led development initiatives continue to create high steel demand globally. Pellets serve as a critical feedstock for producing construction-grade steel, ensuring consistent quality and efficient furnace operation. The segment benefits from expansion in residential, commercial, and transportation infrastructure. Its strong influence on global steel output sustains its leading position.
The automotive segment is projected to register the fastest growth through 2033 driven by rising demand for high-strength steel in vehicle manufacturing. Automakers increasingly rely on advanced steel grades to improve fuel efficiency, crash resistance, and overall structural performance. Iron ore pellets support production of these high-grade steels through DRI and EAF routes. Shifts toward electric vehicle manufacturing also require specialized steel alloys, further increasing pellet demand. As automotive production scales up, the segment continues to expand rapidly.
Europe Iron Ore Pellets Market Regional Analysis
- Germany dominated the Europe Iron Ore Pellets Market with the largest revenue share in 2025, driven by its strong steel production capacity, well-established industrial base, and adoption of high-quality pellet feed for blast furnace and direct reduction operations
- The country’s advanced metallurgical ecosystem and focus on low-emission, energy-efficient steelmaking have accelerated the use of high-grade and uniform iron ore pellets. A robust presence of leading domestic pellet manufacturers, ongoing R&D in pelletizing technology, and strong collaborations with international steelmakers further strengthen market expansion
- Germany’s commitment to improving production efficiency, reducing carbon emissions, and supporting sustainable steel operations reinforces its leadership position in the regional market
U.K. Europe Iron Ore Pellets Market Insight
The U.K. market is projected to register the fastest CAGR in the Europe Iron Ore Pellets Market during 2026–2033, fueled by modernization of steelmaking infrastructure and increasing focus on low-carbon and electric arc furnace (EAF) production routes. Rising adoption of direct reduction technologies, high-grade pellet feed, and efficient pelletizing processes is driving market demand. Supportive government initiatives promoting industrial sustainability, combined with strategic partnerships between domestic and international steel producers, are accelerating market growth. The U.K.’s emphasis on enhancing steel production efficiency, reducing emissions, and adopting innovative pellet feed solutions positions it as the fastest-growing market in the region.
France Europe Iron Ore Pellets Market Insight
France is expected to witness steady growth between 2026 and 2033, supported by expansion in steel, automotive, and construction sectors and increasing adoption of high-quality pellet feed in production facilities. The country’s focus on energy-efficient steelmaking and sustainable operations is driving demand for pellets that offer uniformity, high iron content, and improved furnace performance. Rising investments in modern pelletizing plants, coupled with strong government support for low-emission steel production, are improving adoption rates among domestic steelmakers. Collaborations between French manufacturers and international pellet suppliers further enhance technology integration and production efficiency. France’s commitment to sustainable steelmaking and operational optimization underpins its stable market outlook in the European region.
Europe Iron Ore Pellets Market Share
The iron ore pellets industry is primarily led by well-established companies, including:
- Vale (Brazil)
- Mitsubishi Corporation RtM Japan Ltd (Japan)
- Cleveland-Cliffs Inc (U.S.)
- United States Steel Corporation. (U.S.)
- ARCELORMITTAL (Luxembourg)
- Metso Outotec (Finland)
- KIOCL Limited (India)
- FERREXPO PLC (Switzerland)
- JINDAL SAW LTD. (India)
- Iron Ore Company of Canada (Canada)
- LKAB Koncernkontor (Sweden)
- METALLOINVEST MC LLC (Russia)
- Bahrain Steel (Bahrain)
- SIMEC (England)
Latest Developments in Europe Iron Ore Pellets Market
- In October 2023, Metso introduced a hydrogen-powered version of its Ferroflame LowNox burner for pelletizing plants, marking a significant advancement in low-emission pellet production technology. This burner replaces traditional fossil-fuel-based combustion systems by using hydrogen as a clean energy source, which substantially reduces carbon emissions during pellet induration. It is the first hydrogen-enabled burner specifically designed for travelling grate pelletizing plants, a configuration widely used in large pellet production facilities. By incorporating hydrogen, the innovation supports global decarbonization efforts and aligns with the steel sector’s move toward greener production pathways. The launch strengthens Metso’s leadership in sustainable pelletizing technologies and helps producers prepare for stricter environmental regulations
- In March 2023, Vale announced its plan to market its IOCJ (Iron Ore Concentrate and Pellet Feed) as pellet feed to focus more on higher-value products. This strategy enhances Vale’s competitiveness by emphasizing the supply of high-grade pellet feed materials that command premium pricing. By shifting toward a product portfolio centered on higher-purity iron ore, the company aims to align with steel mills that increasingly require cleaner and more efficient raw materials. This move reflects broader industry trends toward premium inputs that support low-emission steelmaking technologies. Through this strategic transition, Vale positions itself to capture more value in the evolving global iron ore market
- In February 2023, Fastmarkets launched two daily indices to track the spot price of high-grade 67.5% Fe pellet feed products on a CFR China basis. These indices include a premium index and an outright price index, introduced to improve transparency and consistency in pricing high-grade pellet feed materials. They provide a standardized benchmark that enables miners, traders, and steel manufacturers to settle transactions based on real-time and more accurate market movement. By offering reliable pricing references, the indices help enhance clarity in supply agreements and improve risk management for participants in the global pellet feed market. Their introduction supports the increasing importance of high-grade products within the iron ore industry
- In December 2022, Fastmarkets launched a weekly indicator tracking premiums for DR-grade iron ore pellets to give market participants better insights into pricing and sentiment. Published every Wednesday, the indicator provides a consistent reference point for negotiating long-term pellet supply contracts. The base price is linked to 65% Fe Brazil-origin fines, ensuring alignment with an established industry benchmark. This tool plays an important role in markets transitioning toward direct reduction technologies, particularly hydrogen-based DRI, where pellet quality and purity are crucial. The indicator helps industries adapt to changing production trends by offering clearer visibility into premium fluctuations
- In April 2022, Metso Outotec received an order to supply a compact-sized iron ore pellet plant in India, reflecting growing regional steel demand. The plant is designed using Metso’s advanced pelletizing technology known for improving energy efficiency, pellet quality, and overall sustainability. Its compact layout allows faster installation, reduced land usage, and lower initial investment, making it suitable for emerging steel manufacturers. The project supports India’s expanding steel capacity and showcases the country’s adoption of modern pelletizing infrastructure. With this order, Metso Outotec strengthens its presence in the Indian market while supporting more efficient and environmentally aligned pellet production
SKU-

- Interactive Data Analysis Dashboard
- Company Analysis Dashboard for high growth potential opportunities
- Research Analyst Access for customization & queries
- Competitor Analysis with Interactive dashboard
- Latest News, Updates & Trend analysis
- Harness the Power of Benchmark Analysis for Comprehensive Competitor Tracking
Europe Iron Ore Pellets Market, Supply Chain Analysis and Ecosystem Framework
To support market growth and help clients navigate the impact of geopolitical shifts, DBMR has integrated in-depth supply chain analysis into its Europe Iron Ore Pellets Market research reports. This addition empowers clients to respond effectively to global changes affecting their industries. The supply chain analysis section includes detailed insights such as Europe Iron Ore Pellets Market consumption and production by country, price trend analysis, the impact of tariffs and geopolitical developments, and import and export trends by country and HSN code. It also highlights major suppliers with data on production capacity and company profiles, as well as key importers and exporters. In addition to research, DBMR offers specialized supply chain consulting services backed by over a decade of experience, providing solutions like supplier discovery, supplier risk assessment, price trend analysis, impact evaluation of inflation and trade route changes, and comprehensive market trend analysis.
Data collection and base year analysis are done using data collection modules with large sample sizes. The stage includes obtaining market information or related data through various sources and strategies. It includes examining and planning all the data acquired from the past in advance. It likewise envelops the examination of information inconsistencies seen across different information sources. The market data is analysed and estimated using market statistical and coherent models. Also, market share analysis and key trend analysis are the major success factors in the market report. To know more, please request an analyst call or drop down your inquiry.
The key research methodology used by DBMR research team is data triangulation which involves data mining, analysis of the impact of data variables on the market and primary (industry expert) validation. Data models include Vendor Positioning Grid, Market Time Line Analysis, Market Overview and Guide, Company Positioning Grid, Patent Analysis, Pricing Analysis, Company Market Share Analysis, Standards of Measurement, Global versus Regional and Vendor Share Analysis. To know more about the research methodology, drop in an inquiry to speak to our industry experts.
Data Bridge Market Research is a leader in advanced formative research. We take pride in servicing our existing and new customers with data and analysis that match and suits their goal. The report can be customized to include price trend analysis of target brands understanding the market for additional countries (ask for the list of countries), clinical trial results data, literature review, refurbished market and product base analysis. Market analysis of target competitors can be analyzed from technology-based analysis to market portfolio strategies. We can add as many competitors that you require data about in the format and data style you are looking for. Our team of analysts can also provide you data in crude raw excel files pivot tables (Fact book) or can assist you in creating presentations from the data sets available in the report.


