
Europe Low Carb Diet Market
Market Size in USD Billion
 USD
4.18 Billion
USD
6.50 Billion
2024
2032
USD
4.18 Billion
USD
6.50 Billion
2024
2032
| 2025 - 2032 | |
| USD 4.18 Billion | |
| USD 6.50 Billion | |
| % | |
|
Low Carb Diet Market Analysis
The Europe low-carb diet market is witnessing significant growth, primarily driven by rising consumer awareness about the health benefits associated with low-carb diets. These diets, characterized by reduced carbohydrate intake and increased consumption of proteins and healthy fats, are increasingly recognized for their role in promoting weight loss, improving metabolic health, and reducing the risk of chronic diseases such as diabetes and cardiovascular disorders. As consumers become more health-conscious and proactive in managing their well-being, the demand for low-carb food and beverage products has surged.
Governments, healthcare organizations, and wellness influencers are actively promoting the adoption of healthier dietary habits, further amplifying consumer interest in low-carb options. Social media and digital platforms have played a significant role in spreading awareness, enabling access to information about the benefits and scientific validation of such diets.
Low Carb Diet Market Size
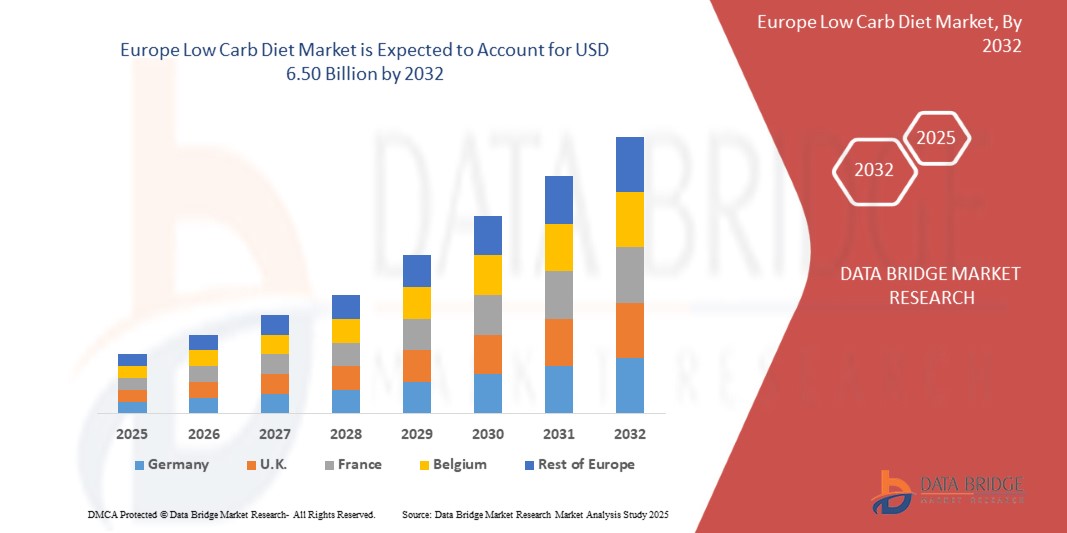
The Europe low carb diet market is expected to reach USD 6.50 billion by 2032 from USD 4.18 billion in 2024, growing with a substantial CAGR of 5.70% in the forecast period of 2025 to 2032. In addition to the insights on market scenarios such as market value, growth rate, segmentation, geographical coverage, and major players, the market reports curated by the Data Bridge Market Research also include import export analysis, production capacity overview, production consumption analysis, price trend analysis, climate change scenario, supply chain analysis, value chain analysis, raw material/consumables overview, vendor selection criteria, PESTLE Analysis, Porter Analysis, and regulatory framework.
Low Carb Diet Market Trends
“Increasing Consumer Awareness About the Health Benefits of Low-Carb Diets”
The Europe low-carb diet market is witnessing significant growth, primarily driven by rising consumer awareness about the health benefits associated with low-carb diets. These diets, characterized by reduced carbohydrate intake and increased consumption of proteins and healthy fats, are increasingly recognized for their role in promoting weight loss, improving metabolic health, and reducing the risk of chronic diseases such as diabetes and cardiovascular disorders. As consumers become more health-conscious and proactive in managing their well-being, the demand for low-carb food and beverage products has surged.
Governments, healthcare organizations, and wellness influencers are actively promoting the adoption of healthier dietary habits, further amplifying consumer interest in low-carb options. Social media and digital platforms have played a significant role in spreading awareness, enabling access to information about the benefits and scientific validation of such diets.
Report Scope and Low Carb Diet Market Segmentation
|
Attributes |
Low Carb Diet Market Insights |
|
Segments Covered |
|
|
Countries Covered |
U.K., France, Germany, Spain, Italy, Netherlands, Luxemburg, Turkey, Belgium, Russia, Switzerland, and Rest of Europe |
|
Key Market Players |
Nestlé (Switzerland), Conagra (U.S.), Kerry Group (Ireland), GCMMF (India), Blommer Chocolate Company. (U.S.), Livivafoods.com (Canada), HighKey (U.S.), Bariatrix Europe (France), Al Dente (U.S.), KAIZEN FOOD (U.S.), GOALZ (U.S.), Justine's Cookies (New Zealand), Sweetlifeasia.com (Singapore), Lo! Food (India), Ample Foods (U.S.), Dietrich Borggreve Zwieback & Keksfabrik KG (Germany), Carbe Diem (U.S.), and Hungry Bums (India) |
|
Market Opportunities |
|
|
Value Added Data Infosets |
In addition to the insights on market scenarios such as market value, growth rate, segmentation, geographical coverage, and major players, the market reports curated by the Data Bridge Market Research also include import export analysis, production capacity overview, production consumption analysis, price trend analysis, climate change scenario, supply chain analysis, value chain analysis, raw material/consumables overview, vendor selection criteria, PESTLE Analysis, Porter Analysis, and regulatory framework. |
Low Carb Diet Market Definition
A Low Carb Diet is a dietary approach that restricts carbohydrate intake, typically emphasizing the consumption of proteins, healthy fats, and non-starchy vegetables. It aims to reduce the intake of foods high in sugars and starches, such as bread, pasta, rice, and sugary snacks, to promote weight loss, improve metabolic health, and support specific health conditions like diabetes. Low-carb diets can vary in strictness, ranging from moderate carbohydrate restriction to very low-carb or ketogenic diets.
Low Carb Diet Market Dynamics
Drivers
- Increasing Consumer Awareness About The Health Benefits of Low-Carb Diets
The Europe low-carb diet market is witnessing significant growth, primarily driven by rising consumer awareness about the health benefits associated with low-carb diets. These diets, characterized by reduced carbohydrate intake and increased consumption of proteins and healthy fats, are increasingly recognized for their role in promoting weight loss, improving metabolic health, and reducing the risk of chronic diseases such as diabetes and cardiovascular disorders. As consumers become more health-conscious and proactive in managing their well-being, the demand for low-carb food and beverage products has surged. Governments, healthcare organizations, and wellness influencers are actively promoting the adoption of healthier dietary habits, further amplifying consumer interest in low-carb options. Social media and digital platforms have played a significant role in spreading awareness, enabling access to information about the benefits and scientific validation of such diets.
For instance,
In May 2023, according to an article by Apollo Hospitals Group, A low-carb diet limits carbohydrate intake, focusing on proteins and fats. This approach can aid weight loss by prompting the body to burn stored fat for energy. Additionally, it helps regulate blood sugar and blood pressure, increases HDL (good cholesterol), and decreases triglycerides.
- Growing Prevalence of Obesity and Diabetes
The Europe low-carb diet market is expanding rapidly, driven in large part by the rising prevalence of obesity and diabetes worldwide. These conditions have reached epidemic proportions, with the World Health Organization (WHO) reporting over 650 million obese adults and more than 500 million people living with diabetes. These alarming statistics have heightened awareness about the importance of dietary interventions to manage weight and blood sugar levels, making low-carb diets an appealing solution.
Low-carb diets are designed to reduce carbohydrate intake while increasing the consumption of proteins and healthy fats. This dietary approach is linked to improved metabolic health, reduced insulin resistance, and effective weight management, addressing key concerns for individuals with obesity or diabetes. By promoting the use of fat as the body’s primary energy source, low-carb diets help regulate blood sugar levels and facilitate sustained weight loss, further enhancing their popularity.
For instance,
In March 2024, according to WHO, obesity has nearly tripled since 1975, with over 650 million adults worldwide classified as obese. This alarming trend has spurred interest in low-carb diets, which help manage weight and associated health risks, driving demand for innovative, health-focused products in the Europe low-carb diet market
Opportunities
- Development of Innovative Food Processing Techniques to Enhance The Taste, Texture, and Nutritional Profile of Low-Carb Products
The development of innovative food processing techniques offers significant opportunities for the Europe low-carb diet market. Advances in food science are enhancing the taste, texture, and nutritional profile of low-carb products, addressing consumer demand for healthier yet satisfying options. techniques such as enzyme modification and plant-based fiber incorporation are being used to create low-carb bread and baked goods with improved softness and flavor, making them comparable to traditional carbohydrate-rich counterparts.
Additionally, extrusion technologies are enabling the production of low-carb snacks with crunchy textures, while advanced sugar alternatives, such as monk fruit extract and allulose, mimic the sweetness of sugar without the carbs. These innovations not only improve sensory appeal but also broaden the variety of low-carb products available, catering to diverse consumer preferences.
For instance,
In February 2021, according to an article by NCBI, Innovative food processing techniques such as texture modification, nutrient fortification, and advanced fermentation methods are revolutionizing plant-based and low-carb food markets. These approaches improve taste and nutritional quality, making low-carb products more appealing.
- The Rise of E-Commerce Platforms Allows Easy Access to a Variety of Low-Carb Products
The rise of e-commerce platforms has significantly enhanced opportunities for the Europe low-carb diet market. These platforms provide consumers with easy access to a wide variety of low-carb products, ranging from keto-friendly snacks to sugar-free beverages. The convenience of online shopping eliminates geographical barriers, allowing brands to reach diverse audiences, including those in remote areas.
E-commerce platforms also empower smaller brands to enter the market without substantial overhead costs associated with physical stores. Through direct-to-consumer models, companies can showcase niche low-carb products and effectively engage with health-conscious customers. Additionally, online marketplaces enable detailed product descriptions, nutritional information, and customer reviews, fostering transparency and trust.
For instance,
In September 2024, according to an article by Ginni Systems Limited, the rise of e-commerce platforms is transforming the market for low-carb products, offering diverse options with unmatched accessibility. Brands use online channels to directly reach consumers, offering convenience and competitive pricing. Insights from D2C trends reveal that the synergy between online and offline strategies enhances consumer engagement
Restraints/Challenges
- High Cost of Low-Carb Products
The high cost of low-carb products acts as a significant restraint on the growth of the Europe low-carb diet market. While these products cater to health-conscious consumers seeking effective weight management solutions, their premium pricing makes them inaccessible to a broad segment of the population, particularly in price-sensitive markets.
The elevated cost of low-carb products is driven by several factors. First, the use of high-quality, nutrient-rich ingredients like almond flour, coconut oil, grass-fed meats, and organic vegetables contributes to their higher production costs. Additionally, the manufacturing processes for specialized low-carb foods, such as keto-friendly snacks and sugar-free desserts, often involve advanced technology and research, further driving up expenses. These factors result in prices significantly higher than those of conventional food products.
For instance,
In November 2023, according to an article by NCBI, The high cost of low-carb products, especially those relying on ultra-processed foods (UPF), can limit accessibility for a wide range of consumers. Specialty products, designed for ketogenic and vegan diets, tend to be more expensive due to the use of premium ingredients and advanced processing techniques. This makes low-carb diets less affordable, particularly for low- and middle-income populations.
- Intense Competition Among Brands and Lack of Standardization in Product Offerings
The Europe low-carb diet market faces significant restraints due to intense competition among brands and the lack of standardization in product offerings. The rapid proliferation of companies introducing low-carb food and beverage products has resulted in a highly competitive environment. While competition drives innovation, it also creates challenges for smaller or newer brands to establish a foothold in the market. Larger players with established resources dominate shelf space, advertising channels, and consumer trust, making it difficult for others to compete effectively.
For instance,
In October 2024, according to a blog by Continental Hospitals, Packaged foods often contain hidden sugars and carbohydrates, even in "sugar-free" or "low-fat" products. These added sugars enhance flavor but can worsen diabetes and contribute to obesity and heart disease. Identifying sugars by reading labels and recognizing alternative names helps make healthier choices. Reducing hidden sugar and carb intake supports better diabetes management, highlighting the importance of careful food selection and awareness of deceptive marketing practices. Hidden sugars and carbohydrates in packaged foods create a restraint in the Low Carb Diet Market by complicating consumer efforts to identify compliant products, undermining trust and adherence to dietary guidelines
Impact and Current Market Scenario of Raw Material Shortage and Shipping Delays
Data Bridge Market Research offers a high-level analysis of the market and delivers information by keeping in account the impact and current market environment of raw material shortage and shipping delays. This translates into assessing strategic possibilities, creating effective action plans, and assisting businesses in making important decisions.
Apart from the standard report, we also offer in-depth analysis of the procurement level from forecasted shipping delays, distributor mapping by region, commodity analysis, production analysis, price mapping trends, sourcing, category performance analysis, supply chain risk management solutions, advanced benchmarking, and other services for procurement and strategic support.
Expected Impact of Economic Slowdown on the Pricing and Availability of Products
When economic activity slows, industries begin to suffer. The forecasted effects of the economic downturn on the pricing and accessibility of the products are taken into account in the market insight reports and intelligence services provided by DBMR. With this, our clients can typically keep one step ahead of their competitors, project their sales and revenue, and estimate their profit and loss expenditures.
Low Carb Diet Market Scope
The market is segmented on the basis of product, sole component, sole product, Applications. And Geography. The growth amongst these segments will help you analyze meagre growth segments in the industries and provide the users with a valuable market overview and market insights to help them make strategic decisions for identifying core market applications.
Product
- Bakery
- Pasta and Noodles
- Ice Creams
- Frozen RTE
- Flour
- Sugar Confectionery
- Others
Distribution Channel
- Store-Based and
- Non-Store Based
Low Carb Diet Market Regional Analysis
The market is analyzed and market size insights and trends are provided by country, product, and distribution channel as referenced above.
The countries covered in the market are U.K., France, Germany, Spain, Italy, Netherlands, Luxemburg, Turkey, Belgium, Russia, Switzerland, and rest of Europe.
Germany is expected to dominate the Europe low carb diet market due to high health awareness, rising prevalence of obesity and diabetes, and a strong consumer demand for personalized nutrition solutions.
Germany is expected to be the fastest-growing market for the low carb diet market. This growth is driven by increasing health awareness, rising disposable incomes, and a growing prevalence of lifestyle-related diseases such as obesity and diabetes.
The country section of the report also provides individual market impacting factors and changes in regulation in the market domestically that impacts the current and future trends of the market. Data points like down-stream and upstream value chain analysis, technical trends and porter's five forces analysis, case studies are some of the pointers used to forecast the market scenario for individual countries. Also, the presence and availability of Europe brands and their challenges faced due to large or scarce competition from local and domestic brands, impact of domestic tariffs and trade routes are considered while providing forecast analysis of the country data.
Low Carb Diet Market Share
The market competitive landscape provides details by competitors. Details included are company overview, company financials, revenue generated, market potential, investment in research and development, new market initiatives, Europe presence, production sites and facilities, production capacities, company strengths and weaknesses, product launch, product width and breadth, application dominance. The above data points provided are only related to the companies' focus related to market.
Low Carb Diet Market Leaders Operating in the Market Are:
- Nestlé (Switzerland)
- Conagra (U.S.)
- Kerry Group (Ireland)
- GCMMF (India)
- Blommer Chocolate Company. (U.S.)
- Livivafoods.com (Canada)
- HighKey (U.S.)
- Bariatrix Europe (France)
- Al Dente (U.S.)
- KAIZEN FOOD (U.S.)
- GOALZ (U.S.)
- Justine's Cookies (New Zealand)
- Sweetlifeasia.com (Singapore)
- Lo! Food (India)
- Ample Foods (U.S.)
- Dietrich Borggreve Zwieback & Keksfabrik KG (Germany)
- Carbe Diem (U.S.)
- Hungry Bums (India)
Latest Developments in Low Carb Diet Market
- In June 2024, Blommer Chocolate launched its new product line, Elevate, offering an innovative, cost-effective alternative to traditional cocoa butter. Developed with Cocoa Butter Equivalent (CBE) technology, Elevate delivers superior texture, flavor, and bloom resistance, providing a sustainable solution for chocolatiers and confectioners amidst rising cocoa prices
- In May 2022, Blommer Chocolate Company, in collaboration with DouxMatok, expanded its Discovery product line, offering sugar-reduced chocolate coatings with up to 50% less sugar, without using high-intensity sweeteners or sugar alcohols. This innovation aims to meet growing consumer demand for better-tasting, healthier chocolate options in applications like panning, enrobing, and molding
SKU-

- Interactive Data Analysis Dashboard
- Company Analysis Dashboard for high growth potential opportunities
- Research Analyst Access for customization & queries
- Competitor Analysis with Interactive dashboard
- Latest News, Updates & Trend analysis
- Harness the Power of Benchmark Analysis for Comprehensive Competitor Tracking
Table of Content
1 INTRODUCTION
1.1 OBJECTIVES OF THE STUDY
1.2 MARKET DEFINITION
1.3 OVERVIEW
1.4 LIMITATIONS
1.5 MARKETS COVERED
2 MARKET SEGMENTATION
2.1 MARKETS COVERED
2.2 GEOGRAPHICAL SCOPE
2.3 YEARS CONSIDERED FOR THE STUDY
2.4 CURRENCY AND PRICING
2.5 DBMR TRIPOD DATA VALIDATION MODEL
2.6 MULTIVARIATE MODELING
2.7 PRIMARY INTERVIEWS WITH KEY OPINION LEADERS
2.8 DBMR MARKET POSITION GRID
2.9 DBMR VENDOR SHARE ANALYSIS
2.1 SECONDARY SOURCES
2.11 ASSUMPTIONS
3 EXECUTIVE SUMMARY
4 PREMIUM INSIGHTS
4.1 IMPORT EXPORT SCENARIO
4.2 PRICING ANALYSIS
4.3 PRODUCTION CAPACITY OF KEY MANUFACTURERS
4.4 7C ANALYSIS
4.4.1 CUSTOMER
4.4.2 CONSISTENCY
4.4.3 CREATIVITY
4.4.4 CULTURE
4.4.5 COMMUNICATION
4.4.6 CHANGE
4.4.7 CHANNEL
4.4.8 CONCLUSION
4.5 7P ANALYSIS
4.5.1 PRODUCT
4.5.2 PRICE
4.5.3 PROMOTION
4.5.4 PLACE
4.5.5 PEOPLE
4.5.6 PACKAGING
4.5.7 PROCESS
4.5.8 CONCLUSION
4.6 BRAND OUTLOOK
4.7 CONSUMER DISPOSABLE INCOME DYNAMICS AND SPEND DYNAMICS
4.7.1 INTRODUCTION
4.7.2 CONSUMER DISPOSABLE INCOME DYNAMICS
4.7.3 SPEND DYNAMICS IN THE LOW-CARB DIET MARKET
4.7.4 CONCLUSION
4.8 FACTORS INFLUENCING PURCHASING DECISION
4.8.1 1HEALTH CONSCIOUSNESS AND FITNESS TRENDS
4.8.2 MARKETING AND PRODUCT POSITIONING
4.8.3 TASTE AND PRODUCT INNOVATION
4.8.4 PRICE SENSITIVITY AND ECONOMIC FACTORS
4.8.5 AVAILABILITY AND CONVENIENCE
4.8.6 SOCIAL AND CULTURAL INFLUENCES
4.8.7 CONCLUSION
4.9 GTM MARKETING ANALYSIS
4.9.1 MARKET SIZE
4.9.2 GROWTH POTENTIAL
4.9.3 TRENDS
4.9.4 CUSTOMER ANALYSIS
4.9.5 PRODUCT-MARKET FIT
4.9.6 COMPETITION AND DEMAND
4.9.7 CONCLUSION
4.1 INDUSTRY TRENDS AND FUTURE PERSPECTIVES
4.10.1 KEY TRENDS IN THE LOW-CARB DIET MARKET
4.10.2 FUTURE PERSPECTIVES OF THE LOW-CARB DIET MARKET
4.10.3 CONCLUSION
4.11 LIFESTYLE CURVE ANALYSIS
4.11.1 INTRODUCTION PHASE
4.11.2 GROWTH PHASE
4.11.3 MATURITY PHASE
4.11.4 POSSIBLE DECLINE OR INNOVATION
4.12 NEW PRODUCT LAUNCH STRATEGY
4.12.1 LINE EXTENSION STRATEGY
4.12.2 NEW PACKAGING
4.12.3 RE-LAUNCH STRATEGY
4.12.4 NEW FORMULATION
4.12.5 CONCLUSION
4.13 PRIVATE LABEL VS BRAND ANALYSIS
4.14 PROMOTIONAL ACTIVITIES
4.14.1 DIGITAL MARKETING AND SOCIAL MEDIA CAMPAIGNS
4.14.2 CONTENT MARKETING AND EDUCATIONAL INITIATIVES
4.14.3 PRODUCT SAMPLING AND FREE TRIALS
4.14.4 DISCOUNTS, PROMOTIONS, AND LOYALTY PROGRAMS
4.14.5 STRATEGIC PARTNERSHIPS AND SPONSORSHIPS
4.14.6 CELEBRITY ENDORSEMENTS AND MEDIA EXPOSURE
4.14.7 RETAIL AND IN-STORE PROMOTIONS
4.14.8 CONCLUSION
4.15 SUPPLY CHAIN ANALYSIS
4.15.1 OVERVIEW
4.15.2 LOGISTIC COST SCENARIO
4.15.3 IMPORTANCE OF LOGISTICS SERVICE PROVIDERS
5 REGULATORY COVERAGE
6 MARKET OVERVIEW
6.1 DRIVERS
6.1.1 INCREASING CONSUMER AWARENESS ABOUT THE HEALTH BENEFITS OF LOW-CARB DIETS
6.1.2 GROWING PREVALENCE OF OBESITY AND DIABETES
6.1.3 GROWING ADOPTION OF KETO AND OTHER LOW-CARB DIETS
6.1.4 HIGHER PURCHASING POWER ENABLING CONSUMERS TO BUY PREMIUM LOW-CARB AND HEALTH-FOCUSED PRODUCTS
6.2 RESTRAINTS
6.2.1 HIGH COST OF LOW-CARB PRODUCTS
6.2.2 INTENSE COMPETITION AMONG BRANDS AND LACK OF STANDARDIZATION IN PRODUCT OFFERINGS
6.3 OPPORTUNITIES
6.3.1 DEVELOPMENT OF INNOVATIVE FOOD PROCESSING TECHNIQUES TO ENHANCE THE TASTE, TEXTURE, AND NUTRITIONAL PROFILE OF LOW-CARB PRODUCTS
6.3.2 THE RISE OF E-COMMERCE PLATFORMS ALLOWS EASY ACCESS TO A VARIETY OF LOW-CARB PRODUCTS
6.3.3 INTEGRATION OF PERSONALIZED DIET PLANS AND LOW-CARB OPTIONS
6.4 CHALLENGES
6.4.1 COMPETITION FROM ALTERNATIVE DIET TRENDS
6.4.2 VARIATIONS IN FOOD LABELING AND DIETARY GUIDELINES ACROSS REGIONS
7 EUROPE LOW CARB DIET MARKET, BY PRODUCT
7.1 OVERVIEW
7.2 BAKERY
7.3 PASTE AND NOODLES
7.4 ICE CREAMS
7.5 FROZEN RTE
7.6 FLOUR
7.7 SUGAR CONFECTIONERY
7.8 OTHERS
8 EUROPE LOW CARB DIET MARKET, BY DISTRIBUTION CHANNEL
8.1 OVERVIEW
8.2 STORE-BASED
8.3 NON-STORE BASED
9 EUROPE LOW CARB DIET MARKET, BY REGION
9.1 EUROPE
9.1.1 U.K.
9.1.2 FRANCE
9.1.3 GERMANY
9.1.4 SPAIN
9.1.5 ITALY
9.1.6 NETHERLANDS
9.1.7 LUXEMBURG
9.1.8 TURKEY
9.1.9 BELGIUM
9.1.10 RUSSIA
9.1.11 SWITZERLAND
9.1.12 REST OF EUROPE
10 EUROPE LOW CARB DIET MARKET: COMPANY LANDSCAPE
10.1 COMPANY SHARE ANALYSIS: EUROPE
11 SWOT ANALYSIS
12 COMPANY PROFILE
12.1 NESTLÉ
12.1.1 COMPANY SNAPSHOT
12.1.2 REVENUE ANALYSIS
12.1.3 4P ANALYSIS
12.1.4 COMPANY SHARE ANALYSIS
12.1.5 PRODUCT PORTFOLIO
12.1.6 RECENT DEVELOPMENT
12.2 CONAGRA BRANDS
12.2.1 COMPANY SNAPSHOT
12.2.2 REVENUE ANALYSIS
12.2.3 4P ANALYSIS
12.2.4 COMPANY SHARE ANALYSIS
12.2.5 PRODUCT PORTFOLIO
12.2.6 RECENT DEVELOPMENT
12.3 KERRY GROUP PLC
12.3.1 COMPANY SNAPSHOT
12.3.2 REVENUE ANALYSIS
12.3.3 4P ANALYSIS
12.3.4 COMPANY SHARE ANALYSIS
12.3.5 PRODUCT PORTFOLIO
12.3.6 RECENT DEVELOPMENT
12.4 GCMMF
12.4.1 COMPANY SNAPSHOT
12.4.2 4P ANALYSIS
12.4.3 COMPANY SHARE ANALYSIS
12.4.4 PRODUCT PORTFOLIO
12.4.5 RECENT DEVELOPMENT
12.5 BLOMMER CHOCOLATE COMPANY
12.5.1 COMPANY SNAPSHOT
12.5.2 4P ANALYSIS
12.5.3 COMPANY SHARE ANALYSIS
12.5.4 PRODUCT PORTFOLIO
12.5.5 RECENT DEVELOPMENTS
12.6 AL DENTE
12.6.1 COMPANY SNAPSHOT
12.6.2 4P ANALYSIS
12.6.3 PRODUCT PORTFOLIO
12.6.4 RECENT DEVELOPMENT
12.7 AMPLE FOODS
12.7.1 COMPANY SNAPSHOT
12.7.2 4P ANALYSIS
12.7.3 PRODUCT PORTFOLIO
12.7.4 RECENT DEVELOPMENT
12.8 BARIATRIX EUROPE
12.8.1 COMPANY SNAPSHOT
12.8.2 4P ANALYSIS
12.8.3 PRODUCT PORTFOLIO
12.8.4 RECENT DEVELOPMENT
12.9 CARBE DIEM
12.9.1 COMPANY SNAPSHOT
12.9.2 4P ANALYSIS
12.9.3 PRODUCT PORTFOLIO
12.9.4 RECENT DEVELOPMENT
12.1 DIETRICH BORGGREVE ZWIEBACK & KEKSFABRIK KG
12.10.1 COMPANY SNAPSHOT
12.10.2 4P ANALYSIS
12.10.3 PRODUCT PORTFOLIO
12.10.4 RECENT DEVELOPMENT
12.11 GOALZ
12.11.1 COMPANY SNAPSHOT
12.11.2 4P ANALYSIS
12.11.3 PRODUCT PORTFOLIO
12.11.4 RECENT DEVELOPMENT
12.12 HIGHKEY
12.12.1 COMPANY SNAPSHOT
12.12.2 4P ANALYSIS
12.12.3 PRODUCT PORTFOLIO
12.12.4 RECENT DEVELOPMENT
12.13 HUNGRY BUMS
12.13.1 COMPANY SNAPSHOT
12.13.2 4P ANALYSIS
12.13.3 PRODUCT PORTFOLIO
12.13.4 RECENT DEVELOPMENT
12.14 JUSTINE'S COOKIES
12.14.1 COMPANY SNAPSHOT
12.14.2 4P ANALYSIS
12.14.3 PRODUCT PORTFOLIO
12.14.4 RECENT DEVELOPMENT
12.15 KAIZEN FOOD COMPANY
12.15.1 COMPANY SNAPSHOT
12.15.2 4P ANALYSIS
12.15.3 PRODUCT PORTFOLIO
12.15.4 RECENT DEVELOPMENT
12.16 LIVIVAFOODS.COM
12.16.1 COMPANY SNAPSHOT
12.16.2 4P ANALYSIS
12.16.3 PRODUCT PORTFOLIO
12.16.4 RECENT DEVELOPMENT
12.17 LO! FOOD
12.17.1 COMPANY SNAPSHOT
12.17.2 4P ANALYSIS
12.17.3 PRODUCT PORTFOLIO
12.17.4 RECENT DEVELOPMENT
12.18 SWEETLIFEASIA.COM
12.18.1 COMPANY SNAPSHOT
12.18.2 4P ANALYSIS
12.18.3 PRODUCT PORTFOLIO
12.18.4 RECENT DEVELOPMENT
13 QUESTIONNAIRE
14 RELATED REPORTS
List of Table
TABLE 1 ESTIMATED PRODUCTION CAPACITY OF KEY MANUFACTURERS
TABLE 2 REGULATORY COVERAGE
TABLE 3 EUROPE LOW CARB DIET MARKET, BY PRODUCT, 2018-2032 (USD THOUSAND)
TABLE 4 EUROPE LOW CARB DIET MARKET, BY PRODUCT, 2018-2032 (THOUSAND UNITS)
TABLE 5 EUROPE BAKERY IN LOW CARB DIET MARKET, BY REGION, 2018-2032 (USD THOUSAND)
TABLE 6 EUROPE BAKERY IN LOW CARB DIET MARKET, BY REGION, 2018-2032 (THOUSAND UNITS)
TABLE 7 EUROPE BAKERY IN LOW CARB DIET MARKET, BY PRODUCT, 2018-2032 (USD THOUSAND)
TABLE 8 EUROPE BREAD AND ROLLS IN LOW CARB DIET MARKET, BY TYPE, 2018-2032 (USD THOUSAND)
TABLE 9 EUROPE BREAD AND ROLLS IN LOW CARB DIET MARKET, BY CATEGORY, 2018-2032 (USD THOUSAND)
TABLE 10 EUROPE COOKIES IN LOW CARB DIET MARKET, BY TYPE, 2018-2032 (USD THOUSAND)
TABLE 11 EUROPE COOKIES IN LOW CARB DIET MARKET, BY FLAVOR, 2018-2032 (USD THOUSAND)
TABLE 12 EUROPE CAKES AND DESSERTS IN LOW CARB DIET MARKET, BY CATEGORY, 2018-2032 (USD THOUSAND)
TABLE 13 EUROPE PASTA AND NOODLES IN LOW CARB DIET MARKET, BY REGION, 2018-2032 (USD THOUSAND)
TABLE 14 EUROPE PASTA AND NOODLES IN LOW CARB DIET MARKET, BY REGION, 2018-2032 (THOUSAND UNITS)
TABLE 15 EUROPE PASTE AND NOODLES IN LOW CARB DIET MARKET, BY TYPE, 2018-2032 (USD THOUSAND)
TABLE 16 EUROPE FRESH/UNCOOKED PASTA IN LOW CARB DIET MARKET, BY TYPE, 2018-2032 (USD THOUSAND)
TABLE 17 EUROPE NOODLES IN LOW CARB DIET MARKET, BY TYPE, 2018-2032 (USD THOUSAND)
TABLE 18 EUROPE ICE CREAMS IN LOW CARB DIET MARKET, BY REGION, 2018-2032 (USD THOUSAND)
TABLE 19 EUROPE ICE CREAMS IN LOW CARB DIET MARKET, BY REGION, 2018-2032 (THOUSAND UNITS)
TABLE 20 EUROPE ICE CREAMS IN LOW CARB DIET MARKET, BY TYPE, 2018-2032 (USD THOUSAND)
TABLE 21 EUROPE FROZEN RTE IN LOW CARB DIET MARKET, BY REGION, 2018-2032 (USD THOUSAND)
TABLE 22 EUROPE FROZEN RTE IN LOW CARB DIET MARKET, BY REGION, 2018-2032 (THOUSAND UNITS)
TABLE 23 EUROPE FROZEN RTE IN LOW CARB DIET MARKET, BY TYPE, 2018-2032 (USD THOUSAND)
TABLE 24 EUROPE FLOUR IN LOW CARB DIET MARKET, BY REGION, 2018-2032 (USD THOUSAND)
TABLE 25 EUROPE FLOUR IN LOW CARB DIET MARKET, BY REGION, 2018-2032 (THOUSAND UNITS)
TABLE 26 EUROPE FLOUR IN LOW CARB DIET MARKET, BY TYPE, 2018-2032 (USD THOUSAND)
TABLE 27 EUROPE SUGAR CONFECTIONERY IN LOW CARB DIET MARKET, BY REGION, 2018-2032 (USD THOUSAND)
TABLE 28 EUROPE SUGAR CONFECTIONERY IN LOW CARB DIET MARKET, BY REGION, 2018-2032 (THOUSAND UNITS)
TABLE 29 EUROPE SUGAR CONFECTIONERY IN LOW CARB DIET MARKET, BY TYPE, 2018-2032 (USD THOUSAND)
TABLE 30 EUROPE CHOCOLATE IN LOW CARB DIET MARKET, BY CATEGORY, 2018-2032 (USD THOUSAND)
TABLE 31 EUROPE OTHERS IN LOW CARB DIET MARKET, BY REGION, 2018-2032 (USD THOUSAND)
TABLE 32 EUROPE OTHERS IN LOW CARB DIET MARKET, BY REGION, 2018-2032 (THOUSAND UNITS)
TABLE 33 EUROPE LOW CARB DIET MARKET, BY DISTRIBUTION CHANNEL, 2018-2032 (USD THOUSAND)
TABLE 34 EUROPE STORE-BASED IN LOW CARB DIET MARKET, BY REGION, 2018-2032 (USD THOUSAND)
TABLE 35 EUROPE STORE-BASED IN LOW CARB DIET MARKET, BY DISTRIBUTION CHANNEL, 2018-2032 (USD THOUSAND)
TABLE 36 EUROPE NON-STORE BASED IN LOW CARB DIET MARKET, BY REGION, 2018-2032 (USD THOUSAND)
TABLE 37 EUROPE NON-STORE BASED IN LOW CARB DIET MARKET, BY DISTRIBUTION CHANNEL, 2018-2032 (USD THOUSAND)
TABLE 38 EUROPE LOW CARB DIET MARKET, BY COUNTRY, 2018-2032 (USD THOUSAND)
TABLE 39 EUROPE LOW CARB DIET MARKET, BY COUNTRY, 2018-2032 (THOUSAND UNITS)
TABLE 40 EUROPE LOW CARB DIET MARKET, BY PRODUCT, 2018-2032 (USD THOUSAND)
TABLE 41 EUROPE LOW CARB DIET MARKET, BY PRODUCT, 2018-2032 (THOUSAND UNITS)
TABLE 42 EUROPE BAKERY IN LOW CARB DIET MARKET, BY PRODUCT, 2018-2032 (USD THOUSAND)
TABLE 43 EUROPE BREAD AND ROLLS IN LOW CARB DIET MARKET, BY TYPE, 2018-2032 (USD THOUSAND)
TABLE 44 EUROPE BREAD AND ROLLS IN LOW CARB DIET MARKET, BY CATEGORY, 2018-2032 (USD THOUSAND)
TABLE 45 EUROPE COOKIES IN LOW CARB DIET MARKET, BY TYPE, 2018-2032 (USD THOUSAND)
TABLE 46 EUROPE COOKIES IN LOW CARB DIET MARKET, BY FLAVOR, 2018-2032 (USD THOUSAND)
TABLE 47 EUROPE CAKES AND DESSERTS IN LOW CARB DIET MARKET, BY CATEGORY, 2018-2032 (USD THOUSAND)
TABLE 48 EUROPE PASTE AND NOODLES IN LOW CARB DIET MARKET, BY TYPE, 2018-2032 (USD THOUSAND)
TABLE 49 EUROPE FRESH/UNCOOKED PASTA IN LOW CARB DIET MARKET, BY TYPE, 2018-2032 (USD THOUSAND)
TABLE 50 EUROPE NOODLES IN LOW CARB DIET MARKET, BY TYPE, 2018-2032 (USD THOUSAND)
TABLE 51 EUROPE ICE CREAMS IN LOW CARB DIET MARKET, BY TYPE, 2018-2032 (USD THOUSAND)
TABLE 52 EUROPE FROZEN RTE IN LOW CARB DIET MARKET, BY TYPE, 2018-2032 (USD THOUSAND)
TABLE 53 EUROPE FLOUR IN LOW CARB DIET MARKET, BY TYPE, 2018-2032 (USD THOUSAND)
TABLE 54 EUROPE SUGAR CONFECTIONERY IN LOW CARB DIET MARKET, BY TYPE, 2018-2032 (USD THOUSAND)
TABLE 55 EUROPE CHOCOLATE IN LOW CARB DIET MARKET, BY CATEGORY, 2018-2032 (USD THOUSAND)
TABLE 56 EUROPE LOW CARB DIET MARKET, BY DISTRIBUTION CHANNEL, 2018-2032 (USD THOUSAND)
TABLE 57 EUROPE STORE-BASED IN LOW CARB DIET MARKET, BY DISTRIBUTION CHANNEL, 2018-2032 (USD THOUSAND)
TABLE 58 EUROPE NON-STORE BASED IN LOW CARB DIET MARKET, BY DISTRIBUTION CHANNEL, 2018-2032 (USD THOUSAND)
TABLE 59 U.K. LOW CARB DIET MARKET, BY PRODUCT, 2018-2032 (USD THOUSAND)
TABLE 60 U.K. LOW CARB DIET MARKET, BY PRODUCT, 2018-2032 (THOUSAND UNITS)
TABLE 61 U.K. BAKERY IN LOW CARB DIET MARKET, BY PRODUCT, 2018-2032 (USD THOUSAND)
TABLE 62 U.K. BREAD AND ROLLS IN LOW CARB DIET MARKET, BY TYPE, 2018-2032 (USD THOUSAND)
TABLE 63 U.K. BREAD AND ROLLS IN LOW CARB DIET MARKET, BY CATEGORY, 2018-2032 (USD THOUSAND)
TABLE 64 U.K. COOKIES IN LOW CARB DIET MARKET, BY TYPE, 2018-2032 (USD THOUSAND)
TABLE 65 U.K. COOKIES IN LOW CARB DIET MARKET, BY FLAVOR, 2018-2032 (USD THOUSAND)
TABLE 66 U.K. CAKES AND DESSERTS IN LOW CARB DIET MARKET, BY CATEGORY, 2018-2032 (USD THOUSAND)
TABLE 67 U.K. PASTE AND NOODLES IN LOW CARB DIET MARKET, BY TYPE, 2018-2032 (USD THOUSAND)
TABLE 68 U.K. FRESH/UNCOOKED PASTA IN LOW CARB DIET MARKET, BY TYPE, 2018-2032 (USD THOUSAND)
TABLE 69 U.K. NOODLES IN LOW CARB DIET MARKET, BY TYPE, 2018-2032 (USD THOUSAND)
TABLE 70 U.K. ICE CREAMS IN LOW CARB DIET MARKET, BY TYPE, 2018-2032 (USD THOUSAND)
TABLE 71 U.K. FROZEN RTE IN LOW CARB DIET MARKET, BY TYPE, 2018-2032 (USD THOUSAND)
TABLE 72 U.K. FLOUR IN LOW CARB DIET MARKET, BY TYPE, 2018-2032 (USD THOUSAND)
TABLE 73 U.K. SUGAR CONFECTIONERY IN LOW CARB DIET MARKET, BY TYPE, 2018-2032 (USD THOUSAND)
TABLE 74 U.K. CHOCOLATE IN LOW CARB DIET MARKET, BY CATEGORY, 2018-2032 (USD THOUSAND)
TABLE 75 U.K. LOW CARB DIET MARKET, BY DISTRIBUTION CHANNEL, 2018-2032 (USD THOUSAND)
TABLE 76 U.K. STORE-BASED IN LOW CARB DIET MARKET, BY DISTRIBUTION CHANNEL, 2018-2032 (USD THOUSAND)
TABLE 77 U.K. NON-STORE BASED IN LOW CARB DIET MARKET, BY DISTRIBUTION CHANNEL, 2018-2032 (USD THOUSAND)
TABLE 78 FRANCE LOW CARB DIET MARKET, BY PRODUCT, 2018-2032 (USD THOUSAND)
TABLE 79 FRANCE LOW CARB DIET MARKET, BY PRODUCT, 2018-2032 (THOUSAND UNITS)
TABLE 80 FRANCE BAKERY IN LOW CARB DIET MARKET, BY PRODUCT, 2018-2032 (USD THOUSAND)
TABLE 81 FRANCE BREAD AND ROLLS IN LOW CARB DIET MARKET, BY TYPE, 2018-2032 (USD THOUSAND)
TABLE 82 FRANCE BREAD AND ROLLS IN LOW CARB DIET MARKET, BY CATEGORY, 2018-2032 (USD THOUSAND)
TABLE 83 FRANCE COOKIES IN LOW CARB DIET MARKET, BY TYPE, 2018-2032 (USD THOUSAND)
TABLE 84 FRANCE COOKIES IN LOW CARB DIET MARKET, BY FLAVOR, 2018-2032 (USD THOUSAND)
TABLE 85 FRANCE CAKES AND DESSERTS IN LOW CARB DIET MARKET, BY CATEGORY, 2018-2032 (USD THOUSAND)
TABLE 86 FRANCE PASTE AND NOODLES IN LOW CARB DIET MARKET, BY TYPE, 2018-2032 (USD THOUSAND)
TABLE 87 FRANCE FRESH/UNCOOKED PASTA IN LOW CARB DIET MARKET, BY TYPE, 2018-2032 (USD THOUSAND)
TABLE 88 FRANCE NOODLES IN LOW CARB DIET MARKET, BY TYPE, 2018-2032 (USD THOUSAND)
TABLE 89 FRANCE ICE CREAMS IN LOW CARB DIET MARKET, BY TYPE, 2018-2032 (USD THOUSAND)
TABLE 90 FRANCE FROZEN RTE IN LOW CARB DIET MARKET, BY TYPE, 2018-2032 (USD THOUSAND)
TABLE 91 FRANCE FLOUR IN LOW CARB DIET MARKET, BY TYPE, 2018-2032 (USD THOUSAND)
TABLE 92 FRANCE SUGAR CONFECTIONERY IN LOW CARB DIET MARKET, BY TYPE, 2018-2032 (USD THOUSAND)
TABLE 93 FRANCE CHOCOLATE IN LOW CARB DIET MARKET, BY CATEGORY, 2018-2032 (USD THOUSAND)
TABLE 94 FRANCE LOW CARB DIET MARKET, BY DISTRIBUTION CHANNEL, 2018-2032 (USD THOUSAND)
TABLE 95 FRANCE STORE-BASED IN LOW CARB DIET MARKET, BY DISTRIBUTION CHANNEL, 2018-2032 (USD THOUSAND)
TABLE 96 FRANCE NON-STORE BASED IN LOW CARB DIET MARKET, BY DISTRIBUTION CHANNEL, 2018-2032 (USD THOUSAND)
TABLE 97 GERMANY LOW CARB DIET MARKET, BY PRODUCT, 2018-2032 (USD THOUSAND)
TABLE 98 GERMANY LOW CARB DIET MARKET, BY PRODUCT, 2018-2032 (THOUSAND UNITS)
TABLE 99 GERMANY BAKERY IN LOW CARB DIET MARKET, BY PRODUCT, 2018-2032 (USD THOUSAND)
TABLE 100 GERMANY BREAD AND ROLLS IN LOW CARB DIET MARKET, BY TYPE, 2018-2032 (USD THOUSAND)
TABLE 101 GERMANY BREAD AND ROLLS IN LOW CARB DIET MARKET, BY CATEGORY, 2018-2032 (USD THOUSAND)
TABLE 102 GERMANY COOKIES IN LOW CARB DIET MARKET, BY TYPE, 2018-2032 (USD THOUSAND)
TABLE 103 GERMANY COOKIES IN LOW CARB DIET MARKET, BY FLAVOR, 2018-2032 (USD THOUSAND)
TABLE 104 GERMANY CAKES AND DESSERTS IN LOW CARB DIET MARKET, BY CATEGORY, 2018-2032 (USD THOUSAND)
TABLE 105 GERMANY PASTE AND NOODLES IN LOW CARB DIET MARKET, BY TYPE, 2018-2032 (USD THOUSAND)
TABLE 106 GERMANY FRESH/UNCOOKED PASTA IN LOW CARB DIET MARKET, BY TYPE, 2018-2032 (USD THOUSAND)
TABLE 107 GERMANY NOODLES IN LOW CARB DIET MARKET, BY TYPE, 2018-2032 (USD THOUSAND)
TABLE 108 GERMANY ICE CREAMS IN LOW CARB DIET MARKET, BY TYPE, 2018-2032 (USD THOUSAND)
TABLE 109 GERMANY FROZEN RTE IN LOW CARB DIET MARKET, BY TYPE, 2018-2032 (USD THOUSAND)
TABLE 110 GERMANY FLOUR IN LOW CARB DIET MARKET, BY TYPE, 2018-2032 (USD THOUSAND)
TABLE 111 GERMANY SUGAR CONFECTIONERY IN LOW CARB DIET MARKET, BY TYPE, 2018-2032 (USD THOUSAND)
TABLE 112 GERMANY CHOCOLATE IN LOW CARB DIET MARKET, BY CATEGORY, 2018-2032 (USD THOUSAND)
TABLE 113 GERMANY LOW CARB DIET MARKET, BY DISTRIBUTION CHANNEL, 2018-2032 (USD THOUSAND)
TABLE 114 GERMANY STORE-BASED IN LOW CARB DIET MARKET, BY DISTRIBUTION CHANNEL, 2018-2032 (USD THOUSAND)
TABLE 115 GERMANY NON-STORE BASED IN LOW CARB DIET MARKET, BY DISTRIBUTION CHANNEL, 2018-2032 (USD THOUSAND)
TABLE 116 SPAIN LOW CARB DIET MARKET, BY PRODUCT, 2018-2032 (USD THOUSAND)
TABLE 117 SPAIN LOW CARB DIET MARKET, BY PRODUCT, 2018-2032 (THOUSAND UNITS)
TABLE 118 SPAIN BAKERY IN LOW CARB DIET MARKET, BY PRODUCT, 2018-2032 (USD THOUSAND)
TABLE 119 SPAIN BREAD AND ROLLS IN LOW CARB DIET MARKET, BY TYPE, 2018-2032 (USD THOUSAND)
TABLE 120 SPAIN BREAD AND ROLLS IN LOW CARB DIET MARKET, BY CATEGORY, 2018-2032 (USD THOUSAND)
TABLE 121 SPAIN COOKIES IN LOW CARB DIET MARKET, BY TYPE, 2018-2032 (USD THOUSAND)
TABLE 122 SPAIN COOKIES IN LOW CARB DIET MARKET, BY FLAVOR, 2018-2032 (USD THOUSAND)
TABLE 123 SPAIN CAKES AND DESSERTS IN LOW CARB DIET MARKET, BY CATEGORY, 2018-2032 (USD THOUSAND)
TABLE 124 SPAIN PASTE AND NOODLES IN LOW CARB DIET MARKET, BY TYPE, 2018-2032 (USD THOUSAND)
TABLE 125 SPAIN FRESH/UNCOOKED PASTA IN LOW CARB DIET MARKET, BY TYPE, 2018-2032 (USD THOUSAND)
TABLE 126 SPAIN NOODLES IN LOW CARB DIET MARKET, BY TYPE, 2018-2032 (USD THOUSAND)
TABLE 127 SPAIN ICE CREAMS IN LOW CARB DIET MARKET, BY TYPE, 2018-2032 (USD THOUSAND)
TABLE 128 SPAIN FROZEN RTE IN LOW CARB DIET MARKET, BY TYPE, 2018-2032 (USD THOUSAND)
TABLE 129 SPAIN FLOUR IN LOW CARB DIET MARKET, BY TYPE, 2018-2032 (USD THOUSAND)
TABLE 130 SPAIN SUGAR CONFECTIONERY IN LOW CARB DIET MARKET, BY TYPE, 2018-2032 (USD THOUSAND)
TABLE 131 SPAIN CHOCOLATE IN LOW CARB DIET MARKET, BY CATEGORY, 2018-2032 (USD THOUSAND)
TABLE 132 SPAIN LOW CARB DIET MARKET, BY DISTRIBUTION CHANNEL, 2018-2032 (USD THOUSAND)
TABLE 133 SPAIN STORE-BASED IN LOW CARB DIET MARKET, BY DISTRIBUTION CHANNEL, 2018-2032 (USD THOUSAND)
TABLE 134 SPAIN NON-STORE BASED IN LOW CARB DIET MARKET, BY DISTRIBUTION CHANNEL, 2018-2032 (USD THOUSAND)
TABLE 135 ITALY LOW CARB DIET MARKET, BY PRODUCT, 2018-2032 (USD THOUSAND)
TABLE 136 ITALY LOW CARB DIET MARKET, BY PRODUCT, 2018-2032 (THOUSAND UNITS)
TABLE 137 ITALY BAKERY IN LOW CARB DIET MARKET, BY PRODUCT, 2018-2032 (USD THOUSAND)
TABLE 138 ITALY BREAD AND ROLLS IN LOW CARB DIET MARKET, BY TYPE, 2018-2032 (USD THOUSAND)
TABLE 139 ITALY BREAD AND ROLLS IN LOW CARB DIET MARKET, BY CATEGORY, 2018-2032 (USD THOUSAND)
TABLE 140 ITALY COOKIES IN LOW CARB DIET MARKET, BY TYPE, 2018-2032 (USD THOUSAND)
TABLE 141 ITALY COOKIES IN LOW CARB DIET MARKET, BY FLAVOR, 2018-2032 (USD THOUSAND)
TABLE 142 ITALY CAKES AND DESSERTS IN LOW CARB DIET MARKET, BY CATEGORY, 2018-2032 (USD THOUSAND)
TABLE 143 ITALY PASTE AND NOODLES IN LOW CARB DIET MARKET, BY TYPE, 2018-2032 (USD THOUSAND)
TABLE 144 ITALY FRESH/UNCOOKED PASTA IN LOW CARB DIET MARKET, BY TYPE, 2018-2032 (USD THOUSAND)
TABLE 145 ITALY NOODLES IN LOW CARB DIET MARKET, BY TYPE, 2018-2032 (USD THOUSAND)
TABLE 146 ITALY ICE CREAMS IN LOW CARB DIET MARKET, BY TYPE, 2018-2032 (USD THOUSAND)
TABLE 147 ITALY FROZEN RTE IN LOW CARB DIET MARKET, BY TYPE, 2018-2032 (USD THOUSAND)
TABLE 148 ITALY FLOUR IN LOW CARB DIET MARKET, BY TYPE, 2018-2032 (USD THOUSAND)
TABLE 149 ITALY SUGAR CONFECTIONERY IN LOW CARB DIET MARKET, BY TYPE, 2018-2032 (USD THOUSAND)
TABLE 150 ITALY CHOCOLATE IN LOW CARB DIET MARKET, BY CATEGORY, 2018-2032 (USD THOUSAND)
TABLE 151 ITALY LOW CARB DIET MARKET, BY DISTRIBUTION CHANNEL, 2018-2032 (USD THOUSAND)
TABLE 152 ITALY STORE-BASED IN LOW CARB DIET MARKET, BY DISTRIBUTION CHANNEL, 2018-2032 (USD THOUSAND)
TABLE 153 ITALY NON-STORE BASED IN LOW CARB DIET MARKET, BY DISTRIBUTION CHANNEL, 2018-2032 (USD THOUSAND)
TABLE 154 NETHERLANDS LOW CARB DIET MARKET, BY PRODUCT, 2018-2032 (USD THOUSAND)
TABLE 155 NETHERLANDS LOW CARB DIET MARKET, BY PRODUCT, 2018-2032 (THOUSAND UNITS)
TABLE 156 NETHERLANDS BAKERY IN LOW CARB DIET MARKET, BY PRODUCT, 2018-2032 (USD THOUSAND)
TABLE 157 NETHERLANDS BREAD AND ROLLS IN LOW CARB DIET MARKET, BY TYPE, 2018-2032 (USD THOUSAND)
TABLE 158 NETHERLANDS BREAD AND ROLLS IN LOW CARB DIET MARKET, BY CATEGORY, 2018-2032 (USD THOUSAND)
TABLE 159 NETHERLANDS COOKIES IN LOW CARB DIET MARKET, BY TYPE, 2018-2032 (USD THOUSAND)
TABLE 160 NETHERLANDS COOKIES IN LOW CARB DIET MARKET, BY FLAVOR, 2018-2032 (USD THOUSAND)
TABLE 161 NETHERLANDS CAKES AND DESSERTS IN LOW CARB DIET MARKET, BY CATEGORY, 2018-2032 (USD THOUSAND)
TABLE 162 NETHERLANDS PASTE AND NOODLES IN LOW CARB DIET MARKET, BY TYPE, 2018-2032 (USD THOUSAND)
TABLE 163 NETHERLANDS FRESH/UNCOOKED PASTA IN LOW CARB DIET MARKET, BY TYPE, 2018-2032 (USD THOUSAND)
TABLE 164 NETHERLANDS NOODLES IN LOW CARB DIET MARKET, BY TYPE, 2018-2032 (USD THOUSAND)
TABLE 165 NETHERLANDS ICE CREAMS IN LOW CARB DIET MARKET, BY TYPE, 2018-2032 (USD THOUSAND)
TABLE 166 NETHERLANDS FROZEN RTE IN LOW CARB DIET MARKET, BY TYPE, 2018-2032 (USD THOUSAND)
TABLE 167 NETHERLANDS FLOUR IN LOW CARB DIET MARKET, BY TYPE, 2018-2032 (USD THOUSAND)
TABLE 168 NETHERLANDS SUGAR CONFECTIONERY IN LOW CARB DIET MARKET, BY TYPE, 2018-2032 (USD THOUSAND)
TABLE 169 NETHERLANDS CHOCOLATE IN LOW CARB DIET MARKET, BY CATEGORY, 2018-2032 (USD THOUSAND)
TABLE 170 NETHERLANDS LOW CARB DIET MARKET, BY DISTRIBUTION CHANNEL, 2018-2032 (USD THOUSAND)
TABLE 171 NETHERLANDS STORE-BASED IN LOW CARB DIET MARKET, BY DISTRIBUTION CHANNEL, 2018-2032 (USD THOUSAND)
TABLE 172 NETHERLANDS NON-STORE BASED IN LOW CARB DIET MARKET, BY DISTRIBUTION CHANNEL, 2018-2032 (USD THOUSAND)
TABLE 173 LUXEMBURG LOW CARB DIET MARKET, BY PRODUCT, 2018-2032 (USD THOUSAND)
TABLE 174 LUXEMBURG LOW CARB DIET MARKET, BY PRODUCT, 2018-2032 (THOUSAND UNITS)
TABLE 175 LUXEMBURG BAKERY IN LOW CARB DIET MARKET, BY PRODUCT, 2018-2032 (USD THOUSAND)
TABLE 176 LUXEMBURG BREAD AND ROLLS IN LOW CARB DIET MARKET, BY TYPE, 2018-2032 (USD THOUSAND)
TABLE 177 LUXEMBURG BREAD AND ROLLS IN LOW CARB DIET MARKET, BY CATEGORY, 2018-2032 (USD THOUSAND)
TABLE 178 LUXEMBURG COOKIES IN LOW CARB DIET MARKET, BY TYPE, 2018-2032 (USD THOUSAND)
TABLE 179 LUXEMBURG COOKIES IN LOW CARB DIET MARKET, BY FLAVOR, 2018-2032 (USD THOUSAND)
TABLE 180 LUXEMBURG CAKES AND DESSERTS IN LOW CARB DIET MARKET, BY CATEGORY, 2018-2032 (USD THOUSAND)
TABLE 181 LUXEMBURG PASTE AND NOODLES IN LOW CARB DIET MARKET, BY TYPE, 2018-2032 (USD THOUSAND)
TABLE 182 LUXEMBURG FRESH/UNCOOKED PASTA IN LOW CARB DIET MARKET, BY TYPE, 2018-2032 (USD THOUSAND)
TABLE 183 LUXEMBURG NOODLES IN LOW CARB DIET MARKET, BY TYPE, 2018-2032 (USD THOUSAND)
TABLE 184 LUXEMBURG ICE CREAMS IN LOW CARB DIET MARKET, BY TYPE, 2018-2032 (USD THOUSAND)
TABLE 185 LUXEMBURG FROZEN RTE IN LOW CARB DIET MARKET, BY TYPE, 2018-2032 (USD THOUSAND)
TABLE 186 LUXEMBURG FLOUR IN LOW CARB DIET MARKET, BY TYPE, 2018-2032 (USD THOUSAND)
TABLE 187 LUXEMBURG SUGAR CONFECTIONERY IN LOW CARB DIET MARKET, BY TYPE, 2018-2032 (USD THOUSAND)
TABLE 188 LUXEMBURG CHOCOLATE IN LOW CARB DIET MARKET, BY CATEGORY, 2018-2032 (USD THOUSAND)
TABLE 189 LUXEMBURG LOW CARB DIET MARKET, BY DISTRIBUTION CHANNEL, 2018-2032 (USD THOUSAND)
TABLE 190 LUXEMBURG STORE-BASED IN LOW CARB DIET MARKET, BY DISTRIBUTION CHANNEL, 2018-2032 (USD THOUSAND)
TABLE 191 LUXEMBURG NON-STORE BASED IN LOW CARB DIET MARKET, BY DISTRIBUTION CHANNEL, 2018-2032 (USD THOUSAND)
TABLE 192 TURKEY LOW CARB DIET MARKET, BY PRODUCT, 2018-2032 (USD THOUSAND)
TABLE 193 TURKEY LOW CARB DIET MARKET, BY PRODUCT, 2018-2032 (THOUSAND UNITS)
TABLE 194 TURKEY BAKERY IN LOW CARB DIET MARKET, BY PRODUCT, 2018-2032 (USD THOUSAND)
TABLE 195 TURKEY BREAD AND ROLLS IN LOW CARB DIET MARKET, BY TYPE, 2018-2032 (USD THOUSAND)
TABLE 196 TURKEY BREAD AND ROLLS IN LOW CARB DIET MARKET, BY CATEGORY, 2018-2032 (USD THOUSAND)
TABLE 197 TURKEY COOKIES IN LOW CARB DIET MARKET, BY TYPE, 2018-2032 (USD THOUSAND)
TABLE 198 TURKEY COOKIES IN LOW CARB DIET MARKET, BY FLAVOR, 2018-2032 (USD THOUSAND)
TABLE 199 TURKEY CAKES AND DESSERTS IN LOW CARB DIET MARKET, BY CATEGORY, 2018-2032 (USD THOUSAND)
TABLE 200 TURKEY PASTE AND NOODLES IN LOW CARB DIET MARKET, BY TYPE, 2018-2032 (USD THOUSAND)
TABLE 201 TURKEY FRESH/UNCOOKED PASTA IN LOW CARB DIET MARKET, BY TYPE, 2018-2032 (USD THOUSAND)
TABLE 202 TURKEY NOODLES IN LOW CARB DIET MARKET, BY TYPE, 2018-2032 (USD THOUSAND)
TABLE 203 TURKEY ICE CREAMS IN LOW CARB DIET MARKET, BY TYPE, 2018-2032 (USD THOUSAND)
TABLE 204 TURKEY FROZEN RTE IN LOW CARB DIET MARKET, BY TYPE, 2018-2032 (USD THOUSAND)
TABLE 205 TURKEY FLOUR IN LOW CARB DIET MARKET, BY TYPE, 2018-2032 (USD THOUSAND)
TABLE 206 TURKEY SUGAR CONFECTIONERY IN LOW CARB DIET MARKET, BY TYPE, 2018-2032 (USD THOUSAND)
TABLE 207 TURKEY CHOCOLATE IN LOW CARB DIET MARKET, BY CATEGORY, 2018-2032 (USD THOUSAND)
TABLE 208 TURKEY LOW CARB DIET MARKET, BY DISTRIBUTION CHANNEL, 2018-2032 (USD THOUSAND)
TABLE 209 TURKEY STORE-BASED IN LOW CARB DIET MARKET, BY DISTRIBUTION CHANNEL, 2018-2032 (USD THOUSAND)
TABLE 210 TURKEY NON-STORE BASED IN LOW CARB DIET MARKET, BY DISTRIBUTION CHANNEL, 2018-2032 (USD THOUSAND)
TABLE 211 BELGIUM LOW CARB DIET MARKET, BY PRODUCT, 2018-2032 (USD THOUSAND)
TABLE 212 BELGIUM LOW CARB DIET MARKET, BY PRODUCT, 2018-2032 (THOUSAND UNITS)
TABLE 213 BELGIUM BAKERY IN LOW CARB DIET MARKET, BY PRODUCT, 2018-2032 (USD THOUSAND)
TABLE 214 BELGIUM BREAD AND ROLLS IN LOW CARB DIET MARKET, BY TYPE, 2018-2032 (USD THOUSAND)
TABLE 215 BELGIUM BREAD AND ROLLS IN LOW CARB DIET MARKET, BY CATEGORY, 2018-2032 (USD THOUSAND)
TABLE 216 BELGIUM COOKIES IN LOW CARB DIET MARKET, BY TYPE, 2018-2032 (USD THOUSAND)
TABLE 217 BELGIUM COOKIES IN LOW CARB DIET MARKET, BY FLAVOR, 2018-2032 (USD THOUSAND)
TABLE 218 BELGIUM CAKES AND DESSERTS IN LOW CARB DIET MARKET, BY CATEGORY, 2018-2032 (USD THOUSAND)
TABLE 219 BELGIUM PASTE AND NOODLES IN LOW CARB DIET MARKET, BY TYPE, 2018-2032 (USD THOUSAND)
TABLE 220 BELGIUM FRESH/UNCOOKED PASTA IN LOW CARB DIET MARKET, BY TYPE, 2018-2032 (USD THOUSAND)
TABLE 221 BELGIUM NOODLES IN LOW CARB DIET MARKET, BY TYPE, 2018-2032 (USD THOUSAND)
TABLE 222 BELGIUM ICE CREAMS IN LOW CARB DIET MARKET, BY TYPE, 2018-2032 (USD THOUSAND)
TABLE 223 BELGIUM FROZEN RTE IN LOW CARB DIET MARKET, BY TYPE, 2018-2032 (USD THOUSAND)
TABLE 224 BELGIUM FLOUR IN LOW CARB DIET MARKET, BY TYPE, 2018-2032 (USD THOUSAND)
TABLE 225 BELGIUM SUGAR CONFECTIONERY IN LOW CARB DIET MARKET, BY TYPE, 2018-2032 (USD THOUSAND)
TABLE 226 BELGIUM CHOCOLATE IN LOW CARB DIET MARKET, BY CATEGORY, 2018-2032 (USD THOUSAND)
TABLE 227 BELGIUM LOW CARB DIET MARKET, BY DISTRIBUTION CHANNEL, 2018-2032 (USD THOUSAND)
TABLE 228 BELGIUM STORE-BASED IN LOW CARB DIET MARKET, BY DISTRIBUTION CHANNEL, 2018-2032 (USD THOUSAND)
TABLE 229 BELGIUM NON-STORE BASED IN LOW CARB DIET MARKET, BY DISTRIBUTION CHANNEL, 2018-2032 (USD THOUSAND)
TABLE 230 RUSSIA LOW CARB DIET MARKET, BY PRODUCT, 2018-2032 (USD THOUSAND)
TABLE 231 RUSSIA LOW CARB DIET MARKET, BY PRODUCT, 2018-2032 (THOUSAND UNITS)
TABLE 232 RUSSIA BAKERY IN LOW CARB DIET MARKET, BY PRODUCT, 2018-2032 (USD THOUSAND)
TABLE 233 RUSSIA BREAD AND ROLLS IN LOW CARB DIET MARKET, BY TYPE, 2018-2032 (USD THOUSAND)
TABLE 234 RUSSIA BREAD AND ROLLS IN LOW CARB DIET MARKET, BY CATEGORY, 2018-2032 (USD THOUSAND)
TABLE 235 RUSSIA COOKIES IN LOW CARB DIET MARKET, BY TYPE, 2018-2032 (USD THOUSAND)
TABLE 236 RUSSIA COOKIES IN LOW CARB DIET MARKET, BY FLAVOR, 2018-2032 (USD THOUSAND)
TABLE 237 RUSSIA CAKES AND DESSERTS IN LOW CARB DIET MARKET, BY CATEGORY, 2018-2032 (USD THOUSAND)
TABLE 238 RUSSIA PASTE AND NOODLES IN LOW CARB DIET MARKET, BY TYPE, 2018-2032 (USD THOUSAND)
TABLE 239 RUSSIA FRESH/UNCOOKED PASTA IN LOW CARB DIET MARKET, BY TYPE, 2018-2032 (USD THOUSAND)
TABLE 240 RUSSIA NOODLES IN LOW CARB DIET MARKET, BY TYPE, 2018-2032 (USD THOUSAND)
TABLE 241 RUSSIA ICE CREAMS IN LOW CARB DIET MARKET, BY TYPE, 2018-2032 (USD THOUSAND)
TABLE 242 RUSSIA FROZEN RTE IN LOW CARB DIET MARKET, BY TYPE, 2018-2032 (USD THOUSAND)
TABLE 243 RUSSIA FLOUR IN LOW CARB DIET MARKET, BY TYPE, 2018-2032 (USD THOUSAND)
TABLE 244 RUSSIA SUGAR CONFECTIONERY IN LOW CARB DIET MARKET, BY TYPE, 2018-2032 (USD THOUSAND)
TABLE 245 RUSSIA CHOCOLATE IN LOW CARB DIET MARKET, BY CATEGORY, 2018-2032 (USD THOUSAND)
TABLE 246 RUSSIA LOW CARB DIET MARKET, BY DISTRIBUTION CHANNEL, 2018-2032 (USD THOUSAND)
TABLE 247 RUSSIA STORE-BASED IN LOW CARB DIET MARKET, BY DISTRIBUTION CHANNEL, 2018-2032 (USD THOUSAND)
TABLE 248 RUSSIA NON-STORE BASED IN LOW CARB DIET MARKET, BY DISTRIBUTION CHANNEL, 2018-2032 (USD THOUSAND)
TABLE 249 SWITZERLAND LOW CARB DIET MARKET, BY PRODUCT, 2018-2032 (USD THOUSAND)
TABLE 250 SWITZERLAND LOW CARB DIET MARKET, BY PRODUCT, 2018-2032 (THOUSAND UNITS)
TABLE 251 SWITZERLAND BAKERY IN LOW CARB DIET MARKET, BY PRODUCT, 2018-2032 (USD THOUSAND)
TABLE 252 SWITZERLAND BREAD AND ROLLS IN LOW CARB DIET MARKET, BY TYPE, 2018-2032 (USD THOUSAND)
TABLE 253 SWITZERLAND BREAD AND ROLLS IN LOW CARB DIET MARKET, BY CATEGORY, 2018-2032 (USD THOUSAND)
TABLE 254 SWITZERLAND COOKIES IN LOW CARB DIET MARKET, BY TYPE, 2018-2032 (USD THOUSAND)
TABLE 255 SWITZERLAND COOKIES IN LOW CARB DIET MARKET, BY FLAVOR, 2018-2032 (USD THOUSAND)
TABLE 256 SWITZERLAND CAKES AND DESSERTS IN LOW CARB DIET MARKET, BY CATEGORY, 2018-2032 (USD THOUSAND)
TABLE 257 SWITZERLAND PASTE AND NOODLES IN LOW CARB DIET MARKET, BY TYPE, 2018-2032 (USD THOUSAND)
TABLE 258 SWITZERLAND FRESH/UNCOOKED PASTA IN LOW CARB DIET MARKET, BY TYPE, 2018-2032 (USD THOUSAND)
TABLE 259 SWITZERLAND NOODLES IN LOW CARB DIET MARKET, BY TYPE, 2018-2032 (USD THOUSAND)
TABLE 260 SWITZERLAND ICE CREAMS IN LOW CARB DIET MARKET, BY TYPE, 2018-2032 (USD THOUSAND)
TABLE 261 SWITZERLAND FROZEN RTE IN LOW CARB DIET MARKET, BY TYPE, 2018-2032 (USD THOUSAND)
TABLE 262 SWITZERLAND FLOUR IN LOW CARB DIET MARKET, BY TYPE, 2018-2032 (USD THOUSAND)
TABLE 263 SWITZERLAND SUGAR CONFECTIONERY IN LOW CARB DIET MARKET, BY TYPE, 2018-2032 (USD THOUSAND)
TABLE 264 SWITZERLAND CHOCOLATE IN LOW CARB DIET MARKET, BY CATEGORY, 2018-2032 (USD THOUSAND)
TABLE 265 SWITZERLAND LOW CARB DIET MARKET, BY DISTRIBUTION CHANNEL, 2018-2032 (USD THOUSAND)
TABLE 266 SWITZERLAND STORE-BASED IN LOW CARB DIET MARKET, BY DISTRIBUTION CHANNEL, 2018-2032 (USD THOUSAND)
TABLE 267 SWITZERLAND NON-STORE BASED IN LOW CARB DIET MARKET, BY DISTRIBUTION CHANNEL, 2018-2032 (USD THOUSAND)
TABLE 268 REST OF EUROPE LOW CARB DIET MARKET, BY PRODUCT, 2018-2032 (USD THOUSAND)
TABLE 269 REST OF EUROPE LOW CARB DIET MARKET, BY PRODUCT, 2018-2032 (THOUSAND UNITS)
List of Figure
FIGURE 1 EUROPE LOW CARB DIET MARKET
FIGURE 2 EUROPE LOW CARB DIET MARKET: DATA TRIANGULATION
FIGURE 3 EUROPE LOW CARB DIET MARKET: DROC ANALYSIS
FIGURE 4 EUROPE LOW CARB DIET MARKET: EUROPE VS REGIONAL MARKET ANALYSIS
FIGURE 5 EUROPE LOW CARB DIET MARKET: COMPANY RESEARCH ANALYSIS
FIGURE 6 EUROPE LOW CARB DIET MARKET: MULTIVARIATE MODELLING
FIGURE 7 EUROPE LOW CARB DIET MARKET: INTERVIEW DEMOGRAPHICS
FIGURE 8 EUROPE LOW CARB DIET MARKET: DBMR MARKET POSITION GRID
FIGURE 9 EUROPE LOW CARB DIET MARKET: VENDOR SHARE ANALYSIS
FIGURE 10 EUROPE LOW CARB DIET MARKET: SEGMENTATION
FIGURE 11 EUROPE LOW CARB DIET MARKET: EXECUTIVE SUMMARY
FIGURE 12 SEVEN SEGMENTS COMPRISE THE EUROPE LOW CARB DIET MARKET, BY PRODUCT
FIGURE 13 EUROPE LOW CARB DIET: STRATEGIC DECISIONS
FIGURE 14 INCREASING CONSUMER AWARENESS ABOUT THE HEALTH BENEFITS OF LOW-CARB DIETS IS EXPECTED TO DRIVE THE EUROPE LOW CARB DIET MARKET IN THE FORECAST PERIOD (2025-2032)
FIGURE 15 THE BAKERY IS EXPECTED TO ACCOUNT FOR THE LARGEST SHARE OF THE EUROPE LOW CARB DIET MARKET IN 2025 AND 2032
FIGURE 16 IMPORT EXPORT SCENARIO (USD THOUSAND)
FIGURE 17 PRICING ANALYSIS
FIGURE 18 DRIVERS, RESTRAINTS, OPPORTUNITIES, AND CHALLENGES FOR EUROPE LOW CARB DIET MARKET
FIGURE 19 EUROPE LOW CARB DIET MARKET, BY PRODUCT, 2024
FIGURE 20 EUROPE LOW CARB DIET MARKET, BY DISTRIBUTION CHANNEL, 2024
FIGURE 21 EUROPE LOW CARB DIET MARKET: SNAPSHOT (2024)
FIGURE 22 EUROPE LOW CARB DIET MARKET: COMPANY SHARE 2024 (%)
Europe Low Carb Diet Market, Supply Chain Analysis and Ecosystem Framework
To support market growth and help clients navigate the impact of geopolitical shifts, DBMR has integrated in-depth supply chain analysis into its Europe Low Carb Diet Market research reports. This addition empowers clients to respond effectively to global changes affecting their industries. The supply chain analysis section includes detailed insights such as Europe Low Carb Diet Market consumption and production by country, price trend analysis, the impact of tariffs and geopolitical developments, and import and export trends by country and HSN code. It also highlights major suppliers with data on production capacity and company profiles, as well as key importers and exporters. In addition to research, DBMR offers specialized supply chain consulting services backed by over a decade of experience, providing solutions like supplier discovery, supplier risk assessment, price trend analysis, impact evaluation of inflation and trade route changes, and comprehensive market trend analysis.
Data collection and base year analysis are done using data collection modules with large sample sizes. The stage includes obtaining market information or related data through various sources and strategies. It includes examining and planning all the data acquired from the past in advance. It likewise envelops the examination of information inconsistencies seen across different information sources. The market data is analysed and estimated using market statistical and coherent models. Also, market share analysis and key trend analysis are the major success factors in the market report. To know more, please request an analyst call or drop down your inquiry.
The key research methodology used by DBMR research team is data triangulation which involves data mining, analysis of the impact of data variables on the market and primary (industry expert) validation. Data models include Vendor Positioning Grid, Market Time Line Analysis, Market Overview and Guide, Company Positioning Grid, Patent Analysis, Pricing Analysis, Company Market Share Analysis, Standards of Measurement, Global versus Regional and Vendor Share Analysis. To know more about the research methodology, drop in an inquiry to speak to our industry experts.
Data Bridge Market Research is a leader in advanced formative research. We take pride in servicing our existing and new customers with data and analysis that match and suits their goal. The report can be customized to include price trend analysis of target brands understanding the market for additional countries (ask for the list of countries), clinical trial results data, literature review, refurbished market and product base analysis. Market analysis of target competitors can be analyzed from technology-based analysis to market portfolio strategies. We can add as many competitors that you require data about in the format and data style you are looking for. Our team of analysts can also provide you data in crude raw excel files pivot tables (Fact book) or can assist you in creating presentations from the data sets available in the report.


