
Europe Lyophilized Injectable Drugs Market
Market Size in USD Billion
 USD
1.26 Billion
USD
2.05 Billion
2024
2032
USD
1.26 Billion
USD
2.05 Billion
2024
2032
| 2025 - 2032 | |
| USD 1.26 Billion | |
| USD 2.05 Billion | |
| % | |
|
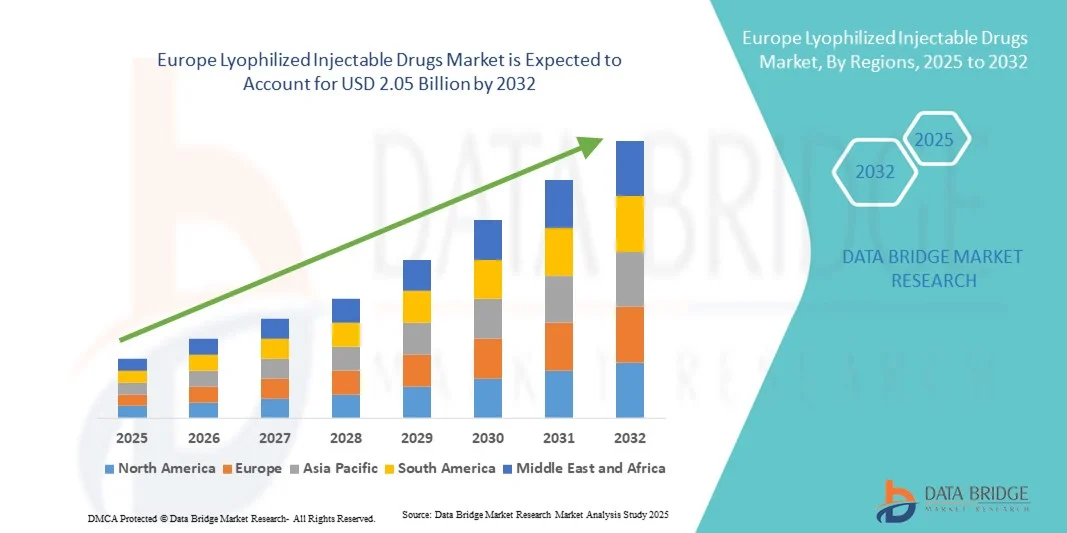
Europe Lyophilized Injectable Drugs Market Size
- The Europe lyophilized injectable drugs market size was valued at USD 1.26 billion in 2024 and is expected to reach USD 2.05 billion by 2032, at a CAGR of 6.30% during the forecast period
- The market growth is largely fueled by the increasing adoption of advanced freeze-drying technologies and continuous innovation in formulation science, leading to improved stability and extended shelf life of injectable drugs
- Furthermore, rising demand for ready-to-use, preservative-free, and stable formulations among pharmaceutical companies and healthcare providers is establishing lyophilized injectable drugs as a preferred dosage form. These converging factors are accelerating the uptake of lyophilized injectable drug solutions, thereby significantly boosting the industry's growth
Europe Lyophilized Injectable Drugs Market Analysis
- Lyophilized injectable drugs, offering enhanced stability, longer shelf life, and better transportation safety, are increasingly becoming vital components in modern pharmaceutical formulations across therapeutic areas such as oncology, autoimmune disorders, and infectious diseases
- The escalating demand for lyophilized injectables is primarily fueled by the rising prevalence of chronic diseases, increasing adoption of biologics and biosimilars, and advancements in lyophilization technologies that improve drug stability and reconstitution time
- U.K. dominated the lyophilized injectable drugs market with the largest revenue share of 47% in 2024, driven by robust biopharmaceutical production, strong presence of major pharmaceutical companies, and growing R&D investments in biologics and vaccines
- Germany is expected to be the fastest-growing region in the lyophilized injectable drugs market during the forecast period, owing to increasing urbanization, expanding healthcare infrastructure, and rising investments by global pharma companies
- The powder segment dominated the largest market revenue share of 64.5% in 2024, driven by its superior stability and ability to extend drug shelf life. Powder formulations are ideal for biologics, peptides, and vaccines that require long-term preservation without degradation
Report Scope and Lyophilized Injectable Drugs Market Segmentation
|
Attributes |
Lyophilized Injectable Drugs Key Market Insights |
|
Segments Covered |
|
|
Countries Covered |
Europe
|
|
Key Market Players |
• Vetter (Germany) |
|
Market Opportunities |
|
|
Value Added Data Infosets |
In addition to the insights on market scenarios such as market value, growth rate, segmentation, geographical coverage, and major players, the market reports curated by the Data Bridge Market Research also include in-depth expert analysis, patient epidemiology, pipeline analysis, pricing analysis, and regulatory framework. |
Europe Lyophilized Injectable Drugs Market Trends
Enhanced Convenience Through AI and Data-Driven Integration
- A significant and accelerating trend in the Europe lyophilized injectable drugs market is the deepening integration of artificial intelligence (AI) and advanced data analytics for optimizing formulation, stability, and production efficiency. This convergence of technologies is significantly enhancing operational precision and product consistency across pharmaceutical manufacturing processes
- For instance, leading companies are implementing AI-powered lyophilization systems capable of real-time monitoring and predictive control of drying cycles, ensuring consistent product quality and improved batch reproducibility. Similarly, automated AI-based platforms are being adopted to streamline vial loading, freeze-drying, and reconstitution processes, offering a more reliable and efficient Lyophilized Injectable Drugs solution
- AI integration in lyophilized drug manufacturing enables predictive modeling of formulation behavior, optimization of drying parameters, and detection of anomalies to minimize wastage. For instance, certain pharmaceutical firms utilize AI to improve yield prediction accuracy over time and provide intelligent alerts when environmental or process deviations are detected. Furthermore, automated data analysis capabilities offer researchers enhanced insights into formulation behavior, enabling continuous process improvement
- The seamless integration of AI-driven control systems with digital manufacturing platforms facilitates centralized oversight of all production stages. Through a single interface, pharmaceutical teams can monitor temperature, pressure, and moisture profiles alongside packaging and quality assurance metrics, creating a unified, automated manufacturing environment
- This trend toward intelligent, data-centric, and interconnected lyophilization processes is fundamentally reshaping expectations for sterile injectable production. Consequently, companies such as Baxter and Pfizer are developing AI-enabled lyophilization technologies with adaptive control systems and integrated process analytics to achieve higher efficiency and reduced variability
- The demand for Lyophilized Injectable Drugs supported by AI-driven manufacturing and process optimization is growing rapidly across both biopharmaceutical and contract manufacturing sectors, as companies increasingly prioritize reliability, scalability, and regulatory compliance
Europe Lyophilized Injectable Drugs Market Dynamics
Driver
Growing Demand Due to Increasing Prevalence of Chronic Diseases and Biologic Drug Development
- The rising incidence of chronic diseases such as cancer, diabetes, and autoimmune disorders, coupled with the increasing adoption of biologic therapies, is a significant driver for the growing demand for lyophilized injectable formulations
- For instance, in April 2024, Baxter International Inc. announced advancements in its AI-assisted freeze-drying technologies, aimed at enhancing process control and reducing product degradation during lyophilization. Such initiatives by major players are expected to accelerate the growth of the Lyophilized Injectable Drugs industry during the forecast period
- As the need for stable, long-shelf-life formulations grows, lyophilization offers significant benefits in improving drug stability, transportability, and patient accessibility. It ensures that biologics and vaccines maintain potency under diverse storage conditions, providing a key advantage over liquid formulations
- Furthermore, the rising trend of personalized medicine and biologic-based therapies is expanding the need for customized lyophilization protocols, where AI-driven systems can optimize product-specific drying cycles and ensure precise formulation control
- The convenience of extended shelf life, ease of reconstitution, and the potential for reduced cold-chain dependence are major factors propelling adoption across both large pharmaceutical companies and smaller biopharma firms. The expansion of contract manufacturing organizations (CMOs) offering automated lyophilization services further contributes to global market growth
Restraint/Challenge
High Production Costs and Regulatory Complexities
- High production and equipment costs associated with lyophilization systems, as well as complex regulatory requirements, pose significant challenges to wider market adoption. As lyophilization involves energy-intensive processes and specialized machinery, it can significantly increase the cost of drug manufacturing
- For instance, several pharmaceutical manufacturers have reported increased capital expenditure in upgrading to automated and AI-assisted lyophilization units to meet evolving Good Manufacturing Practice (GMP) and FDA validation standards
- Addressing these cost and compliance challenges through process optimization, modular equipment design, and real-time quality monitoring is critical for ensuring commercial viability. Companies such as Pfizer and GSK are investing in next-generation lyophilization facilities that integrate real-time process analytical technology (PAT) to improve efficiency and reduce validation time
- In addition, ensuring global regulatory compliance across regions remains complex, as lyophilized products must meet stringent quality and sterility standards. The need for extensive validation and stability testing can delay product launches, adding to development costs
- While innovations in continuous freeze-drying and automated quality inspection are gradually reducing costs, high initial investment requirements still limit adoption, especially among smaller biopharmaceutical firms
- Overcoming these challenges through scalable automation, AI-driven predictive maintenance, and harmonized regulatory frameworks will be essential for the sustainable growth of the Lyophilized Injectable Drugs market
Europe Lyophilized Injectable Drugs Market Scope
The market is segmented on the basis of packaging, drug class, form, indication, route of administration, end user, and distribution channel
- By Packaging
On the basis of packaging, the Europe Lyophilized Injectable Drugs market is segmented into vials, dual-chamber syringes, dual-chamber cartridges, and others. The vials segment dominated the largest market revenue share of 47.3% in 2024, driven by their extensive use in storing and preserving sterile injectable formulations. Vials are preferred for lyophilized drugs due to their excellent barrier properties, chemical stability, and cost-effectiveness. They are widely adopted across hospitals and pharmaceutical manufacturers for handling bulk drug quantities efficiently. Additionally, vials support various filling volumes and are compatible with different closure systems, improving storage flexibility. The segment benefits from advancements in borosilicate glass and polymer vials, enhancing break resistance and reducing contamination risk. Their demand is reinforced by the high use of lyophilized biologics and vaccines in Europe’s hospital infrastructure. Vials continue to hold dominance owing to their strong regulatory acceptance, scalability in production, and proven stability under cold chain conditions.
The dual-chamber syringe segment is anticipated to witness the fastest growth rate of 10.8% CAGR from 2025 to 2032, fueled by the increasing demand for ready-to-use formulations and patient-centric drug delivery solutions. Dual-chamber syringes enable easy reconstitution of lyophilized drugs just before administration, minimizing preparation errors and enhancing product stability. This packaging format is increasingly preferred for high-value biologics, emergency drugs, and self-administered therapies. The segment benefits from rising chronic disease prevalence, where patients require convenient, single-use delivery systems. Pharmaceutical companies in Europe are shifting toward dual-chamber systems to meet growing compliance and sterility requirements. Furthermore, improvements in prefillable syringe materials and automation in filling processes have reduced manufacturing complexity, accelerating adoption. These advantages are driving the dual-chamber syringe’s rapid penetration across both hospital and home healthcare applications.
- By Drug Class
On the basis of drug class, the market is segmented into anti-infectives, antineoplastic, diuretics, proton pump inhibitors, anesthetic, anticoagulant, NSAIDs, corticosteroids, and others. The antineoplastic segment dominated the market with the largest share of 39.6% in 2024, owing to the growing use of lyophilized injectable formulations in oncology therapeutics. Lyophilization preserves the potency and stability of complex cancer drugs, which are often sensitive to temperature and humidity. European pharmaceutical companies extensively rely on lyophilized forms for monoclonal antibodies and cytotoxic agents. The increasing incidence of cancer and rising approval of targeted biologic therapies continue to support segment leadership. Hospitals and oncology centers prefer lyophilized drugs for precise dosing and long-term storage. Additionally, improvements in freeze-drying processes ensure better formulation integrity, minimizing degradation. Strong collaborations between biotech firms and CDMOs across Europe further sustain dominance. Continuous innovations in lyophilized packaging and filling lines also contribute to market stability and quality assurance.
The anti-infectives segment is projected to grow at the fastest rate of 11.2% CAGR from 2025 to 2032, driven by surging demand for effective antibiotic and antiviral treatments. The resurgence of infectious diseases and rising antimicrobial resistance across Europe have increased the need for stable and potent injectable drugs. Lyophilized formulations of anti-infectives are widely used due to their long shelf life and ability to maintain efficacy under challenging storage conditions. The segment benefits from robust public health initiatives promoting access to essential antibiotics. Moreover, the shift toward hospital-based infection management and post-surgical infection control enhances demand. Continuous R&D for broad-spectrum anti-infectives, coupled with investments in sterile manufacturing infrastructure, supports segment expansion. The European Commission’s focus on ensuring medicine supply resilience post-COVID has also encouraged production of lyophilized anti-infectives domestically.
- By Form
On the basis of form, the market is segmented into powder and liquid. The powder segment dominated the largest market revenue share of 64.5% in 2024, driven by its superior stability and ability to extend drug shelf life. Powder formulations are ideal for biologics, peptides, and vaccines that require long-term preservation without degradation. The segment benefits from the increasing adoption of biologic therapies and temperature-sensitive drugs that demand stable formulations. Hospitals and pharmacies prefer powder lyophilized forms for flexible reconstitution, dosage control, and reduced wastage. Manufacturers also favor powders for simplified transport and storage under low-temperature conditions. Europe’s advanced freeze-drying infrastructure and stringent quality regulations sustain powder dominance. Additionally, powder forms allow for flexible packaging in vials, syringes, and cartridges, providing pharmaceutical companies versatility in delivery formats. Their compatibility with high-value biologics and ease of reconstitution maintain their leadership.
The liquid segment is expected to witness the fastest growth rate of 9.1% CAGR from 2025 to 2032, propelled by increasing demand for ready-to-administer formulations in clinical and home care settings. Liquid lyophilized drugs reduce preparation time, minimize human error, and enhance convenience for healthcare professionals and patients. Pharmaceutical companies are focusing on liquid formulations to address patient compliance and minimize reconstitution steps. The trend of developing long-acting injectables and prefilled syringes supports growth in this segment. Additionally, the adoption of cold chain technologies and aseptic filling systems has improved liquid drug stability. The European market is witnessing strong uptake of liquid biologics for autoimmune and metabolic diseases. The convenience, ease of administration, and time efficiency offered by these formulations make them highly attractive in outpatient care and emergency use scenarios.
- By Indication
On the basis of indication, the market is segmented into oncology, autoimmune diseases, hormonal disorders, respiratory diseases, gastrointestinal disorders, dermatological disorders, ophthalmic diseases, and others. The oncology segment dominated the largest revenue share of 41.8% in 2024, attributed to the high prevalence of cancer and the extensive use of lyophilized biologics in chemotherapy. Lyophilized oncology drugs offer enhanced stability, ensuring the preservation of complex molecular structures during long-term storage. The segment benefits from Europe’s strong oncology research pipeline and the increasing commercialization of targeted therapies. Hospitals and cancer care centers heavily rely on lyophilized drugs due to their precision dosing and extended shelf life. Continuous advancements in formulation technologies also improve the solubility and bioavailability of oncology injectables. The expansion of clinical trials across the EU and partnerships between biotech and pharma giants sustain market leadership. Increasing government funding for cancer treatment access further supports this segment’s dominance.
The autoimmune diseases segment is projected to witness the fastest CAGR of 10.6% from 2025 to 2032, driven by the rising burden of chronic conditions such as rheumatoid arthritis, psoriasis, and multiple sclerosis. Biopharmaceutical companies increasingly develop lyophilized monoclonal antibodies and biologics for autoimmune disorders due to their stability and efficacy. The growing preference for self-administered injections among patients with long-term conditions boosts segment adoption. Furthermore, the rising use of dual-chamber syringes for easy reconstitution aligns with patient convenience trends. The European market’s focus on biologic innovation and favorable reimbursement frameworks further accelerate growth. As more biosimilars enter the market, demand for cost-efficient lyophilized formulations continues to expand. This segment’s evolution is reinforced by the growing shift toward home-based management of chronic autoimmune diseases across Europe.
- By Route of Administration
On the basis of route of administration, the market is segmented into intravenous/infusion, intramuscular, and others. The intravenous/infusion segment held the largest market share of 56.2% in 2024, primarily due to its widespread use for rapid drug delivery and precise dosage control in hospitals. IV administration is preferred for oncology, anti-infective, and anesthetic drugs requiring immediate therapeutic effect. Lyophilized formulations are reconstituted and administered intravenously to ensure efficacy and safety. The segment benefits from Europe’s advanced hospital infrastructure and high patient volume in acute and critical care units. Additionally, the strong adoption of automated infusion pumps and closed system transfer devices enhances IV delivery efficiency. The reliability of intravenous routes for controlled drug delivery ensures continued preference among healthcare providers. Regulatory approvals for IV biologics further consolidate this segment’s leadership.
The intramuscular segment is projected to record the fastest growth rate of 9.8% CAGR from 2025 to 2032, supported by increasing use in vaccines, hormonal therapies, and long-acting injectables. Intramuscular delivery offers convenience, reduced administration time, and longer therapeutic effect compared to IV injections. The growing trend toward home healthcare and outpatient treatment fosters adoption of IM formulations. Pharmaceutical companies are developing more lyophilized injectables compatible with prefilled syringes for intramuscular use. The segment is also driven by widespread vaccination initiatives and the demand for depot formulations in Europe. Furthermore, technological innovations improving absorption and pain reduction during IM administration enhance patient compliance. The convenience and minimal clinical supervision required make IM delivery highly suitable for chronic disease management and preventive care.
- By End User
On the basis of end user, the market is segmented into hospitals, clinics, home healthcare, and others. The hospital segment held the largest market share of 48.7% in 2024, primarily due to the high patient influx for complex treatments requiring lyophilized drug reconstitution and administration. Hospitals are the key centers for the use of lyophilized injectables in oncology, anti-infective therapies, and biologics due to their stringent storage and handling infrastructure. The availability of trained personnel, aseptic facilities, and advanced cold-chain management ensures product stability and efficacy. Growing demand for precision dosing in critical care, coupled with the rising incidence of chronic diseases such as cancer and autoimmune disorders, further supports segment dominance. Additionally, favorable reimbursement frameworks, along with increasing adoption of ready-to-use lyophilized formulations in hospital pharmacies, enhance utilization. Continuous investments in hospital pharmacy automation and sterile compounding technologies also contribute to maintaining the segment’s leadership position.
The home healthcare segment is projected to register the fastest CAGR of 10.2% from 2025 to 2032, driven by the increasing preference for self-administration and remote patient management. The growing burden of chronic conditions and the push toward reducing hospital stays are accelerating demand for lyophilized drugs that can be reconstituted at home. The availability of prefilled syringes and user-friendly lyophilized formulations compatible with pen injectors support broader adoption. Home healthcare providers are focusing on cost-effective injectable solutions and improved patient compliance. The expanding elderly population, rising healthcare costs, and technological advancements in portable administration devices are major growth drivers. Furthermore, strategic partnerships between pharmaceutical manufacturers and home infusion service providers are enhancing accessibility and safety.
- By Distribution Channel
On the basis of distribution channel, the market is segmented into direct tender, retail sales, and others. The direct tender segment accounted for the largest market share of 61.3% in 2024, owing to bulk procurement by hospitals and healthcare institutions through government and group purchasing organizations. This channel ensures stable supply and consistent pricing for critical lyophilized injectables used in large-scale therapeutic areas, including oncology, infectious diseases, and anesthesia. Manufacturers prefer direct tender distribution to maintain quality assurance and cold-chain control throughout delivery. The rising emphasis on centralized hospital purchasing systems and strategic supplier agreements further strengthens the dominance of this segment. Additionally, supportive government initiatives promoting hospital procurement efficiency and the rising integration of electronic tendering systems are improving transparency and supply reliability.
The retail sales segment is projected to record the fastest CAGR of 9.5% from 2025 to 2032, supported by the increasing availability of specialty injectables through retail and online pharmacies. The segment’s growth is driven by the rising adoption of home-based treatments and the growing accessibility of lyophilized injectables for chronic disease management outside hospital settings. Retail pharmacies are expanding their cold-chain logistics capabilities to store temperature-sensitive formulations safely. The surge in e-pharmacy platforms offering prescription-based injectable delivery further boosts market penetration. Moreover, patient awareness campaigns and pharmaceutical partnerships with retail distributors enhance brand visibility and product reach. The convenience, cost-effectiveness, and growing consumer trust in licensed pharmacy channels position this segment as the most rapidly expanding distribution mode over the forecast period.
Europe Lyophilized Injectable Drugs Market Regional Analysis
- The Europe lyophilized injectable drugs market is projected to expand at a substantial CAGR throughout the forecast period, driven by the increasing demand for biologics, vaccines, and temperature-stable injectable formulations
- The region’s well-established pharmaceutical infrastructure, coupled with advancements in lyophilization technologies, is fostering market growth
- In addition, the rise in chronic diseases and the growing focus on patient safety and product shelf-life are further propelling the adoption of lyophilized injectables across Europe
U.K. Lyophilized Injectable Drugs Market Insight
The U.K. lyophilized injectable drugs market dominated the Europe lyophilized injectable drugs market with the largest revenue share of 47% in 2024, driven by robust biopharmaceutical production, a strong presence of major pharmaceutical companies, and growing R&D investments in biologics and vaccines. The country’s well-developed regulatory framework and focus on innovation are supporting the adoption of advanced lyophilization techniques. Moreover, the increasing demand for stable drug formulations and the growing trend of outsourcing manufacturing to contract development and manufacturing organizations (CDMOs) are expected to further strengthen market growth in the U.K.
Germany Lyophilized Injectable Drugs Market Insight
Germany lyophilized injectable drugs market is expected to be the fastest-growing market for lyophilized injectable drugs in Europe during the forecast period, owing to increasing urbanization, expanding healthcare infrastructure, and rising investments by global pharma companies. The country’s emphasis on pharmaceutical innovation, coupled with advancements in automation and freeze-drying technologies, is supporting the market’s rapid expansion. In addition, the growing demand for biologics and biosimilars, along with supportive government initiatives for pharmaceutical manufacturing, is expected to further propel the adoption of lyophilized injectable drugs in Germany.
Europe Lyophilized Injectable Drugs Market Share
The Lyophilized Injectable Drugs industry is primarily led by well-established companies, including:
• Vetter (Germany)
• Lonza (Switzerland)
• Recipharm (Sweden)
• Catalent (Belgium)
• Fresenius Kabi (Germany)
• IDT Biologika (Germany)
• Thermo Fisher Scientific Inc. (U.K.)
• PCI Pharma Services (U.K.)
• Wacker Biotech (Germany)
• Siegfried Holding AG (Switzerland)
Latest Developments in Europe Lyophilized Injectable Drugs Market
- In February 2023, CARBOGEN AMCIS (Switzerland/France) announced the opening of its new sterile injectable drug product manufacturing facility in Saint-Beauzire, France, designed to support the production of liquid and lyophilized formulations for clinical and commercial supply. The facility includes state-of-the-art freeze-drying equipment and aseptic filling lines, strengthening Europe’s capacity for complex injectable manufacturing
- In January 2022, Vetter Pharma-Fertigung GmbH & Co. KG received manufacturing authorization for its new clinical production site in Rankweil, Austria, expanding its capacity for aseptic and lyophilized injectable drug production. The expansion enhances Vetter’s ability to serve European and global clients with high-quality sterile injectables
- In May 2025, FAMAR Group announced the acquisition of MiP Pharma GmbH’s sterile production site in Homburg (Saarland), Germany, which specializes in the production of lyophilized and sterile liquid pharmaceutical products. This acquisition strengthens FAMAR’s footprint in the European injectable manufacturing market and enhances its CDMO service portfolio
SKU-

- Interactive Data Analysis Dashboard
- Company Analysis Dashboard for high growth potential opportunities
- Research Analyst Access for customization & queries
- Competitor Analysis with Interactive dashboard
- Latest News, Updates & Trend analysis
- Harness the Power of Benchmark Analysis for Comprehensive Competitor Tracking
Data collection and base year analysis are done using data collection modules with large sample sizes. The stage includes obtaining market information or related data through various sources and strategies. It includes examining and planning all the data acquired from the past in advance. It likewise envelops the examination of information inconsistencies seen across different information sources. The market data is analysed and estimated using market statistical and coherent models. Also, market share analysis and key trend analysis are the major success factors in the market report. To know more, please request an analyst call or drop down your inquiry.
The key research methodology used by DBMR research team is data triangulation which involves data mining, analysis of the impact of data variables on the market and primary (industry expert) validation. Data models include Vendor Positioning Grid, Market Time Line Analysis, Market Overview and Guide, Company Positioning Grid, Patent Analysis, Pricing Analysis, Company Market Share Analysis, Standards of Measurement, Global versus Regional and Vendor Share Analysis. To know more about the research methodology, drop in an inquiry to speak to our industry experts.
Data Bridge Market Research is a leader in advanced formative research. We take pride in servicing our existing and new customers with data and analysis that match and suits their goal. The report can be customized to include price trend analysis of target brands understanding the market for additional countries (ask for the list of countries), clinical trial results data, literature review, refurbished market and product base analysis. Market analysis of target competitors can be analyzed from technology-based analysis to market portfolio strategies. We can add as many competitors that you require data about in the format and data style you are looking for. Our team of analysts can also provide you data in crude raw excel files pivot tables (Fact book) or can assist you in creating presentations from the data sets available in the report.


