
Europe Mass Spectrometry Market
Market Size in USD Billion
 USD
1.81 Billion
USD
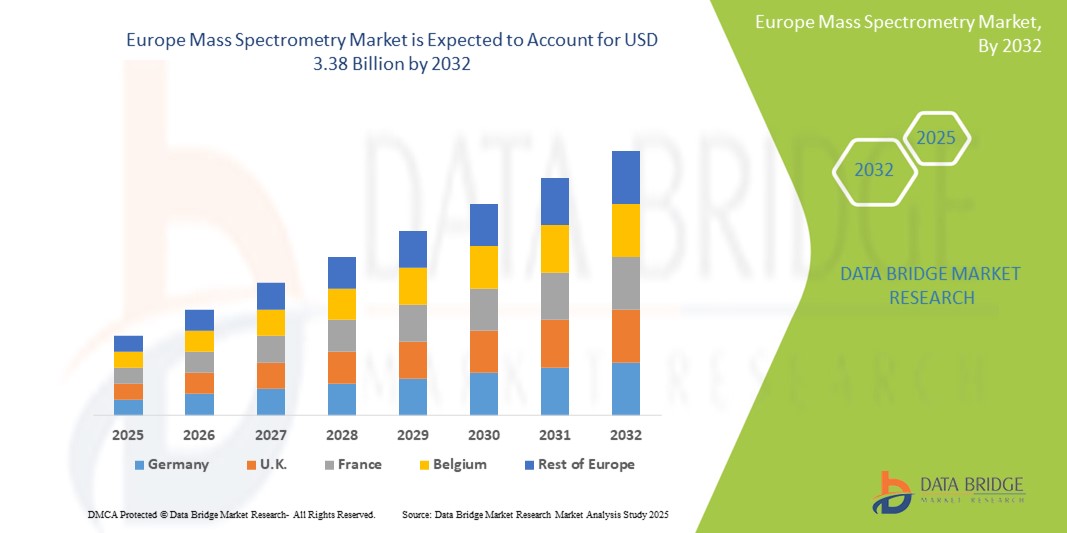
3.38 Billion
2024
2032
USD
1.81 Billion
USD
3.38 Billion
2024
2032
| 2025 - 2032 | |
| USD 1.81 Billion | |
| USD 3.38 Billion | |
| % | |
|
Europe Mass Spectrometry Market Size
- The Europe mass spectrometry market size was valued at USD 1.81 billion in 2024 and is expected to reach USD 3.38 billion by 2032, at a CAGR of 8.10% during the forecast period
- The market growth is largely fueled by increased demand for advanced analytical techniques across pharmaceutical, biotechnology, food safety, and environmental testing sectors, which rely heavily on precision instrumentation such as mass spectrometry
- Furthermore, rising R&D expenditure, coupled with supportive government initiatives and growing applications in clinical diagnostics and proteomics, is positioning mass spectrometry as a cornerstone analytical tool in Europe. These converging factors are accelerating the adoption of mass spectrometry technologies, thereby significantly boosting the industry's growth
Europe Mass Spectrometry Market Analysis
- Mass spectrometry, a powerful analytical technique used to identify and quantify compounds by mass, has become an essential tool across various sectors in Europe, including pharmaceuticals, biotechnology, food safety, and environmental testing, owing to its high accuracy, sensitivity, and versatility in complex sample analysis
- The escalating demand for mass spectrometry is primarily fueled by rising R&D investments, the growing prevalence of chronic diseases necessitating advanced diagnostics, and strict regulatory requirements for product testing and validation across industries
- Germany dominated the mass spectrometry market with the largest revenue share of 29.9% in 2024, characterized by a robust pharmaceutical and life sciences sector, well-established academic research institutions, and significant government and private investments in precision medicine and analytical technologies
- Poland is expected to be the fastest-growing country in the mass spectrometry market during the forecast period, registering a CAGR of 9.7%, driven by increasing governmental support, rapid modernization of healthcare infrastructure, and growing involvement in EU-funded clinical and life sciences research programs
- The hybrid mass spectrometry segment dominated the market with a share of 39.1% in 2024, driven by its advanced capabilities in delivering high-resolution, accurate mass data, and its growing adoption in proteomics and metabolomics research across academic and industrial laboratories
Report Scope and Europe Mass Spectrometry Market Segmentation
|
Attributes |
Europe Mass Spectrometry Key Market Insights |
|
Segments Covered |
|
|
Countries Covered |
Europe
|
|
Key Market Players |
|
|
Market Opportunities |
|
|
Value Added Data Infosets |
In addition to the insights on market scenarios such as market value, growth rate, segmentation, geographical coverage, and major players, the market reports curated by the Data Bridge Market Research also include in-depth expert analysis, pricing analysis, brand share analysis, consumer survey, demography analysis, supply chain analysis, value chain analysis, raw material/consumables overview, vendor selection criteria, PESTLE Analysis, Porter Analysis, and regulatory framework. |
Europe Mass Spectrometry Market Trends
“Advancements in Hybrid and High-Resolution Systems for Precision Applications”
- A significant and accelerating trend in the Europe mass spectrometry market is the growing adoption of hybrid and high-resolution mass spectrometry systems, driven by increasing demand for precise and comprehensive molecular analysis across pharmaceutical, clinical, and environmental sectors
- For instance, Thermo Fisher Scientific’s Orbitrap Exploris series and SCIEX’s TripleTOF systems are widely used in Europe for high-resolution, high-throughput applications, particularly in proteomics and metabolomics research. These systems allow researchers to simultaneously achieve sensitivity, accuracy, and speed—critical for drug discovery, biomarker identification, and complex sample analysis
- The increasing deployment of high-resolution mass spectrometry in clinical diagnostics is also evident, particularly in university hospitals and centralized labs in Germany, France, and the U.K. These tools are being utilized to support early disease detection, therapeutic drug monitoring, and personalized medicine initiatives
- Moreover, integration with advanced software solutions powered by artificial intelligence and machine learning is enhancing data analysis and workflow automation. Vendors such as Bruker and Agilent Technologies are investing in AI-driven platforms to streamline data interpretation and deliver actionable insights faster
- This trend toward high-performance, intelligent, and application-specific systems is reshaping the expectations of laboratories and research institutions across Europe. As regulatory bodies increase analytical demands in food testing and environmental safety, the need for accurate and high-resolution data from mass spectrometry systems becomes paramount
- Consequently, the demand for advanced hybrid instruments, offering multi-dimensional separation and accurate mass detection, continues to rise across European pharmaceutical companies, CROs, and academic research centers
Europe Mass Spectrometry Market Dynamics
Driver
“Rising Research Funding and Regulatory Demand Across Industries”
- The growing volume of research activities supported by national and EU-level funding initiatives, coupled with increasing regulatory pressure for high-quality analytical data in pharmaceuticals, environmental safety, and food testing, is a key driver propelling the mass spectrometry market in Europe
- For instance, the Horizon Europe framework (2021–2027) allocates significant funding for life sciences and environmental projects that rely on high-end analytical technologies. Germany and the Netherlands have particularly benefited from this funding, boosting the adoption of mass spectrometry in drug development and bioanalytical labs
- Stricter European Food Safety Authority (EFSA) and European Medicines Agency (EMA) guidelines also require sensitive and specific detection capabilities, which are increasingly being fulfilled through advanced mass spectrometry solutions
- Moreover, pharmaceutical and biotechnology firms are leveraging mass spectrometry for quality control, impurity profiling, and validation in both R&D and manufacturing workflows. The widespread need for compliance and robust documentation further strengthens the case for mass spectrometry systems
- The increasing adoption of precision medicine and molecular diagnostics, supported by regional initiatives in countries such as France and Sweden, is further driving the use of MS-based workflows in clinical laboratories and hospitals
Restraint/Challenge
“High Cost and Technical Complexity Limiting Adoption in Smaller Laboratories”
- Despite its analytical advantages, the high capital investment and maintenance costs associated with advanced mass spectrometry systems remain a significant restraint, particularly for smaller academic institutions and mid-sized diagnostic laboratories
- For instance, high-end hybrid mass spectrometers such as Q-TOF or Orbitrap can cost upwards of USD 400,000, excluding additional costs for sample preparation equipment, software, and service contracts. This financial burden is often difficult to justify without substantial external funding or commercial returns
- In addition, the complexity of system operation and the need for highly trained personnel can hinder mass spectrometry adoption in smaller labs or those with limited expertise. Users must navigate complex calibration, data processing, and method development tasks, often requiring months of training
- While vendors such as Bruker and Waters are investing in simplified workflows and cloud-based data analysis platforms to ease this burden, the technical barrier remains a concern. Furthermore, procurement cycles in publicly funded research institutes can be lengthy, delaying adoption even when demand exists
- To overcome these challenges, expanding access to training, promoting shared core facilities, and offering cost-effective models such as instrument leasing or modular upgrades will be essential for broadening market access across the European research and diagnostics landscape
Europe Mass Spectrometry Market Scope
The market is segmented on the basis of technology, modality, application, end user, and distribution channel.
- By Technology
On the basis of technology, the Europe mass spectrometry market is segmented into hybrid mass spectrometry, single mass spectrometry, and others. The hybrid mass spectrometry segment dominated the market with the largest market revenue share of 39.1% in 2024, driven by its advanced capabilities in delivering high-resolution, accurate mass data and its widespread adoption in pharmaceutical research, proteomics, and complex molecular analysis. Laboratories across Germany, France, and the U.K. are investing in hybrid systems such as Q-TOF and Orbitrap due to their precision and ability to handle multifaceted samples.
The single mass spectrometry segment is anticipated to witness the fastest growth rate of 8.9% from 2025 to 2032, fueled by rising demand in routine applications such as food safety and environmental testing. Single quadrupole and time-of-flight instruments are increasingly favored by small to mid-sized labs for their cost-effectiveness, ease of operation, and regulatory compliance capabilities
- By Modality
On the basis of modality, the Europe mass spectrometry market is segmented into benchtop and standalone systems. The benchtop segment held the largest market revenue share in 2024, driven by the increasing need for compact, efficient, and integrated analytical solutions within space-constrained laboratory environments. Benchtop instruments are popular in academic research and pharmaceutical labs for their advanced performance coupled with smaller footprints.
The standalone segment is expected to witness the fastest CAGR from 2025 to 2032, supported by its use in centralized research facilities and reference laboratories where advanced standalone capabilities are essential for high-volume, high-accuracy testing across multiple sample types.
- By Application
On the basis of application, the Europe mass spectrometry market is segmented into life science research, drug discovery, environmental testing, food testing, applied industries, clinical diagnostics, and others. The life science research segment dominated the market with the largest market revenue share of 28.2% in 2024, driven by increasing investments in proteomics, metabolomics, and genomics across major European research institutions and universities. Mass spectrometry is playing a central role in understanding disease mechanisms and molecular interactions in countries such as Germany and the Netherlands.
The clinical diagnostics segment is expected to witness the fastest CAGR from 2025 to 2032, fueled by expanding adoption of MS-based tools for disease biomarker detection, therapeutic drug monitoring, and personalized medicine initiatives in hospital settings, particularly in France and Sweden.
- By Application
On the basis of end user, the Europe mass spectrometry market is segmented into pharmaceutical industry, research and academic institutes, food & beverage industry, petrochemical industry, and others. The pharmaceutical industry segment dominated the market with the largest market revenue share of 34.7% in 2024, driven by the vital role of mass spectrometry in drug development, quality assurance, and impurity profiling. Major pharmaceutical hubs in Germany, Switzerland, and the U.K. are leading adopters due to ongoing drug discovery and regulatory requirements.
The research and academic institutes segment is expected to witness the fastest CAGR from 2025 to 2032, fueled by increasing public and private research funding, development of new university research programs, and the use of MS technologies in omics-based academic research.
- By Distribution Channel
On the basis of distribution channel, the Europe mass spectrometry market is segmented into direct tenders, retail sales, and others. The direct tenders segment held the largest market revenue share in 2024, driven by large-scale procurement by public health institutions, research labs, and universities through structured government bidding processes. Countries such as Italy and Spain dominate this channel due to centralized procurement strategies in public sector facilities.
The retail sales segment is expected to witness the fastest CAGR from 2025 to 2032, fueled by the rising presence of specialized equipment distributors and digital platforms offering flexible purchasing options for small labs and private institutions with moderate equipment budgets.
Europe Mass Spectrometry Market Regional Analysis
- Germany dominated the mass spectrometry market with the largest revenue share of 29.9% in 2024, characterized by a robust pharmaceutical and life sciences sector, well-established academic research institutions, and significant government and private investments in precision medicine and analytical technologies
- Researchers and laboratories in Germany place high value on the precision, analytical depth, and regulatory compliance offered by advanced mass spectrometry technologies, particularly in drug development, environmental testing, and proteomics
- This widespread adoption is further supported by substantial government funding for research, a robust infrastructure for healthcare and diagnostics, and a high concentration of global analytical instrument manufacturers, establishing mass spectrometry as a cornerstone technology in German scientific and industrial applications
The Germany Mass Spectrometry Market Insight
The Germany mass spectrometry market captured the largest revenue share in Europe in 2024, supported by the country's leadership in pharmaceutical manufacturing, academic research, and diagnostic services. German institutions prioritize high-end analytical instrumentation for drug development, proteomics, and quality control. Strong public funding, innovation-driven policies, and collaborations between academia and industry significantly contribute to mass spectrometry adoption across both public and private labs.
France Mass Spectrometry Market Insight
The France mass spectrometry market is expected to grow at a notable CAGR during the forecast period, fueled by increasing investment in clinical research, diagnostics, and food safety. France’s focus on biomedical innovation and government-backed health initiatives is encouraging the use of high-resolution mass spectrometry for disease detection, biomarker research, and regulatory testing. Moreover, the presence of several global pharmaceutical firms supports demand for robust analytical platforms.
U.K. Mass Spectrometry Market Insight
The U.K. mass spectrometry market is projected to expand steadily over the forecast period, driven by ongoing advancements in biotechnology, government research funding, and growing demand for personalized medicine. The country’s strong academic network and established pharmaceutical industry are key adopters of mass spectrometry systems for proteomics, drug discovery, and clinical applications. The U.K.’s emphasis on innovation and digital health continues to drive integration of mass spectrometry in lab workflows.
Poland Mass Spectrometry Market Insight
The Poland mass spectrometry market is expected to register the fastest growth rates in Europe through the forecast period with a CAGR of 9.7%. This growth is driven by increasing healthcare modernization, investments in clinical and environmental testing infrastructures, and Poland’s active participation in EU-funded research projects. Polish government initiatives aimed at enhancing laboratory capabilities, alongside rising demand for advanced analytical testing in food safety and pharmaceuticals, are significantly fueling market expansion.
Europe Mass Spectrometry Market Share
The Europe Mass Spectrometry industry is primarily led by well-established companies, including:
- Thermo Fisher Scientific Inc. (U.S.)
- Agilent Technologies, Inc. (U.S.)
- Waters Corporation (U.S.)
- Bruker Corporation (U.S.)
- Shimadzu Corporation (Japan)
- PerkinElmer (U.S.)
- JEOL Ltd. (Japan)
- LECO Corporation (U.S.)
- Analytik Jena GmbH (Germany)
- Hitachi High-Tech Corporation (Japan)
- Danaher Corporation (U.S.)
- MKS Instruments, Inc. (U.S.)
- Biotage AB (Sweden)
- Advion, Inc. (U.S.)
- KNAUER Wissenschaftliche Geräte GmbH (Germany)
- Hiden Analytical Ltd. (U.K.)
- MassTech, Inc. (U.S.)
- Isotopx Ltd. (U.K.)
- Markes International Ltd. (U.K.)
What are the Recent Developments in Europe Mass Spectrometry Market?
- In April 2023, Bruker Corporation expanded its European operations by inaugurating a new high-performance mass spectrometry applications center in Bremen, Germany. This facility aims to enhance customer training, support, and instrument demonstrations for Bruker’s advanced mass spectrometry platforms, including its timsTOF and MALDI product lines. The investment highlights Bruker’s commitment to strengthening its presence in Europe while fostering collaborative research in proteomics, metabolomics, and clinical diagnostics
- In March 2023, Thermo Fisher Scientific launched a new version of its Orbitrap Exploris mass spectrometer tailored for biopharmaceutical applications at its R&D center in the U.K. The upgrade offers enhanced resolution and faster acquisition speeds to meet the growing demands of complex biologics characterization. This development underscores Thermo Fisher’s strategy to support Europe’s biopharma sector with precision analytical tools designed to comply with stringent regulatory requirements
- In February 2023, Agilent Technologies announced a collaboration with the University of Amsterdam to advance research in mass spectrometry-based metabolomics. The partnership focuses on using high-resolution mass spectrometry systems for data-rich applications in biomedical sciences and environmental toxicology. This initiative reinforces Agilent’s role in supporting academic research and demonstrates the growing influence of collaborative R&D efforts across Europe
- In January 2023, Waters Corporation introduced the Xevo TQ Absolute system across several European laboratories, including institutions in France and Italy. Designed to deliver ultra-sensitive quantitation with minimal sample volumes, this triple quadrupole mass spectrometer is gaining traction in pharmaceutical QA/QC workflows and clinical labs. The launch represents Waters' focus on developing high-efficiency instruments to meet the region's evolving analytical testing demands
- In January 2023, SCIEX partnered with the European Bioinformatics Institute (EMBL-EBI) to integrate advanced software tools with mass spectrometry platforms. This partnership aims to improve data analysis pipelines for proteomic and metabolomic research in public health and drug discovery. The collaboration reflects the increasing role of software-driven innovation in expanding the capabilities of MS systems across Europe
SKU-

- Interactive Data Analysis Dashboard
- Company Analysis Dashboard for high growth potential opportunities
- Research Analyst Access for customization & queries
- Competitor Analysis with Interactive dashboard
- Latest News, Updates & Trend analysis
- Harness the Power of Benchmark Analysis for Comprehensive Competitor Tracking
Table of Content
1 INTRODUCTION
1.1 OBJECTIVES OF THE STUDY
1.2 MARKET DEFINITION
1.3 OVERVIEW OF EUROPE MASS SPECTROMETRY MARKET
1.4 MARKETS COVERED
2 MARKET SEGMENTATION
2.1 MARKETS COVERED
2.2 GEOGRAPHICAL SCOPE
2.3 YEARS CONSIDERED FOR THE STUDY
2.4 CURRENCY AND PRICING
2.5 DBMR TRIPOD DATA VALIDATION MODEL
2.6 MULTIVARIATE MODELLING
2.7 PRIMARY INTERVIEWS WITH KEY OPINION LEADERS
2.8 DBMR MARKET POSITION GRID
2.9 VENDOR SHARE ANALYSIS
2.1 MARKET END USER COVERAGE GRID
2.11 SECONDARY SOURCES
2.12 ASSUMPTIONS
3 EXECUTIVE SUMMARY
4 PREMIUM INSIGHTS
4.1 PESTEL ANALYSIS
4.2 PORTERS FIVE FORCES ANALYSIS
5 EUROPE MASS SPECTROMETRY MARKET: REGULATIONS
5.1 REGULATORY AUTHORITIES IN NORTH AMERICA
5.2 REGULATORY AUTHORITIES IN SOUTH AMERICA
5.3 REGULATORY AUTHORITIES IN EUROPE
5.4 REGULATORY AUTHORITIES IN MIDDLE EAST AND AFRICA.
5.5 REGULATORY AUTHORITIES IN ASIA PACIFIC.
6 MARKET OVERVIEW
6.1 DRIVERS
6.1.1 TECHNOLOGICAL ADVANCEMENTS IN MASS SPECTROMETRY
6.1.2 GROWING APPLICATIONS OF MASS SPECTROMETRY (MS) IN PHARMACEUTICALS AND BIOTECHNOLOGY
6.1.3 DEMAND OF MASS SPECTROMETRY IN ENVIRONMENTAL TESTING AND FOOD SAFETY
6.1.4 ADVANCEMENTS IN PROTEOMICS AND GENOMICS RESEARCH
6.2 RESTRAINTS
6.2.1 HIGH COST OF MASS SPECTROMETRY
6.2.2 COMPETITION FROM ALTERNATIVE TECHNOLOGIES
6.3 OPPORTUNITIES
6.3.1 ADVANCEMENTS IN AUTOMATION AND ARTIFICIAL INTELLIGENCE (AI) IN MASS SPECTROMETRY
6.3.2 GROWING ADOPTION IN CLINICAL LABS
6.3.3 RISING ADOPTION OF COMPACT AND PORTABLE MASS SPECTROMETERS
6.4 CHALLENGES
6.4.1 SKILLED WORKFORCE SHORTAGE
6.4.2 EFFECTIVELY MANAGING AND STORING LARGE VOLUMES OF DATA
7 EUROPE MASS SPECTROMETRY MARKET, BY TECHNOLOGY
7.1 OVERVIEW
7.2 HYBRID MASS SPECTROMETRY
7.2.1 ORBITRAP-MS
7.2.2 FT-MS
7.2.3 OTHERS
7.3 SINGLE MASS SPECTROMETRY
7.3.1 TIME OF FLIGHT
7.3.2 QUADRUPOLE
7.3.3 OTHERS
7.4 OTHERS
8 EUROPE MASS SPECTROMETRY MARKET, BY MODALITY
8.1 OVERVIEW
8.2 BENCHTOP
8.3 STANDALONE
9 EUROPE MASS SPECTROMETRY MARKET, BY APPLICATION
9.1 OVERVIEW
9.2 LIFE SCIENCE RESEARCH
9.3 DRUG DISCOVERY
9.4 ENVIRONMENTAL TESTING
9.5 FOOD TESTING
9.6 APPLIED INDUSTRIES
9.7 CLINICAL DIAGNOSTICS
9.8 OTHERS
10 EUROPE MASS SPECTROMETRY MARKET, BY DISTRIBUTION CHANNEL
10.1 OVERVIEW
10.2 DIRECT TENDERS
10.3 RETAIL SALES
10.4 OTHERS
11 EUROPE MASS SPECTROMETRY MARKET, BY END USER
11.1 OVERVIEW
11.2 PHARMACEUTICAL INDUSTRY
11.3 RESEARCH AND ACADEMIC INSTITUTES
11.4 FOOD & BEVERAGE INDUSTRY
11.5 PETROCHEMICAL INDUSTRY
11.6 OTHERS
12 EUROPE MASS SPECTROMETRY MARKET, BY REGION
12.1 EUROPE
12.1.1 GERMANY
12.1.2 FRANCE
12.1.3 U.K.
12.1.4 ITALY
12.1.5 SPAIN
12.1.6 RUSSIA
12.1.7 NETHERLANDS
12.1.8 SWITZERLAND
12.1.9 TURKEY
12.1.10 REST OF EUROPE
13 EUROPE MASS SPECTROMETRY MARKET, COMPANY LANDSCAPE
13.1 COMPANY SHARE ANALYSIS: EUROPE
14 SWOT ANALYSIS
15 COMPANY PROFILES
15.1 THERMO FISHER SCIENTIFIC INC.
15.1.1 COMPANY SNAPSHOT
15.1.2 REVENUE ANALYSIS
15.1.3 COMPANY SHARE ANALYSIS
15.1.4 PRODUCT PORTFOLIO
15.1.5 RECENT DEVELOPMENT
15.2 SHIMADZU CORPORATION
15.2.1 COMPANY SNAPSHOT
15.2.2 REVENUE ANALYSIS
15.2.3 COMPANY SHARE ANALYSIS
15.2.4 PRODUCT PORTFOLIO
15.2.5 RECENT DEVELOPMENTS
15.3 AGILENT TECHNOLOGIES, INC.
15.3.1 COMPANY SNAPSHOT
15.3.2 REVENUE ANALYSIS
15.3.3 COMPANY SHARE ANALYSIS
15.3.4 PRODUCT PORTFOLIO
15.3.5 RECENT UPDATES
15.4 BRUKER
15.4.1 COMPANY SNAPSHOT
15.4.2 REVENUE ANALYSIS
15.4.3 COMPANY SHARE ANALYSIS
15.4.4 PRODUCT PORTFOLIO
15.4.5 RECENT DEVELOPMENT
15.5 WATERS CORPORATION
15.5.1 COMPANY SNAPSHOT
15.5.2 REVENUE ANALYSIS
15.5.3 COMPANY SHARE ANALYSIS
15.5.4 PRODUCT PORTFOLIO
15.5.5 RECENT DEVELOPMENTS
15.6 AMETEK.INC.
15.6.1 COMPANY SNAPSHOT
15.6.2 REVENUE ANALYSIS
15.6.3 PRODUCT PORTFOLIO
15.6.4 RECENT DEVELOPMENT
15.7 DANAHER CORPORATION
15.7.1 COMPANY SNAPSHOT
15.7.2 REVENUE ANALYSIS
15.7.3 PRODUCT PORTFOLIO
15.7.4 RECENT DEVELOPMENTS
15.8 HIDEN ANALYTICAL
15.8.1 COMPANY SNAPSHOT
15.8.2 PRODUCT PORTFOLIO
15.8.3 RECENT DEVELOPMENTS
15.9 HITACHI, LTD.B(SUBSIDIARIE COMPANY HITACHI HIGH-TECH INDIA PRIVATE LIMITED)
15.9.1 COMPANY SNAPSHOT
15.9.2 REVENUE ANALYSIS
15.9.3 PRODUCT PORTFOLIO
15.9.4 RECENT DEVELOPMENT
15.1 JEOL LTD.
15.10.1 COMPANY SNAPSHOT
15.10.2 REVENUE ANALYSIS
15.10.3 PRODUCT PORTFOLIO
15.10.4 RECENT DEVELOPMENT
15.11 KORE TECHNOLOGY
15.11.1 COMPANY SNAPSHOT
15.11.2 PRODUCT PORTFOLIO
15.11.3 RECENT DEVELOPMENT
15.12 LECO CORPORATION
15.12.1 COMPANY SNAPSHOT
15.12.2 PRODUCT PORTFOLIO
15.12.3 RECENT UPDATES
15.13 PERKINELMER INC
15.13.1 COMPANY SNAPSHOT
15.13.2 REVENUE ANALYSIS
15.13.3 PRODUCT PORTFOLIO
15.13.4 RECENT DEVELOPMENT
15.14 RIGAKU HOLDINGS CORPORATION
15.14.1 COMPANY SNAPSHOT
15.14.2 PRODUCT PORTFOLIO
15.14.3 RECENT DEVELOPMENT
16 QUESTIONNAIRE
17 RELATED REPORTS
List of Table
TABLE 1 EUROPE MASS SPECTROMETRY MARKET, BY TECHNOLOGY, 2022-2031 (USD THOUSAND)
TABLE 2 EUROPE HYBRID MASS SPECTROMETRY IN MASS SPECTROMETRY MARKET, BY REGION, 2022-2031 (USD THOUSAND)
TABLE 3 EUROPE HYBRID MASS SPECTROMETRY IN MASS SPECTROMETRY MARKET, BY TYPE, 2022-2031 (USD THOUSAND)
TABLE 4 EUROPE SINGLE MASS SPECTROMETRY IN MASS SPECTROMETRY MARKET, BY REGION, 2022-2031 (USD THOUSAND)
TABLE 5 EUROPE SINGLE MASS SPECTROMETRY IN MASS SPECTROMETRY MARKET, BY TYPE, 2022-2031 (USD THOUSAND)
TABLE 6 EUROPE OTHERS IN MASS SPECTROMETRY MARKET, BY REGION, 2022-2031 (USD THOUSAND)
TABLE 7 EUROPE MASS SPECTROMETRY MARKET, BY MODALITY, 2022-2031 (USD THOUSAND)
TABLE 8 EUROPE BENCHTOP IN MASS SPECTROMETRY MARKET, BY REGION, 2022-2031 (USD THOUSAND)
TABLE 9 EUROPE STANDALONE IN MASS SPECTROMETRY MARKET, BY REGION, 2022-2031 (USD THOUSAND)
TABLE 10 EUROPE MASS SPECTROMETRY MARKET, BY APPLICATION, 2022-2031 (USD THOUSAND)
TABLE 11 EUROPE LIFE SCIENCE RESEARCH IN MASS SPECTROMETRY MARKET, BY REGION, 2022-2031 (USD THOUSAND)
TABLE 12 EUROPE DRUG DISCOVERY IN MASS SPECTROMETRY MARKET, BY REGION, 2022-2031 (USD THOUSAND)
TABLE 13 EUROPE ENVIRONMENTAL TESTING IN MASS SPECTROMETRY MARKET, BY REGION, 2022-2031 (USD THOUSAND)
TABLE 14 EUROPE FOOD TESTING IN MASS SPECTROMETRY MARKET, BY REGION, 2022-2031 (USD THOUSAND)
TABLE 15 EUROPE APPLIED INDUSTRIES IN MASS SPECTROMETRY MARKET, BY REGION, 2022-2031 (USD THOUSAND)
TABLE 16 EUROPE CLINICAL DIAGNOSTICS IN MASS SPECTROMETRY MARKET, BY REGION, 2022-2031 (USD THOUSAND)
TABLE 17 EUROPE OTHERS IN MASS SPECTROMETRY MARKET, BY REGION, 2022-2031 (USD THOUSAND)
TABLE 18 EUROPE MASS SPECTROMETRY MARKET, BY DISTRIBUTION CHANNEL, 2022-2031 (USD THOUSAND)
TABLE 19 EUROPE DIRECT TENDERS IN MASS SPECTROMETRY MARKET, BY REGION, 2022-2031 (USD THOUSAND)
TABLE 20 EUROPE RETAIL SALES IN MASS SPECTROMETRY MARKET, BY REGION, 2022-2031 (USD THOUSAND)
TABLE 21 EUROPE OTHERS IN MASS SPECTROMETRY MARKET, BY REGION, 2022-2031 (USD THOUSAND)
TABLE 22 EUROPE MASS SPECTROMETRY MARKET, BY END USER, 2022-2031 (USD THOUSAND)
TABLE 23 EUROPE PHARMACEUTICAL INDUSTRY IN MASS SPECTROMETRY MARKET, BY REGION, 2022-2031 (USD THOUSAND)
TABLE 24 EUROPE RESEARCH AND ACADEMIC INSTITUTES IN MASS SPECTROMETRY MARKET, BY REGION, 2022-2031 (USD THOUSAND)
TABLE 25 EUROPE FOOD & BEVERAGE INDUSTRY IN MASS SPECTROMETRY MARKET, BY REGION, 2022-2031 (USD THOUSAND)
TABLE 26 EUROPE PETROCHEMICAL INDUSTRY IN MASS SPECTROMETRY MARKET, BY REGION, 2022-2031 (USD THOUSAND)
TABLE 27 EUROPE OTHERS IN MASS SPECTROMETRY MARKET, BY REGION, 2022-2031 (USD THOUSAND)
TABLE 28 EUROPE MASS SPECTROMETRY MARKET, BY COUNTRY 2022-2031 (USD THOUSAND)
TABLE 29 EUROPE MASS SPECTROMETRY MARKET, BY TECHNOLOGY, 2022-2031 (USD THOUSAND)
TABLE 30 EUROPE HYBRID MASS SPECTROMETRY IN MASS SPECTROMETRY MARKET, BY TYPE, 2022-2031 (USD THOUSAND)
TABLE 31 EUROPE SINGLE MASS SPECTROMETRY IN MASS SPECTROMETRY MARKET, BY TYPE, 2022-2031 (USD THOUSAND)
TABLE 32 EUROPE MASS SPECTROMETRY MARKET, BY MODALITY, 2022-2031 (USD THOUSAND)
TABLE 33 EUROPE MASS SPECTROMETRY MARKET, BY APPLICATION, 2022-2031 (USD THOUSAND)
TABLE 34 EUROPE MASS SPECTROMETRY MARKET, BY END USER, 2022-2031 (USD THOUSAND)
TABLE 35 EUROPE MASS SPECTROMETRY MARKET, BY DISTRIBUTION CHANNEL, 2022-2031 (USD THOUSAND)
TABLE 36 GERMANY MASS SPECTROMETRY MARKET, BY TECHNOLOGY, 2022-2031 (USD THOUSAND)
TABLE 37 GERMANY HYBRID MASS SPECTROMETRY IN MASS SPECTROMETRY MARKET, BY TYPE, 2022-2031 (USD THOUSAND)
TABLE 38 GERMANY SINGLE MASS SPECTROMETRY IN MASS SPECTROMETRY MARKET, BY TYPE, 2022-2031 (USD THOUSAND)
TABLE 39 GERMANY MASS SPECTROMETRY MARKET, BY MODALITY, 2022-2031 (USD THOUSAND)
TABLE 40 GERMANY MASS SPECTROMETRY MARKET, BY APPLICATION, 2022-2031 (USD THOUSAND)
TABLE 41 GERMANY MASS SPECTROMETRY MARKET, BY END USER, 2022-2031 (USD THOUSAND)
TABLE 42 GERMANY MASS SPECTROMETRY MARKET, BY DISTRIBUTION CHANNEL, 2022-2031 (USD THOUSAND)
TABLE 43 FRANCE MASS SPECTROMETRY MARKET, BY TECHNOLOGY, 2022-2031 (USD THOUSAND)
TABLE 44 FRANCE HYBRID MASS SPECTROMETRY IN MASS SPECTROMETRY MARKET, BY TYPE, 2022-2031 (USD THOUSAND)
TABLE 45 FRANCE SINGLE MASS SPECTROMETRY IN MASS SPECTROMETRY MARKET, BY TYPE, 2022-2031 (USD THOUSAND)
TABLE 46 FRANCE MASS SPECTROMETRY MARKET, BY MODALITY, 2022-2031 (USD THOUSAND)
TABLE 47 FRANCE MASS SPECTROMETRY MARKET, BY APPLICATION, 2022-2031 (USD THOUSAND)
TABLE 48 FRANCE MASS SPECTROMETRY MARKET, BY END USER, 2022-2031 (USD THOUSAND)
TABLE 49 FRANCE MASS SPECTROMETRY MARKET, BY DISTRIBUTION CHANNEL, 2022-2031 (USD THOUSAND)
TABLE 50 U.K. MASS SPECTROMETRY MARKET, BY TECHNOLOGY, 2022-2031 (USD THOUSAND)
TABLE 51 U.K. HYBRID MASS SPECTROMETRY IN MASS SPECTROMETRY MARKET, BY TYPE, 2022-2031 (USD THOUSAND)
TABLE 52 U.K. SINGLE MASS SPECTROMETRY IN MASS SPECTROMETRY MARKET, BY TYPE, 2022-2031 (USD THOUSAND)
TABLE 53 U.K. MASS SPECTROMETRY MARKET, BY MODALITY, 2022-2031 (USD THOUSAND)
TABLE 54 U.K. MASS SPECTROMETRY MARKET, BY APPLICATION, 2022-2031 (USD THOUSAND)
TABLE 55 U.K. MASS SPECTROMETRY MARKET, BY END USER, 2022-2031 (USD THOUSAND)
TABLE 56 U.K. MASS SPECTROMETRY MARKET, BY DISTRIBUTION CHANNEL, 2022-2031 (USD THOUSAND)
TABLE 57 ITALY MASS SPECTROMETRY MARKET, BY TECHNOLOGY, 2022-2031 (USD THOUSAND)
TABLE 58 ITALY HYBRID MASS SPECTROMETRY IN MASS SPECTROMETRY MARKET, BY TYPE, 2022-2031 (USD THOUSAND)
TABLE 59 ITALY SINGLE MASS SPECTROMETRY IN MASS SPECTROMETRY MARKET, BY TYPE, 2022-2031 (USD THOUSAND)
TABLE 60 ITALY MASS SPECTROMETRY MARKET, BY MODALITY, 2022-2031 (USD THOUSAND)
TABLE 61 ITALY MASS SPECTROMETRY MARKET, BY APPLICATION, 2022-2031 (USD THOUSAND)
TABLE 62 ITALY MASS SPECTROMETRY MARKET, BY END USER, 2022-2031 (USD THOUSAND)
TABLE 63 ITALY MASS SPECTROMETRY MARKET, BY DISTRIBUTION CHANNEL, 2022-2031 (USD THOUSAND)
TABLE 64 SPAIN MASS SPECTROMETRY MARKET, BY TECHNOLOGY, 2022-2031 (USD THOUSAND)
TABLE 65 SPAIN HYBRID MASS SPECTROMETRY IN MASS SPECTROMETRY MARKET, BY TYPE, 2022-2031 (USD THOUSAND)
TABLE 66 SPAIN SINGLE MASS SPECTROMETRY IN MASS SPECTROMETRY MARKET, BY TYPE, 2022-2031 (USD THOUSAND)
TABLE 67 SPAIN MASS SPECTROMETRY MARKET, BY MODALITY, 2022-2031 (USD THOUSAND)
TABLE 68 SPAIN MASS SPECTROMETRY MARKET, BY APPLICATION, 2022-2031 (USD THOUSAND)
TABLE 69 SPAIN MASS SPECTROMETRY MARKET, BY END USER, 2022-2031 (USD THOUSAND)
TABLE 70 SPAIN MASS SPECTROMETRY MARKET, BY DISTRIBUTION CHANNEL, 2022-2031 (USD THOUSAND)
TABLE 71 RUSSIA MASS SPECTROMETRY MARKET, BY TECHNOLOGY, 2022-2031 (USD THOUSAND)
TABLE 72 RUSSIA HYBRID MASS SPECTROMETRY IN MASS SPECTROMETRY MARKET, BY TYPE, 2022-2031 (USD THOUSAND)
TABLE 73 RUSSIA SINGLE MASS SPECTROMETRY IN MASS SPECTROMETRY MARKET, BY TYPE, 2022-2031 (USD THOUSAND)
TABLE 74 RUSSIA MASS SPECTROMETRY MARKET, BY MODALITY, 2022-2031 (USD THOUSAND)
TABLE 75 RUSSIA MASS SPECTROMETRY MARKET, BY APPLICATION, 2022-2031 (USD THOUSAND)
TABLE 76 RUSSIA MASS SPECTROMETRY MARKET, BY END USER, 2022-2031 (USD THOUSAND)
TABLE 77 RUSSIA MASS SPECTROMETRY MARKET, BY DISTRIBUTION CHANNEL, 2022-2031 (USD THOUSAND)
TABLE 78 NETHERLANDS MASS SPECTROMETRY MARKET, BY TECHNOLOGY, 2022-2031 (USD THOUSAND)
TABLE 79 NETHERLANDS HYBRID MASS SPECTROMETRY IN MASS SPECTROMETRY MARKET, BY TYPE, 2022-2031 (USD THOUSAND)
TABLE 80 NETHERLANDS SINGLE MASS SPECTROMETRY IN MASS SPECTROMETRY MARKET, BY TYPE, 2022-2031 (USD THOUSAND)
TABLE 81 NETHERLANDS MASS SPECTROMETRY MARKET, BY MODALITY, 2022-2031 (USD THOUSAND)
TABLE 82 NETHERLANDS MASS SPECTROMETRY MARKET, BY APPLICATION, 2022-2031 (USD THOUSAND)
TABLE 83 NETHERLANDS MASS SPECTROMETRY MARKET, BY END USER, 2022-2031 (USD THOUSAND)
TABLE 84 NETHERLANDS MASS SPECTROMETRY MARKET, BY DISTRIBUTION CHANNEL, 2022-2031 (USD THOUSAND)
TABLE 85 SWITZERLAND MASS SPECTROMETRY MARKET, BY TECHNOLOGY, 2022-2031 (USD THOUSAND)
TABLE 86 SWITZERLAND HYBRID MASS SPECTROMETRY IN MASS SPECTROMETRY MARKET, BY TYPE, 2022-2031 (USD THOUSAND)
TABLE 87 SWITZERLAND SINGLE MASS SPECTROMETRY IN MASS SPECTROMETRY MARKET, BY TYPE, 2022-2031 (USD THOUSAND)
TABLE 88 SWITZERLAND MASS SPECTROMETRY MARKET, BY MODALITY, 2022-2031 (USD THOUSAND)
TABLE 89 SWITZERLAND MASS SPECTROMETRY MARKET, BY APPLICATION, 2022-2031 (USD THOUSAND)
TABLE 90 SWITZERLAND MASS SPECTROMETRY MARKET, BY END USER, 2022-2031 (USD THOUSAND)
TABLE 91 SWITZERLAND MASS SPECTROMETRY MARKET, BY DISTRIBUTION CHANNEL, 2022-2031 (USD THOUSAND)
TABLE 92 TURKEY MASS SPECTROMETRY MARKET, BY TECHNOLOGY, 2022-2031 (USD THOUSAND)
TABLE 93 TURKEY HYBRID MASS SPECTROMETRY IN MASS SPECTROMETRY MARKET, BY TYPE, 2022-2031 (USD THOUSAND)
TABLE 94 TURKEY SINGLE MASS SPECTROMETRY IN MASS SPECTROMETRY MARKET, BY TYPE, 2022-2031 (USD THOUSAND)
TABLE 95 TURKEY MASS SPECTROMETRY MARKET, BY MODALITY, 2022-2031 (USD THOUSAND)
TABLE 96 TURKEY MASS SPECTROMETRY MARKET, BY APPLICATION, 2022-2031 (USD THOUSAND)
TABLE 97 TURKEY MASS SPECTROMETRY MARKET, BY END USER, 2022-2031 (USD THOUSAND)
TABLE 98 TURKEY MASS SPECTROMETRY MARKET, BY DISTRIBUTION CHANNEL, 2022-2031 (USD THOUSAND)
TABLE 99 REST OF EUROPE MASS SPECTROMETRY MARKET, BY TECHNOLOGY, 2022-2031 (USD THOUSAND)
List of Figure
FIGURE 1 EUROPE MASS SPECTROMETRY MARKET: SEGMENTATION
FIGURE 2 EUROPE MASS SPECTROMETRY MARKET: DATA TRIANGULATION
FIGURE 3 EUROPE MASS SPECTROMETRY MARKET: DROC ANALYSIS
FIGURE 4 EUROPE MASS SPECTROMETRY MARKET: EUROPE VS REGIONAL MARKET ANALYSIS
FIGURE 5 EUROPE MASS SPECTROMETRY MARKET: COMPANY RESEARCH ANALYSIS
FIGURE 6 EUROPE MASS SPECTROMETRY MARKET: MULTIVARIATE MODELLING
FIGURE 7 EUROPE MASS SPECTROMETRY MARKET: INTERVIEW DEMOGRAPHICS
FIGURE 8 EUROPE MASS SPECTROMETRY MARKET: DBMR MARKET POSITION GRID
FIGURE 9 EUROPE MASS SPECTROMETRY MARKET: VENDOR SHARE ANALYSIS
FIGURE 10 EUROPE MASS SPECTROMETRY MARKET: MARKET END USER COVERAGE GRID
FIGURE 11 EUROPE MASS SPECTROMETRY MARKET: SEGMENTATION
FIGURE 12 EXECUTIVE SUMMARY
FIGURE 13 STRATEGIC DECISIONS
FIGURE 14 EUROPE MASS SPECTROMETRY MARKET
FIGURE 15 HYBRID MASS SPECTROMETRY SEGMENT IS EXPECTED TO ACCOUNT FOR THE LARGEST SHARE OF THE EUROPE MASS SPECTROMETRY MARKET IN 2024 & 2031
FIGURE 16 DROC ANALYSIS
FIGURE 17 EUROPE MASS SPECTROMETRY MARKET: BY TECHNOLOGY, 2023
FIGURE 18 EUROPE MASS SPECTROMETRY MARKET: BY TECHNOLOGY, 2024-2031 (USD THOUSAND)
FIGURE 19 EUROPE MASS SPECTROMETRY MARKET: BY TECHNOLOGY, CAGR (2024-2031)
FIGURE 20 EUROPE MASS SPECTROMETRY MARKET: BY TECHNOLOGY, LIFELINE CURVE
FIGURE 21 EUROPE MASS SPECTROMETRY MARKET: BY MODALITY, 2023
FIGURE 22 EUROPE MASS SPECTROMETRY MARKET: BY MODALITY, 2024-2031 (USD THOUSAND)
FIGURE 23 EUROPE MASS SPECTROMETRY MARKET: BY MODALITY, CAGR (2024-2031)
FIGURE 24 EUROPE MASS SPECTROMETRY MARKET: BY MODALITY, LIFELINE CURVE
FIGURE 25 EUROPE MASS SPECTROMETRY MARKET: BY APPLICATION, 2023
FIGURE 26 EUROPE MASS SPECTROMETRY MARKET: BY APPLICATION, 2024-2031 (USD THOUSAND)
FIGURE 27 EUROPE MASS SPECTROMETRY MARKET: BY APPLICATION, CAGR (2024-2031)
FIGURE 28 EUROPE MASS SPECTROMETRY MARKET: BY APPLICATION, LIFELINE CURVE
FIGURE 29 EUROPE MASS SPECTROMETRY MARKET: BY DISTRIBUTION CHANNEL, 2023
FIGURE 30 EUROPE MASS SPECTROMETRY MARKET: BY DISTRIBUTION CHANNEL, 2024-2031 (USD THOUSAND)
FIGURE 31 EUROPE MASS SPECTROMETRY MARKET: BY DISTRIBUTION CHANNEL, CAGR (2024-2031)
FIGURE 32 EUROPE MASS SPECTROMETRY MARKET: BY DISTRIBUTION CHANNEL, LIFELINE CURVE
FIGURE 33 EUROPE MASS SPECTROMETRY MARKET: BY END USER, 2023
FIGURE 34 EUROPE MASS SPECTROMETRY MARKET: BY END USER, 2024-2031 (USD THOUSAND)
FIGURE 35 EUROPE MASS SPECTROMETRY MARKET: BY END USER, CAGR (2024-2031)
FIGURE 36 EUROPE MASS SPECTROMETRY MARKET: BY END USER, LIFELINE CURVE
FIGURE 37 EUROPE MASS SPECTROMETRY MARKET: SNAPSHOT (2023)
FIGURE 38 EUROPE MASS SPECTROMETRY MARKET: COMPANY SHARE 2023 (%)
Data collection and base year analysis are done using data collection modules with large sample sizes. The stage includes obtaining market information or related data through various sources and strategies. It includes examining and planning all the data acquired from the past in advance. It likewise envelops the examination of information inconsistencies seen across different information sources. The market data is analysed and estimated using market statistical and coherent models. Also, market share analysis and key trend analysis are the major success factors in the market report. To know more, please request an analyst call or drop down your inquiry.
The key research methodology used by DBMR research team is data triangulation which involves data mining, analysis of the impact of data variables on the market and primary (industry expert) validation. Data models include Vendor Positioning Grid, Market Time Line Analysis, Market Overview and Guide, Company Positioning Grid, Patent Analysis, Pricing Analysis, Company Market Share Analysis, Standards of Measurement, Global versus Regional and Vendor Share Analysis. To know more about the research methodology, drop in an inquiry to speak to our industry experts.
Data Bridge Market Research is a leader in advanced formative research. We take pride in servicing our existing and new customers with data and analysis that match and suits their goal. The report can be customized to include price trend analysis of target brands understanding the market for additional countries (ask for the list of countries), clinical trial results data, literature review, refurbished market and product base analysis. Market analysis of target competitors can be analyzed from technology-based analysis to market portfolio strategies. We can add as many competitors that you require data about in the format and data style you are looking for. Our team of analysts can also provide you data in crude raw excel files pivot tables (Fact book) or can assist you in creating presentations from the data sets available in the report.


