
Europe Mobility As A Service Market
Market Size in USD Billion
 USD
71.97 Billion
USD
743.73 Billion
2025
2033
USD
71.97 Billion
USD
743.73 Billion
2025
2033
| 2026 - 2033 | |
| USD 71.97 Billion | |
| USD 743.73 Billion | |
| % | |
|
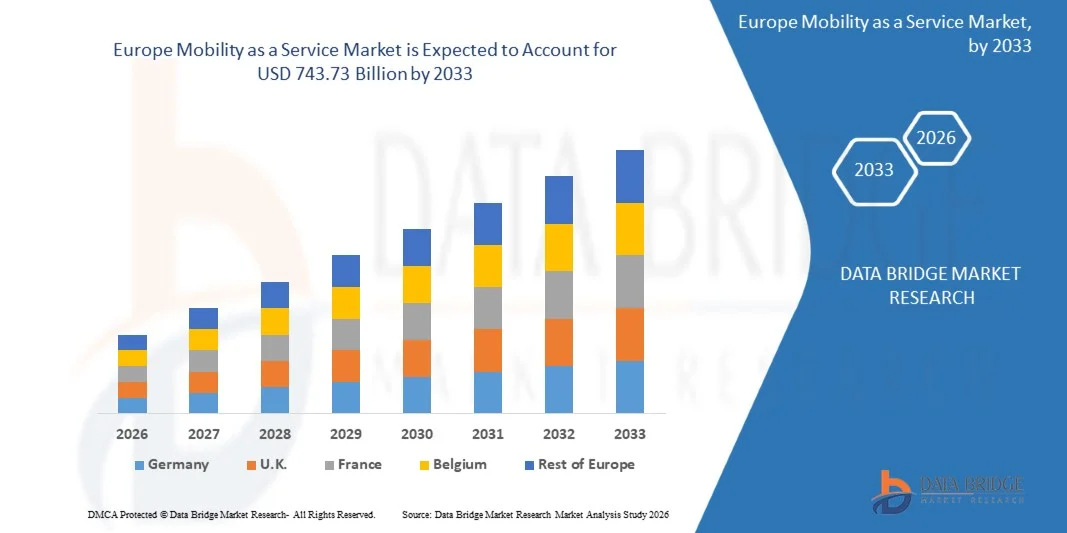
Europe Mobility as a Service Market Size
- The Europe Mobility as a Service (MaaS) Market size was valued at USD 71.97 billion in 2025 and is projected to reach USD 743.73 billion by 2033, growing at a CAGR of 33.90% during the forecast period.
- The market growth is primarily driven by increasing urbanization and the shift towards sustainable and efficient transportation solutions, coupled with advancements in digital platforms that integrate multiple modes of transport.
- Moreover, rising consumer preference for flexible, cost-effective, and seamless travel experiences is encouraging the adoption of MaaS platforms, while supportive government initiatives and investments in smart city infrastructure are further propelling market expansion.
Europe Mobility as a Service Market Analysis
- Mobility as a Service (MaaS), integrating multiple transport modes into a single digital platform, is becoming a crucial component of urban mobility in Europe due to its convenience, cost-efficiency, and ability to optimize travel through real-time data and app-based solutions.
- The rising adoption of MaaS is largely driven by increasing urbanization, the need for sustainable and efficient transportation, and growing consumer preference for flexible, on-demand travel options without the burden of private vehicle ownership.
- Germany dominated the Europe Mobility as a Service Market with the largest revenue share of 36% in 2025, supported by advanced public transportation networks, high smartphone penetration, and proactive government policies promoting smart mobility solutions, with countries such as Germany, France, and the Netherlands experiencing significant growth in MaaS subscriptions and pilot programs.
- U.K. is expected to be the fastest-growing region in the Europe Mobility as a Service Market during the forecast period due to rising urban population, increased investment in transport infrastructure, and digitalization initiatives in cities.
- The ride-hailing segment dominated the market with the largest revenue share of 38.7% in 2025, driven by the convenience of on-demand travel, app-based bookings, and real-time tracking features
Report Scope and Europe Mobility as a Service Market Segmentation
|
Attributes |
Europe Mobility as a Service Key Market Insights |
|
Segments Covered |
|
|
Countries Covered |
Europe
|
|
Key Market Players |
|
|
Market Opportunities |
|
|
Value Added Data Infosets |
In addition to the market insights such as market value, growth rate, market segments, geographical coverage, market players, and market scenario, the market report curated by the Data Bridge Market Research team includes in-depth expert analysis, import/export analysis, pricing analysis, production consumption analysis, and pestle analysis. |
Europe Mobility as a Service Market Trends
“Enhanced Convenience Through AI and Voice Integration”
- A significant and accelerating trend in the Europe Mobility as a Service (MaaS) Market is the deepening integration of artificial intelligence (AI) and popular voice-controlled ecosystems such as Amazon Alexa, Google Assistant, and Apple Siri. This fusion of technologies is enhancing user convenience, personalization, and real-time control over multi-modal transportation options.
- For instance, platforms such as Whim and Moovit are increasingly incorporating AI-powered predictive routing and voice-command capabilities, allowing users to plan trips, book rides, or check transit schedules using simple voice prompts. Similarly, Free Now’s app enables voice-activated taxi and ride-hailing requests, providing hands-free access to mobility services.
- AI integration in MaaS enables features such as learning user travel patterns to suggest optimized routes, predict demand, and provide intelligent alerts about delays or disruptions. For example, Transit and Citymapper utilize AI algorithms to suggest the fastest combination of transport modes based on real-time traffic and public transport updates.
- The seamless integration of MaaS platforms with digital assistants and broader smart city infrastructure allows centralized management of mobility options. Through a single interface, users can coordinate ride-sharing, bike rentals, e-scooters, and public transit, creating a unified and automated urban travel experience.
- This trend towards more intelligent, intuitive, and interconnected mobility systems is fundamentally reshaping user expectations for urban transport. Consequently, companies such as Moovit and Whim are developing AI-enabled MaaS solutions with features such as automatic route optimization, predictive travel time estimates, and voice control compatibility with Amazon Alexa, Google Assistant, and Apple Siri.
- The demand for MaaS platforms offering seamless AI and voice control integration is growing rapidly across European urban centers, as consumers increasingly prioritize convenience, efficiency, and a comprehensive digital mobility experience.
Europe Mobility as a Service Market Dynamics
Driver
“Growing Need Due to Rising Urbanization and Demand for Efficient Transport”
- The increasing challenges of urban congestion, environmental concerns, and the rising demand for efficient and sustainable transport solutions are significant drivers for the heightened adoption of Mobility as a Service (MaaS) in Europe.
- For instance, in 2025, the City of Helsinki expanded its Whim MaaS pilot program, integrating more public transport options, ride-hailing, and bike-sharing services into a single platform. Such initiatives by city authorities and key providers are expected to drive market growth during the forecast period.
- As urban populations grow and commuters seek seamless travel experiences, MaaS platforms offer advanced features such as real-time route optimization, integrated ticketing, and multi-modal journey planning, providing a compelling alternative to private vehicle ownership.
- Furthermore, the increasing adoption of smart city initiatives and digital infrastructure is making MaaS an integral component of urban mobility, offering seamless integration with public transport networks, parking services, and shared mobility solutions.
- The convenience of on-demand bookings, centralized travel planning, and the ability to manage multiple transport modes through smartphone applications are key factors propelling MaaS adoption across both residential commuters and commercial users. The trend toward flexible, app-based transport subscriptions and the increasing availability of user-friendly MaaS platforms further contribute to market growth.
Restraint/Challenge
“Concerns Regarding Data Privacy and High Implementation Costs”
- Concerns surrounding data privacy and cybersecurity in connected transport platforms pose a significant challenge to broader MaaS adoption. As MaaS relies on user data and network connectivity, it is susceptible to data breaches and misuse, raising anxieties among potential consumers and regulators about privacy and safety.
- For instance, reports of vulnerabilities in mobility apps or breaches of location data have made some consumers and municipalities cautious about adopting fully integrated MaaS solutions.
- Addressing these concerns through robust encryption, secure authentication, anonymization of user data, and compliance with GDPR regulations is crucial for building consumer and regulatory trust. Companies such as Moovit and Whim emphasize these security measures in their platforms to reassure users. Additionally, the relatively high initial costs of implementing MaaS infrastructure—such as app development, system integration, and partnerships with transport operators—can be a barrier for smaller cities or budget-conscious municipalities.
- While costs are gradually decreasing with digital integration and scalable platforms, the perceived investment required can still hinder widespread adoption, especially in regions with less developed transport networks or limited funding.
- Overcoming these challenges through enhanced cybersecurity protocols, transparent data policies, consumer education on privacy measures, and cost-effective MaaS solutions will be vital for sustained market growth.
Europe Mobility as a Service Market Scope
The mobility as a service market is segmented on the basis of service type, solution, transportation type, vehicle type, application platform, requirement type, organization size and usage.
• By Service Type
On the basis of service type, the Europe MaaS Market is segmented into car sharing, bus sharing, train, ride hailing, bicycle sharing, self-driving cars, and others. The ride-hailing segment dominated the market with the largest revenue share of 38.7% in 2025, driven by the convenience of on-demand travel, app-based bookings, and real-time tracking features. Consumers increasingly prefer ride-hailing for short-distance travel, daily commutes, and first- and last-mile connectivity, benefiting from dynamic pricing, cashless payments, and route optimization features.
The bicycle-sharing segment is expected to witness the fastest CAGR from 2026 to 2033, propelled by the growing focus on eco-friendly and micro-mobility solutions. Urban congestion, rising environmental awareness, and municipal support for dockless e-bikes and e-scooters encourage adoption. These shared, flexible transport options are particularly attractive for short trips, first-mile/last-mile connectivity, and reducing reliance on private vehicles, contributing to sustainable urban mobility.
• By Solution
On the basis of solution, the Europe MaaS Market is segmented into navigation solutions, ticketing solutions, technology platforms, insurance services, telecom connectivity providers, and payment engines. The technology platforms segment held the largest revenue share of 41.2% in 2025, as these platforms integrate multiple transport modes, offering seamless trip planning, booking, and payment within a single interface. Technology platforms serve as the backbone of MaaS, providing real-time route optimization, multi-modal scheduling, and centralized user data management.
The payment engines segment is expected to witness the fastest CAGR from 2026 to 2033, fueled by the rising demand for unified, contactless, and secure payment solutions across multiple transport modes. Digital wallets, mobile banking integration, and automated fare collection systems improve convenience for users and streamline transactions for providers. The growing adoption of subscription-based and pay-per-use MaaS models further accelerates the need for robust payment engines.
• By Transportation Type
On the basis of transportation type, the Europe MaaS Market is segmented into public and private transport. The public transport segment dominated the market with a revenue share of 55.3% in 2025, driven by partnerships with buses, trains, and metro services to integrate ticketing, real-time updates, and optimized routes. MaaS integration allows commuters to plan multi-modal journeys efficiently while reducing congestion and promoting sustainable mobility. Public transport adoption is also supported by government incentives for smart city initiatives and eco-friendly commuting.
The private transport segment is expected to witness the fastest CAGR from 2026 to 2033, fueled by the rising popularity of car-sharing, ride-hailing, and subscription-based private mobility solutions. Urban commuters increasingly rely on app-based private options to ensure flexible, personalized travel that complements public transport, thereby enhancing MaaS adoption across diverse mobility scenarios.
• By Vehicle Type
On the basis of vehicle type, the Europe MaaS Market is segmented into four-wheelers, bus, train, and micro-mobility vehicles. The four-wheeler segment dominated the market with a revenue share of 42.5% in 2025, primarily due to the widespread use of ride-hailing and car-sharing services. Consumers favor four-wheelers for urban commuting, first- and last-mile connectivity, and inter-city travel.
The micro-mobility segment, including e-scooters, bicycles, and other compact vehicles, is expected to witness the fastest growth from 2026 to 2033. Rapid urbanization, increasing traffic congestion, and environmental concerns drive the adoption of micro-mobility solutions as sustainable alternatives. Municipal initiatives to improve cycling infrastructure and the proliferation of dockless bike and scooter services enhance accessibility. Micro-mobility also serves as a convenient option for short trips, complementing public transport systems and contributing to a fully integrated MaaS ecosystem.
• By Application Platform
On the basis of application platform, the Europe MaaS Market is segmented into iOS, Android, and others. The Android segment dominated the market with the largest revenue share of 49.1% in 2025, reflecting the widespread use of Android smartphones across Europe and the compatibility of most MaaS apps with the platform. Android’s open ecosystem enables greater accessibility and customization for MaaS users.
The iOS segment is expected to witness the fastest CAGR from 2026 to 2033, driven by premium app experiences, high security for payment integration, and consistent updates that enhance usability. iOS users often benefit from advanced mobile features, including integrated wallet payments, push notifications, and optimized route suggestions, providing a seamless MaaS experience. The growing smartphone penetration and preference for app-based travel planning are key factors driving adoption across both platforms.
• By Requirement Type
On the basis of requirement type, the Europe MaaS Market is segmented into first- and last-mile connectivity, off-peak and shift work commute, daily commuter, airport or mass transit station trips, inter-city trips, and others. The daily commuter segment dominated the market with a revenue share of 36.8% in 2025, reflecting the strong dependence on MaaS platforms for routine urban travel. Users benefit from optimized routes, integrated ticketing, and cost-effective subscriptions.
The first- and last-mile connectivity segment is expected to witness the fastest CAGR from 2026 to 2033, fueled by increasing urban density and the need to bridge gaps between residential areas and public transport hubs. Shared bicycles, scooters, and ride-hailing services significantly enhance first- and last-mile accessibility, reducing reliance on private vehicles and supporting efficient multi-modal travel.
• By Organization Size
On the basis of organization size, the Europe MaaS Market is segmented into large enterprises and small and medium-sized enterprises (SMEs). The large enterprise segment dominated the market with a revenue share of 58.4% in 2025, as major corporations implement MaaS solutions to provide employee commuting programs, manage fleets, and optimize operational efficiency. Large organizations benefit from scalable platforms, centralized monitoring, and integrated reporting.
The SME segment is expected to witness the fastest CAGR from 2026 to 2033, driven by cost-effective MaaS solutions and subscription-based models tailored for smaller businesses. SMEs increasingly leverage MaaS platforms to offer flexible employee mobility, reduce transport expenses, and improve workforce productivity without heavy infrastructure investments, expanding overall market adoption.
• By Usage
On the basis of usage, the Europe MaaS Market is segmented into commercial and personal. The commercial segment dominated the market with a revenue share of 52.7% in 2025, driven by corporate contracts, employee commuting programs, and partnerships with urban transport authorities. Commercial adoption provides centralized access, subscription management, and improved operational efficiency.
The personal usage segment is expected to witness the fastest CAGR from 2026 to 2033, fueled by the growing demand for flexible, app-based mobility services for individual commuters. Increased smartphone penetration, rising urban population, and convenience-driven lifestyles are accelerating personal MaaS adoption, as consumers prefer multi-modal solutions over private vehicle ownership, creating a fully integrated, user-friendly urban mobility ecosystem.
Europe Mobility as a Service Market Regional Analysis
- Germany dominated the Europe Mobility as a Service Market with the largest revenue share of 36% in 2025, driven by increasing urbanization, well-developed public transport infrastructure, and rising consumer demand for seamless, app-based mobility solutions.
- Consumers and city commuters in the region highly value the convenience, flexibility, and cost-effectiveness offered by MaaS platforms, which integrate multiple transport modes such as ride-hailing, public transit, and micro-mobility options into a single digital ecosystem.
- This widespread adoption is further supported by supportive government policies, high smartphone penetration, and growing awareness of sustainable and eco-friendly transport alternatives. The integration of real-time route planning, unified ticketing, and digital payment systems enhances the overall user experience, making MaaS a preferred mobility solution for both daily commuting and occasional travel across urban centers in Europe.
Germany MaaS Market Insight
The Germany Mobility as a Service market is expected to expand at a considerable CAGR during the forecast period, driven by the country’s well-developed public transport infrastructure, growing urbanization, and rising demand for integrated, app-based mobility solutions. Consumers are increasingly adopting multi-modal transport options, including ride-hailing, car-sharing, and micro-mobility solutions, to reduce congestion and optimize travel efficiency. Government initiatives supporting sustainable urban transport and smart city projects further promote MaaS adoption. Additionally, German commuters prioritize convenience, real-time route planning, and seamless payment integration, fueling demand for sophisticated MaaS platforms across residential, commercial, and corporate mobility use cases.
France MaaS Market Insight
The France Mobility as a Service market is projected to grow at a substantial CAGR over the forecast period, driven by the nation’s strong focus on urban mobility, environmental sustainability, and smart city initiatives. The growing popularity of ride-hailing, bicycle-sharing, and public transport integration encourages users to adopt MaaS platforms. French consumers increasingly prefer digital solutions that combine route optimization, unified ticketing, and cashless payments. Additionally, supportive government policies and the expansion of mobility infrastructure in metropolitan areas, such as Paris, enhance the market growth. Corporate adoption of MaaS for employee commuting and travel management is also contributing to the market expansion.
U.K. MaaS Market Insight
The U.K. Mobility as a Service market is anticipated to grow at a noteworthy CAGR during the forecast period, driven by rising urbanization, demand for flexible transport options, and increased awareness of sustainable mobility solutions. The integration of ride-hailing, car-sharing, public transit, and micro-mobility platforms provides a seamless travel experience for commuters. Additionally, concerns regarding congestion and environmental impact encourage the adoption of MaaS across cities like London, Manchester, and Birmingham. High smartphone penetration, widespread internet access, and government-backed mobility programs further boost adoption. The U.K. market also sees strong growth in corporate mobility solutions, where MaaS platforms are implemented for employee commuting and business travel.
Netherlands MaaS Market Insight
The Netherlands Mobility as a Service market is poised to grow at a significant CAGR over the forecast period, fueled by the country’s advanced cycling infrastructure, dense urban transport network, and high digital connectivity. Dutch consumers favor MaaS platforms that integrate public transport, bike-sharing, ride-hailing, and micro-mobility solutions to ensure efficient and sustainable travel. The government actively supports MaaS adoption through smart city initiatives, urban mobility planning, and subsidies for digital transport solutions. Additionally, increasing commuter reliance on smartphone applications for route planning, ticketing, and real-time updates drives market growth. The Netherlands also witnesses growth in corporate and commercial MaaS adoption, enabling businesses to manage employee mobility efficiently while reducing transportation-related emissions.
Europe Mobility as a Service Market Share
The Mobility as a Service industry is primarily led by well-established companies, including:
- Siemens Mobility (Germany)
- Alstom (France)
- MobilityX (France)
- Moovit (U.K.)
- Uber Mobility Europe (U.S.)
- Bolt (Estonia)
- Free2Move (France)
- HopSkipDrive (U.K.)
- Lime (U.S.)
- Grab (Singapore)
- Cityscoot (France)
- Voi Technology (Sweden)
- Tier Mobility (Germany)
- Whim (Finland)
- GoTo Mobility (Norway)
- Bird (U.S.)
- MaaS Global (Finland)
- DriveNow / Share Now (Germany)
- Flink Mobility (Netherlands)
- Scoot Europe (France)
What are the Recent Developments in Europe Mobility as a Service Market?
- In April 2024, Siemens Mobility, a global leader in transportation solutions, launched a strategic initiative in Germany to expand its MaaS offerings by integrating public transit, ride-hailing, and micro-mobility services into a unified digital platform. This initiative emphasizes the company’s commitment to delivering efficient, sustainable, and user-friendly urban mobility solutions, leveraging its technological expertise to enhance commuter convenience and optimize city transport networks. By addressing regional mobility challenges, Siemens is strengthening its position in the rapidly growing Europe MaaS Market.
- In March 2024, MobilityX, a European start-up specializing in ride-hailing and shared mobility, introduced its AI-powered dynamic routing system in France, designed to reduce travel time and congestion for urban commuters. The system intelligently integrates ride-hailing, public transport, and bicycle-sharing services, offering personalized route optimization. This launch highlights MobilityX’s focus on improving commuter experience and operational efficiency while promoting eco-friendly urban mobility solutions.
- In March 2024, Alstom successfully implemented the Amsterdam Smart Transit Project, aimed at enhancing urban mobility through integrated MaaS platforms that connect trains, buses, and on-demand mobility services. The project leverages advanced digital technologies to improve real-time scheduling, ticketing, and multi-modal transport options, reinforcing Alstom’s leadership in innovative urban mobility solutions across Europe.
- In February 2024, Uber Mobility Europe announced a strategic partnership with Dutch Railways (NS) to integrate ride-hailing, bike-sharing, and public transit ticketing into a single MaaS app for commuters. This collaboration is designed to simplify multi-modal journeys, improve accessibility, and reduce first- and last-mile transport challenges, highlighting Uber’s commitment to driving innovation and seamless urban mobility solutions in Europe.
- In January 2024, Moovit (Intel subsidiary) unveiled its updated MaaS platform at the European Smart Mobility Summit 2024, featuring real-time navigation, integrated ticketing, and predictive route planning for cities across the U.K. The platform empowers users to manage multi-modal trips efficiently through a single app while enhancing urban mobility planning for authorities. Moovit’s launch demonstrates the company’s dedication to integrating advanced technology into MaaS ecosystems, offering commuters convenience, reliability, and sustainable transport options.
SKU-

- Interactive Data Analysis Dashboard
- Company Analysis Dashboard for high growth potential opportunities
- Research Analyst Access for customization & queries
- Competitor Analysis with Interactive dashboard
- Latest News, Updates & Trend analysis
- Harness the Power of Benchmark Analysis for Comprehensive Competitor Tracking
Data collection and base year analysis are done using data collection modules with large sample sizes. The stage includes obtaining market information or related data through various sources and strategies. It includes examining and planning all the data acquired from the past in advance. It likewise envelops the examination of information inconsistencies seen across different information sources. The market data is analysed and estimated using market statistical and coherent models. Also, market share analysis and key trend analysis are the major success factors in the market report. To know more, please request an analyst call or drop down your inquiry.
The key research methodology used by DBMR research team is data triangulation which involves data mining, analysis of the impact of data variables on the market and primary (industry expert) validation. Data models include Vendor Positioning Grid, Market Time Line Analysis, Market Overview and Guide, Company Positioning Grid, Patent Analysis, Pricing Analysis, Company Market Share Analysis, Standards of Measurement, Global versus Regional and Vendor Share Analysis. To know more about the research methodology, drop in an inquiry to speak to our industry experts.
Data Bridge Market Research is a leader in advanced formative research. We take pride in servicing our existing and new customers with data and analysis that match and suits their goal. The report can be customized to include price trend analysis of target brands understanding the market for additional countries (ask for the list of countries), clinical trial results data, literature review, refurbished market and product base analysis. Market analysis of target competitors can be analyzed from technology-based analysis to market portfolio strategies. We can add as many competitors that you require data about in the format and data style you are looking for. Our team of analysts can also provide you data in crude raw excel files pivot tables (Fact book) or can assist you in creating presentations from the data sets available in the report.


