
Europe Nuts Market
Market Size in USD Billion
 USD
6.17 Billion
USD
9.29 Billion
2024
2032
USD
6.17 Billion
USD
9.29 Billion
2024
2032
| 2025 - 2032 | |
| USD 6.17 Billion | |
| USD 9.29 Billion | |
| % | |
|
Nuts Market Size
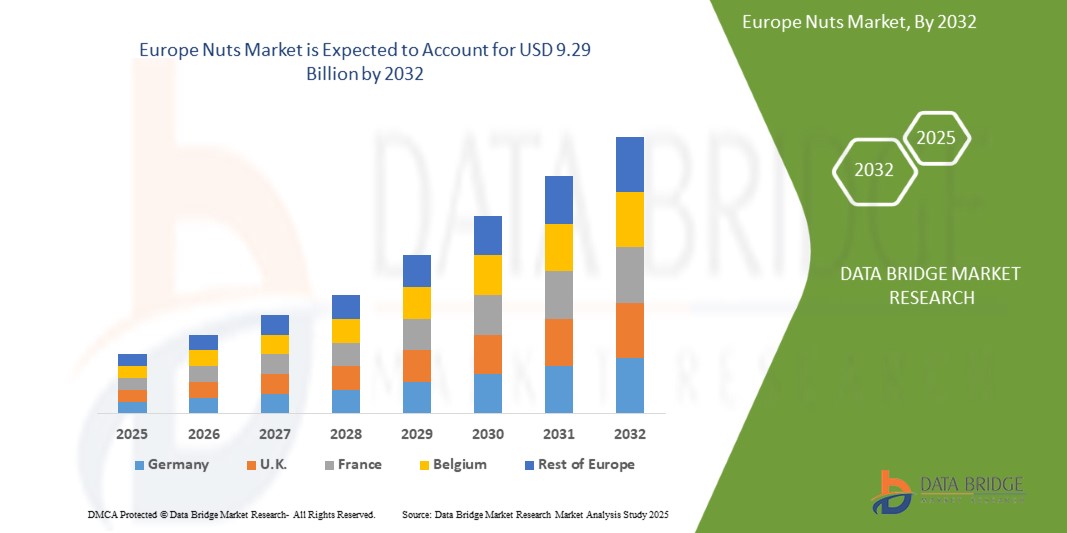
- The Europe nuts market size was valued at USD 6.17 billion in 2024 and is expected to reach USD 9.29 billion by 2032, at a CAGR of 5.4% during the forecast period
- The nuts market is mainly driven by growing awareness of health benefits of nuts as they are rich source of fiber, protein, minerals & vitamins and several other antioxidants. They are good source of saturated fats and helps in maintaining a healthy heart and brain. Consumers are often aware about the preferences of vegan snacks worldwide.
Nuts Market Analysis
- A nut is a fruit composed of inedible hard shell and a seed which is edible. They are good source of good fats, fiber and other rich beneficial nutrients. Each type of nut offers other benefits. Nuts are among the best source of plant based proteins. A diet rich in nuts help to prevent risk factors such as inflammation or some chronic diseases.
- In many ways, eating nuts on a regular basis will improve health, such as lowering the risk of diabetes and heart disease as well as decreasing the amount of cholesterol and triglycerides. Despite its high calorie content, this nutritious high fiber treatment may also help weight loss.
- Europe is expected to exhibit steady growth during the forecast period, driven by increasing demand for healthy and natural food alternatives. European consumers are becoming more health-conscious and are shifting towards diets that emphasize plant-based proteins and functional foods.
- Germany’s nut market is growing steadily, backed by demand for high-quality and ethically sourced products. The country’s strong presence of health-focused consumers and a well-developed food processing industry promote innovation in nut-based snacks, nut butters, and bakery products.
- The tree nut segment is expected to dominate the market due to its wide availability, affordability, and extensive product variety.
Report Scope and Nuts Market Segmentation
|
Attributes |
Nuts Key Market Insights |
|
Segments Covered |
|
|
Countries Covered |
Europe
|
|
Key Market Players |
|
|
Market Opportunities |
|
|
Value Added Data Infosets |
In addition to the insights on market scenarios such as market value, growth rate, segmentation, geographical coverage, and major players, the market reports curated by the Data Bridge Market Research also include in-depth expert analysis, pricing analysis, brand share analysis, consumer survey, demography analysis, supply chain analysis, value chain analysis, raw material/consumables overview, vendor selection criteria, PESTLE Analysis, Porter Analysis, and regulatory framework. |
Nuts Market Trends
“Growing Trend Toward Healthier Snacking And Nutritious Choices”
- The nuts market is rapidly growing, driven by increasing health-conscious snacking trends. Consumers are seeking nutritious, convenient snacks, and nuts perfectly fit this demand due to their rich protein, fiber, and healthy fats. As awareness of wellness rises, nuts are becoming a preferred choice for guilt-free snacking, boosting market growth and encouraging innovation in product offerings.
- A key driver behind the popularity of nuts as snacks is the increasing health awareness among consumers. Valued for their nutritional content, nuts are seen as a wholesome alternative to traditional snack foods. They are rich in essential vitamins, minerals, fiber, and protein and contain heart-healthy monounsaturated and polyunsaturated fats. Their natural portability and convenience make them ideal for busy lifestyles, offering a quick and nutritious snack solution throughout the day.
- For instance, In June 2024, according to Business Standard Private Ltd., Nutraj announced the launch of its new product, the “NutrajSnackrite Daily Nutrition Pack.” This thoughtfully designed pack contains convenient pouches filled with a delicious and nutritious trail mix, combining a variety of premium nuts and dried fruits. Aimed at health-conscious consumers, it provides a perfect on-the-go snack option that delivers essential nutrients and energy throughout the day, catering to the rising demand for wholesome and tasty snack choices
Nuts Market Dynamics
Driver
“Rise in Daily Consumption of Various Nut Products”
- The Europe nuts market is experiencing significant growth, primarily driven by the increased consumption of nuts worldwide. One of the key factors driving this rise is the growing awareness among consumers about the health benefits of nuts
- In addition, the shift towards plant-based and clean eating lifestyles has made nuts a popular choice as a natural and wholesome snack. Convenience also plays a crucial role, as nuts are easy to carry and consume on the go, fitting well into busy modern lifestyles. Furthermore, product innovation, including new flavors, packaging, and ready-to-eat options, has broadened the appeal, encouraging more consumers to incorporate nuts into their daily diets and driving Europe market expansion
- For instance, in September 2024, according to Forbes Media LLC., Daily Crunch raised USD 4 million in Series A funding to support its expansion in the growing nut-based snack market. The investment is focused on enhancing its range of sprouted nut snacks such as almonds, walnuts, and cashews scaling up production, and increasing retail availability to meet rising Europe demand for nutritious, on-the-go nut products
Restraint/Challenge
“Price Volatility Restraining Growth in the Nuts Market”
- Price volatility is a major factor restraining growth in the Europe nuts market. Fluctuating prices, driven by unpredictable weather events such as droughts, floods, and frost, disrupt supply chains and create uncertainty for both producers and buyers. For instance, adverse conditions in key growing regions, have led to reduced yields and sharp price increases, making it difficult for manufacturers to maintain stable product costs.
- In addition, trade tensions and shifting tariffs further exacerbate price instability, limiting market expansion. This unpredictability discourages investment and challenges long-term planning within the industry. As a result, consumers may face higher prices or reduced availability, which can dampen demand. Addressing price volatility is crucial for ensuring steady growth and sustainability in the Europe nuts market.
- For instance, in June 2024, according to SGGP, the Vietnam Cashew Association (VINACAS) established a dedicated task force to tackle price fluctuations in raw cashew nuts. This group collaborates with the government and ministries to stabilize prices, aiming to reduce supply chain disruptions and support sustainable growth within Vietnam’s cashew industry
Nuts Market Scope
The Europe nuts market is segmented into twelve notable segments based on product type, form, nature, processing method, grade, shelf life, certification, packaging, packaging size, price range, end-use, distribution channel.
- By Product Type
On the basis of product type, the nuts market is segmented into tree nuts, ground nuts, hybrid/other nuts, and others. The tree nuts segment is projected to dominate the market with the market share of share of 52.38% in 2025, driven by the widespread popularity and availability of almonds, cashews, walnuts, pistachios, and other varieties. Their established role in global diets, coupled with high nutritional value and increasing use in health-centric snacks, makes tree nuts the preferred category.
- By Form
On the basis of form, the market is segmented into whole, butter, ground, halves, pieces, oil, milk, paste, cream, roasted pieces, coated, flour, powder, chopped, sliced, diced, crushed, blanched whole, frozen, spray-dried, encapsulated, and others. In 2025, the whole segment is expected to lead the form segment with the market share of 12.06%, fueled by rising health awareness and consumer preference for unprocessed, clean-label foods. Whole nuts offer convenience, visual appeal, and perceived freshness, making them a top choice for both direct consumption and culinary applications.
- By Nature
On the basis of nature, the nuts market is segmented into conventional and organic. The conventional segment is expected to dominate the market with the market share of 61.70% in 2025 due to its affordability, ease of sourcing, and strong presence across mainstream retail channels. In price-sensitive and developing regions, conventional nuts continue to hold a major share due to familiarity, consistent quality, and higher availability compared to premium organic alternatives.
- By Processing Method
The market is segmented by processing method into raw, roasted, salted, blanched, flavored, unsalted, glazed, candied, caramelized, smoked, sprouted, fermented, freeze-dried, pickled, vacuum-fried, dehydrated, and others. The raw segment is anticipated to dominate the market with the market share of 12.68% in 2025 as consumer trends shift towards minimally processed, nutrient-rich foods. Raw nuts retain natural enzymes and nutrients, appealing strongly to health-conscious, vegan, and clean-eating communities.
- By Grade
On the basis of grade, the market is categorized into A grade (premium export quality), B grade (mid-quality domestic use), broken grade (bakery & confectionery use), oil-grade, industrial grade, and rejected grade (animal feed). The A grade segment is projected to dominate the market with the market share of 33.98% in 2025, primarily due to increasing international demand for high-quality, visually consistent nuts.
- By Shelf Life
The market is segmented by shelf life into <6 months, 6–12 months, 13–18 months, 18 months, and more than 18 months. The <6 months segment is anticipated to dominate the market with the market share of 36.34% in 2025, reflecting a growing demand for fresher, recently harvested nuts. Premium consumers, especially in the retail and health sectors, associate short shelf life with better taste, texture, and nutritional value.
- By Certification
On the basis of certification, the market includes ISO 22000/HACCP, USDA Organic, EU Organic, Non-GMO Verified, Gluten-Free Certified, Kosher, Halal, Vegan Certified, Fair Trade, Rainforest Alliance, Carbon Neutral Certified, and others. The ISO 22000/HACCP segment is projected to lead the market with the market share of 20.53% in 2025 due to rising global food safety regulations and consumer demand for traceable, hygienic, and quality-assured nut products.
- By Packaging
Packaging types include plastic pouches, vacuum-sealed packs, PET jars, paper bags, composite cans, bulk woven sacks, glass jars, sachets/single-serve, gift boxes, bio-based/compostable, metal tins, resealable eco-tubs, foil-wrapped bars, refill packs, and others. In 2025, plastic pouches segment is expected to dominate the market with the market share of 21.30%, driven by their convenience, portability, cost-effectiveness, and shelf-life benefits. Sub-segments like stand-up zipper packs also cater well to modern retail displays and consumer use.
- By Packaging Size
The market is segmented into 101g–250g, 251g–500g, 51g–100g, 25g–50g, 501g–1kg, 1.1kg–2.5kg, 2.6kg–5kg, 5.1kg–10kg, 10.1kg–25kg, 25.1kg–50kg, 50kg, and <25g. In 2025, the 101g–250g segment is expected to dominate the market with the market share of 15.49%, catering to on-the-go consumption, trial purchases, and health-conscious snacking. This range balances convenience and value, making it attractive in both modern retail and online channels.
- By Price Range
Price ranges include economy/budget (USD 1.00–6.00 per kg), mid-range (USD 6.01–12.00 per kg), premium (USD 12.01–20.00 per kg), and super-premium/gourmet (above USD 20.00 per kg). The economy/budget segment is projected to dominate the market with the market share of 38.97% in 2025 due to affordability-driven demand in emerging markets, institutional buyers, and mass-market retail channels.
- By End Use
The market is segmented into direct consumption, snacks, nut butters & spreads, bakery industry, confectionery industry, cereal & granola manufacturing, functional nutrition, dairy alternatives, beverage industry, plant-based meats, culinary, industrial oil extraction, flour & gluten-free baking, personal care products, bio-based & agro-industrial uses, pet food additives, animal feed, and others. In 2025, the direct consumption segment is anticipated to dominate the market with the market share of 13.13% due to increasing demand for convenient, nutritious snacks. The rise of healthy lifestyles and protein-rich diets further propels this segment across retail, online, and travel-friendly channels.
- By Distribution Channel
On the basis of distribution channel, the market is segmented into B2B and B2C. B2C is further divided into offline and online channels. Offline includes supermarkets/hypermarkets, convenience stores, health food stores, bakeries, specialty stores, HoReCa, duty-free stores, and airlines. Online includes e-commerce marketplaces and brand-owned websites. The B2B segment is expected to dominate the market with the market share of 53.76% in 2025, supported by wide product availability, trust in physical retail, and impulse buying behavior, particularly in traditional and emerging markets.
Nuts Market Regional Analysis
Europe is expected to exhibit steady growth during the forecast period, driven by increasing demand for healthy and natural food alternatives. European consumers are becoming more health-conscious and are shifting towards diets that emphasize plant-based proteins and functional foods. The region shows a growing preference for ethically sourced, fair-trade, and organic nuts. Nuts are widely used in snacks, bakery products, and breakfast cereals, with rising demand for premium and flavored varieties.
U.K. Nuts Market Insight
In the United Kingdom, the market is expanding due to changing snacking habits and a strong shift towards convenient, healthy snack options, including portioned nut packs and nut bars. A well-established e-commerce sector and retail network further support this growth.
Germany Nuts Market Insight
Germany’s nut market is growing steadily with the CAGR of 6.0%, backed by demand for high-quality and ethically sourced products. The country’s strong presence of health-focused consumers and a well-developed food processing industry promote innovation in nut-based snacks, nut butters, and bakery products.
Nuts Market Share
The nuts industry is primarily led by well-established companies, including:
- Olam Group (Singapore)
- ADM (US)
- BORGES AGRICULTURAL & INDUSTRIAL NUTS, S.A. (Spain)
- Mariani Nut Company (US)
- Barry Callebaut. (Switzerland)
- INTERSNACK GROUP (Germany)
Latest Developments in Europe Nuts Market
- In April 2024, Olam Group announced a major expansion of its nut processing capabilities in Nigeria, aimed at boosting cashew nut processing volumes for both domestic consumption and export. This investment aligns with Olam’s strategy to strengthen its presence in value-added agri-products and support local economies through job creation and capacity-building in emerging markets
- In March 2024, Blue Diamond Growers introduced a new line of almond-based protein snacks under its “Nut-Thins” brand, focusing on high-protein, gluten-free snack options. This product launch caters to rising consumer demand for healthy, on-the-go snacking options and reinforces Blue Diamond’s position in the functional snacking segment of the nuts industry
- In February 2024, Select Harvests announced the acquisition of additional almond orchards in Victoria to enhance its production capacity. This strategic move is expected to improve vertical integration and ensure a stable supply of high-quality almonds, strengthening the company’s Europe competitiveness amidst increasing demand from regional markets
- In January 2024, Wonderful Pistachios LLC launched a Europe marketing campaign titled “The Power of Pistachios,” highlighting the health benefits of pistachio consumption. The campaign targets major international markets, including India, China, and the Middle East, and is supported by influencer marketing and nutritional awareness partnerships
- In December 2023, John B. Sanfilippo & Son, Inc. invested in automation and digitalization at its Illinois-based processing facility to increase efficiency and ensure consistent quality across its peanut and tree nut product lines. The upgrade includes AI-powered sorting systems and improved sustainability measures in packaging and water usage
- In November 2023, Borges Agricultural & Industrial Nuts, S.A. announced a partnership with a blockchain platform to implement full traceability for its almond and walnut supply chains. This initiative is aimed at ensuring transparency, fair-trade certification, and consumer trust in European markets.
SKU-

- Interactive Data Analysis Dashboard
- Company Analysis Dashboard for high growth potential opportunities
- Research Analyst Access for customization & queries
- Competitor Analysis with Interactive dashboard
- Latest News, Updates & Trend analysis
- Harness the Power of Benchmark Analysis for Comprehensive Competitor Tracking
Table of Content
1 INTRODUCTION
1.1 OBJECTIVES OF THE STUDY
1.2 MARKET DEFINITION
1.3 OVERVIEW
1.4 LIMITATIONS
1.5 MARKETS COVERED
2 MARKET SEGMENTATION
2.1 MARKETS COVERED
2.2 GEOGRAPHICAL SCOPE
2.3 YEARS CONSIDERED FOR THE STUDY
2.4 CURRENCY AND PRICING
2.5 DBMR TRIPOD DATA VALIDATION MODEL
2.6 MULTIVARIATE MODELING
2.7 PRIMARY INTERVIEWS WITH KEY OPINION LEADERS
2.8 DBMR MARKET POSITION GRID
2.9 MARKET END-USE COVERAGE GRID
2.1 DBMR VENDOR SHARE ANALYSIS
2.11 SECONDARY SOURCES
2.12 ASSUMPTIONS
3 EXECUTIVE SUMMARY
4 PREMIUM INSIGHTS
4.1 VALUE CHAIN
4.1.1 PRODUCTION:
4.1.2 PROCESSING:
4.1.3 MARKETING/DISTRIBUTION:
4.1.4 BUYERS:
4.2 SUPPLY CHAIN ANALYSIS
4.3 PORTER’S FIVE FORCES ANALYSIS
4.4 RAW MATERIAL SOURCING ANALYSIS
4.5 OVERVIEW OF TECHNOLOGICAL INNOVATIONS
4.6 GROWTH STRATEGIES ADOPTED BY KEY MARKET PLAYERS
4.7 FACTORS INFLUENCING PURCHASING DECISION OF END-USERS
4.8 IMPACT OF ECONOMIC SLOW DOWN ON MARKET
4.8.1 IMPACT ON PRICE
4.8.2 IMPACT ON SUPPLY CHAIN
4.8.3 IMPACT ON SHIPMENT
4.8.4 IMPACT ON COMPANY’S STRATEGIC DECISIONS
4.9 REGULATORY FRAMEWORK AND GUIDELINES
4.9.1 COST ANALYSIS BREAKDOWN
4.1 INNOVATION TRACKER AND STRATEGIC ANALYSIS
4.10.1 MAJOR DEALS AND STRATEGIC ALLIANCES ANALYSIS
4.10.1.1 JOINT VENTURES
4.10.1.2 MERGERS AND ACQUISITIONS
4.10.1.3 LICENSING AND PARTNERSHIP
4.10.1.4 TECHNOLOGY COLLABORATIONS
4.10.1.5 STRATEGIC DIVESTMENTS
4.10.2 NUMBER OF PRODUCTS IN DEVELOPMENT
4.10.3 STAGE OF DEVELOPMENT
4.10.4 TIMELINES AND MILESTONES
4.10.5 INNOVATION STRATEGIES AND METHODOLOGIES
4.10.6 RISK ASSESSMENT AND MITIGATION
4.10.7 FUTURE OUTLOOK
4.11 TARIFFS & IMPACT ON THE MARKET
4.11.1 CURRENT TARIFF RATE (S) IN TOP-5 COUNTRY MARKETS
4.11.2 OUTLOOK: LOCAL PRODUCTION V/S IMPORT RELIANCE
4.11.3 VENDOR SELECTION CRITERIA DYNAMICS
4.11.4 IMPACT ON SUPPLY CHAIN
4.11.4.1 RAW MATERIAL PROCUREMENT
4.11.4.2 MANUFACTURING AND PRODUCTION
4.11.4.3 LOGISTICS AND DISTRIBUTION
4.11.4.4 PRICE PITCHING AND POSITION OF MARKET
4.11.5 INDUSTRY PARTICIPANTS: PROACTIVE MOVES
4.11.5.1 SUPPLY CHAIN OPTIMIZATION
4.11.5.2 JOINT VENTURE ESTABLISHMENTS
4.11.6 IMPACT ON PRICES
4.11.7 REGULATORY INCLINATION
4.11.7.1 GEOPOLITICAL SITUATION
4.11.7.2 TRADE PARTNERSHIPS BETWEEN THE COUNTRIES
4.11.7.2.1 FREE TRADE AGREEMENTS
4.11.7.2.2 ALLIANCES ESTABLISHMENTS
4.11.7.3 STATUS ACCREDITION (INCLUDING MFTN)
4.11.7.4 DOMESTIC COURSE OF CORRECTION
4.11.7.4.1 INCENTIVE SCHEMES TO BOOST PRODUCTION OUTPUTS
4.11.7.4.2 ESTABLISHMENT OF SPECIAL ECONOMIC ZONES/INDUSTRIAL PARKS
4.12 BRAND OUTLOOK
4.12.1 COMPARATIVE BRAND ANALYSIS
4.12.2 PRODUCT AND BRAND OVERVIEW
4.13 SUPPLY CHAIN ANALYSIS
4.13.1 OVERVIEW
4.13.2 LOGISTIC COST SCENARIO
4.13.3 IMPORTANCE OF LOGISTICS SERVICE PROVIDERS
4.14 PRODUCTION CONSUMPTION ANALYSIS
4.15 IMPORT-EXPORT ANALYSIS
4.16 PATENT ANALYSIS
4.16.1 PATENT QUALITY AND STRENGTH
4.16.2 PATENT FAMILIES
4.16.3 NUMBER OF INTERNATIONAL PATENT FAMILIES BY PUBLICATION YEAR
4.17 LICENSING AND COLLABORATIONS
4.17.1 COMPANY PATENT LANDSCAPE
4.18 REGION PATENT LANDSCAPE
4.19 IP STRATEGY AND MANAGEMENT
4.2 PATENT ANALYSIS
4.21 PROFIT MARGINS SCENARIO
4.22 PRICING ANALYSIS
4.23 INDUSTRY ECOSYSTEM ANALYSIS
4.23.1 PROMINENT COMPANIES
4.23.2 SMALL & MEDIUM SIZE COMPANIES
4.23.3 END USERS
4.24 IMPACT OF ECONOMIC SLOWDOWN ON EUROPE NUTS MARKET
4.24.1 IMPACT ON PRICES
4.24.2 IMPACT ON SUPPLY CHAIN
4.24.3 IMPACT ON SHIPMENT
4.24.4 IMPACT ON DEMAND
4.24.5 IMPACT ON STRATEGIC DECISIONS
5 MARKET OVERVIEW
5.1 DRIVERS
5.1.1 GROWING EUROPE TREND TOWARD HEALTHIER SNACKING AND NUTRITIOUS CHOICES
5.1.2 RISE IN DAILY CONSUMPTION OF VARIOUS NUT PRODUCTS
5.1.3 INCREASING EUROPE DEMAND TOWARD PLANT-BASED DIETS
5.1.4 E-COMMERCE GROWTH BOOSTING NUT PRODUCT ACCESSIBILITY
5.2 RESTRAINTS
5.2.1 PRICE VOLATILITY RESTRAINING GROWTH IN THE NUTS MARKET
5.2.2 SUPPLY CHAIN DISRUPTIONS
5.2.3 IMPACT OF CLIMATE CHANGE ON MARKET STABILITY
5.3 OPPORTUNITIES
5.3.1 INNOVATION IN FLAVORED AND READY-TO-EAT NUT PRODUCTS
5.3.2 MODIFICATION IN THE NUT PRODUCTION
5.3.3 INCREASING USE OF NUTS IN BAKERY AND CONFECTIONERY PRODUCTS
5.4 CHALLENGES
5.4.1 RISING DROUGHTS, HEATWAVES, AND UNPREDICTABLE RAINFALL THREATEN CROP YIELDS AND QUALITY
5.4.2 LABOR SHORTAGES IN HARVESTING SEASONS AND RELIANCE ON MANUAL LABOR RAISE BOTH COST AND COMPLIANCE CHALLENGES
6 EUROPE NUTS MARKET, BY PRODUCT TYPE
6.1 OVERVIEW
6.2 TREE NUTS
6.2.1 TREE NUTS, BY TYPE
6.2.1.1 ALMONDS
6.2.1.2 CASHEWS
6.2.1.3 WALNUTS
6.2.1.4 PISTACHIOS
6.2.1.5 HAZELNUTS
6.2.1.6 PECANS
6.2.1.7 MACADAMIAS
6.2.1.8 PINE NUTS
6.2.1.9 BRAZIL NUTS
6.2.1.10 CHESTNUTS
6.2.1.11 PILI NUTS
6.2.1.12 BARUKAS NUTS
6.2.1.13 OTHERS
6.3 GROUND NUTS
6.3.1 GROUND NUTS, BY PEANUTS
6.3.1.1 RUNNER
6.3.1.2 VIRGINIA
6.3.1.3 SPANISH
6.3.1.4 VALENCIA
6.3.1.5 OTHERS
6.4 HYBRID/OTHER NUTS
6.4.1 HYBRID/OTHER NUTS, BY TYPE
6.4.1.1 COCONUTS
6.4.1.2 BETEL NUTS
6.4.1.3 TIGER NUTS
6.4.1.4 GINKGO NUTS
6.4.1.5 OTHERS
6.5 OTHERS
7 EUROPE NUTS MARKET, FORM
7.1 OVERVIEW
7.2 WHOLE
7.3 BUTTER
7.4 GROUND
7.5 HALVES
7.6 PIECES
7.7 OIL
7.8 MILK
7.9 PASTE
7.1 CREAM
7.11 ROASTED PIECES
7.12 COATED
7.13 FLOUR
7.14 POWDER
7.15 CHOPPED
7.16 SLICED
7.17 DICED
7.18 CRUSHED
7.19 BLANCHED WHOLE
7.2 FROZEN
7.21 SPRAY-DRIED
7.22 ENCAPSULATED
7.23 OTHERS
8 EUROPE NUTS MARKET, BY NATURE
8.1 OVERVIEW
8.2 CONVENTIONAL
8.3 ORGANIC
9 EUROPE NUTS MARKET, BY PROCESSING METHOD
9.1 OVERVIEW
9.2 RAW
9.3 ROASTED
9.3.1 ROASTED, BY TYPE
9.3.1.1 DRY ROASTED
9.3.1.2 OIL ROASTED
9.4 SALTED
9.5 BLANCHED
9.6 FLAVORED
9.6.1 FLAVORED, BY TYPE
9.6.1.1 SWEETENED
9.6.1.2 SPICED
9.6.1.3 CHOCOLATE-COATED
9.6.1.4 HERB-INFUSED
9.6.1.5 YOGURT-COATED
9.6.1.6 OTHERS
9.7 UNSALTED
9.8 GLAZED
9.9 CANDIED
9.1 CARAMELIZED
9.11 SMOKED
9.12 SPROUTED
9.13 FERMENTED
9.14 FREEZE-DRIED
9.15 PICKLED
9.16 VACUUM-FRIED
9.17 DEHYDRATED
9.18 OTHERS
10 EUROPE NUTS MARKET, BY GRADE
10.1 OVERVIEW
10.2 A GRADE (PREMIUM EXPORT QUALITY)
10.3 B GRADE (MID-QUALITY DOMESTIC USE)
10.4 BROKEN GRADE (BAKERY & CONFECTIONERY USE)
10.5 OIL-GRADE
10.6 INDUSTRIAL GRADE
10.7 REJECTED GRADE (ANIMAL FEED)
11 EUROPE NUTS MARKET, BY SHELF LIFE
11.1 OVERVIEW
11.2 <6 MONTHS
11.3 6–12 MONTHS
11.4 13–18 MONTHS
11.5 18 MONTHS
11.6 MORE THAN 18 MONTHS
12 EUROPE NUTS MARKET, BY CERTIFICATION
12.1 OVERVIEW
12.2 ISO 22000/HACCP
12.3 USDA ORGANIC
12.4 EU ORGANIC
12.5 NON-GMO VERIFIED
12.6 GLUTEN-FREE CERTIFIED
12.7 KOSHER
12.8 HALAL
12.9 VEGAN CERTIFIED
12.1 FAIR TRADE
12.11 RAINFOREST ALLIANCE
12.12 CARBON NEUTRAL CERTIFIED
12.13 OTHERS
13 EUROPE NUTS MARKET, PACKAGING
13.1 OVERVIEW
13.2 PLASTIC POUCHES
13.2.1 PLASTIC POUCHES, BY TYPE
13.2.1.1 STAND-UP ZIPPER PACKS
13.2.1.2 PILLOW PACKS
13.3 VACUUM-SEALED PACKS
13.4 PET JARS
13.5 PAPER BAGS
13.6 COMPOSITE CANS
13.7 BULK WOVEN SACKS
13.8 GLASS JARS
13.9 SACHETS/SINGLE-SERVE
13.1 GIFT BOXES
13.11 BIO-BASED/COMPOSTABLE
13.12 METAL TINS
13.13 RESEALABLE ECO-TUBS
13.14 FOIL-WRAPPED BARS
13.15 REFILL PACKS
13.16 OTHERS
14 EUROPE NUTS MARKET, BY PACKAGING SIZE
14.1 OVERVIEW
14.2 101G–250G
14.3 251G–500G
14.4 51G–100G
14.5 25G–50G
14.6 501G–1KG
14.7 1.1KG–2.5KG
14.8 2.6KG–5KG
14.9 5.1KG–10KG
14.1 10.1KG–25KG
14.11 25.1KG–50KG
14.12 50KG
14.13 <25G
15 EUROPE NUTS MARKET, BY PRICE RANGE
15.1 OVERVIEW
15.2 ECONOMY/BUDGET (USD 1.00-6.00 PER KG)
15.3 MID-RANGE (USD 6.01-12.00 PER KG)
15.4 PREMIUM (USD 12.01-20.00 PER KG)
15.5 SUPER-PREMIUM/GOURMET (ABOVE USD 20.00 PER KG)
16 EUROPE NUTS MARKET, BY END-USE
16.1 OVERVIEW
16.2 DIRECT CONSUMPTION
16.3 SNACKS
16.4 NUT BUTTERS & SPREADS
16.5 BAKERY INDUSTRY
16.6 CONFECTIONERY INDUSTRY
16.7 CEREAL & GRANOLA MANUFACTURING
16.8 FUNCTIONAL NUTRITION
16.8.1 FUNCTIONAL NUTRITION, BY TYPE
16.8.1.1 PROTEIN BARS
16.8.1.2 MEAL REPLACEMENTS
16.8.1.3 SUPPLEMENTS
16.8.1.4 OTHERS
16.9 DAIRY ALTERNATIVES
16.1 BEVERAGE INDUSTRY
16.10.1 BEVERAGE INDUSTRY, BY TYPE
16.10.1.1 NUT MILK
16.10.1.2 NUT-BASED PROTEIN DRINKS
16.10.1.3 FERMENTED NUT BEVERAGES
16.10.1.4 OTHERS
16.11 PLANT-BASED MEATS
16.12 CULINARY
16.12.1 CULINARY, BY TYPE
16.12.1.1 GARNISHING
16.12.1.2 SAUCES
16.12.1.3 CONDIMENTS
16.12.1.4 OTHERS
16.13 INDUSTRIAL OIL EXTRACTION
16.14 FLOUR & GLUTEN-FREE BAKING
16.15 PERSONAL CARE PRODUCTS
16.15.1 PERSONAL CARE PRODUCTS, BY TYPE
16.15.1.1 SKIN CARE
16.15.1.2 HAIR OIL
16.15.1.3 EXFOLIANTS
16.15.1.4 OTHERS
16.16 BIO-BASED & AGRO-INDUSTRIAL USES
16.16.1 BIO-BASED & AGRO-INDUSTRIAL USES, BY TYPE
16.16.1.1 ACTIVATED CARBON
16.16.1.2 ABRASIVES
16.16.1.3 BIOFUEL ADDITIVES
16.16.1.4 OTHERS
16.17 PET FOOD ADDITIVES
16.18 ANIMAL FEED
16.18.1 ANIMAL FEED, BY TYPE
16.18.1.1 MEAL RESIDUE
16.18.1.2 SHELLS
16.18.1.3 OTHERS
16.19 OTHERS
17 EUROPE NUTS MARKET, BY DISTRIBUTION CHANNEL
17.1 OVERVIEW
17.2 B2B
17.3 B2C
17.3.1 B2C, BY TYPE
17.3.1.1 OFFLINE
17.3.1.1.1 SUPERMARKETS/HYPERMARKETS
17.3.1.1.2 CONVENIENCE STORES
17.3.1.1.3 HEALTH FOOD STORES
17.3.1.1.4 BAKERIES
17.3.1.1.5 SPECIALTY STORES
17.3.1.1.6 HORECA
17.3.1.1.7 DUTY-FREE STORES
17.3.1.1.8 AIRLINES
17.3.1.1.9 OTHERS
17.3.1.2 ONLINE
17.3.1.2.1 E-COMMERCE MARKETPLACES
17.3.1.2.2 BRAND-OWNED WEBSITES
18 EUROPE NUTS MARKET, BY REGION
18.1 OVERVIEW
18.2 NORTH AMERICA
18.2.1 U.S.
18.2.2 CANADA
18.2.3 MEXICO
18.3 EUROPE
18.3.1 GERMANY
18.3.2 FRANCE
18.3.3 NETHERLANDS
18.3.4 SPAIN
18.3.5 ITALY
18.3.6 U.K.
18.3.7 POLAND
18.3.8 RUSSIA
18.3.9 BELGIUM
18.3.10 SWITZERLAND
18.3.11 TURKEY
18.3.12 SWEDEN
18.3.13 NORWAY
18.3.14 DENMARK
18.3.15 FINLAND
18.3.16 REST OF EUROPE
18.4 ASIA PACIFIC
18.4.1 CHINA
18.4.2 INDIA
18.4.3 JAPAN
18.4.4 SOUTH KOREA
18.4.5 AUSTRALIA
18.4.6 MALAYSIA
18.4.7 INDONESIA
18.4.8 THAILAND
18.4.9 PHILIPPINES
18.4.10 SINGAPORE
18.4.11 HONG KONG
18.4.12 NEW ZEALAND
18.4.13 TAIWAN
18.4.14 REST OF ASIA-PACIFIC
18.5 MIDDLE EAST AND AFRICA
18.5.1 U.A.E.
18.5.2 SAUDI ARABIA
18.5.3 EGYPT
18.5.4 SOUTH AFRICA
18.5.5 ISRAEL
18.5.6 KUWAIT
18.5.7 OMAN
18.5.8 BAHRAIN
18.5.9 QATAR
18.5.10 REST OF MIDDLE EAST AND AFRICA
18.6 SOUTH AMERICA
18.6.1 BRAZIL
18.6.2 CHILE
18.6.3 ARGENTINA
18.6.4 PERU
18.6.5 COLOMBIA
18.6.6 BOLIVIA
18.6.7 ECUADOR
18.6.8 PARAGUAY
18.6.9 URUGUAY
18.6.10 VENEZUELA
18.6.11 REST OF SOUTH AMERICA
19 EUROPE NUTS MARKET COMPANY LANDSCAPE
19.1 COMPANY SHARE ANALYSIS: GLOBAL
19.2 COMPANY SHARE ANALYSIS: NA
19.3 COMPANY SHARE ANALYSIS: APAC
19.4 COMPANY SHARE ANALYSIS: EUROPE
20 SWOT ANALYSIS
21 COMPANY PROFILES
21.1 ADM
21.1.1 COMPANY SNAPSHOT
21.1.2 REVENUE ANALYSIS
21.1.3 COMPANY SHARE ANALYSIS
21.1.4 PRODUCT PORTFOLIO
21.1.5 RECENT DEVELOPMENT
21.2 OLAM GROUP
21.2.1 COMPANY SNAPSHOT
21.2.2 REVENUE ANALYSIS
21.2.3 COMPANY SHARE ANALYSIS
21.2.4 PRODUCT PORTFOLIO
21.2.5 RECENT DEVELOPMENT
21.3 BARRY CALLEBAUT
21.3.1 COMPANY SNAPSHOT
21.3.2 REVENUE ANALYSIS
21.3.3 COMPANY SHARE ANALYSIS
21.3.4 PRODUCT PORTFOLIO
21.3.5 RECENT DEVELOPMENT
21.4 BLUE DIAMOND GROWERS.
21.4.1 COMPANY SNAPSHOT
21.4.2 COMPANY SHARE ANALYSIS
21.4.3 PRODUCT PORTFOLIO
21.4.4 RECENT DEVELOPMENTS/NEWS
21.5 JOHN B. SANFILIPPO & SON, INC.
21.5.1 COMPANY SNAPSHOT
21.5.2 REVENUE ANALYSIS
21.5.3 COMPANY SHARE ANALYSIS
21.5.4 PRODUCT PORTFOLIO
21.5.5 RECENT DEVELOPMENTS
21.6 BORGES AGRICULTURAL & INDUSTRIAL NUTS, S.A.
21.6.1 COMPANY SNAPSHOT
21.6.2 REVENUE ANALYSIS
21.6.3 PRODUCT PORTFOLIO
21.6.4 RECENT DEVELOPMENTS/NEWS
21.7 DEL ALBA.
21.7.1 COMPANY SNAPSHOT
21.7.2 PRODUCT PORTFOLIO
21.7.3 RECENT DEVELOPMENT/NEWS
21.8 DIAMOND FOODS
21.8.1 COMPANY SNAPSHOT
21.8.2 PRODUCT PORTFOLIO
21.8.3 RECENT DEVELOPMENTS/NEWS
21.9 GOLDEN PEANUT COMPANY, LLC
21.9.1 COMPANY SNAPSHOT
21.9.2 PRODUCT PORTFOLIO
21.9.3 RECENT DEVELOPMENTS
21.1 GOURMET NUT
21.10.1 COMPANY SNAPSHOT
21.10.2 PRODUCT PORTFOLIO
21.10.3 RECENT DEVELOPMENTS/NEWS
21.11 HINES NUT COMPANY
21.11.1 COMPANY SNAPSHOT
21.11.2 PRODUCT PORTFOLIO
21.12 HORMEL FOODS CORPORATION
21.12.1 COMPANY SNAPSHOT
21.12.2 REVENUE ANALYSIS
21.12.3 PRODUCT PORTFOLIO
21.12.4 RECENT DEVELOPMENTS/NEWS
21.13 INTERSNACK GROUP GMBH & CO. KG
21.13.1 COMPANY SNAPSHOT
21.13.2 PRODUCT PORTFOLIO
21.13.3 RECENT DEVELOPMENTS
21.14 JINDAL COCOA
21.14.1 COMPANY SNAPSHOT
21.14.2 PRODUCT PORTFOLIO
21.14.3 RECENT DEVELOPMENTS
21.15 MARIANI NUT COMPANY
21.15.1 COMPANY SNAPSHOT
21.15.2 PRODUCT PORTFOLIO
21.15.3 RECENT DEVELOPMENTS
21.16 MOUNT FRANKLIN FOODS
21.16.1 COMPANY SNAPSHOT
21.16.2 PRODUCT PORTFOLIO
21.16.3 RECENT DEVELOPMENTS
21.17 NOW FOODS
21.17.1 COMPANY SNAPSHOT
21.17.2 PRODUCT PORTFOLIO
21.17.3 RECENT DEVELOPMENTS/NEWS
21.18 NUTLAND
21.18.1 COMPANY SNAPSHOT
21.18.2 PRODUCT PORTFOLIO
21.18.3 RECENT DEVELOPMENTS
21.19 NUTWORK HANDELSGESELLSCHAFT MBH
21.19.1 COMPANY SNAPSHOT
21.19.2 PRODUCT PORTFOLIO
21.19.3 RECENT DEVELOPMENTS/NEWS
21.2 POINDEXTER NUT COMPANY
21.20.1 COMPANY SNAPSHOT
21.20.2 PRODUCT PORTFOLIO
21.20.3 RECENT DEVELOPMENTS
21.21 ROYAL NUT COMPANY
21.21.1 COMPANY SNAPSHOT
21.21.2 PRODUCT PORTFOLIO
21.21.3 RECENT DEVELOPMENTS
21.22 SAHALE SNACKS
21.22.1 COMPANY SNAPSHOT
21.22.2 PRODUCT PORTFOLIO
21.22.3 RECENT DEVELOPMENTS
21.23 SANTÉ NUTS
21.23.1 COMPANY SNAPSHOT
21.23.2 PRODUCT PORTFOLIO
21.23.3 RECENT DEVELOPMENTS/NEWS
21.24 SELECT HARVESTS LIMITED
21.24.1 COMPANY SNAPSHOT
21.24.2 REVENUE ANALYSIS
21.24.3 PRODUCT PORTFOLIO
21.24.4 RECENT DEVELOPMENTS/NEWS
21.25 SETTON PISTACHIO OF TERRA BELLA, INC.
21.25.1 COMPANY SNAPSHOT
21.25.2 PRODUCT PORTFOLIO
21.25.3 RECENT DEVELOPMENTS
21.26 TERRANUT
21.26.1 COMPANY SNAPSHOT
21.26.2 PRODUCT PORTFOLIO
21.26.3 RECENT DEVELOPMENTS/NEW
21.27 TREEHOUSE CALIFORNIA ALMONDS, LLC
21.27.1 COMPANY SNAPSHOT
21.27.2 PRODUCT PORTFOLIO
21.27.3 RECENT DEVELOPMENT
21.28 THE DAILY NUT CO.
21.28.1 COMPANY SNAPSHOT
21.28.2 PRODUCT PORTFOLIO
21.28.3 RECENT DEVELOPMENTS/NEWS
21.29 WONDERFUL PISTACHIOS LLC
21.29.1 COMPANY SNAPSHOT
21.29.2 PRODUCT PORTFOLIO
21.29.3 RECENT DEVELOPMENTS/NEWS
21.3 WESTERN NUT COMPANY INC.
21.30.1 COMPANY SNAPSHOT
21.30.2 PRODUCT PORTFOLIO
21.30.3 RECENT DEVELOPMENTS/NEWS
22 QUESTIONNAIRE
23 RELATED REPORTS
List of Table
TABLE 1 REGULATORY FRAMEWORK AND GUIDELINES
TABLE 2 COST FOR KEY EQUIPMENT AND THE OVERALL CASHEW NUTS PROCESSING PLANTS
TABLE 3 RECENT DEVELOPMENTS IN THE NUT, HIGHLIGHTING NEW PRODUCT LAUNCHES, INNOVATIONS, AND TRENDS
TABLE 4 TIMELINES AND MILESTONES IN THE NUTS INDUSTRY
TABLE 5 NUT IMPORT TARIFF RATES IN TOP 5 MARKETS (2024)
TABLE 6 LOCAL PRODUCTION V/S IMPORT RELIANCE
TABLE 7 REGULATORY INCLINATION
TABLE 8 TRADE PARTNERSHIPS BETWEEN THE COUNTRIES
TABLE 9 ALLIANCES ESTABLISHMENTS
TABLE 10 ESTABLISHMENT OF SPECIAL ECONOMIC ZONES (SEZS) AND INDUSTRIAL PARKS
TABLE 11 COMPARATIVE BRAND ANALYSIS
TABLE 12 PRODUCTION
TABLE 13 CONSUMPTION
TABLE 14 CONSUMER BUYING BEHAVIOUR
TABLE 15 EXPORT DATA SETS
TABLE 16 IMPORT DATA SETS
TABLE 17 CONSUMER BUYING BEHAVIOUR
TABLE 18 EUROPE NUTS MARKET, BY PRODUCT TYPE, 2018-2032 (USD THOUSAND)
TABLE 19 EUROPE NUTS MARKET, BY PRODUCT TYPE, 2018-2032 (THOUSAND TONS)
TABLE 20 EUROPE TREE NUTS IN NUTS MARKET, BY REGION, 2018-2032 (USD THOUSAND)
TABLE 21 EUROPE TREE NUTS IN NUTS MARKET, BY TYPE, 2018-2032 (USD THOUSAND)
TABLE 22 EUROPE GROUND NUTS IN NUTS MARKET, BY REGION, 2018-2032 (USD THOUSAND)
TABLE 23 EUROPE GROUND NUTS IN NUTS MARKET, BY TYPE, 2018-2032 (USD THOUSAND)
TABLE 24 EUROPE HYBRID/OTHER NUTS IN NUTS MARKET, BY REGION, 2018-2032 (USD THOUSAND)
TABLE 25 EUROPE HYBRID/OTHER NUTS IN NUTS MARKET, BY TYPE, 2018-2032 (USD THOUSAND)
TABLE 26 EUROPE OTHERS IN NUTS MARKET, BY REGION, 2018-2032 (USD THOUSAND)
TABLE 27 EUROPE NUTS MARKET, BY FORM, 2018-2032 (USD THOUSAND)
TABLE 28 EUROPE WHOLE IN NUTS MARKET, BY REGION, 2018-2032 (USD THOUSAND)
TABLE 29 EUROPE BUTTER IN NUTS MARKET, BY REGION, 2018-2032 (USD THOUSAND)
TABLE 30 EUROPE GROUND IN NUTS MARKET, BY REGION, 2018-2032 (USD THOUSAND)
TABLE 31 EUROPE HALVES IN NUTS MARKET, BY REGION, 2018-2032 (USD THOUSAND)
TABLE 32 EUROPE PIECES IN NUTS MARKET, BY REGION, 2018-2032 (USD THOUSAND)
TABLE 33 EUROPE OIL IN NUTS MARKET, BY REGION, 2018-2032 (USD THOUSAND)
TABLE 34 EUROPE MILK IN NUTS MARKET, BY REGION, 2018-2032 (USD THOUSAND)
TABLE 35 EUROPE PASTE IN NUTS MARKET, BY REGION, 2018-2032 (USD THOUSAND)
TABLE 36 EUROPE CREAM IN NUTS MARKET, BY REGION, 2018-2032 (USD THOUSAND)
TABLE 37 EUROPE ROASTED PIECES IN NUTS MARKET, BY REGION, 2018-2032 (USD THOUSAND)
TABLE 38 EUROPE COATED IN NUTS MARKET, BY REGION, 2018-2032 (USD THOUSAND)
TABLE 39 EUROPE FLOUR IN NUTS MARKET, BY REGION, 2018-2032 (USD THOUSAND)
TABLE 40 EUROPE POWDER IN NUTS MARKET, BY REGION, 2018-2032 (USD THOUSAND)
TABLE 41 EUROPE CHOPPED IN NUTS MARKET, BY REGION, 2018-2032 (USD THOUSAND)
TABLE 42 EUROPE SLICED IN NUTS MARKET, BY REGION, 2018-2032 (USD THOUSAND)
TABLE 43 EUROPE DICED IN NUTS MARKET, BY REGION, 2018-2032 (USD THOUSAND)
TABLE 44 EUROPE CRUSHED IN NUTS MARKET, BY REGION, 2018-2032 (USD THOUSAND)
TABLE 45 EUROPE BLANCHED WHOLE IN NUTS MARKET, BY REGION, 2018-2032 (USD THOUSAND)
TABLE 46 EUROPE FROZEN IN NUTS MARKET, BY REGION, 2018-2032 (USD THOUSAND)
TABLE 47 EUROPE SPRAY-DRIED IN NUTS MARKET, BY REGION, 2018-2032 (USD THOUSAND)
TABLE 48 EUROPE ENCAPSULATED IN NUTS MARKET, BY REGION, 2018-2032 (USD THOUSAND)
TABLE 49 EUROPE OTHERS IN NUTS MARKET, BY REGION, 2018-2032 (USD THOUSAND)
TABLE 50 EUROPE NUTS MARKET, BY NATURE, 2018-2032 (USD THOUSAND)
TABLE 51 EUROPE CONVENTIONAL IN NUTS MARKET, BY REGION, 2018-2032 (USD THOUSAND)
TABLE 52 EUROPE ORGANIC IN NUTS MARKET, BY REGION, 2018-2032 (USD THOUSAND)
TABLE 53 EUROPE NUTS MARKET, BY PROCESSING METHOD, 2018-2032 (USD THOUSAND)
TABLE 54 EUROPE RAW IN NUTS MARKET, BY REGION, 2018-2032 (USD THOUSAND)
TABLE 55 EUROPE ROASTED IN NUTS MARKET, BY REGION, 2018-2032 (USD THOUSAND)
TABLE 56 EUROPE ROASTED IN NUTS MARKET, BY TYPE, 2018-2032 (USD THOUSAND)
TABLE 57 EUROPE SALTED IN NUTS MARKET, BY REGION, 2018-2032 (USD THOUSAND)
TABLE 58 EUROPE BLANCHED IN NUTS MARKET, BY REGION, 2018-2032 (USD THOUSAND)
TABLE 59 EUROPE FLAVORED IN NUTS MARKET, BY REGION, 2018-2032 (USD THOUSAND)
TABLE 60 EUROPE FLAVORED IN NUTS MARKET, BY TYPE, 2018-2032 (USD THOUSAND)
TABLE 61 EUROPE UNSALTED IN NUTS MARKET, BY REGION, 2018-2032 (USD THOUSAND)
TABLE 62 EUROPE GLAZED IN NUTS MARKET, BY REGION, 2018-2032 (USD THOUSAND)
TABLE 63 EUROPE CANDIED IN NUTS MARKET, BY REGION, 2018-2032 (USD THOUSAND)
TABLE 64 EUROPE CARAMELIZED IN NUTS MARKET, BY REGION, 2018-2032 (USD THOUSAND)
TABLE 65 EUROPE SMOKED IN NUTS MARKET, BY REGION, 2018-2032 (USD THOUSAND)
TABLE 66 EUROPE SPROUTED IN NUTS MARKET, BY REGION, 2018-2032 (USD THOUSAND)
TABLE 67 EUROPE FERMENTED IN NUTS MARKET, BY REGION, 2018-2032 (USD THOUSAND)
TABLE 68 EUROPE FREEZE-DRIED IN NUTS MARKET, BY REGION, 2018-2032 (USD THOUSAND)
TABLE 69 EUROPE PICKLED IN NUTS MARKET, BY REGION, 2018-2032 (USD THOUSAND)
TABLE 70 EUROPE VACUUM-FRIED IN NUTS MARKET, BY REGION, 2018-2032 (USD THOUSAND)
TABLE 71 EUROPE DEHYDRATED IN NUTS MARKET, BY REGION, 2018-2032 (USD THOUSAND)
TABLE 72 EUROPE OTHERS IN NUTS MARKET, BY REGION, 2018-2032 (USD THOUSAND)
TABLE 73 EUROPE NUTS MARKET, BY GRADE, 2018-2032 (USD THOUSAND)
TABLE 74 EUROPE A GRADE (PREMIUM EXPORT QUALITY) IN NUTS MARKET, BY REGION, 2018-2032 (USD THOUSAND)
TABLE 75 EUROPE B GRADE (MID-QUALITY DOMESTIC USE) IN NUTS MARKET, BY REGION, 2018-2032 (USD THOUSAND)
TABLE 76 EUROPE BROKEN GRADE (BAKERY & CONFECTIONERY USE) IN NUTS MARKET, BY REGION, 2018-2032 (USD THOUSAND)
TABLE 77 EUROPE OIL-GRADE IN NUTS MARKET, BY REGION, 2018-2032 (USD THOUSAND)
TABLE 78 EUROPE INDUSTRIAL GRADE IN NUTS MARKET, BY REGION, 2018-2032 (USD THOUSAND)
TABLE 79 EUROPE REJECTED GRADE (ANIMAL FEED) IN NUTS MARKET, BY REGION, 2018-2032 (USD THOUSAND)
TABLE 80 EUROPE NUTS MARKET, BY SHELF LIFE, 2018-2032 (USD THOUSAND)
TABLE 81 EUROPE <6 MONTHS IN NUTS MARKET, BY REGION, 2018-2032 (USD THOUSAND)
TABLE 82 EUROPE 6–12 MONTHS IN NUTS MARKET, BY REGION, 2018-2032 (USD THOUSAND)
TABLE 83 EUROPE I13–18 MONTHS N NUTS MARKET, BY REGION, 2018-2032 (USD THOUSAND)
TABLE 84 EUROPE 18 MONTHS IN NUTS MARKET, BY REGION, 2018-2032 (USD THOUSAND)
TABLE 85 EUROPE MORE THAN 18 MONTHS IN NUTS MARKET, BY REGION, 2018-2032 (USD THOUSAND)
TABLE 86 EUROPE NUTS MARKET, BY CERTIFICATION, 2018-2032 (USD THOUSAND)
TABLE 87 EUROPE ISO 22000/HACCP IN NUTS MARKET, BY REGION, 2018-2032 (USD THOUSAND)
TABLE 88 EUROPE USDA ORGANIC IN NUTS MARKET, BY REGION, 2018-2032 (USD THOUSAND)
TABLE 89 EUROPE EU ORGANIC IN NUTS MARKET, BY REGION, 2018-2032 (USD THOUSAND)
TABLE 90 EUROPE NON-GMO VERIFIED IN NUTS MARKET, BY REGION, 2018-2032 (USD THOUSAND)
TABLE 91 EUROPE GLUTEN-FREE CERTIFIED IN NUTS MARKET, BY REGION, 2018-2032 (USD THOUSAND)
TABLE 92 EUROPE KOSHER IN NUTS MARKET, BY REGION, 2018-2032 (USD THOUSAND)
TABLE 93 EUROPE HALAL IN NUTS MARKET, BY REGION, 2018-2032 (USD THOUSAND)
TABLE 94 EUROPE VEGAN CERTIFIED IN NUTS MARKET, BY REGION, 2018-2032 (USD THOUSAND)
TABLE 95 EUROPE FAIR TRADE IN NUTS MARKET, BY REGION, 2018-2032 (USD THOUSAND)
TABLE 96 EUROPE RAINFOREST ALLIANCE IN NUTS MARKET, BY REGION, 2018-2032 (USD THOUSAND)
TABLE 97 EUROPE CARBON NEUTRAL CERTIFIED IN NUTS MARKET, BY REGION, 2018-2032 (USD THOUSAND)
TABLE 98 EUROPE OTHERS IN NUTS MARKET, BY REGION, 2018-2032 (USD THOUSAND)
TABLE 99 EUROPE NUTS MARKET, BY PACKAGING, 2018-2032 (USD THOUSAND)
TABLE 100 EUROPE PLASTIC POUCHES IN NUTS MARKET, BY REGION, 2018-2032 (USD THOUSAND)
TABLE 101 TABLE 14 EUROPE PLASTIC POUCHES IN NUTS MARKET, BY TYPE, 2018-2032 (USD THOUSAND)
TABLE 102 EUROPE VACUUM-SEALED PACKS IN NUTS MARKET, BY REGION, 2018-2032 (USD THOUSAND)
TABLE 103 EUROPE PET JARS IN NUTS MARKET, BY REGION, 2018-2032 (USD THOUSAND)
TABLE 104 EUROPE PAPER BAGS IN NUTS MARKET, BY REGION, 2018-2032 (USD THOUSAND)
TABLE 105 EUROPE COMPOSITE CANS IN NUTS MARKET, BY REGION, 2018-2032 (USD THOUSAND)
TABLE 106 EUROPE BULK WOVEN SACKS IN NUTS MARKET, BY REGION, 2018-2032 (USD THOUSAND)
TABLE 107 EUROPE GLASS JARS IN NUTS MARKET, BY REGION, 2018-2032 (USD THOUSAND)
TABLE 108 EUROPE SACHETS/SINGLE-SERVE IN NUTS MARKET, BY REGION, 2018-2032 (USD THOUSAND)
TABLE 109 EUROPE GIFT BOXES IN NUTS MARKET, BY REGION, 2018-2032 (USD THOUSAND)
TABLE 110 EUROPE BIO-BASED/COMPOSTABLE IN NUTS MARKET, BY REGION, 2018-2032 (USD THOUSAND)
TABLE 111 EUROPE METAL TINS IN NUTS MARKET, BY REGION, 2018-2032 (USD THOUSAND)
TABLE 112 EUROPE RESEALABLE ECO-TUBS IN NUTS MARKET, BY REGION, 2018-2032 (USD THOUSAND)
TABLE 113 EUROPE FOIL-WRAPPED BARS IN NUTS MARKET, BY REGION, 2018-2032 (USD THOUSAND)
TABLE 114 EUROPE REFILL PACKS IN NUTS MARKET, BY REGION, 2018-2032 (USD THOUSAND)
TABLE 115 EUROPE OTHERS IN NUTS MARKET, BY REGION, 2018-2032 (USD THOUSAND)
TABLE 116 EUROPE NUTS MARKET, BY PACKAGING SIZE, 2018-2032 (USD THOUSAND)
TABLE 117 EUROPE 101G–250G IN NUTS MARKET, BY REGION, 2018-2032 (USD THOUSAND)
TABLE 118 EUROPE 251G–500G IN NUTS MARKET, BY REGION, 2018-2032 (USD THOUSAND)
TABLE 119 EUROPE 51G–100G IN NUTS MARKET, BY REGION, 2018-2032 (USD THOUSAND)
TABLE 120 EUROPE 25G–50G IN NUTS MARKET, BY REGION, 2018-2032 (USD THOUSAND)
TABLE 121 EUROPE 501G–1KG IN NUTS MARKET, BY REGION, 2018-2032 (USD THOUSAND)
TABLE 122 EUROPE 1.1KG–2.5KG IN NUTS MARKET, BY REGION, 2018-2032 (USD THOUSAND)
TABLE 123 EUROPE 2.6KG–5KG IN NUTS MARKET, BY REGION, 2018-2032 (USD THOUSAND)
TABLE 124 EUROPE 5.1KG–10KG IN NUTS MARKET, BY REGION, 2018-2032 (USD THOUSAND)
TABLE 125 EUROPE 10.1KG–25KG IN NUTS MARKET, BY REGION, 2018-2032 (USD THOUSAND)
TABLE 126 EUROPE 25.1KG–50KG IN NUTS MARKET, BY REGION, 2018-2032 (USD THOUSAND)
TABLE 127 EUROPE 50KG IN NUTS MARKET, BY REGION, 2018-2032 (USD THOUSAND)
TABLE 128 EUROPE <25G IN NUTS MARKET, BY REGION, 2018-2032 (USD THOUSAND)
TABLE 129 EUROPE NUTS MARKET, BY PRICE RANGE, 2018-2032 (USD THOUSAND)
TABLE 130 EUROPE ECONOMY/BUDGET (USD 1.00-6.00 PER KG) IN NUTS MARKET, BY REGION, 2018-2032 (USD THOUSAND)
TABLE 131 EUROPE MID-RANGE (USD 6.01-12.00 PER KG) IN NUTS MARKET, BY REGION, 2018-2032 (USD THOUSAND)
TABLE 132 EUROPE PREMIUM (USD 12.01-20.00 PER KG) IN NUTS MARKET, BY REGION, 2018-2032 (USD THOUSAND)
TABLE 133 EUROPE SUPER-PREMIUM/GOURMET (ABOVE USD 20.00 PER KG) IN NUTS MARKET, BY REGION, 2018-2032 (USD THOUSAND)
TABLE 134 EUROPE NUTS MARKET, BY END-USE, 2018-2032 (USD THOUSAND)
TABLE 135 EUROPE DIRECT CONSUMPTION IN NUTS MARKET, BY REGION, 2018-2032 (USD THOUSAND)
TABLE 136 EUROPE SNACKS IN NUTS MARKET, BY REGION, 2018-2032 (USD THOUSAND)
TABLE 137 EUROPE NUT BUTTERS & SPREADS IN NUTS MARKET, BY REGION, 2018-2032 (USD THOUSAND)
TABLE 138 EUROPE BAKERY INDUSTRY IN NUTS MARKET, BY REGION, 2018-2032 (USD THOUSAND)
TABLE 139 EUROPE CONFECTIONERY INDUSTRY IN NUTS MARKET, BY REGION, 2018-2032 (USD THOUSAND)
TABLE 140 EUROPE CEREAL & GRANOLA MANUFACTURING IN NUTS MARKET, BY REGION, 2018-2032 (USD THOUSAND)
TABLE 141 EUROPE FUNCTIONAL NUTRITION IN NUTS MARKET, BY REGION, 2018-2032 (USD THOUSAND)
TABLE 142 EUROPE FUNCTIONAL NUTRITION IN NUTS MARKET, BY TYPE, 2018-2032 (USD THOUSAND)
TABLE 143 EUROPE DAIRY ALTERNATIVES IN NUTS MARKET, BY REGION, 2018-2032 (USD THOUSAND)
TABLE 144 EUROPE BEVERAGE INDUSTRY IN NUTS MARKET, BY REGION, 2018-2032 (USD THOUSAND)
TABLE 145 EUROPE BEVERAGE INDUSTRY IN NUTS MARKET, BY TYPE, 2018-2032 (USD THOUSAND)
TABLE 146 EUROPE PLANT-BASED MEATS IN NUTS MARKET, BY REGION, 2018-2032 (USD THOUSAND)
TABLE 147 EUROPE CULINARY IN NUTS MARKET, BY REGION, 2018-2032 (USD THOUSAND)
TABLE 148 EUROPE CULINARY IN NUTS MARKET, BY TYPE, 2018-2032 (USD THOUSAND)
TABLE 149 EUROPE INDUSTRIAL OIL EXTRACTION IN NUTS MARKET, BY REGION, 2018-2032 (USD THOUSAND)
TABLE 150 EUROPE FLOUR & GLUTEN-FREE BAKING IN NUTS MARKET, BY REGION, 2018-2032 (USD THOUSAND)
TABLE 151 EUROPE PERSONAL CARE PRODUCTS IN NUTS MARKET, BY REGION, 2018-2032 (USD THOUSAND)
TABLE 152 EUROPE PERSONAL CARE PRODUCTS IN NUTS MARKET, BY TYPE, 2018-2032 (USD THOUSAND)
TABLE 153 EUROPE BIO-BASED & AGRO-INDUSTRIAL USES IN NUTS MARKET, BY REGION, 2018-2032 (USD THOUSAND)
TABLE 154 EUROPE BIO-BASED & AGRO-INDUSTRIAL USES IN NUTS MARKET, BY TYPE, 2018-2032 (USD THOUSAND)
TABLE 155 EUROPE PET FOOD ADDITIVES IN NUTS MARKET, BY REGION, 2018-2032 (USD THOUSAND)
TABLE 156 EUROPE ANIMAL FEED IN NUTS MARKET, BY REGION, 2018-2032 (USD THOUSAND)
TABLE 157 EUROPE ANIMAL FEED IN NUTS MARKET, BY TYPE, 2018-2032 (USD THOUSAND)
TABLE 158 EUROPE OTHERS IN NUTS MARKET, BY REGION, 2018-2032 (USD THOUSAND)
TABLE 159 EUROPE NUTS MARKET, BY DISTRIBUTION CHANNEL, 2018-2032 (USD THOUSAND)
TABLE 160 EUROPE B2B IN NUTS MARKET, BY REGION, 2018-2032 (USD THOUSAND)
TABLE 161 EUROPE B2C IN NUTS MARKET, BY REGION, 2018-2032 (USD THOUSAND)
TABLE 162 EUROPE B2C IN NUTS MARKET, BY TYPE, 2018-2032 (USD THOUSAND)
TABLE 163 EUROPE OFFLINE IN NUTS MARKET, BY TYPE, 2018-2032 (USD THOUSAND)
TABLE 164 EUROPE ONLINE IN NUTS MARKET, BY TYPE, 2018-2032 (USD THOUSAND)
TABLE 165 EUROPE NUTS MARKET, BY REGION, 2018-2032, USD (THOUSAND)
TABLE 166 NORTH AMERICA NUTS MARKET, BY COUNTRY, 2018-2032 (USD THOUSAND)
TABLE 167 NORTH AMERICA NUTS MARKET, BY PRODUCT TYPE, 2018-2032 (USD THOUSAND)
TABLE 168 NORTH AMERICA NUTS MARKET, BY PRODUCT TYPE, 2018-2032 (THOUSAND TONS)
TABLE 169 NORTH AMERICA TREE NUTS IN NUTS MARKET, BY TYPE, 2018-2032 (USD THOUSAND)
TABLE 170 NORTH AMERICA GROUND NUTS IN NUTS MARKET, BY PEANUTS, 2018-2032 (USD THOUSAND)
TABLE 171 NORTH AMERICA HYBRID/OTHER NUTS IN NUTS MARKET, BY TYPE, 2018-2032 (USD THOUSAND)
TABLE 172 NORTH AMERICA NUTS MARKET, BY FORM, 2018-2032 (USD THOUSAND)
TABLE 173 NORTH AMERICA NUTS MARKET, BY NATURE, 2018-2032 (USD THOUSAND)
TABLE 174 NORTH AMERICA NUTS MARKET, BY PROCESSING METHOD, 2018-2032 (USD THOUSAND)
TABLE 175 NORTH AMERICA ROASTED IN NUTS MARKET, BY TYPE, 2018-2032 (USD THOUSAND)
TABLE 176 NORTH AMERICA FLAVORED IN NUTS MARKET, BY TYPE, 2018-2032 (USD THOUSAND)
TABLE 177 NORTH AMERICA NUTS MARKET, BY GRADE, 2018-2032 (USD THOUSAND)
TABLE 178 NORTH AMERICA NUTS MARKET, BY SHELF LIFE, 2018-2032 (USD THOUSAND)
TABLE 179 NORTH AMERICA NUTS MARKET, BY CERTIFICATION, 2018-2032 (USD THOUSAND)
TABLE 180 NORTH AMERICA NUTS MARKET, BY PACKAGING, 2018-2032 (USD THOUSAND)
TABLE 181 NORTH AMERICA PLASTIC POUCHES IN NUTS MARKET, BY TYPE, 2018-2032 (USD THOUSAND)
TABLE 182 NORTH AMERICA NUTS MARKET, BY PACKAGING SIZE, 2018-2032 (USD THOUSAND)
TABLE 183 NORTH AMERICA NUTS MARKET, BY PRICE RANGE, 2018-2032 (USD THOUSAND)
TABLE 184 NORTH AMERICA NUTS MARKET, BY END-USE, 2018-2032 (USD THOUSAND)
TABLE 185 NORTH AMERICA FUNCTIONAL NUTRITION IN NUTS MARKET, BY TYPE, 2018-2032 (USD THOUSAND)
TABLE 186 NORTH AMERICA BEVERAGE INDUSTRY IN NUTS MARKET, BY TYPE, 2018-2032 (USD THOUSAND)
TABLE 187 NORTH AMERICA CULINARY IN NUTS MARKET, BY TYPE, 2018-2032 (USD THOUSAND)
TABLE 188 NORTH AMERICA PERSONAL CARE PRODUCTS IN NUTS MARKET, BY TYPE, 2018-2032 (USD THOUSAND)
TABLE 189 NORTH AMERICA BIO-BASED & AGRO-INDUSTRIAL USES IN NUTS MARKET, BY TYPE, 2018-2032 (USD THOUSAND)
TABLE 190 NORTH AMERICA ANIMAL FEED IN NUTS MARKET, BY TYPE, 2018-2032 (USD THOUSAND)
TABLE 191 NORTH AMERICA NUTS MARKET, BY DISTRIBUTION CHANNEL, 2018-2032 (USD THOUSAND)
TABLE 192 NORTH AMERICA B2C IN NUTS MARKET, BY TYPE, 2018-2032 (USD THOUSAND)
TABLE 193 NORTH AMERICA OFFLINE IN NUTS MARKET, BY TYPE, 2018-2032 (USD THOUSAND)
TABLE 194 NORTH AMERICA ONLINE IN NUTS MARKET, BY TYPE, 2018-2032 (USD THOUSAND)
TABLE 195 U.S. NUTS MARKET, BY PRODUCT TYPE, 2018-2032 (USD THOUSAND)
TABLE 196 U.S. NUTS MARKET, BY PRODUCT TYPE, 2018-2032 (THOUSAND TONS)
TABLE 197 U.S. TREE NUTS IN NUTS MARKET, BY TYPE, 2018-2032 (USD THOUSAND)
TABLE 198 U.S. GROUND NUTS IN NUTS MARKET, BY PEANUTS, 2018-2032 (USD THOUSAND)
TABLE 199 U.S. HYBRID/OTHER NUTS IN NUTS MARKET, BY TYPE, 2018-2032 (USD THOUSAND)
TABLE 200 U.S. NUTS MARKET, BY FORM, 2018-2032 (USD THOUSAND)
TABLE 201 U.S. NUTS MARKET, BY NATURE, 2018-2032 (USD THOUSAND)
TABLE 202 U.S. NUTS MARKET, BY PROCESSING METHOD, 2018-2032 (USD THOUSAND)
TABLE 203 U.S. ROASTED IN NUTS MARKET, BY TYPE, 2018-2032 (USD THOUSAND)
TABLE 204 U.S. FLAVORED IN NUTS MARKET, BY TYPE, 2018-2032 (USD THOUSAND)
TABLE 205 U.S. NUTS MARKET, BY GRADE, 2018-2032 (USD THOUSAND)
TABLE 206 U.S. NUTS MARKET, BY SHELF LIFE, 2018-2032 (USD THOUSAND)
TABLE 207 U.S. NUTS MARKET, BY CERTIFICATION, 2018-2032 (USD THOUSAND)
TABLE 208 U.S. NUTS MARKET, BY PACKAGING, 2018-2032 (USD THOUSAND)
TABLE 209 U.S. PLASTIC POUCHES IN NUTS MARKET, BY TYPE, 2018-2032 (USD THOUSAND)
TABLE 210 U.S. NUTS MARKET, BY PACKAGING SIZE, 2018-2032 (USD THOUSAND)
TABLE 211 U.S. NUTS MARKET, BY PRICE RANGE, 2018-2032 (USD THOUSAND)
TABLE 212 U.S. NUTS MARKET, BY END-USE, 2018-2032 (USD THOUSAND)
TABLE 213 U.S. FUNCTIONAL NUTRITION IN NUTS MARKET, BY TYPE, 2018-2032 (USD THOUSAND)
TABLE 214 U.S. BEVERAGE INDUSTRY IN NUTS MARKET, BY TYPE, 2018-2032 (USD THOUSAND)
TABLE 215 U.S. CULINARY IN NUTS MARKET, BY TYPE, 2018-2032 (USD THOUSAND)
TABLE 216 U.S. PERSONAL CARE PRODUCTS IN NUTS MARKET, BY TYPE, 2018-2032 (USD THOUSAND)
TABLE 217 U.S. BIO-BASED & AGRO-INDUSTRIAL USES IN NUTS MARKET, BY TYPE, 2018-2032 (USD THOUSAND)
TABLE 218 U.S. ANIMAL FEED IN NUTS MARKET, BY TYPE, 2018-2032 (USD THOUSAND)
TABLE 219 U.S. NUTS MARKET, BY DISTRIBUTION CHANNEL, 2018-2032 (USD THOUSAND)
TABLE 220 U.S. B2C IN NUTS MARKET, BY TYPE, 2018-2032 (USD THOUSAND)
TABLE 221 U.S. OFFLINE IN NUTS MARKET, BY TYPE, 2018-2032 (USD THOUSAND)
TABLE 222 U.S. ONLINE IN NUTS MARKET, BY TYPE, 2018-2032 (USD THOUSAND)
TABLE 223 CANADA NUTS MARKET, BY PRODUCT TYPE, 2018-2032 (USD THOUSAND)
TABLE 224 CANADA NUTS MARKET, BY PRODUCT TYPE, 2018-2032 (THOUSAND TONS)
TABLE 225 CANADA TREE NUTS IN NUTS MARKET, BY TYPE, 2018-2032 (USD THOUSAND)
TABLE 226 CANADA GROUND NUTS IN NUTS MARKET, BY PEANUTS, 2018-2032 (USD THOUSAND)
TABLE 227 CANADA HYBRID/OTHER NUTS IN NUTS MARKET, BY TYPE, 2018-2032 (USD THOUSAND)
TABLE 228 CANADA NUTS MARKET, BY FORM, 2018-2032 (USD THOUSAND)
TABLE 229 CANADA NUTS MARKET, BY NATURE, 2018-2032 (USD THOUSAND)
TABLE 230 CANADA NUTS MARKET, BY PROCESSING METHOD, 2018-2032 (USD THOUSAND)
TABLE 231 CANADA ROASTED IN NUTS MARKET, BY TYPE, 2018-2032 (USD THOUSAND)
TABLE 232 CANADA FLAVORED IN NUTS MARKET, BY TYPE, 2018-2032 (USD THOUSAND)
TABLE 233 CANADA NUTS MARKET, BY GRADE, 2018-2032 (USD THOUSAND)
TABLE 234 CANADA NUTS MARKET, BY SHELF LIFE, 2018-2032 (USD THOUSAND)
TABLE 235 CANADA NUTS MARKET, BY CERTIFICATION, 2018-2032 (USD THOUSAND)
TABLE 236 CANADA NUTS MARKET, BY PACKAGING, 2018-2032 (USD THOUSAND)
TABLE 237 CANADA PLASTIC POUCHES IN NUTS MARKET, BY TYPE, 2018-2032 (USD THOUSAND)
TABLE 238 CANADA NUTS MARKET, BY PACKAGING SIZE, 2018-2032 (USD THOUSAND)
TABLE 239 CANADA NUTS MARKET, BY PRICE RANGE, 2018-2032 (USD THOUSAND)
TABLE 240 CANADA NUTS MARKET, BY END-USE, 2018-2032 (USD THOUSAND)
TABLE 241 CANADA FUNCTIONAL NUTRITION IN NUTS MARKET, BY TYPE, 2018-2032 (USD THOUSAND)
TABLE 242 CANADA BEVERAGE INDUSTRY IN NUTS MARKET, BY TYPE, 2018-2032 (USD THOUSAND)
TABLE 243 CANADA CULINARY IN NUTS MARKET, BY TYPE, 2018-2032 (USD THOUSAND)
TABLE 244 CANADA PERSONAL CARE PRODUCTS IN NUTS MARKET, BY TYPE, 2018-2032 (USD THOUSAND)
TABLE 245 CANADA BIO-BASED & AGRO-INDUSTRIAL USES IN NUTS MARKET, BY TYPE, 2018-2032 (USD THOUSAND)
TABLE 246 CANADA ANIMAL FEED IN NUTS MARKET, BY TYPE, 2018-2032 (USD THOUSAND)
TABLE 247 CANADA NUTS MARKET, BY DISTRIBUTION CHANNEL, 2018-2032 (USD THOUSAND)
TABLE 248 CANADA B2C IN NUTS MARKET, BY TYPE, 2018-2032 (USD THOUSAND)
TABLE 249 CANADA OFFLINE IN NUTS MARKET, BY TYPE, 2018-2032 (USD THOUSAND)
TABLE 250 CANADA ONLINE IN NUTS MARKET, BY TYPE, 2018-2032 (USD THOUSAND)
TABLE 251 MEXICO NUTS MARKET, BY PRODUCT TYPE, 2018-2032 (USD THOUSAND)
TABLE 252 MEXICO NUTS MARKET, BY PRODUCT TYPE, 2018-2032 (THOUSAND TONS)
TABLE 253 MEXICO TREE NUTS IN NUTS MARKET, BY TYPE, 2018-2032 (USD THOUSAND)
TABLE 254 MEXICO GROUND NUTS IN NUTS MARKET, BY PEANUTS, 2018-2032 (USD THOUSAND)
TABLE 255 MEXICO HYBRID/OTHER NUTS IN NUTS MARKET, BY TYPE, 2018-2032 (USD THOUSAND)
TABLE 256 MEXICO NUTS MARKET, BY FORM, 2018-2032 (USD THOUSAND)
TABLE 257 MEXICO NUTS MARKET, BY NATURE, 2018-2032 (USD THOUSAND)
TABLE 258 MEXICO NUTS MARKET, BY PROCESSING METHOD, 2018-2032 (USD THOUSAND)
TABLE 259 MEXICO ROASTED IN NUTS MARKET, BY TYPE, 2018-2032 (USD THOUSAND)
TABLE 260 MEXICO FLAVORED IN NUTS MARKET, BY TYPE, 2018-2032 (USD THOUSAND)
TABLE 261 MEXICO NUTS MARKET, BY GRADE, 2018-2032 (USD THOUSAND)
TABLE 262 MEXICO NUTS MARKET, BY SHELF LIFE, 2018-2032 (USD THOUSAND)
TABLE 263 MEXICO NUTS MARKET, BY CERTIFICATION, 2018-2032 (USD THOUSAND)
TABLE 264 MEXICO NUTS MARKET, BY PACKAGING, 2018-2032 (USD THOUSAND)
TABLE 265 MEXICO PLASTIC POUCHES IN NUTS MARKET, BY TYPE, 2018-2032 (USD THOUSAND)
TABLE 266 MEXICO NUTS MARKET, BY PACKAGING SIZE, 2018-2032 (USD THOUSAND)
TABLE 267 MEXICO NUTS MARKET, BY PRICE RANGE, 2018-2032 (USD THOUSAND)
TABLE 268 MEXICO NUTS MARKET, BY END-USE, 2018-2032 (USD THOUSAND)
TABLE 269 MEXICO FUNCTIONAL NUTRITION IN NUTS MARKET, BY TYPE, 2018-2032 (USD THOUSAND)
TABLE 270 MEXICO BEVERAGE INDUSTRY IN NUTS MARKET, BY TYPE, 2018-2032 (USD THOUSAND)
TABLE 271 MEXICO CULINARY IN NUTS MARKET, BY TYPE, 2018-2032 (USD THOUSAND)
TABLE 272 MEXICO PERSONAL CARE PRODUCTS IN NUTS MARKET, BY TYPE, 2018-2032 (USD THOUSAND)
TABLE 273 MEXICO BIO-BASED & AGRO-INDUSTRIAL USES IN NUTS MARKET, BY TYPE, 2018-2032 (USD THOUSAND)
TABLE 274 MEXICO ANIMAL FEED IN NUTS MARKET, BY TYPE, 2018-2032 (USD THOUSAND)
TABLE 275 MEXICO NUTS MARKET, BY DISTRIBUTION CHANNEL, 2018-2032 (USD THOUSAND)
TABLE 276 MEXICO B2C IN NUTS MARKET, BY TYPE, 2018-2032 (USD THOUSAND)
TABLE 277 MEXICO OFFLINE IN NUTS MARKET, BY TYPE, 2018-2032 (USD THOUSAND)
TABLE 278 MEXICO ONLINE IN NUTS MARKET, BY TYPE, 2018-2032 (USD THOUSAND)
TABLE 279 EUROPE NUTS MARKET, BY COUNTRY, 2018-2032 (USD THOUSAND)
TABLE 280 EUROPE NUTS MARKET, BY PRODUCT TYPE, 2018-2032 (USD THOUSAND)
TABLE 281 EUROPE NUTS MARKET, BY PRODUCT TYPE, 2018-2032 (THOUSAND TONS)
TABLE 282 EUROPE TREE NUTS IN NUTS MARKET, BY TYPE, 2018-2032 (USD THOUSAND)
TABLE 283 EUROPE GROUND NUTS IN NUTS MARKET, BY PEANUTS, 2018-2032 (USD THOUSAND)
TABLE 284 EUROPE HYBRID/OTHER NUTS IN NUTS MARKET, BY TYPE, 2018-2032 (USD THOUSAND)
TABLE 285 EUROPE NUTS MARKET, BY FORM, 2018-2032 (USD THOUSAND)
TABLE 286 EUROPE NUTS MARKET, BY NATURE, 2018-2032 (USD THOUSAND)
TABLE 287 EUROPE NUTS MARKET, BY PROCESSING METHOD, 2018-2032 (USD THOUSAND)
TABLE 288 EUROPE ROASTED IN NUTS MARKET, BY TYPE, 2018-2032 (USD THOUSAND)
TABLE 289 EUROPE FLAVORED IN NUTS MARKET, BY TYPE, 2018-2032 (USD THOUSAND)
TABLE 290 EUROPE NUTS MARKET, BY GRADE, 2018-2032 (USD THOUSAND)
TABLE 291 EUROPE NUTS MARKET, BY SHELF LIFE, 2018-2032 (USD THOUSAND)
TABLE 292 EUROPE NUTS MARKET, BY CERTIFICATION, 2018-2032 (USD THOUSAND)
TABLE 293 EUROPE NUTS MARKET, BY PACKAGING, 2018-2032 (USD THOUSAND)
TABLE 294 EUROPE PLASTIC POUCHES IN NUTS MARKET, BY TYPE, 2018-2032 (USD THOUSAND)
TABLE 295 EUROPE NUTS MARKET, BY PACKAGING SIZE, 2018-2032 (USD THOUSAND)
TABLE 296 EUROPE NUTS MARKET, BY PRICE RANGE, 2018-2032 (USD THOUSAND)
TABLE 297 EUROPE NUTS MARKET, BY END-USE, 2018-2032 (USD THOUSAND)
TABLE 298 EUROPE FUNCTIONAL NUTRITION IN NUTS MARKET, BY TYPE, 2018-2032 (USD THOUSAND)
TABLE 299 EUROPE BEVERAGE INDUSTRY IN NUTS MARKET, BY TYPE, 2018-2032 (USD THOUSAND)
TABLE 300 EUROPE CULINARY IN NUTS MARKET, BY TYPE, 2018-2032 (USD THOUSAND)
TABLE 301 EUROPE PERSONAL CARE PRODUCTS IN NUTS MARKET, BY TYPE, 2018-2032 (USD THOUSAND)
TABLE 302 EUROPE BIO-BASED & AGRO-INDUSTRIAL USES IN NUTS MARKET, BY TYPE, 2018-2032 (USD THOUSAND)
TABLE 303 EUROPE ANIMAL FEED IN NUTS MARKET, BY TYPE, 2018-2032 (USD THOUSAND)
TABLE 304 EUROPE NUTS MARKET, BY DISTRIBUTION CHANNEL, 2018-2032 (USD THOUSAND)
TABLE 305 EUROPE B2C IN NUTS MARKET, BY TYPE, 2018-2032 (USD THOUSAND)
TABLE 306 EUROPE OFFLINE IN NUTS MARKET, BY TYPE, 2018-2032 (USD THOUSAND)
TABLE 307 EUROPE ONLINE IN NUTS MARKET, BY TYPE, 2018-2032 (USD THOUSAND)
TABLE 308 GERMANY NUTS MARKET, BY PRODUCT TYPE, 2018-2032 (USD THOUSAND)
TABLE 309 GERMANY NUTS MARKET, BY PRODUCT TYPE, 2018-2032 (THOUSAND TONS)
TABLE 310 GERMANY TREE NUTS IN NUTS MARKET, BY TYPE, 2018-2032 (USD THOUSAND)
TABLE 311 GERMANY GROUND NUTS IN NUTS MARKET, BY PEANUTS, 2018-2032 (USD THOUSAND)
TABLE 312 GERMANY HYBRID/OTHER NUTS IN NUTS MARKET, BY TYPE, 2018-2032 (USD THOUSAND)
TABLE 313 GERMANY NUTS MARKET, BY FORM, 2018-2032 (USD THOUSAND)
TABLE 314 GERMANY NUTS MARKET, BY NATURE, 2018-2032 (USD THOUSAND)
TABLE 315 GERMANY NUTS MARKET, BY PROCESSING METHOD, 2018-2032 (USD THOUSAND)
TABLE 316 GERMANY ROASTED IN NUTS MARKET, BY TYPE, 2018-2032 (USD THOUSAND)
TABLE 317 GERMANY FLAVORED IN NUTS MARKET, BY TYPE, 2018-2032 (USD THOUSAND)
TABLE 318 GERMANY NUTS MARKET, BY GRADE, 2018-2032 (USD THOUSAND)
TABLE 319 GERMANY NUTS MARKET, BY SHELF LIFE, 2018-2032 (USD THOUSAND)
TABLE 320 GERMANY NUTS MARKET, BY CERTIFICATION, 2018-2032 (USD THOUSAND)
TABLE 321 GERMANY NUTS MARKET, BY PACKAGING, 2018-2032 (USD THOUSAND)
TABLE 322 GERMANY PLASTIC POUCHES IN NUTS MARKET, BY TYPE, 2018-2032 (USD THOUSAND)
TABLE 323 GERMANY NUTS MARKET, BY PACKAGING SIZE, 2018-2032 (USD THOUSAND)
TABLE 324 GERMANY NUTS MARKET, BY PRICE RANGE, 2018-2032 (USD THOUSAND)
TABLE 325 GERMANY NUTS MARKET, BY END-USE, 2018-2032 (USD THOUSAND)
TABLE 326 GERMANY FUNCTIONAL NUTRITION IN NUTS MARKET, BY TYPE, 2018-2032 (USD THOUSAND)
TABLE 327 GERMANY BEVERAGE INDUSTRY IN NUTS MARKET, BY TYPE, 2018-2032 (USD THOUSAND)
TABLE 328 GERMANY CULINARY IN NUTS MARKET, BY TYPE, 2018-2032 (USD THOUSAND)
TABLE 329 GERMANY PERSONAL CARE PRODUCTS IN NUTS MARKET, BY TYPE, 2018-2032 (USD THOUSAND)
TABLE 330 GERMANY BIO-BASED & AGRO-INDUSTRIAL USES IN NUTS MARKET, BY TYPE, 2018-2032 (USD THOUSAND)
TABLE 331 GERMANY ANIMAL FEED IN NUTS MARKET, BY TYPE, 2018-2032 (USD THOUSAND)
TABLE 332 GERMANY NUTS MARKET, BY DISTRIBUTION CHANNEL, 2018-2032 (USD THOUSAND)
TABLE 333 GERMANY B2C IN NUTS MARKET, BY TYPE, 2018-2032 (USD THOUSAND)
TABLE 334 GERMANY OFFLINE IN NUTS MARKET, BY TYPE, 2018-2032 (USD THOUSAND)
TABLE 335 GERMANY ONLINE IN NUTS MARKET, BY TYPE, 2018-2032 (USD THOUSAND)
TABLE 336 FRANCE NUTS MARKET, BY PRODUCT TYPE, 2018-2032 (USD THOUSAND)
TABLE 337 FRANCE NUTS MARKET, BY PRODUCT TYPE, 2018-2032 (THOUSAND TONS)
TABLE 338 FRANCE TREE NUTS IN NUTS MARKET, BY TYPE, 2018-2032 (USD THOUSAND)
TABLE 339 FRANCE GROUND NUTS IN NUTS MARKET, BY PEANUTS, 2018-2032 (USD THOUSAND)
TABLE 340 FRANCE HYBRID/OTHER NUTS IN NUTS MARKET, BY TYPE, 2018-2032 (USD THOUSAND)
TABLE 341 FRANCE NUTS MARKET, BY FORM, 2018-2032 (USD THOUSAND)
TABLE 342 FRANCE NUTS MARKET, BY NATURE, 2018-2032 (USD THOUSAND)
TABLE 343 FRANCE NUTS MARKET, BY PROCESSING METHOD, 2018-2032 (USD THOUSAND)
TABLE 344 FRANCE ROASTED IN NUTS MARKET, BY TYPE, 2018-2032 (USD THOUSAND)
TABLE 345 FRANCE FLAVORED IN NUTS MARKET, BY TYPE, 2018-2032 (USD THOUSAND)
TABLE 346 FRANCE NUTS MARKET, BY GRADE, 2018-2032 (USD THOUSAND)
TABLE 347 FRANCE NUTS MARKET, BY SHELF LIFE, 2018-2032 (USD THOUSAND)
TABLE 348 FRANCE NUTS MARKET, BY CERTIFICATION, 2018-2032 (USD THOUSAND)
TABLE 349 FRANCE NUTS MARKET, BY PACKAGING, 2018-2032 (USD THOUSAND)
TABLE 350 FRANCE PLASTIC POUCHES IN NUTS MARKET, BY TYPE, 2018-2032 (USD THOUSAND)
TABLE 351 FRANCE NUTS MARKET, BY PACKAGING SIZE, 2018-2032 (USD THOUSAND)
TABLE 352 FRANCE NUTS MARKET, BY PRICE RANGE, 2018-2032 (USD THOUSAND)
TABLE 353 FRANCE NUTS MARKET, BY END-USE, 2018-2032 (USD THOUSAND)
TABLE 354 FRANCE FUNCTIONAL NUTRITION IN NUTS MARKET, BY TYPE, 2018-2032 (USD THOUSAND)
TABLE 355 FRANCE BEVERAGE INDUSTRY IN NUTS MARKET, BY TYPE, 2018-2032 (USD THOUSAND)
TABLE 356 FRANCE CULINARY IN NUTS MARKET, BY TYPE, 2018-2032 (USD THOUSAND)
TABLE 357 FRANCE PERSONAL CARE PRODUCTS IN NUTS MARKET, BY TYPE, 2018-2032 (USD THOUSAND)
TABLE 358 FRANCE BIO-BASED & AGRO-INDUSTRIAL USES IN NUTS MARKET, BY TYPE, 2018-2032 (USD THOUSAND)
TABLE 359 FRANCE ANIMAL FEED IN NUTS MARKET, BY TYPE, 2018-2032 (USD THOUSAND)
TABLE 360 FRANCE NUTS MARKET, BY DISTRIBUTION CHANNEL, 2018-2032 (USD THOUSAND)
TABLE 361 FRANCE B2C IN NUTS MARKET, BY TYPE, 2018-2032 (USD THOUSAND)
TABLE 362 FRANCE OFFLINE IN NUTS MARKET, BY TYPE, 2018-2032 (USD THOUSAND)
TABLE 363 FRANCE ONLINE IN NUTS MARKET, BY TYPE, 2018-2032 (USD THOUSAND)
TABLE 364 NETHERLANDS NUTS MARKET, BY PRODUCT TYPE, 2018-2032 (USD THOUSAND)
TABLE 365 NETHERLANDS NUTS MARKET, BY PRODUCT TYPE, 2018-2032 (THOUSAND TONS)
TABLE 366 NETHERLANDS TREE NUTS IN NUTS MARKET, BY TYPE, 2018-2032 (USD THOUSAND)
TABLE 367 NETHERLANDS GROUND NUTS IN NUTS MARKET, BY PEANUTS, 2018-2032 (USD THOUSAND)
TABLE 368 NETHERLANDS HYBRID/OTHER NUTS IN NUTS MARKET, BY TYPE, 2018-2032 (USD THOUSAND)
TABLE 369 NETHERLANDS NUTS MARKET, BY FORM, 2018-2032 (USD THOUSAND)
TABLE 370 NETHERLANDS NUTS MARKET, BY NATURE, 2018-2032 (USD THOUSAND)
TABLE 371 NETHERLANDS NUTS MARKET, BY PROCESSING METHOD, 2018-2032 (USD THOUSAND)
TABLE 372 NETHERLANDS ROASTED IN NUTS MARKET, BY TYPE, 2018-2032 (USD THOUSAND)
TABLE 373 NETHERLANDS FLAVORED IN NUTS MARKET, BY TYPE, 2018-2032 (USD THOUSAND)
TABLE 374 NETHERLANDS NUTS MARKET, BY GRADE, 2018-2032 (USD THOUSAND)
TABLE 375 NETHERLANDS NUTS MARKET, BY SHELF LIFE, 2018-2032 (USD THOUSAND)
TABLE 376 NETHERLANDS NUTS MARKET, BY CERTIFICATION, 2018-2032 (USD THOUSAND)
TABLE 377 NETHERLANDS NUTS MARKET, BY PACKAGING, 2018-2032 (USD THOUSAND)
TABLE 378 NETHERLANDS PLASTIC POUCHES IN NUTS MARKET, BY TYPE, 2018-2032 (USD THOUSAND)
TABLE 379 NETHERLANDS NUTS MARKET, BY PACKAGING SIZE, 2018-2032 (USD THOUSAND)
TABLE 380 NETHERLANDS NUTS MARKET, BY PRICE RANGE, 2018-2032 (USD THOUSAND)
TABLE 381 NETHERLANDS NUTS MARKET, BY END-USE, 2018-2032 (USD THOUSAND)
TABLE 382 NETHERLANDS FUNCTIONAL NUTRITION IN NUTS MARKET, BY TYPE, 2018-2032 (USD THOUSAND)
TABLE 383 NETHERLANDS BEVERAGE INDUSTRY IN NUTS MARKET, BY TYPE, 2018-2032 (USD THOUSAND)
TABLE 384 NETHERLANDS CULINARY IN NUTS MARKET, BY TYPE, 2018-2032 (USD THOUSAND)
TABLE 385 NETHERLANDS PERSONAL CARE PRODUCTS IN NUTS MARKET, BY TYPE, 2018-2032 (USD THOUSAND)
TABLE 386 NETHERLANDS BIO-BASED & AGRO-INDUSTRIAL USES IN NUTS MARKET, BY TYPE, 2018-2032 (USD THOUSAND)
TABLE 387 NETHERLANDS ANIMAL FEED IN NUTS MARKET, BY TYPE, 2018-2032 (USD THOUSAND)
TABLE 388 NETHERLANDS NUTS MARKET, BY DISTRIBUTION CHANNEL, 2018-2032 (USD THOUSAND)
TABLE 389 NETHERLANDS B2C IN NUTS MARKET, BY TYPE, 2018-2032 (USD THOUSAND)
TABLE 390 NETHERLANDS OFFLINE IN NUTS MARKET, BY TYPE, 2018-2032 (USD THOUSAND)
TABLE 391 NETHERLANDS ONLINE IN NUTS MARKET, BY TYPE, 2018-2032 (USD THOUSAND)
TABLE 392 SPAIN NUTS MARKET, BY PRODUCT TYPE, 2018-2032 (USD THOUSAND)
TABLE 393 SPAIN NUTS MARKET, BY PRODUCT TYPE, 2018-2032 (THOUSAND TONS)
TABLE 394 SPAIN TREE NUTS IN NUTS MARKET, BY TYPE, 2018-2032 (USD THOUSAND)
TABLE 395 SPAIN GROUND NUTS IN NUTS MARKET, BY PEANUTS, 2018-2032 (USD THOUSAND)
TABLE 396 SPAIN HYBRID/OTHER NUTS IN NUTS MARKET, BY TYPE, 2018-2032 (USD THOUSAND)
TABLE 397 SPAIN NUTS MARKET, BY FORM, 2018-2032 (USD THOUSAND)
TABLE 398 SPAIN NUTS MARKET, BY NATURE, 2018-2032 (USD THOUSAND)
TABLE 399 SPAIN NUTS MARKET, BY PROCESSING METHOD, 2018-2032 (USD THOUSAND)
TABLE 400 SPAIN ROASTED IN NUTS MARKET, BY TYPE, 2018-2032 (USD THOUSAND)
TABLE 401 SPAIN FLAVORED IN NUTS MARKET, BY TYPE, 2018-2032 (USD THOUSAND)
TABLE 402 SPAIN NUTS MARKET, BY GRADE, 2018-2032 (USD THOUSAND)
TABLE 403 SPAIN NUTS MARKET, BY SHELF LIFE, 2018-2032 (USD THOUSAND)
TABLE 404 SPAIN NUTS MARKET, BY CERTIFICATION, 2018-2032 (USD THOUSAND)
TABLE 405 SPAIN NUTS MARKET, BY PACKAGING, 2018-2032 (USD THOUSAND)
TABLE 406 SPAIN PLASTIC POUCHES IN NUTS MARKET, BY TYPE, 2018-2032 (USD THOUSAND)
TABLE 407 SPAIN NUTS MARKET, BY PACKAGING SIZE, 2018-2032 (USD THOUSAND)
TABLE 408 SPAIN NUTS MARKET, BY PRICE RANGE, 2018-2032 (USD THOUSAND)
TABLE 409 SPAIN NUTS MARKET, BY END-USE, 2018-2032 (USD THOUSAND)
TABLE 410 SPAIN FUNCTIONAL NUTRITION IN NUTS MARKET, BY TYPE, 2018-2032 (USD THOUSAND)
TABLE 411 SPAIN BEVERAGE INDUSTRY IN NUTS MARKET, BY TYPE, 2018-2032 (USD THOUSAND)
TABLE 412 SPAIN CULINARY IN NUTS MARKET, BY TYPE, 2018-2032 (USD THOUSAND)
TABLE 413 SPAIN PERSONAL CARE PRODUCTS IN NUTS MARKET, BY TYPE, 2018-2032 (USD THOUSAND)
TABLE 414 SPAIN BIO-BASED & AGRO-INDUSTRIAL USES IN NUTS MARKET, BY TYPE, 2018-2032 (USD THOUSAND)
TABLE 415 SPAIN ANIMAL FEED IN NUTS MARKET, BY TYPE, 2018-2032 (USD THOUSAND)
TABLE 416 SPAIN NUTS MARKET, BY DISTRIBUTION CHANNEL, 2018-2032 (USD THOUSAND)
TABLE 417 SPAIN B2C IN NUTS MARKET, BY TYPE, 2018-2032 (USD THOUSAND)
TABLE 418 SPAIN OFFLINE IN NUTS MARKET, BY TYPE, 2018-2032 (USD THOUSAND)
TABLE 419 SPAIN ONLINE IN NUTS MARKET, BY TYPE, 2018-2032 (USD THOUSAND)
TABLE 420 ITALY NUTS MARKET, BY PRODUCT TYPE, 2018-2032 (USD THOUSAND)
TABLE 421 ITALY NUTS MARKET, BY PRODUCT TYPE, 2018-2032 (THOUSAND TONS)
TABLE 422 ITALY TREE NUTS IN NUTS MARKET, BY TYPE, 2018-2032 (USD THOUSAND)
TABLE 423 ITALY GROUND NUTS IN NUTS MARKET, BY PEANUTS, 2018-2032 (USD THOUSAND)
TABLE 424 ITALY HYBRID/OTHER NUTS IN NUTS MARKET, BY TYPE, 2018-2032 (USD THOUSAND)
TABLE 425 ITALY NUTS MARKET, BY FORM, 2018-2032 (USD THOUSAND)
TABLE 426 ITALY NUTS MARKET, BY NATURE, 2018-2032 (USD THOUSAND)
TABLE 427 ITALY NUTS MARKET, BY PROCESSING METHOD, 2018-2032 (USD THOUSAND)
TABLE 428 ITALY ROASTED IN NUTS MARKET, BY TYPE, 2018-2032 (USD THOUSAND)
TABLE 429 ITALY FLAVORED IN NUTS MARKET, BY TYPE, 2018-2032 (USD THOUSAND)
TABLE 430 ITALY NUTS MARKET, BY GRADE, 2018-2032 (USD THOUSAND)
TABLE 431 ITALY NUTS MARKET, BY SHELF LIFE, 2018-2032 (USD THOUSAND)
TABLE 432 ITALY NUTS MARKET, BY CERTIFICATION, 2018-2032 (USD THOUSAND)
TABLE 433 ITALY NUTS MARKET, BY PACKAGING, 2018-2032 (USD THOUSAND)
TABLE 434 ITALY PLASTIC POUCHES IN NUTS MARKET, BY TYPE, 2018-2032 (USD THOUSAND)
TABLE 435 ITALY NUTS MARKET, BY PACKAGING SIZE, 2018-2032 (USD THOUSAND)
TABLE 436 ITALY NUTS MARKET, BY PRICE RANGE, 2018-2032 (USD THOUSAND)
TABLE 437 ITALY NUTS MARKET, BY END-USE, 2018-2032 (USD THOUSAND)
TABLE 438 ITALY FUNCTIONAL NUTRITION IN NUTS MARKET, BY TYPE, 2018-2032 (USD THOUSAND)
TABLE 439 ITALY BEVERAGE INDUSTRY IN NUTS MARKET, BY TYPE, 2018-2032 (USD THOUSAND)
TABLE 440 ITALY CULINARY IN NUTS MARKET, BY TYPE, 2018-2032 (USD THOUSAND)
TABLE 441 ITALY PERSONAL CARE PRODUCTS IN NUTS MARKET, BY TYPE, 2018-2032 (USD THOUSAND)
TABLE 442 ITALY BIO-BASED & AGRO-INDUSTRIAL USES IN NUTS MARKET, BY TYPE, 2018-2032 (USD THOUSAND)
TABLE 443 ITALY ANIMAL FEED IN NUTS MARKET, BY TYPE, 2018-2032 (USD THOUSAND)
TABLE 444 ITALY NUTS MARKET, BY DISTRIBUTION CHANNEL, 2018-2032 (USD THOUSAND)
TABLE 445 ITALY B2C IN NUTS MARKET, BY TYPE, 2018-2032 (USD THOUSAND)
TABLE 446 ITALY OFFLINE IN NUTS MARKET, BY TYPE, 2018-2032 (USD THOUSAND)
TABLE 447 ITALY ONLINE IN NUTS MARKET, BY TYPE, 2018-2032 (USD THOUSAND)
TABLE 448 U.K. NUTS MARKET, BY PRODUCT TYPE, 2018-2032 (USD THOUSAND)
TABLE 449 U.K. NUTS MARKET, BY PRODUCT TYPE, 2018-2032 (THOUSAND TONS)
TABLE 450 U.K. TREE NUTS IN NUTS MARKET, BY TYPE, 2018-2032 (USD THOUSAND)
TABLE 451 U.K. GROUND NUTS IN NUTS MARKET, BY PEANUTS, 2018-2032 (USD THOUSAND)
TABLE 452 U.K. HYBRID/OTHER NUTS IN NUTS MARKET, BY TYPE, 2018-2032 (USD THOUSAND)
TABLE 453 U.K. NUTS MARKET, BY FORM, 2018-2032 (USD THOUSAND)
TABLE 454 U.K. NUTS MARKET, BY NATURE, 2018-2032 (USD THOUSAND)
TABLE 455 U.K. NUTS MARKET, BY PROCESSING METHOD, 2018-2032 (USD THOUSAND)
TABLE 456 U.K. ROASTED IN NUTS MARKET, BY TYPE, 2018-2032 (USD THOUSAND)
TABLE 457 U.K. FLAVORED IN NUTS MARKET, BY TYPE, 2018-2032 (USD THOUSAND)
TABLE 458 U.K. NUTS MARKET, BY GRADE, 2018-2032 (USD THOUSAND)
TABLE 459 U.K. NUTS MARKET, BY SHELF LIFE, 2018-2032 (USD THOUSAND)
TABLE 460 U.K. NUTS MARKET, BY CERTIFICATION, 2018-2032 (USD THOUSAND)
TABLE 461 U.K. NUTS MARKET, BY PACKAGING, 2018-2032 (USD THOUSAND)
TABLE 462 U.K. PLASTIC POUCHES IN NUTS MARKET, BY TYPE, 2018-2032 (USD THOUSAND)
TABLE 463 U.K. NUTS MARKET, BY PACKAGING SIZE, 2018-2032 (USD THOUSAND)
TABLE 464 U.K. NUTS MARKET, BY PRICE RANGE, 2018-2032 (USD THOUSAND)
TABLE 465 U.K. NUTS MARKET, BY END-USE, 2018-2032 (USD THOUSAND)
TABLE 466 U.K. FUNCTIONAL NUTRITION IN NUTS MARKET, BY TYPE, 2018-2032 (USD THOUSAND)
TABLE 467 U.K. BEVERAGE INDUSTRY IN NUTS MARKET, BY TYPE, 2018-2032 (USD THOUSAND)
TABLE 468 U.K. CULINARY IN NUTS MARKET, BY TYPE, 2018-2032 (USD THOUSAND)
TABLE 469 U.K. PERSONAL CARE PRODUCTS IN NUTS MARKET, BY TYPE, 2018-2032 (USD THOUSAND)
TABLE 470 U.K. BIO-BASED & AGRO-INDUSTRIAL USES IN NUTS MARKET, BY TYPE, 2018-2032 (USD THOUSAND)
TABLE 471 U.K. ANIMAL FEED IN NUTS MARKET, BY TYPE, 2018-2032 (USD THOUSAND)
TABLE 472 U.K. NUTS MARKET, BY DISTRIBUTION CHANNEL, 2018-2032 (USD THOUSAND)
TABLE 473 U.K. B2C IN NUTS MARKET, BY TYPE, 2018-2032 (USD THOUSAND)
TABLE 474 U.K. OFFLINE IN NUTS MARKET, BY TYPE, 2018-2032 (USD THOUSAND)
TABLE 475 U.K. ONLINE IN NUTS MARKET, BY TYPE, 2018-2032 (USD THOUSAND)
TABLE 476 POLAND NUTS MARKET, BY PRODUCT TYPE, 2018-2032 (USD THOUSAND)
TABLE 477 POLAND NUTS MARKET, BY PRODUCT TYPE, 2018-2032 (THOUSAND TONS)
TABLE 478 POLAND TREE NUTS IN NUTS MARKET, BY TYPE, 2018-2032 (USD THOUSAND)
TABLE 479 POLAND GROUND NUTS IN NUTS MARKET, BY PEANUTS, 2018-2032 (USD THOUSAND)
TABLE 480 POLAND HYBRID/OTHER NUTS IN NUTS MARKET, BY TYPE, 2018-2032 (USD THOUSAND)
TABLE 481 POLAND NUTS MARKET, BY FORM, 2018-2032 (USD THOUSAND)
TABLE 482 POLAND NUTS MARKET, BY NATURE, 2018-2032 (USD THOUSAND)
TABLE 483 POLAND NUTS MARKET, BY PROCESSING METHOD, 2018-2032 (USD THOUSAND)
TABLE 484 POLAND ROASTED IN NUTS MARKET, BY TYPE, 2018-2032 (USD THOUSAND)
TABLE 485 POLAND FLAVORED IN NUTS MARKET, BY TYPE, 2018-2032 (USD THOUSAND)
TABLE 486 POLAND NUTS MARKET, BY GRADE, 2018-2032 (USD THOUSAND)
TABLE 487 POLAND NUTS MARKET, BY SHELF LIFE, 2018-2032 (USD THOUSAND)
TABLE 488 POLAND NUTS MARKET, BY CERTIFICATION, 2018-2032 (USD THOUSAND)
TABLE 489 POLAND NUTS MARKET, BY PACKAGING, 2018-2032 (USD THOUSAND)
TABLE 490 POLAND PLASTIC POUCHES IN NUTS MARKET, BY TYPE, 2018-2032 (USD THOUSAND)
TABLE 491 POLAND NUTS MARKET, BY PACKAGING SIZE, 2018-2032 (USD THOUSAND)
TABLE 492 POLAND NUTS MARKET, BY PRICE RANGE, 2018-2032 (USD THOUSAND)
TABLE 493 POLAND NUTS MARKET, BY END-USE, 2018-2032 (USD THOUSAND)
TABLE 494 POLAND FUNCTIONAL NUTRITION IN NUTS MARKET, BY TYPE, 2018-2032 (USD THOUSAND)
TABLE 495 POLAND BEVERAGE INDUSTRY IN NUTS MARKET, BY TYPE, 2018-2032 (USD THOUSAND)
TABLE 496 POLAND CULINARY IN NUTS MARKET, BY TYPE, 2018-2032 (USD THOUSAND)
TABLE 497 POLAND PERSONAL CARE PRODUCTS IN NUTS MARKET, BY TYPE, 2018-2032 (USD THOUSAND)
TABLE 498 POLAND BIO-BASED & AGRO-INDUSTRIAL USES IN NUTS MARKET, BY TYPE, 2018-2032 (USD THOUSAND)
TABLE 499 POLAND ANIMAL FEED IN NUTS MARKET, BY TYPE, 2018-2032 (USD THOUSAND)
TABLE 500 POLAND NUTS MARKET, BY DISTRIBUTION CHANNEL, 2018-2032 (USD THOUSAND)
TABLE 501 POLAND B2C IN NUTS MARKET, BY TYPE, 2018-2032 (USD THOUSAND)
TABLE 502 POLAND OFFLINE IN NUTS MARKET, BY TYPE, 2018-2032 (USD THOUSAND)
TABLE 503 POLAND ONLINE IN NUTS MARKET, BY TYPE, 2018-2032 (USD THOUSAND)
TABLE 504 RUSSIA NUTS MARKET, BY PRODUCT TYPE, 2018-2032 (USD THOUSAND)
TABLE 505 RUSSIA NUTS MARKET, BY PRODUCT TYPE, 2018-2032 (THOUSAND TONS)
TABLE 506 RUSSIA TREE NUTS IN NUTS MARKET, BY TYPE, 2018-2032 (USD THOUSAND)
TABLE 507 RUSSIA GROUND NUTS IN NUTS MARKET, BY PEANUTS, 2018-2032 (USD THOUSAND)
TABLE 508 RUSSIA HYBRID/OTHER NUTS IN NUTS MARKET, BY TYPE, 2018-2032 (USD THOUSAND)
TABLE 509 RUSSIA NUTS MARKET, BY FORM, 2018-2032 (USD THOUSAND)
TABLE 510 RUSSIA NUTS MARKET, BY NATURE, 2018-2032 (USD THOUSAND)
TABLE 511 RUSSIA NUTS MARKET, BY PROCESSING METHOD, 2018-2032 (USD THOUSAND)
TABLE 512 RUSSIA ROASTED IN NUTS MARKET, BY TYPE, 2018-2032 (USD THOUSAND)
TABLE 513 RUSSIA FLAVORED IN NUTS MARKET, BY TYPE, 2018-2032 (USD THOUSAND)
TABLE 514 RUSSIA NUTS MARKET, BY GRADE, 2018-2032 (USD THOUSAND)
TABLE 515 RUSSIA NUTS MARKET, BY SHELF LIFE, 2018-2032 (USD THOUSAND)
TABLE 516 RUSSIA NUTS MARKET, BY CERTIFICATION, 2018-2032 (USD THOUSAND)
TABLE 517 RUSSIA NUTS MARKET, BY PACKAGING, 2018-2032 (USD THOUSAND)
TABLE 518 RUSSIA PLASTIC POUCHES IN NUTS MARKET, BY TYPE, 2018-2032 (USD THOUSAND)
TABLE 519 RUSSIA NUTS MARKET, BY PACKAGING SIZE, 2018-2032 (USD THOUSAND)
TABLE 520 RUSSIA NUTS MARKET, BY PRICE RANGE, 2018-2032 (USD THOUSAND)
TABLE 521 RUSSIA NUTS MARKET, BY END-USE, 2018-2032 (USD THOUSAND)
TABLE 522 RUSSIA FUNCTIONAL NUTRITION IN NUTS MARKET, BY TYPE, 2018-2032 (USD THOUSAND)
TABLE 523 RUSSIA BEVERAGE INDUSTRY IN NUTS MARKET, BY TYPE, 2018-2032 (USD THOUSAND)
TABLE 524 RUSSIA CULINARY IN NUTS MARKET, BY TYPE, 2018-2032 (USD THOUSAND)
TABLE 525 RUSSIA PERSONAL CARE PRODUCTS IN NUTS MARKET, BY TYPE, 2018-2032 (USD THOUSAND)
TABLE 526 RUSSIA BIO-BASED & AGRO-INDUSTRIAL USES IN NUTS MARKET, BY TYPE, 2018-2032 (USD THOUSAND)
TABLE 527 RUSSIA ANIMAL FEED IN NUTS MARKET, BY TYPE, 2018-2032 (USD THOUSAND)
TABLE 528 RUSSIA NUTS MARKET, BY DISTRIBUTION CHANNEL, 2018-2032 (USD THOUSAND)
TABLE 529 RUSSIA B2C IN NUTS MARKET, BY TYPE, 2018-2032 (USD THOUSAND)
TABLE 530 RUSSIA OFFLINE IN NUTS MARKET, BY TYPE, 2018-2032 (USD THOUSAND)
TABLE 531 RUSSIA ONLINE IN NUTS MARKET, BY TYPE, 2018-2032 (USD THOUSAND)
TABLE 532 BELGIUM NUTS MARKET, BY PRODUCT TYPE, 2018-2032 (USD THOUSAND)
TABLE 533 BELGIUM NUTS MARKET, BY PRODUCT TYPE, 2018-2032 (THOUSAND TONS)
TABLE 534 BELGIUM TREE NUTS IN NUTS MARKET, BY TYPE, 2018-2032 (USD THOUSAND)
TABLE 535 BELGIUM GROUND NUTS IN NUTS MARKET, BY PEANUTS, 2018-2032 (USD THOUSAND)
TABLE 536 BELGIUM HYBRID/OTHER NUTS IN NUTS MARKET, BY TYPE, 2018-2032 (USD THOUSAND)
TABLE 537 BELGIUM NUTS MARKET, BY FORM, 2018-2032 (USD THOUSAND)
TABLE 538 BELGIUM NUTS MARKET, BY NATURE, 2018-2032 (USD THOUSAND)
TABLE 539 BELGIUM NUTS MARKET, BY PROCESSING METHOD, 2018-2032 (USD THOUSAND)
TABLE 540 BELGIUM ROASTED IN NUTS MARKET, BY TYPE, 2018-2032 (USD THOUSAND)
TABLE 541 BELGIUM FLAVORED IN NUTS MARKET, BY TYPE, 2018-2032 (USD THOUSAND)
TABLE 542 BELGIUM NUTS MARKET, BY GRADE, 2018-2032 (USD THOUSAND)
TABLE 543 BELGIUM NUTS MARKET, BY SHELF LIFE, 2018-2032 (USD THOUSAND)
TABLE 544 BELGIUM NUTS MARKET, BY CERTIFICATION, 2018-2032 (USD THOUSAND)
TABLE 545 BELGIUM NUTS MARKET, BY PACKAGING, 2018-2032 (USD THOUSAND)
TABLE 546 BELGIUM PLASTIC POUCHES IN NUTS MARKET, BY TYPE, 2018-2032 (USD THOUSAND)
TABLE 547 BELGIUM NUTS MARKET, BY PACKAGING SIZE, 2018-2032 (USD THOUSAND)
TABLE 548 BELGIUM NUTS MARKET, BY PRICE RANGE, 2018-2032 (USD THOUSAND)
TABLE 549 BELGIUM NUTS MARKET, BY END-USE, 2018-2032 (USD THOUSAND)
TABLE 550 BELGIUM FUNCTIONAL NUTRITION IN NUTS MARKET, BY TYPE, 2018-2032 (USD THOUSAND)
TABLE 551 BELGIUM BEVERAGE INDUSTRY IN NUTS MARKET, BY TYPE, 2018-2032 (USD THOUSAND)
TABLE 552 BELGIUM CULINARY IN NUTS MARKET, BY TYPE, 2018-2032 (USD THOUSAND)
TABLE 553 BELGIUM PERSONAL CARE PRODUCTS IN NUTS MARKET, BY TYPE, 2018-2032 (USD THOUSAND)
TABLE 554 BELGIUM BIO-BASED & AGRO-INDUSTRIAL USES IN NUTS MARKET, BY TYPE, 2018-2032 (USD THOUSAND)
TABLE 555 BELGIUM ANIMAL FEED IN NUTS MARKET, BY TYPE, 2018-2032 (USD THOUSAND)
TABLE 556 BELGIUM NUTS MARKET, BY DISTRIBUTION CHANNEL, 2018-2032 (USD THOUSAND)
TABLE 557 BELGIUM B2C IN NUTS MARKET, BY TYPE, 2018-2032 (USD THOUSAND)
TABLE 558 BELGIUM OFFLINE IN NUTS MARKET, BY TYPE, 2018-2032 (USD THOUSAND)
TABLE 559 BELGIUM ONLINE IN NUTS MARKET, BY TYPE, 2018-2032 (USD THOUSAND)
TABLE 560 SWITZERLAND NUTS MARKET, BY PRODUCT TYPE, 2018-2032 (USD THOUSAND)
TABLE 561 SWITZERLAND NUTS MARKET, BY PRODUCT TYPE, 2018-2032 (THOUSAND TONS)
TABLE 562 SWITZERLAND TREE NUTS IN NUTS MARKET, BY TYPE, 2018-2032 (USD THOUSAND)
TABLE 563 SWITZERLAND GROUND NUTS IN NUTS MARKET, BY PEANUTS, 2018-2032 (USD THOUSAND)
TABLE 564 SWITZERLAND HYBRID/OTHER NUTS IN NUTS MARKET, BY TYPE, 2018-2032 (USD THOUSAND)
TABLE 565 SWITZERLAND NUTS MARKET, BY FORM, 2018-2032 (USD THOUSAND)
TABLE 566 SWITZERLAND NUTS MARKET, BY NATURE, 2018-2032 (USD THOUSAND)
TABLE 567 SWITZERLAND NUTS MARKET, BY PROCESSING METHOD, 2018-2032 (USD THOUSAND)
TABLE 568 SWITZERLAND ROASTED IN NUTS MARKET, BY TYPE, 2018-2032 (USD THOUSAND)
TABLE 569 SWITZERLAND FLAVORED IN NUTS MARKET, BY TYPE, 2018-2032 (USD THOUSAND)
TABLE 570 SWITZERLAND NUTS MARKET, BY GRADE, 2018-2032 (USD THOUSAND)
TABLE 571 SWITZERLAND NUTS MARKET, BY SHELF LIFE, 2018-2032 (USD THOUSAND)
TABLE 572 SWITZERLAND NUTS MARKET, BY CERTIFICATION, 2018-2032 (USD THOUSAND)
TABLE 573 SWITZERLAND NUTS MARKET, BY PACKAGING, 2018-2032 (USD THOUSAND)
TABLE 574 SWITZERLAND PLASTIC POUCHES IN NUTS MARKET, BY TYPE, 2018-2032 (USD THOUSAND)
TABLE 575 SWITZERLAND NUTS MARKET, BY PACKAGING SIZE, 2018-2032 (USD THOUSAND)
TABLE 576 SWITZERLAND NUTS MARKET, BY PRICE RANGE, 2018-2032 (USD THOUSAND)
TABLE 577 SWITZERLAND NUTS MARKET, BY END-USE, 2018-2032 (USD THOUSAND)
TABLE 578 SWITZERLAND FUNCTIONAL NUTRITION IN NUTS MARKET, BY TYPE, 2018-2032 (USD THOUSAND)
TABLE 579 SWITZERLAND BEVERAGE INDUSTRY IN NUTS MARKET, BY TYPE, 2018-2032 (USD THOUSAND)
TABLE 580 SWITZERLAND CULINARY IN NUTS MARKET, BY TYPE, 2018-2032 (USD THOUSAND)
TABLE 581 SWITZERLAND PERSONAL CARE PRODUCTS IN NUTS MARKET, BY TYPE, 2018-2032 (USD THOUSAND)
TABLE 582 SWITZERLAND BIO-BASED & AGRO-INDUSTRIAL USES IN NUTS MARKET, BY TYPE, 2018-2032 (USD THOUSAND)
TABLE 583 SWITZERLAND ANIMAL FEED IN NUTS MARKET, BY TYPE, 2018-2032 (USD THOUSAND)
TABLE 584 SWITZERLAND NUTS MARKET, BY DISTRIBUTION CHANNEL, 2018-2032 (USD THOUSAND)
TABLE 585 SWITZERLAND B2C IN NUTS MARKET, BY TYPE, 2018-2032 (USD THOUSAND)
TABLE 586 SWITZERLAND OFFLINE IN NUTS MARKET, BY TYPE, 2018-2032 (USD THOUSAND)
TABLE 587 SWITZERLAND ONLINE IN NUTS MARKET, BY TYPE, 2018-2032 (USD THOUSAND)
TABLE 588 TURKEY NUTS MARKET, BY PRODUCT TYPE, 2018-2032 (USD THOUSAND)
TABLE 589 TURKEY NUTS MARKET, BY PRODUCT TYPE, 2018-2032 (THOUSAND TONS)
TABLE 590 TURKEY TREE NUTS IN NUTS MARKET, BY TYPE, 2018-2032 (USD THOUSAND)
TABLE 591 TURKEY GROUND NUTS IN NUTS MARKET, BY PEANUTS, 2018-2032 (USD THOUSAND)
TABLE 592 TURKEY HYBRID/OTHER NUTS IN NUTS MARKET, BY TYPE, 2018-2032 (USD THOUSAND)
TABLE 593 TURKEY NUTS MARKET, BY FORM, 2018-2032 (USD THOUSAND)
TABLE 594 TURKEY NUTS MARKET, BY NATURE, 2018-2032 (USD THOUSAND)
TABLE 595 TURKEY NUTS MARKET, BY PROCESSING METHOD, 2018-2032 (USD THOUSAND)
TABLE 596 TURKEY ROASTED IN NUTS MARKET, BY TYPE, 2018-2032 (USD THOUSAND)
TABLE 597 TURKEY FLAVORED IN NUTS MARKET, BY TYPE, 2018-2032 (USD THOUSAND)
TABLE 598 TURKEY NUTS MARKET, BY GRADE, 2018-2032 (USD THOUSAND)
TABLE 599 TURKEY NUTS MARKET, BY SHELF LIFE, 2018-2032 (USD THOUSAND)
TABLE 600 TURKEY NUTS MARKET, BY CERTIFICATION, 2018-2032 (USD THOUSAND)
TABLE 601 TURKEY NUTS MARKET, BY PACKAGING, 2018-2032 (USD THOUSAND)
TABLE 602 TURKEY PLASTIC POUCHES IN NUTS MARKET, BY TYPE, 2018-2032 (USD THOUSAND)
TABLE 603 TURKEY NUTS MARKET, BY PACKAGING SIZE, 2018-2032 (USD THOUSAND)
TABLE 604 TURKEY NUTS MARKET, BY PRICE RANGE, 2018-2032 (USD THOUSAND)
TABLE 605 TURKEY NUTS MARKET, BY END-USE, 2018-2032 (USD THOUSAND)
TABLE 606 TURKEY FUNCTIONAL NUTRITION IN NUTS MARKET, BY TYPE, 2018-2032 (USD THOUSAND)
TABLE 607 TURKEY BEVERAGE INDUSTRY IN NUTS MARKET, BY TYPE, 2018-2032 (USD THOUSAND)
TABLE 608 TURKEY CULINARY IN NUTS MARKET, BY TYPE, 2018-2032 (USD THOUSAND)
TABLE 609 TURKEY PERSONAL CARE PRODUCTS IN NUTS MARKET, BY TYPE, 2018-2032 (USD THOUSAND)
TABLE 610 TURKEY BIO-BASED & AGRO-INDUSTRIAL USES IN NUTS MARKET, BY TYPE, 2018-2032 (USD THOUSAND)
TABLE 611 TURKEY ANIMAL FEED IN NUTS MARKET, BY TYPE, 2018-2032 (USD THOUSAND)
TABLE 612 TURKEY NUTS MARKET, BY DISTRIBUTION CHANNEL, 2018-2032 (USD THOUSAND)
TABLE 613 TURKEY B2C IN NUTS MARKET, BY TYPE, 2018-2032 (USD THOUSAND)
TABLE 614 TURKEY OFFLINE IN NUTS MARKET, BY TYPE, 2018-2032 (USD THOUSAND)
TABLE 615 TURKEY ONLINE IN NUTS MARKET, BY TYPE, 2018-2032 (USD THOUSAND)
TABLE 616 SWEDEN NUTS MARKET, BY PRODUCT TYPE, 2018-2032 (USD THOUSAND)
TABLE 617 SWEDEN NUTS MARKET, BY PRODUCT TYPE, 2018-2032 (THOUSAND TONS)
TABLE 618 SWEDEN TREE NUTS IN NUTS MARKET, BY TYPE, 2018-2032 (USD THOUSAND)
TABLE 619 SWEDEN GROUND NUTS IN NUTS MARKET, BY PEANUTS, 2018-2032 (USD THOUSAND)
TABLE 620 SWEDEN HYBRID/OTHER NUTS IN NUTS MARKET, BY TYPE, 2018-2032 (USD THOUSAND)
TABLE 621 SWEDEN NUTS MARKET, BY FORM, 2018-2032 (USD THOUSAND)
TABLE 622 SWEDEN NUTS MARKET, BY NATURE, 2018-2032 (USD THOUSAND)
TABLE 623 SWEDEN NUTS MARKET, BY PROCESSING METHOD, 2018-2032 (USD THOUSAND)
TABLE 624 SWEDEN ROASTED IN NUTS MARKET, BY TYPE, 2018-2032 (USD THOUSAND)
TABLE 625 SWEDEN FLAVORED IN NUTS MARKET, BY TYPE, 2018-2032 (USD THOUSAND)
TABLE 626 SWEDEN NUTS MARKET, BY GRADE, 2018-2032 (USD THOUSAND)
TABLE 627 SWEDEN NUTS MARKET, BY SHELF LIFE, 2018-2032 (USD THOUSAND)
TABLE 628 SWEDEN NUTS MARKET, BY CERTIFICATION, 2018-2032 (USD THOUSAND)
TABLE 629 SWEDEN NUTS MARKET, BY PACKAGING, 2018-2032 (USD THOUSAND)
TABLE 630 SWEDEN PLASTIC POUCHES IN NUTS MARKET, BY TYPE, 2018-2032 (USD THOUSAND)
TABLE 631 SWEDEN NUTS MARKET, BY PACKAGING SIZE, 2018-2032 (USD THOUSAND)
TABLE 632 SWEDEN NUTS MARKET, BY PRICE RANGE, 2018-2032 (USD THOUSAND)
TABLE 633 SWEDEN NUTS MARKET, BY END-USE, 2018-2032 (USD THOUSAND)
TABLE 634 SWEDEN FUNCTIONAL NUTRITION IN NUTS MARKET, BY TYPE, 2018-2032 (USD THOUSAND)
TABLE 635 SWEDEN BEVERAGE INDUSTRY IN NUTS MARKET, BY TYPE, 2018-2032 (USD THOUSAND)
TABLE 636 SWEDEN CULINARY IN NUTS MARKET, BY TYPE, 2018-2032 (USD THOUSAND)
TABLE 637 SWEDEN PERSONAL CARE PRODUCTS IN NUTS MARKET, BY TYPE, 2018-2032 (USD THOUSAND)
TABLE 638 SWEDEN BIO-BASED & AGRO-INDUSTRIAL USES IN NUTS MARKET, BY TYPE, 2018-2032 (USD THOUSAND)
TABLE 639 SWEDEN ANIMAL FEED IN NUTS MARKET, BY TYPE, 2018-2032 (USD THOUSAND)
TABLE 640 SWEDEN NUTS MARKET, BY DISTRIBUTION CHANNEL, 2018-2032 (USD THOUSAND)
TABLE 641 SWEDEN B2C IN NUTS MARKET, BY TYPE, 2018-2032 (USD THOUSAND)
TABLE 642 SWEDEN OFFLINE IN NUTS MARKET, BY TYPE, 2018-2032 (USD THOUSAND)
TABLE 643 SWEDEN ONLINE IN NUTS MARKET, BY TYPE, 2018-2032 (USD THOUSAND)
TABLE 644 NORWAY NUTS MARKET, BY PRODUCT TYPE, 2018-2032 (USD THOUSAND)
TABLE 645 NORWAY NUTS MARKET, BY PRODUCT TYPE, 2018-2032 (THOUSAND TONS)
TABLE 646 NORWAY TREE NUTS IN NUTS MARKET, BY TYPE, 2018-2032 (USD THOUSAND)
TABLE 647 NORWAY GROUND NUTS IN NUTS MARKET, BY PEANUTS, 2018-2032 (USD THOUSAND)
TABLE 648 NORWAY HYBRID/OTHER NUTS IN NUTS MARKET, BY TYPE, 2018-2032 (USD THOUSAND)
TABLE 649 NORWAY NUTS MARKET, BY FORM, 2018-2032 (USD THOUSAND)
TABLE 650 NORWAY NUTS MARKET, BY NATURE, 2018-2032 (USD THOUSAND)
TABLE 651 NORWAY NUTS MARKET, BY PROCESSING METHOD, 2018-2032 (USD THOUSAND)
TABLE 652 NORWAY ROASTED IN NUTS MARKET, BY TYPE, 2018-2032 (USD THOUSAND)
TABLE 653 NORWAY FLAVORED IN NUTS MARKET, BY TYPE, 2018-2032 (USD THOUSAND)
TABLE 654 NORWAY NUTS MARKET, BY GRADE, 2018-2032 (USD THOUSAND)
TABLE 655 NORWAY NUTS MARKET, BY SHELF LIFE, 2018-2032 (USD THOUSAND)
TABLE 656 NORWAY NUTS MARKET, BY CERTIFICATION, 2018-2032 (USD THOUSAND)
TABLE 657 NORWAY NUTS MARKET, BY PACKAGING, 2018-2032 (USD THOUSAND)
TABLE 658 NORWAY PLASTIC POUCHES IN NUTS MARKET, BY TYPE, 2018-2032 (USD THOUSAND)
TABLE 659 NORWAY NUTS MARKET, BY PACKAGING SIZE, 2018-2032 (USD THOUSAND)
TABLE 660 NORWAY NUTS MARKET, BY PRICE RANGE, 2018-2032 (USD THOUSAND)
TABLE 661 NORWAY NUTS MARKET, BY END-USE, 2018-2032 (USD THOUSAND)
TABLE 662 NORWAY FUNCTIONAL NUTRITION IN NUTS MARKET, BY TYPE, 2018-2032 (USD THOUSAND)
TABLE 663 NORWAY BEVERAGE INDUSTRY IN NUTS MARKET, BY TYPE, 2018-2032 (USD THOUSAND)
TABLE 664 NORWAY CULINARY IN NUTS MARKET, BY TYPE, 2018-2032 (USD THOUSAND)
TABLE 665 NORWAY PERSONAL CARE PRODUCTS IN NUTS MARKET, BY TYPE, 2018-2032 (USD THOUSAND)
TABLE 666 NORWAY BIO-BASED & AGRO-INDUSTRIAL USES IN NUTS MARKET, BY TYPE, 2018-2032 (USD THOUSAND)
TABLE 667 NORWAY ANIMAL FEED IN NUTS MARKET, BY TYPE, 2018-2032 (USD THOUSAND)
TABLE 668 NORWAY NUTS MARKET, BY DISTRIBUTION CHANNEL, 2018-2032 (USD THOUSAND)
TABLE 669 NORWAY B2C IN NUTS MARKET, BY TYPE, 2018-2032 (USD THOUSAND)
TABLE 670 NORWAY OFFLINE IN NUTS MARKET, BY TYPE, 2018-2032 (USD THOUSAND)
TABLE 671 NORWAY ONLINE IN NUTS MARKET, BY TYPE, 2018-2032 (USD THOUSAND)
TABLE 672 DENMARK NUTS MARKET, BY PRODUCT TYPE, 2018-2032 (USD THOUSAND)
TABLE 673 DENMARK NUTS MARKET, BY PRODUCT TYPE, 2018-2032 (THOUSAND TONS)
TABLE 674 DENMARK TREE NUTS IN NUTS MARKET, BY TYPE, 2018-2032 (USD THOUSAND)
TABLE 675 DENMARK GROUND NUTS IN NUTS MARKET, BY PEANUTS, 2018-2032 (USD THOUSAND)
TABLE 676 DENMARK HYBRID/OTHER NUTS IN NUTS MARKET, BY TYPE, 2018-2032 (USD THOUSAND)
TABLE 677 DENMARK NUTS MARKET, BY FORM, 2018-2032 (USD THOUSAND)
TABLE 678 DENMARK NUTS MARKET, BY NATURE, 2018-2032 (USD THOUSAND)
TABLE 679 DENMARK NUTS MARKET, BY PROCESSING METHOD, 2018-2032 (USD THOUSAND)
TABLE 680 DENMARK ROASTED IN NUTS MARKET, BY TYPE, 2018-2032 (USD THOUSAND)
TABLE 681 DENMARK FLAVORED IN NUTS MARKET, BY TYPE, 2018-2032 (USD THOUSAND)
TABLE 682 DENMARK NUTS MARKET, BY GRADE, 2018-2032 (USD THOUSAND)
TABLE 683 DENMARK NUTS MARKET, BY SHELF LIFE, 2018-2032 (USD THOUSAND)
TABLE 684 DENMARK NUTS MARKET, BY CERTIFICATION, 2018-2032 (USD THOUSAND)
TABLE 685 DENMARK NUTS MARKET, BY PACKAGING, 2018-2032 (USD THOUSAND)
TABLE 686 DENMARK PLASTIC POUCHES IN NUTS MARKET, BY TYPE, 2018-2032 (USD THOUSAND)
TABLE 687 DENMARK NUTS MARKET, BY PACKAGING SIZE, 2018-2032 (USD THOUSAND)
TABLE 688 DENMARK NUTS MARKET, BY PRICE RANGE, 2018-2032 (USD THOUSAND)
TABLE 689 DENMARK NUTS MARKET, BY END-USE, 2018-2032 (USD THOUSAND)
TABLE 690 DENMARK FUNCTIONAL NUTRITION IN NUTS MARKET, BY TYPE, 2018-2032 (USD THOUSAND)
TABLE 691 DENMARK BEVERAGE INDUSTRY IN NUTS MARKET, BY TYPE, 2018-2032 (USD THOUSAND)
TABLE 692 DENMARK CULINARY IN NUTS MARKET, BY TYPE, 2018-2032 (USD THOUSAND)
TABLE 693 DENMARK PERSONAL CARE PRODUCTS IN NUTS MARKET, BY TYPE, 2018-2032 (USD THOUSAND)
TABLE 694 DENMARK BIO-BASED & AGRO-INDUSTRIAL USES IN NUTS MARKET, BY TYPE, 2018-2032 (USD THOUSAND)
TABLE 695 DENMARK ANIMAL FEED IN NUTS MARKET, BY TYPE, 2018-2032 (USD THOUSAND)
TABLE 696 DENMARK NUTS MARKET, BY DISTRIBUTION CHANNEL, 2018-2032 (USD THOUSAND)
TABLE 697 DENMARK B2C IN NUTS MARKET, BY TYPE, 2018-2032 (USD THOUSAND)
TABLE 698 DENMARK OFFLINE IN NUTS MARKET, BY TYPE, 2018-2032 (USD THOUSAND)
TABLE 699 DENMARK ONLINE IN NUTS MARKET, BY TYPE, 2018-2032 (USD THOUSAND)
TABLE 700 FINLAND NUTS MARKET, BY PRODUCT TYPE, 2018-2032 (USD THOUSAND)
TABLE 701 FINLAND NUTS MARKET, BY PRODUCT TYPE, 2018-2032 (THOUSAND TONS)
TABLE 702 FINLAND TREE NUTS IN NUTS MARKET, BY TYPE, 2018-2032 (USD THOUSAND)
TABLE 703 FINLAND GROUND NUTS IN NUTS MARKET, BY PEANUTS, 2018-2032 (USD THOUSAND)
TABLE 704 FINLAND HYBRID/OTHER NUTS IN NUTS MARKET, BY TYPE, 2018-2032 (USD THOUSAND)
TABLE 705 FINLAND NUTS MARKET, BY FORM, 2018-2032 (USD THOUSAND)
TABLE 706 FINLAND NUTS MARKET, BY NATURE, 2018-2032 (USD THOUSAND)
TABLE 707 FINLAND NUTS MARKET, BY PROCESSING METHOD, 2018-2032 (USD THOUSAND)
TABLE 708 FINLAND ROASTED IN NUTS MARKET, BY TYPE, 2018-2032 (USD THOUSAND)
TABLE 709 FINLAND FLAVORED IN NUTS MARKET, BY TYPE, 2018-2032 (USD THOUSAND)
TABLE 710 FINLAND NUTS MARKET, BY GRADE, 2018-2032 (USD THOUSAND)
TABLE 711 FINLAND NUTS MARKET, BY SHELF LIFE, 2018-2032 (USD THOUSAND)
TABLE 712 FINLAND NUTS MARKET, BY CERTIFICATION, 2018-2032 (USD THOUSAND)
TABLE 713 FINLAND NUTS MARKET, BY PACKAGING, 2018-2032 (USD THOUSAND)
TABLE 714 FINLAND PLASTIC POUCHES IN NUTS MARKET, BY TYPE, 2018-2032 (USD THOUSAND)
TABLE 715 FINLAND NUTS MARKET, BY PACKAGING SIZE, 2018-2032 (USD THOUSAND)
TABLE 716 FINLAND NUTS MARKET, BY PRICE RANGE, 2018-2032 (USD THOUSAND)
TABLE 717 FINLAND NUTS MARKET, BY END-USE, 2018-2032 (USD THOUSAND)
TABLE 718 FINLAND FUNCTIONAL NUTRITION IN NUTS MARKET, BY TYPE, 2018-2032 (USD THOUSAND)
TABLE 719 FINLAND BEVERAGE INDUSTRY IN NUTS MARKET, BY TYPE, 2018-2032 (USD THOUSAND)
TABLE 720 FINLAND CULINARY IN NUTS MARKET, BY TYPE, 2018-2032 (USD THOUSAND)
TABLE 721 FINLAND PERSONAL CARE PRODUCTS IN NUTS MARKET, BY TYPE, 2018-2032 (USD THOUSAND)
TABLE 722 FINLAND BIO-BASED & AGRO-INDUSTRIAL USES IN NUTS MARKET, BY TYPE, 2018-2032 (USD THOUSAND)
TABLE 723 FINLAND ANIMAL FEED IN NUTS MARKET, BY TYPE, 2018-2032 (USD THOUSAND)
TABLE 724 FINLAND NUTS MARKET, BY DISTRIBUTION CHANNEL, 2018-2032 (USD THOUSAND)
TABLE 725 FINLAND B2C IN NUTS MARKET, BY TYPE, 2018-2032 (USD THOUSAND)
TABLE 726 FINLAND OFFLINE IN NUTS MARKET, BY TYPE, 2018-2032 (USD THOUSAND)
TABLE 727 FINLAND ONLINE IN NUTS MARKET, BY TYPE, 2018-2032 (USD THOUSAND)
TABLE 728 REST OF EUROPE NUTS MARKET, BY PRODUCT TYPE, 2018-2032 (USD THOUSAND)
TABLE 729 REST OF EUROPE NUTS MARKET, BY PRODUCT TYPE, 2018-2032 (THOUSAND TONS)
TABLE 730 ASIA-PACIFIC NUTS MARKET, BY COUNTRY, 2018-2032 (USD THOUSAND)
TABLE 731 ASIA-PACIFIC NUTS MARKET, BY PRODUCT TYPE, 2018-2032 (USD THOUSAND)
TABLE 732 ASIA-PACIFIC NUTS MARKET, BY PRODUCT TYPE, 2018-2032 (THOUSAND TONS)
TABLE 733 ASIA-PACIFIC TREE NUTS IN NUTS MARKET, BY TYPE, 2018-2032 (USD THOUSAND)
TABLE 734 ASIA-PACIFIC GROUND NUTS IN NUTS MARKET, BY PEANUTS, 2018-2032 (USD THOUSAND)
TABLE 735 ASIA-PACIFIC HYBRID/OTHER NUTS IN NUTS MARKET, BY TYPE, 2018-2032 (USD THOUSAND)
TABLE 736 ASIA-PACIFIC NUTS MARKET, BY FORM, 2018-2032 (USD THOUSAND)
TABLE 737 ASIA-PACIFIC NUTS MARKET, BY NATURE, 2018-2032 (USD THOUSAND)
TABLE 738 ASIA-PACIFIC NUTS MARKET, BY PROCESSING METHOD, 2018-2032 (USD THOUSAND)
TABLE 739 ASIA-PACIFIC ROASTED IN NUTS MARKET, BY TYPE, 2018-2032 (USD THOUSAND)
TABLE 740 ASIA-PACIFIC FLAVORED IN NUTS MARKET, BY TYPE, 2018-2032 (USD THOUSAND)
TABLE 741 ASIA-PACIFIC NUTS MARKET, BY GRADE, 2018-2032 (USD THOUSAND)
TABLE 742 ASIA-PACIFIC NUTS MARKET, BY SHELF LIFE, 2018-2032 (USD THOUSAND)
TABLE 743 ASIA-PACIFIC NUTS MARKET, BY CERTIFICATION, 2018-2032 (USD THOUSAND)
TABLE 744 ASIA-PACIFIC NUTS MARKET, BY PACKAGING, 2018-2032 (USD THOUSAND)
TABLE 745 ASIA-PACIFIC PLASTIC POUCHES IN NUTS MARKET, BY TYPE, 2018-2032 (USD THOUSAND)
TABLE 746 ASIA-PACIFIC NUTS MARKET, BY PACKAGING SIZE, 2018-2032 (USD THOUSAND)
TABLE 747 ASIA-PACIFIC NUTS MARKET, BY PRICE RANGE, 2018-2032 (USD THOUSAND)
TABLE 748 ASIA-PACIFIC NUTS MARKET, BY END-USE, 2018-2032 (USD THOUSAND)
TABLE 749 ASIA-PACIFIC FUNCTIONAL NUTRITION IN NUTS MARKET, BY TYPE, 2018-2032 (USD THOUSAND)
TABLE 750 ASIA-PACIFIC BEVERAGE INDUSTRY IN NUTS MARKET, BY TYPE, 2018-2032 (USD THOUSAND)
TABLE 751 ASIA-PACIFIC CULINARY IN NUTS MARKET, BY TYPE, 2018-2032 (USD THOUSAND)
TABLE 752 ASIA-PACIFIC PERSONAL CARE PRODUCTS IN NUTS MARKET, BY TYPE, 2018-2032 (USD THOUSAND)
TABLE 753 ASIA-PACIFIC BIO-BASED & AGRO-INDUSTRIAL USES IN NUTS MARKET, BY TYPE, 2018-2032 (USD THOUSAND)
TABLE 754 ASIA-PACIFIC ANIMAL FEED IN NUTS MARKET, BY TYPE, 2018-2032 (USD THOUSAND)
TABLE 755 ASIA-PACIFIC NUTS MARKET, BY DISTRIBUTION CHANNEL, 2018-2032 (USD THOUSAND)
TABLE 756 ASIA-PACIFIC B2C IN NUTS MARKET, BY TYPE, 2018-2032 (USD THOUSAND)
TABLE 757 ASIA-PACIFIC OFFLINE IN NUTS MARKET, BY TYPE, 2018-2032 (USD THOUSAND)
TABLE 758 ASIA-PACIFIC ONLINE IN NUTS MARKET, BY TYPE, 2018-2032 (USD THOUSAND)
TABLE 759 CHINA NUTS MARKET, BY PRODUCT TYPE, 2018-2032 (USD THOUSAND)
TABLE 760 CHINA NUTS MARKET, BY PRODUCT TYPE, 2018-2032 (THOUSAND TONS)
TABLE 761 CHINA TREE NUTS IN NUTS MARKET, BY TYPE, 2018-2032 (USD THOUSAND)
TABLE 762 CHINA GROUND NUTS IN NUTS MARKET, BY PEANUTS, 2018-2032 (USD THOUSAND)
TABLE 763 CHINA HYBRID/OTHER NUTS IN NUTS MARKET, BY TYPE, 2018-2032 (USD THOUSAND)
TABLE 764 CHINA NUTS MARKET, BY FORM, 2018-2032 (USD THOUSAND)
TABLE 765 CHINA NUTS MARKET, BY NATURE, 2018-2032 (USD THOUSAND)
TABLE 766 CHINA NUTS MARKET, BY PROCESSING METHOD, 2018-2032 (USD THOUSAND)
TABLE 767 CHINA ROASTED IN NUTS MARKET, BY TYPE, 2018-2032 (USD THOUSAND)
TABLE 768 CHINA FLAVORED IN NUTS MARKET, BY TYPE, 2018-2032 (USD THOUSAND)
TABLE 769 CHINA NUTS MARKET, BY GRADE, 2018-2032 (USD THOUSAND)
TABLE 770 CHINA NUTS MARKET, BY SHELF LIFE, 2018-2032 (USD THOUSAND)
TABLE 771 CHINA NUTS MARKET, BY CERTIFICATION, 2018-2032 (USD THOUSAND)
TABLE 772 CHINA NUTS MARKET, BY PACKAGING, 2018-2032 (USD THOUSAND)
TABLE 773 CHINA PLASTIC POUCHES IN NUTS MARKET, BY TYPE, 2018-2032 (USD THOUSAND)
TABLE 774 CHINA NUTS MARKET, BY PACKAGING SIZE, 2018-2032 (USD THOUSAND)
TABLE 775 CHINA NUTS MARKET, BY PRICE RANGE, 2018-2032 (USD THOUSAND)
TABLE 776 CHINA NUTS MARKET, BY END-USE, 2018-2032 (USD THOUSAND)
TABLE 777 CHINA FUNCTIONAL NUTRITION IN NUTS MARKET, BY TYPE, 2018-2032 (USD THOUSAND)
TABLE 778 CHINA BEVERAGE INDUSTRY IN NUTS MARKET, BY TYPE, 2018-2032 (USD THOUSAND)
TABLE 779 CHINA CULINARY IN NUTS MARKET, BY TYPE, 2018-2032 (USD THOUSAND)
TABLE 780 CHINA PERSONAL CARE PRODUCTS IN NUTS MARKET, BY TYPE, 2018-2032 (USD THOUSAND)
TABLE 781 CHINA BIO-BASED & AGRO-INDUSTRIAL USES IN NUTS MARKET, BY TYPE, 2018-2032 (USD THOUSAND)
TABLE 782 CHINA ANIMAL FEED IN NUTS MARKET, BY TYPE, 2018-2032 (USD THOUSAND)
TABLE 783 CHINA NUTS MARKET, BY DISTRIBUTION CHANNEL, 2018-2032 (USD THOUSAND)
TABLE 784 CHINA B2C IN NUTS MARKET, BY TYPE, 2018-2032 (USD THOUSAND)
TABLE 785 CHINA OFFLINE IN NUTS MARKET, BY TYPE, 2018-2032 (USD THOUSAND)
TABLE 786 CHINA ONLINE IN NUTS MARKET, BY TYPE, 2018-2032 (USD THOUSAND)
TABLE 787 INDIA NUTS MARKET, BY PRODUCT TYPE, 2018-2032 (USD THOUSAND)
TABLE 788 INDIA NUTS MARKET, BY PRODUCT TYPE, 2018-2032 (THOUSAND TONS)
TABLE 789 INDIA TREE NUTS IN NUTS MARKET, BY TYPE, 2018-2032 (USD THOUSAND)
TABLE 790 INDIA GROUND NUTS IN NUTS MARKET, BY PEANUTS, 2018-2032 (USD THOUSAND)
TABLE 791 INDIA HYBRID/OTHER NUTS IN NUTS MARKET, BY TYPE, 2018-2032 (USD THOUSAND)
TABLE 792 INDIA NUTS MARKET, BY FORM, 2018-2032 (USD THOUSAND)
TABLE 793 INDIA NUTS MARKET, BY NATURE, 2018-2032 (USD THOUSAND)
TABLE 794 INDIA NUTS MARKET, BY PROCESSING METHOD, 2018-2032 (USD THOUSAND)
TABLE 795 INDIA ROASTED IN NUTS MARKET, BY TYPE, 2018-2032 (USD THOUSAND)
TABLE 796 INDIA FLAVORED IN NUTS MARKET, BY TYPE, 2018-2032 (USD THOUSAND)
TABLE 797 INDIA NUTS MARKET, BY GRADE, 2018-2032 (USD THOUSAND)
TABLE 798 INDIA NUTS MARKET, BY SHELF LIFE, 2018-2032 (USD THOUSAND)
TABLE 799 INDIA NUTS MARKET, BY CERTIFICATION, 2018-2032 (USD THOUSAND)
TABLE 800 INDIA NUTS MARKET, BY PACKAGING, 2018-2032 (USD THOUSAND)
TABLE 801 INDIA PLASTIC POUCHES IN NUTS MARKET, BY TYPE, 2018-2032 (USD THOUSAND)
TABLE 802 INDIA NUTS MARKET, BY PACKAGING SIZE, 2018-2032 (USD THOUSAND)
TABLE 803 INDIA NUTS MARKET, BY PRICE RANGE, 2018-2032 (USD THOUSAND)
TABLE 804 INDIA NUTS MARKET, BY END-USE, 2018-2032 (USD THOUSAND)
TABLE 805 INDIA FUNCTIONAL NUTRITION IN NUTS MARKET, BY TYPE, 2018-2032 (USD THOUSAND)
TABLE 806 INDIA BEVERAGE INDUSTRY IN NUTS MARKET, BY TYPE, 2018-2032 (USD THOUSAND)
TABLE 807 INDIA CULINARY IN NUTS MARKET, BY TYPE, 2018-2032 (USD THOUSAND)
TABLE 808 INDIA PERSONAL CARE PRODUCTS IN NUTS MARKET, BY TYPE, 2018-2032 (USD THOUSAND)
TABLE 809 INDIA BIO-BASED & AGRO-INDUSTRIAL USES IN NUTS MARKET, BY TYPE, 2018-2032 (USD THOUSAND)
TABLE 810 INDIA ANIMAL FEED IN NUTS MARKET, BY TYPE, 2018-2032 (USD THOUSAND)
TABLE 811 INDIA NUTS MARKET, BY DISTRIBUTION CHANNEL, 2018-2032 (USD THOUSAND)
TABLE 812 INDIA B2C IN NUTS MARKET, BY TYPE, 2018-2032 (USD THOUSAND)
TABLE 813 INDIA OFFLINE IN NUTS MARKET, BY TYPE, 2018-2032 (USD THOUSAND)
TABLE 814 INDIA ONLINE IN NUTS MARKET, BY TYPE, 2018-2032 (USD THOUSAND)
TABLE 815 JAPAN NUTS MARKET, BY PRODUCT TYPE, 2018-2032 (USD THOUSAND)
TABLE 816 JAPAN NUTS MARKET, BY PRODUCT TYPE, 2018-2032 (THOUSAND TONS)
TABLE 817 JAPAN TREE NUTS IN NUTS MARKET, BY TYPE, 2018-2032 (USD THOUSAND)
TABLE 818 JAPAN GROUND NUTS IN NUTS MARKET, BY PEANUTS, 2018-2032 (USD THOUSAND)
TABLE 819 JAPAN HYBRID/OTHER NUTS IN NUTS MARKET, BY TYPE, 2018-2032 (USD THOUSAND)
TABLE 820 JAPAN NUTS MARKET, BY FORM, 2018-2032 (USD THOUSAND)
TABLE 821 JAPAN NUTS MARKET, BY NATURE, 2018-2032 (USD THOUSAND)
TABLE 822 JAPAN NUTS MARKET, BY PROCESSING METHOD, 2018-2032 (USD THOUSAND)
TABLE 823 JAPAN ROASTED IN NUTS MARKET, BY TYPE, 2018-2032 (USD THOUSAND)
TABLE 824 JAPAN FLAVORED IN NUTS MARKET, BY TYPE, 2018-2032 (USD THOUSAND)
TABLE 825 JAPAN NUTS MARKET, BY GRADE, 2018-2032 (USD THOUSAND)
TABLE 826 JAPAN NUTS MARKET, BY SHELF LIFE, 2018-2032 (USD THOUSAND)
TABLE 827 JAPAN NUTS MARKET, BY CERTIFICATION, 2018-2032 (USD THOUSAND)
TABLE 828 JAPAN NUTS MARKET, BY PACKAGING, 2018-2032 (USD THOUSAND)
TABLE 829 JAPAN PLASTIC POUCHES IN NUTS MARKET, BY TYPE, 2018-2032 (USD THOUSAND)
TABLE 830 JAPAN NUTS MARKET, BY PACKAGING SIZE, 2018-2032 (USD THOUSAND)
TABLE 831 JAPAN NUTS MARKET, BY PRICE RANGE, 2018-2032 (USD THOUSAND)
TABLE 832 JAPAN NUTS MARKET, BY END-USE, 2018-2032 (USD THOUSAND)
TABLE 833 JAPAN FUNCTIONAL NUTRITION IN NUTS MARKET, BY TYPE, 2018-2032 (USD THOUSAND)
TABLE 834 JAPAN BEVERAGE INDUSTRY IN NUTS MARKET, BY TYPE, 2018-2032 (USD THOUSAND)
TABLE 835 JAPAN CULINARY IN NUTS MARKET, BY TYPE, 2018-2032 (USD THOUSAND)
TABLE 836 JAPAN PERSONAL CARE PRODUCTS IN NUTS MARKET, BY TYPE, 2018-2032 (USD THOUSAND)
TABLE 837 JAPAN BIO-BASED & AGRO-INDUSTRIAL USES IN NUTS MARKET, BY TYPE, 2018-2032 (USD THOUSAND)
TABLE 838 JAPAN ANIMAL FEED IN NUTS MARKET, BY TYPE, 2018-2032 (USD THOUSAND)
TABLE 839 JAPAN NUTS MARKET, BY DISTRIBUTION CHANNEL, 2018-2032 (USD THOUSAND)
TABLE 840 JAPAN B2C IN NUTS MARKET, BY TYPE, 2018-2032 (USD THOUSAND)
TABLE 841 JAPAN OFFLINE IN NUTS MARKET, BY TYPE, 2018-2032 (USD THOUSAND)
TABLE 842 JAPAN ONLINE IN NUTS MARKET, BY TYPE, 2018-2032 (USD THOUSAND)
TABLE 843 SOUTH KOREA NUTS MARKET, BY PRODUCT TYPE, 2018-2032 (USD THOUSAND)
TABLE 844 SOUTH KOREA NUTS MARKET, BY PRODUCT TYPE, 2018-2032 (THOUSAND TONS)
TABLE 845 SOUTH KOREA TREE NUTS IN NUTS MARKET, BY TYPE, 2018-2032 (USD THOUSAND)
TABLE 846 SOUTH KOREA GROUND NUTS IN NUTS MARKET, BY PEANUTS, 2018-2032 (USD THOUSAND)
TABLE 847 SOUTH KOREA HYBRID/OTHER NUTS IN NUTS MARKET, BY TYPE, 2018-2032 (USD THOUSAND)
TABLE 848 SOUTH KOREA NUTS MARKET, BY FORM, 2018-2032 (USD THOUSAND)
TABLE 849 SOUTH KOREA NUTS MARKET, BY NATURE, 2018-2032 (USD THOUSAND)
TABLE 850 SOUTH KOREA NUTS MARKET, BY PROCESSING METHOD, 2018-2032 (USD THOUSAND)
TABLE 851 SOUTH KOREA ROASTED IN NUTS MARKET, BY TYPE, 2018-2032 (USD THOUSAND)
TABLE 852 SOUTH KOREA FLAVORED IN NUTS MARKET, BY TYPE, 2018-2032 (USD THOUSAND)
TABLE 853 SOUTH KOREA NUTS MARKET, BY GRADE, 2018-2032 (USD THOUSAND)
TABLE 854 SOUTH KOREA NUTS MARKET, BY SHELF LIFE, 2018-2032 (USD THOUSAND)
TABLE 855 SOUTH KOREA NUTS MARKET, BY CERTIFICATION, 2018-2032 (USD THOUSAND)
TABLE 856 SOUTH KOREA NUTS MARKET, BY PACKAGING, 2018-2032 (USD THOUSAND)
TABLE 857 SOUTH KOREA PLASTIC POUCHES IN NUTS MARKET, BY TYPE, 2018-2032 (USD THOUSAND)
TABLE 858 SOUTH KOREA NUTS MARKET, BY PACKAGING SIZE, 2018-2032 (USD THOUSAND)
TABLE 859 SOUTH KOREA NUTS MARKET, BY PRICE RANGE, 2018-2032 (USD THOUSAND)
TABLE 860 SOUTH KOREA NUTS MARKET, BY END-USE, 2018-2032 (USD THOUSAND)
TABLE 861 SOUTH KOREA FUNCTIONAL NUTRITION IN NUTS MARKET, BY TYPE, 2018-2032 (USD THOUSAND)
TABLE 862 SOUTH KOREA BEVERAGE INDUSTRY IN NUTS MARKET, BY TYPE, 2018-2032 (USD THOUSAND)
TABLE 863 SOUTH KOREA CULINARY IN NUTS MARKET, BY TYPE, 2018-2032 (USD THOUSAND)
TABLE 864 SOUTH KOREA PERSONAL CARE PRODUCTS IN NUTS MARKET, BY TYPE, 2018-2032 (USD THOUSAND)
TABLE 865 SOUTH KOREA BIO-BASED & AGRO-INDUSTRIAL USES IN NUTS MARKET, BY TYPE, 2018-2032 (USD THOUSAND)
TABLE 866 SOUTH KOREA ANIMAL FEED IN NUTS MARKET, BY TYPE, 2018-2032 (USD THOUSAND)
TABLE 867 SOUTH KOREA NUTS MARKET, BY DISTRIBUTION CHANNEL, 2018-2032 (USD THOUSAND)
TABLE 868 SOUTH KOREA B2C IN NUTS MARKET, BY TYPE, 2018-2032 (USD THOUSAND)
TABLE 869 SOUTH KOREA OFFLINE IN NUTS MARKET, BY TYPE, 2018-2032 (USD THOUSAND)
TABLE 870 SOUTH KOREA ONLINE IN NUTS MARKET, BY TYPE, 2018-2032 (USD THOUSAND)
TABLE 871 AUSTRALIA NUTS MARKET, BY PRODUCT TYPE, 2018-2032 (USD THOUSAND)
TABLE 872 AUSTRALIA NUTS MARKET, BY PRODUCT TYPE, 2018-2032 (THOUSAND TONS)
TABLE 873 AUSTRALIA TREE NUTS IN NUTS MARKET, BY TYPE, 2018-2032 (USD THOUSAND)
TABLE 874 AUSTRALIA GROUND NUTS IN NUTS MARKET, BY PEANUTS, 2018-2032 (USD THOUSAND)
TABLE 875 AUSTRALIA HYBRID/OTHER NUTS IN NUTS MARKET, BY TYPE, 2018-2032 (USD THOUSAND)
TABLE 876 AUSTRALIA NUTS MARKET, BY FORM, 2018-2032 (USD THOUSAND)
TABLE 877 AUSTRALIA NUTS MARKET, BY NATURE, 2018-2032 (USD THOUSAND)
TABLE 878 AUSTRALIA NUTS MARKET, BY PROCESSING METHOD, 2018-2032 (USD THOUSAND)
TABLE 879 AUSTRALIA ROASTED IN NUTS MARKET, BY TYPE, 2018-2032 (USD THOUSAND)
TABLE 880 AUSTRALIA FLAVORED IN NUTS MARKET, BY TYPE, 2018-2032 (USD THOUSAND)
TABLE 881 AUSTRALIA NUTS MARKET, BY GRADE, 2018-2032 (USD THOUSAND)
TABLE 882 AUSTRALIA NUTS MARKET, BY SHELF LIFE, 2018-2032 (USD THOUSAND)
TABLE 883 AUSTRALIA NUTS MARKET, BY CERTIFICATION, 2018-2032 (USD THOUSAND)
TABLE 884 AUSTRALIA NUTS MARKET, BY PACKAGING, 2018-2032 (USD THOUSAND)
TABLE 885 AUSTRALIA PLASTIC POUCHES IN NUTS MARKET, BY TYPE, 2018-2032 (USD THOUSAND)
TABLE 886 AUSTRALIA NUTS MARKET, BY PACKAGING SIZE, 2018-2032 (USD THOUSAND)
TABLE 887 AUSTRALIA NUTS MARKET, BY PRICE RANGE, 2018-2032 (USD THOUSAND)
TABLE 888 AUSTRALIA NUTS MARKET, BY END-USE, 2018-2032 (USD THOUSAND)
TABLE 889 AUSTRALIA FUNCTIONAL NUTRITION IN NUTS MARKET, BY TYPE, 2018-2032 (USD THOUSAND)
TABLE 890 AUSTRALIA BEVERAGE INDUSTRY IN NUTS MARKET, BY TYPE, 2018-2032 (USD THOUSAND)
TABLE 891 AUSTRALIA CULINARY IN NUTS MARKET, BY TYPE, 2018-2032 (USD THOUSAND)
TABLE 892 AUSTRALIA PERSONAL CARE PRODUCTS IN NUTS MARKET, BY TYPE, 2018-2032 (USD THOUSAND)
TABLE 893 AUSTRALIA BIO-BASED & AGRO-INDUSTRIAL USES IN NUTS MARKET, BY TYPE, 2018-2032 (USD THOUSAND)
TABLE 894 AUSTRALIA ANIMAL FEED IN NUTS MARKET, BY TYPE, 2018-2032 (USD THOUSAND)
TABLE 895 AUSTRALIA NUTS MARKET, BY DISTRIBUTION CHANNEL, 2018-2032 (USD THOUSAND)
TABLE 896 AUSTRALIA B2C IN NUTS MARKET, BY TYPE, 2018-2032 (USD THOUSAND)
TABLE 897 AUSTRALIA OFFLINE IN NUTS MARKET, BY TYPE, 2018-2032 (USD THOUSAND)
TABLE 898 AUSTRALIA ONLINE IN NUTS MARKET, BY TYPE, 2018-2032 (USD THOUSAND)
TABLE 899 MALAYSIA NUTS MARKET, BY PRODUCT TYPE, 2018-2032 (USD THOUSAND)
TABLE 900 MALAYSIA NUTS MARKET, BY PRODUCT TYPE, 2018-2032 (THOUSAND TONS)
TABLE 901 MALAYSIA TREE NUTS IN NUTS MARKET, BY TYPE, 2018-2032 (USD THOUSAND)
TABLE 902 MALAYSIA GROUND NUTS IN NUTS MARKET, BY PEANUTS, 2018-2032 (USD THOUSAND)
TABLE 903 MALAYSIA HYBRID/OTHER NUTS IN NUTS MARKET, BY TYPE, 2018-2032 (USD THOUSAND)
TABLE 904 MALAYSIA NUTS MARKET, BY FORM, 2018-2032 (USD THOUSAND)
TABLE 905 MALAYSIA NUTS MARKET, BY NATURE, 2018-2032 (USD THOUSAND)
TABLE 906 MALAYSIA NUTS MARKET, BY PROCESSING METHOD, 2018-2032 (USD THOUSAND)
TABLE 907 MALAYSIA ROASTED IN NUTS MARKET, BY TYPE, 2018-2032 (USD THOUSAND)
TABLE 908 MALAYSIA FLAVORED IN NUTS MARKET, BY TYPE, 2018-2032 (USD THOUSAND)
TABLE 909 MALAYSIA NUTS MARKET, BY GRADE, 2018-2032 (USD THOUSAND)
TABLE 910 MALAYSIA NUTS MARKET, BY SHELF LIFE, 2018-2032 (USD THOUSAND)
TABLE 911 MALAYSIA NUTS MARKET, BY CERTIFICATION, 2018-2032 (USD THOUSAND)
TABLE 912 MALAYSIA NUTS MARKET, BY PACKAGING, 2018-2032 (USD THOUSAND)
TABLE 913 MALAYSIA PLASTIC POUCHES IN NUTS MARKET, BY TYPE, 2018-2032 (USD THOUSAND)
TABLE 914 MALAYSIA NUTS MARKET, BY PACKAGING SIZE, 2018-2032 (USD THOUSAND)
TABLE 915 MALAYSIA NUTS MARKET, BY PRICE RANGE, 2018-2032 (USD THOUSAND)
TABLE 916 MALAYSIA NUTS MARKET, BY END-USE, 2018-2032 (USD THOUSAND)
TABLE 917 MALAYSIA FUNCTIONAL NUTRITION IN NUTS MARKET, BY TYPE, 2018-2032 (USD THOUSAND)
TABLE 918 MALAYSIA BEVERAGE INDUSTRY IN NUTS MARKET, BY TYPE, 2018-2032 (USD THOUSAND)
TABLE 919 MALAYSIA CULINARY IN NUTS MARKET, BY TYPE, 2018-2032 (USD THOUSAND)
TABLE 920 MALAYSIA PERSONAL CARE PRODUCTS IN NUTS MARKET, BY TYPE, 2018-2032 (USD THOUSAND)
TABLE 921 MALAYSIA BIO-BASED & AGRO-INDUSTRIAL USES IN NUTS MARKET, BY TYPE, 2018-2032 (USD THOUSAND)
TABLE 922 MALAYSIA ANIMAL FEED IN NUTS MARKET, BY TYPE, 2018-2032 (USD THOUSAND)
TABLE 923 MALAYSIA NUTS MARKET, BY DISTRIBUTION CHANNEL, 2018-2032 (USD THOUSAND)
TABLE 924 MALAYSIA B2C IN NUTS MARKET, BY TYPE, 2018-2032 (USD THOUSAND)
TABLE 925 MALAYSIA OFFLINE IN NUTS MARKET, BY TYPE, 2018-2032 (USD THOUSAND)
TABLE 926 MALAYSIA ONLINE IN NUTS MARKET, BY TYPE, 2018-2032 (USD THOUSAND)
TABLE 927 INDONESIA NUTS MARKET, BY PRODUCT TYPE, 2018-2032 (USD THOUSAND)
TABLE 928 INDONESIA NUTS MARKET, BY PRODUCT TYPE, 2018-2032 (THOUSAND TONS)
TABLE 929 INDONESIA TREE NUTS IN NUTS MARKET, BY TYPE, 2018-2032 (USD THOUSAND)
TABLE 930 INDONESIA GROUND NUTS IN NUTS MARKET, BY PEANUTS, 2018-2032 (USD THOUSAND)
TABLE 931 INDONESIA HYBRID/OTHER NUTS IN NUTS MARKET, BY TYPE, 2018-2032 (USD THOUSAND)
TABLE 932 INDONESIA NUTS MARKET, BY FORM, 2018-2032 (USD THOUSAND)
TABLE 933 INDONESIA NUTS MARKET, BY NATURE, 2018-2032 (USD THOUSAND)
TABLE 934 INDONESIA NUTS MARKET, BY PROCESSING METHOD, 2018-2032 (USD THOUSAND)
TABLE 935 INDONESIA ROASTED IN NUTS MARKET, BY TYPE, 2018-2032 (USD THOUSAND)
TABLE 936 INDONESIA FLAVORED IN NUTS MARKET, BY TYPE, 2018-2032 (USD THOUSAND)
TABLE 937 INDONESIA NUTS MARKET, BY GRADE, 2018-2032 (USD THOUSAND)
TABLE 938 INDONESIA NUTS MARKET, BY SHELF LIFE, 2018-2032 (USD THOUSAND)
TABLE 939 INDONESIA NUTS MARKET, BY CERTIFICATION, 2018-2032 (USD THOUSAND)
TABLE 940 INDONESIA NUTS MARKET, BY PACKAGING, 2018-2032 (USD THOUSAND)
TABLE 941 INDONESIA PLASTIC POUCHES IN NUTS MARKET, BY TYPE, 2018-2032 (USD THOUSAND)
TABLE 942 INDONESIA NUTS MARKET, BY PACKAGING SIZE, 2018-2032 (USD THOUSAND)
TABLE 943 INDONESIA NUTS MARKET, BY PRICE RANGE, 2018-2032 (USD THOUSAND)
TABLE 944 INDONESIA NUTS MARKET, BY END-USE, 2018-2032 (USD THOUSAND)
TABLE 945 INDONESIA FUNCTIONAL NUTRITION IN NUTS MARKET, BY TYPE, 2018-2032 (USD THOUSAND)
TABLE 946 INDONESIA BEVERAGE INDUSTRY IN NUTS MARKET, BY TYPE, 2018-2032 (USD THOUSAND)
TABLE 947 INDONESIA CULINARY IN NUTS MARKET, BY TYPE, 2018-2032 (USD THOUSAND)
TABLE 948 INDONESIA PERSONAL CARE PRODUCTS IN NUTS MARKET, BY TYPE, 2018-2032 (USD THOUSAND)
TABLE 949 INDONESIA BIO-BASED & AGRO-INDUSTRIAL USES IN NUTS MARKET, BY TYPE, 2018-2032 (USD THOUSAND)
TABLE 950 INDONESIA ANIMAL FEED IN NUTS MARKET, BY TYPE, 2018-2032 (USD THOUSAND)
TABLE 951 INDONESIA NUTS MARKET, BY DISTRIBUTION CHANNEL, 2018-2032 (USD THOUSAND)
TABLE 952 INDONESIA B2C IN NUTS MARKET, BY TYPE, 2018-2032 (USD THOUSAND)
TABLE 953 INDONESIA OFFLINE IN NUTS MARKET, BY TYPE, 2018-2032 (USD THOUSAND)
TABLE 954 INDONESIA ONLINE IN NUTS MARKET, BY TYPE, 2018-2032 (USD THOUSAND)
TABLE 955 THAILAND NUTS MARKET, BY PRODUCT TYPE, 2018-2032 (USD THOUSAND)
TABLE 956 THAILAND NUTS MARKET, BY PRODUCT TYPE, 2018-2032 (THOUSAND TONS)
TABLE 957 THAILAND TREE NUTS IN NUTS MARKET, BY TYPE, 2018-2032 (USD THOUSAND)
TABLE 958 THAILAND GROUND NUTS IN NUTS MARKET, BY PEANUTS, 2018-2032 (USD THOUSAND)
TABLE 959 THAILAND HYBRID/OTHER NUTS IN NUTS MARKET, BY TYPE, 2018-2032 (USD THOUSAND)
TABLE 960 THAILAND NUTS MARKET, BY FORM, 2018-2032 (USD THOUSAND)
TABLE 961 THAILAND NUTS MARKET, BY NATURE, 2018-2032 (USD THOUSAND)
TABLE 962 THAILAND NUTS MARKET, BY PROCESSING METHOD, 2018-2032 (USD THOUSAND)
TABLE 963 THAILAND ROASTED IN NUTS MARKET, BY TYPE, 2018-2032 (USD THOUSAND)
TABLE 964 THAILAND FLAVORED IN NUTS MARKET, BY TYPE, 2018-2032 (USD THOUSAND)
TABLE 965 THAILAND NUTS MARKET, BY GRADE, 2018-2032 (USD THOUSAND)
TABLE 966 THAILAND NUTS MARKET, BY SHELF LIFE, 2018-2032 (USD THOUSAND)
TABLE 967 THAILAND NUTS MARKET, BY CERTIFICATION, 2018-2032 (USD THOUSAND)
TABLE 968 THAILAND NUTS MARKET, BY PACKAGING, 2018-2032 (USD THOUSAND)
TABLE 969 THAILAND PLASTIC POUCHES IN NUTS MARKET, BY TYPE, 2018-2032 (USD THOUSAND)
TABLE 970 THAILAND NUTS MARKET, BY PACKAGING SIZE, 2018-2032 (USD THOUSAND)
TABLE 971 THAILAND NUTS MARKET, BY PRICE RANGE, 2018-2032 (USD THOUSAND)
TABLE 972 THAILAND NUTS MARKET, BY END-USE, 2018-2032 (USD THOUSAND)
TABLE 973 THAILAND FUNCTIONAL NUTRITION IN NUTS MARKET, BY TYPE, 2018-2032 (USD THOUSAND)
TABLE 974 THAILAND BEVERAGE INDUSTRY IN NUTS MARKET, BY TYPE, 2018-2032 (USD THOUSAND)
TABLE 975 THAILAND CULINARY IN NUTS MARKET, BY TYPE, 2018-2032 (USD THOUSAND)
TABLE 976 THAILAND PERSONAL CARE PRODUCTS IN NUTS MARKET, BY TYPE, 2018-2032 (USD THOUSAND)
TABLE 977 THAILAND BIO-BASED & AGRO-INDUSTRIAL USES IN NUTS MARKET, BY TYPE, 2018-2032 (USD THOUSAND)
TABLE 978 THAILAND ANIMAL FEED IN NUTS MARKET, BY TYPE, 2018-2032 (USD THOUSAND)
TABLE 979 THAILAND NUTS MARKET, BY DISTRIBUTION CHANNEL, 2018-2032 (USD THOUSAND)
TABLE 980 THAILAND B2C IN NUTS MARKET, BY TYPE, 2018-2032 (USD THOUSAND)
TABLE 981 THAILAND OFFLINE IN NUTS MARKET, BY TYPE, 2018-2032 (USD THOUSAND)
TABLE 982 THAILAND ONLINE IN NUTS MARKET, BY TYPE, 2018-2032 (USD THOUSAND)
TABLE 983 PHILIPPINES NUTS MARKET, BY PRODUCT TYPE, 2018-2032 (USD THOUSAND)
TABLE 984 PHILIPPINES NUTS MARKET, BY PRODUCT TYPE, 2018-2032 (THOUSAND TONS)
TABLE 985 PHILIPPINES TREE NUTS IN NUTS MARKET, BY TYPE, 2018-2032 (USD THOUSAND)
TABLE 986 PHILIPPINES GROUND NUTS IN NUTS MARKET, BY PEANUTS, 2018-2032 (USD THOUSAND)
TABLE 987 PHILIPPINES HYBRID/OTHER NUTS IN NUTS MARKET, BY TYPE, 2018-2032 (USD THOUSAND)
TABLE 988 PHILIPPINES NUTS MARKET, BY FORM, 2018-2032 (USD THOUSAND)
TABLE 989 PHILIPPINES NUTS MARKET, BY NATURE, 2018-2032 (USD THOUSAND)
TABLE 990 PHILIPPINES NUTS MARKET, BY PROCESSING METHOD, 2018-2032 (USD THOUSAND)
TABLE 991 PHILIPPINES ROASTED IN NUTS MARKET, BY TYPE, 2018-2032 (USD THOUSAND)
TABLE 992 PHILIPPINES FLAVORED IN NUTS MARKET, BY TYPE, 2018-2032 (USD THOUSAND)
TABLE 993 PHILIPPINES NUTS MARKET, BY GRADE, 2018-2032 (USD THOUSAND)
TABLE 994 PHILIPPINES NUTS MARKET, BY SHELF LIFE, 2018-2032 (USD THOUSAND)
TABLE 995 PHILIPPINES NUTS MARKET, BY CERTIFICATION, 2018-2032 (USD THOUSAND)
TABLE 996 PHILIPPINES NUTS MARKET, BY PACKAGING, 2018-2032 (USD THOUSAND)
TABLE 997 PHILIPPINES PLASTIC POUCHES IN NUTS MARKET, BY TYPE, 2018-2032 (USD THOUSAND)
TABLE 998 PHILIPPINES NUTS MARKET, BY PACKAGING SIZE, 2018-2032 (USD THOUSAND)
TABLE 999 PHILIPPINES NUTS MARKET, BY PRICE RANGE, 2018-2032 (USD THOUSAND)
TABLE 1000 PHILIPPINES NUTS MARKET, BY END-USE, 2018-2032 (USD THOUSAND)
TABLE 1001 PHILIPPINES FUNCTIONAL NUTRITION IN NUTS MARKET, BY TYPE, 2018-2032 (USD THOUSAND)
TABLE 1002 PHILIPPINES BEVERAGE INDUSTRY IN NUTS MARKET, BY TYPE, 2018-2032 (USD THOUSAND)
TABLE 1003 PHILIPPINES CULINARY IN NUTS MARKET, BY TYPE, 2018-2032 (USD THOUSAND)
TABLE 1004 PHILIPPINES PERSONAL CARE PRODUCTS IN NUTS MARKET, BY TYPE, 2018-2032 (USD THOUSAND)
TABLE 1005 PHILIPPINES BIO-BASED & AGRO-INDUSTRIAL USES IN NUTS MARKET, BY TYPE, 2018-2032 (USD THOUSAND)
TABLE 1006 PHILIPPINES ANIMAL FEED IN NUTS MARKET, BY TYPE, 2018-2032 (USD THOUSAND)
TABLE 1007 PHILIPPINES NUTS MARKET, BY DISTRIBUTION CHANNEL, 2018-2032 (USD THOUSAND)
TABLE 1008 PHILIPPINES B2C IN NUTS MARKET, BY TYPE, 2018-2032 (USD THOUSAND)
TABLE 1009 PHILIPPINES OFFLINE IN NUTS MARKET, BY TYPE, 2018-2032 (USD THOUSAND)
TABLE 1010 PHILIPPINES ONLINE IN NUTS MARKET, BY TYPE, 2018-2032 (USD THOUSAND)
TABLE 1011 SINGAPORE NUTS MARKET, BY PRODUCT TYPE, 2018-2032 (USD THOUSAND)
TABLE 1012 SINGAPORE NUTS MARKET, BY PRODUCT TYPE, 2018-2032 (THOUSAND TONS)
TABLE 1013 SINGAPORE TREE NUTS IN NUTS MARKET, BY TYPE, 2018-2032 (USD THOUSAND)
TABLE 1014 SINGAPORE GROUND NUTS IN NUTS MARKET, BY PEANUTS, 2018-2032 (USD THOUSAND)
TABLE 1015 SINGAPORE HYBRID/OTHER NUTS IN NUTS MARKET, BY TYPE, 2018-2032 (USD THOUSAND)
TABLE 1016 SINGAPORE NUTS MARKET, BY FORM, 2018-2032 (USD THOUSAND)
TABLE 1017 SINGAPORE NUTS MARKET, BY NATURE, 2018-2032 (USD THOUSAND)
TABLE 1018 SINGAPORE NUTS MARKET, BY PROCESSING METHOD, 2018-2032 (USD THOUSAND)
TABLE 1019 SINGAPORE ROASTED IN NUTS MARKET, BY TYPE, 2018-2032 (USD THOUSAND)
TABLE 1020 SINGAPORE FLAVORED IN NUTS MARKET, BY TYPE, 2018-2032 (USD THOUSAND)
TABLE 1021 SINGAPORE NUTS MARKET, BY GRADE, 2018-2032 (USD THOUSAND)
TABLE 1022 SINGAPORE NUTS MARKET, BY SHELF LIFE, 2018-2032 (USD THOUSAND)
TABLE 1023 SINGAPORE NUTS MARKET, BY CERTIFICATION, 2018-2032 (USD THOUSAND)
TABLE 1024 SINGAPORE NUTS MARKET, BY PACKAGING, 2018-2032 (USD THOUSAND)
TABLE 1025 SINGAPORE PLASTIC POUCHES IN NUTS MARKET, BY TYPE, 2018-2032 (USD THOUSAND)
TABLE 1026 SINGAPORE NUTS MARKET, BY PACKAGING SIZE, 2018-2032 (USD THOUSAND)
TABLE 1027 SINGAPORE NUTS MARKET, BY PRICE RANGE, 2018-2032 (USD THOUSAND)
TABLE 1028 SINGAPORE NUTS MARKET, BY END-USE, 2018-2032 (USD THOUSAND)
TABLE 1029 SINGAPORE FUNCTIONAL NUTRITION IN NUTS MARKET, BY TYPE, 2018-2032 (USD THOUSAND)
TABLE 1030 SINGAPORE BEVERAGE INDUSTRY IN NUTS MARKET, BY TYPE, 2018-2032 (USD THOUSAND)
TABLE 1031 SINGAPORE CULINARY IN NUTS MARKET, BY TYPE, 2018-2032 (USD THOUSAND)
TABLE 1032 SINGAPORE PERSONAL CARE PRODUCTS IN NUTS MARKET, BY TYPE, 2018-2032 (USD THOUSAND)
TABLE 1033 SINGAPORE BIO-BASED & AGRO-INDUSTRIAL USES IN NUTS MARKET, BY TYPE, 2018-2032 (USD THOUSAND)
TABLE 1034 SINGAPORE ANIMAL FEED IN NUTS MARKET, BY TYPE, 2018-2032 (USD THOUSAND)
TABLE 1035 SINGAPORE NUTS MARKET, BY DISTRIBUTION CHANNEL, 2018-2032 (USD THOUSAND)
TABLE 1036 SINGAPORE B2C IN NUTS MARKET, BY TYPE, 2018-2032 (USD THOUSAND)
TABLE 1037 SINGAPORE OFFLINE IN NUTS MARKET, BY TYPE, 2018-2032 (USD THOUSAND)
TABLE 1038 SINGAPORE ONLINE IN NUTS MARKET, BY TYPE, 2018-2032 (USD THOUSAND)
TABLE 1039 HONG KONG NUTS MARKET, BY PRODUCT TYPE, 2018-2032 (USD THOUSAND)
TABLE 1040 HONG KONG NUTS MARKET, BY PRODUCT TYPE, 2018-2032 (THOUSAND TONS)
TABLE 1041 HONG KONG TREE NUTS IN NUTS MARKET, BY TYPE, 2018-2032 (USD THOUSAND)
TABLE 1042 HONG KONG GROUND NUTS IN NUTS MARKET, BY PEANUTS, 2018-2032 (USD THOUSAND)
TABLE 1043 HONG KONG HYBRID/OTHER NUTS IN NUTS MARKET, BY TYPE, 2018-2032 (USD THOUSAND)
TABLE 1044 HONG KONG NUTS MARKET, BY FORM, 2018-2032 (USD THOUSAND)
TABLE 1045 HONG KONG NUTS MARKET, BY NATURE, 2018-2032 (USD THOUSAND)
TABLE 1046 HONG KONG NUTS MARKET, BY PROCESSING METHOD, 2018-2032 (USD THOUSAND)
TABLE 1047 HONG KONG ROASTED IN NUTS MARKET, BY TYPE, 2018-2032 (USD THOUSAND)
TABLE 1048 HONG KONG FLAVORED IN NUTS MARKET, BY TYPE, 2018-2032 (USD THOUSAND)
TABLE 1049 HONG KONG NUTS MARKET, BY GRADE, 2018-2032 (USD THOUSAND)
TABLE 1050 HONG KONG NUTS MARKET, BY SHELF LIFE, 2018-2032 (USD THOUSAND)
TABLE 1051 HONG KONG NUTS MARKET, BY CERTIFICATION, 2018-2032 (USD THOUSAND)
TABLE 1052 HONG KONG NUTS MARKET, BY PACKAGING, 2018-2032 (USD THOUSAND)
TABLE 1053 HONG KONG PLASTIC POUCHES IN NUTS MARKET, BY TYPE, 2018-2032 (USD THOUSAND)
TABLE 1054 HONG KONG NUTS MARKET, BY PACKAGING SIZE, 2018-2032 (USD THOUSAND)
TABLE 1055 HONG KONG NUTS MARKET, BY PRICE RANGE, 2018-2032 (USD THOUSAND)
TABLE 1056 HONG KONG NUTS MARKET, BY END-USE, 2018-2032 (USD THOUSAND)
TABLE 1057 HONG KONG FUNCTIONAL NUTRITION IN NUTS MARKET, BY TYPE, 2018-2032 (USD THOUSAND)
TABLE 1058 HONG KONG BEVERAGE INDUSTRY IN NUTS MARKET, BY TYPE, 2018-2032 (USD THOUSAND)
TABLE 1059 HONG KONG CULINARY IN NUTS MARKET, BY TYPE, 2018-2032 (USD THOUSAND)
TABLE 1060 HONG KONG PERSONAL CARE PRODUCTS IN NUTS MARKET, BY TYPE, 2018-2032 (USD THOUSAND)
TABLE 1061 HONG KONG BIO-BASED & AGRO-INDUSTRIAL USES IN NUTS MARKET, BY TYPE, 2018-2032 (USD THOUSAND)
TABLE 1062 HONG KONG ANIMAL FEED IN NUTS MARKET, BY TYPE, 2018-2032 (USD THOUSAND)
TABLE 1063 HONG KONG NUTS MARKET, BY DISTRIBUTION CHANNEL, 2018-2032 (USD THOUSAND)
TABLE 1064 HONG KONG B2C IN NUTS MARKET, BY TYPE, 2018-2032 (USD THOUSAND)
TABLE 1065 HONG KONG OFFLINE IN NUTS MARKET, BY TYPE, 2018-2032 (USD THOUSAND)
TABLE 1066 HONG KONG ONLINE IN NUTS MARKET, BY TYPE, 2018-2032 (USD THOUSAND)
TABLE 1067 NEW ZEALAND NUTS MARKET, BY PRODUCT TYPE, 2018-2032 (USD THOUSAND)
TABLE 1068 NEW ZEALAND NUTS MARKET, BY PRODUCT TYPE, 2018-2032 (THOUSAND TONS)
TABLE 1069 NEW ZEALAND TREE NUTS IN NUTS MARKET, BY TYPE, 2018-2032 (USD THOUSAND)
TABLE 1070 NEW ZEALAND GROUND NUTS IN NUTS MARKET, BY PEANUTS, 2018-2032 (USD THOUSAND)
TABLE 1071 NEW ZEALAND HYBRID/OTHER NUTS IN NUTS MARKET, BY TYPE, 2018-2032 (USD THOUSAND)
TABLE 1072 NEW ZEALAND NUTS MARKET, BY FORM, 2018-2032 (USD THOUSAND)
TABLE 1073 NEW ZEALAND NUTS MARKET, BY NATURE, 2018-2032 (USD THOUSAND)
TABLE 1074 NEW ZEALAND NUTS MARKET, BY PROCESSING METHOD, 2018-2032 (USD THOUSAND)
TABLE 1075 NEW ZEALAND ROASTED IN NUTS MARKET, BY TYPE, 2018-2032 (USD THOUSAND)
TABLE 1076 NEW ZEALAND FLAVORED IN NUTS MARKET, BY TYPE, 2018-2032 (USD THOUSAND)
TABLE 1077 NEW ZEALAND NUTS MARKET, BY GRADE, 2018-2032 (USD THOUSAND)
TABLE 1078 NEW ZEALAND NUTS MARKET, BY SHELF LIFE, 2018-2032 (USD THOUSAND)
TABLE 1079 NEW ZEALAND NUTS MARKET, BY CERTIFICATION, 2018-2032 (USD THOUSAND)
TABLE 1080 NEW ZEALAND NUTS MARKET, BY PACKAGING, 2018-2032 (USD THOUSAND)
TABLE 1081 NEW ZEALAND PLASTIC POUCHES IN NUTS MARKET, BY TYPE, 2018-2032 (USD THOUSAND)
TABLE 1082 NEW ZEALAND NUTS MARKET, BY PACKAGING SIZE, 2018-2032 (USD THOUSAND)
TABLE 1083 NEW ZEALAND NUTS MARKET, BY PRICE RANGE, 2018-2032 (USD THOUSAND)
TABLE 1084 NEW ZEALAND NUTS MARKET, BY END-USE, 2018-2032 (USD THOUSAND)
TABLE 1085 NEW ZEALAND FUNCTIONAL NUTRITION IN NUTS MARKET, BY TYPE, 2018-2032 (USD THOUSAND)
TABLE 1086 NEW ZEALAND BEVERAGE INDUSTRY IN NUTS MARKET, BY TYPE, 2018-2032 (USD THOUSAND)
TABLE 1087 NEW ZEALAND CULINARY IN NUTS MARKET, BY TYPE, 2018-2032 (USD THOUSAND)
TABLE 1088 NEW ZEALAND PERSONAL CARE PRODUCTS IN NUTS MARKET, BY TYPE, 2018-2032 (USD THOUSAND)
TABLE 1089 NEW ZEALAND BIO-BASED & AGRO-INDUSTRIAL USES IN NUTS MARKET, BY TYPE, 2018-2032 (USD THOUSAND)
TABLE 1090 NEW ZEALAND ANIMAL FEED IN NUTS MARKET, BY TYPE, 2018-2032 (USD THOUSAND)
TABLE 1091 NEW ZEALAND NUTS MARKET, BY DISTRIBUTION CHANNEL, 2018-2032 (USD THOUSAND)
TABLE 1092 NEW ZEALAND B2C IN NUTS MARKET, BY TYPE, 2018-2032 (USD THOUSAND)
TABLE 1093 NEW ZEALAND OFFLINE IN NUTS MARKET, BY TYPE, 2018-2032 (USD THOUSAND)
TABLE 1094 NEW ZEALAND ONLINE IN NUTS MARKET, BY TYPE, 2018-2032 (USD THOUSAND)
TABLE 1095 TAIWAN NUTS MARKET, BY PRODUCT TYPE, 2018-2032 (USD THOUSAND)
TABLE 1096 TAIWAN NUTS MARKET, BY PRODUCT TYPE, 2018-2032 (THOUSAND TONS)
TABLE 1097 TAIWAN TREE NUTS IN NUTS MARKET, BY TYPE, 2018-2032 (USD THOUSAND)
TABLE 1098 TAIWAN GROUND NUTS IN NUTS MARKET, BY PEANUTS, 2018-2032 (USD THOUSAND)
TABLE 1099 TAIWAN HYBRID/OTHER NUTS IN NUTS MARKET, BY TYPE, 2018-2032 (USD THOUSAND)
TABLE 1100 TAIWAN NUTS MARKET, BY FORM, 2018-2032 (USD THOUSAND)
TABLE 1101 TAIWAN NUTS MARKET, BY NATURE, 2018-2032 (USD THOUSAND)
TABLE 1102 TAIWAN NUTS MARKET, BY PROCESSING METHOD, 2018-2032 (USD THOUSAND)
TABLE 1103 TAIWAN ROASTED IN NUTS MARKET, BY TYPE, 2018-2032 (USD THOUSAND)
TABLE 1104 TAIWAN FLAVORED IN NUTS MARKET, BY TYPE, 2018-2032 (USD THOUSAND)
TABLE 1105 TAIWAN NUTS MARKET, BY GRADE, 2018-2032 (USD THOUSAND)
TABLE 1106 TAIWAN NUTS MARKET, BY SHELF LIFE, 2018-2032 (USD THOUSAND)
TABLE 1107 TAIWAN NUTS MARKET, BY CERTIFICATION, 2018-2032 (USD THOUSAND)
TABLE 1108 TAIWAN NUTS MARKET, BY PACKAGING, 2018-2032 (USD THOUSAND)
TABLE 1109 TAIWAN PLASTIC POUCHES IN NUTS MARKET, BY TYPE, 2018-2032 (USD THOUSAND)
TABLE 1110 TAIWAN NUTS MARKET, BY PACKAGING SIZE, 2018-2032 (USD THOUSAND)
TABLE 1111 TAIWAN NUTS MARKET, BY PRICE RANGE, 2018-2032 (USD THOUSAND)
TABLE 1112 TAIWAN NUTS MARKET, BY END-USE, 2018-2032 (USD THOUSAND)
TABLE 1113 TAIWAN FUNCTIONAL NUTRITION IN NUTS MARKET, BY TYPE, 2018-2032 (USD THOUSAND)
TABLE 1114 TAIWAN BEVERAGE INDUSTRY IN NUTS MARKET, BY TYPE, 2018-2032 (USD THOUSAND)
TABLE 1115 TAIWAN CULINARY IN NUTS MARKET, BY TYPE, 2018-2032 (USD THOUSAND)
TABLE 1116 TAIWAN PERSONAL CARE PRODUCTS IN NUTS MARKET, BY TYPE, 2018-2032 (USD THOUSAND)
TABLE 1117 TAIWAN BIO-BASED & AGRO-INDUSTRIAL USES IN NUTS MARKET, BY TYPE, 2018-2032 (USD THOUSAND)
TABLE 1118 TAIWAN ANIMAL FEED IN NUTS MARKET, BY TYPE, 2018-2032 (USD THOUSAND)
TABLE 1119 TAIWAN NUTS MARKET, BY DISTRIBUTION CHANNEL, 2018-2032 (USD THOUSAND)
TABLE 1120 TAIWAN B2C IN NUTS MARKET, BY TYPE, 2018-2032 (USD THOUSAND)
TABLE 1121 TAIWAN OFFLINE IN NUTS MARKET, BY TYPE, 2018-2032 (USD THOUSAND)
TABLE 1122 TAIWAN ONLINE IN NUTS MARKET, BY TYPE, 2018-2032 (USD THOUSAND)
TABLE 1123 REST OF ASIA-PACIFIC NUTS MARKET, BY PRODUCT TYPE, 2018-2032 (USD THOUSAND)
TABLE 1124 REST OF ASIA-PACIFIC NUTS MARKET, BY PRODUCT TYPE, 2018-2032 (THOUSAND TONS)
TABLE 1125 MIDDLE EAST AND AFRICA NUTS MARKET, BY COUNTRY, 2018-2032 (USD THOUSAND)
TABLE 1126 MIDDLE EAST AND AFRICA NUTS MARKET, BY PRODUCT TYPE, 2018-2032 (USD THOUSAND)
TABLE 1127 MIDDLE EAST AND AFRICA NUTS MARKET, BY PRODUCT TYPE, 2018-2032 (THOUSAND TONS)
TABLE 1128 MIDDLE EAST AND AFRICA TREE NUTS IN NUTS MARKET, BY TYPE, 2018-2032 (USD THOUSAND)
TABLE 1129 MIDDLE EAST AND AFRICA GROUND NUTS IN NUTS MARKET, BY PEANUTS, 2018-2032 (USD THOUSAND)
TABLE 1130 MIDDLE EAST AND AFRICA HYBRID/OTHER NUTS IN NUTS MARKET, BY TYPE, 2018-2032 (USD THOUSAND)
TABLE 1131 MIDDLE EAST AND AFRICA NUTS MARKET, BY FORM, 2018-2032 (USD THOUSAND)
TABLE 1132 MIDDLE EAST AND AFRICA NUTS MARKET, BY NATURE, 2018-2032 (USD THOUSAND)
TABLE 1133 MIDDLE EAST AND AFRICA NUTS MARKET, BY PROCESSING METHOD, 2018-2032 (USD THOUSAND)
TABLE 1134 MIDDLE EAST AND AFRICA ROASTED IN NUTS MARKET, BY TYPE, 2018-2032 (USD THOUSAND)
TABLE 1135 MIDDLE EAST AND AFRICA FLAVORED IN NUTS MARKET, BY TYPE, 2018-2032 (USD THOUSAND)
TABLE 1136 MIDDLE EAST AND AFRICA NUTS MARKET, BY GRADE, 2018-2032 (USD THOUSAND)
TABLE 1137 MIDDLE EAST AND AFRICA NUTS MARKET, BY SHELF LIFE, 2018-2032 (USD THOUSAND)
TABLE 1138 MIDDLE EAST AND AFRICA NUTS MARKET, BY CERTIFICATION, 2018-2032 (USD THOUSAND)
TABLE 1139 MIDDLE EAST AND AFRICA NUTS MARKET, BY PACKAGING, 2018-2032 (USD THOUSAND)
TABLE 1140 MIDDLE EAST AND AFRICA PLASTIC POUCHES IN NUTS MARKET, BY TYPE, 2018-2032 (USD THOUSAND)
TABLE 1141 MIDDLE EAST AND AFRICA NUTS MARKET, BY PACKAGING SIZE, 2018-2032 (USD THOUSAND)
TABLE 1142 MIDDLE EAST AND AFRICA NUTS MARKET, BY PRICE RANGE, 2018-2032 (USD THOUSAND)
TABLE 1143 MIDDLE EAST AND AFRICA NUTS MARKET, BY END-USE, 2018-2032 (USD THOUSAND)
TABLE 1144 MIDDLE EAST AND AFRICA FUNCTIONAL NUTRITION IN NUTS MARKET, BY TYPE, 2018-2032 (USD THOUSAND)
TABLE 1145 MIDDLE EAST AND AFRICA BEVERAGE INDUSTRY IN NUTS MARKET, BY TYPE, 2018-2032 (USD THOUSAND)
TABLE 1146 MIDDLE EAST AND AFRICA CULINARY IN NUTS MARKET, BY TYPE, 2018-2032 (USD THOUSAND)
TABLE 1147 MIDDLE EAST AND AFRICA PERSONAL CARE PRODUCTS IN NUTS MARKET, BY TYPE, 2018-2032 (USD THOUSAND)
TABLE 1148 MIDDLE EAST AND AFRICA BIO-BASED & AGRO-INDUSTRIAL USES IN NUTS MARKET, BY TYPE, 2018-2032 (USD THOUSAND)
TABLE 1149 MIDDLE EAST AND AFRICA ANIMAL FEED IN NUTS MARKET, BY TYPE, 2018-2032 (USD THOUSAND)
TABLE 1150 MIDDLE EAST AND AFRICA NUTS MARKET, BY DISTRIBUTION CHANNEL, 2018-2032 (USD THOUSAND)
TABLE 1151 MIDDLE EAST AND AFRICA B2C IN NUTS MARKET, BY TYPE, 2018-2032 (USD THOUSAND)
TABLE 1152 MIDDLE EAST AND AFRICA OFFLINE IN NUTS MARKET, BY TYPE, 2018-2032 (USD THOUSAND)
TABLE 1153 MIDDLE EAST AND AFRICA ONLINE IN NUTS MARKET, BY TYPE, 2018-2032 (USD THOUSAND)
TABLE 1154 U.A.E. NUTS MARKET, BY PRODUCT TYPE, 2018-2032 (USD THOUSAND)
TABLE 1155 U.A.E. NUTS MARKET, BY PRODUCT TYPE, 2018-2032 (THOUSAND TONS)
TABLE 1156 U.A.E. TREE NUTS IN NUTS MARKET, BY TYPE, 2018-2032 (USD THOUSAND)
TABLE 1157 U.A.E. GROUND NUTS IN NUTS MARKET, BY PEANUTS, 2018-2032 (USD THOUSAND)
TABLE 1158 U.A.E. HYBRID/OTHER NUTS IN NUTS MARKET, BY TYPE, 2018-2032 (USD THOUSAND)
TABLE 1159 U.A.E. NUTS MARKET, BY FORM, 2018-2032 (USD THOUSAND)
TABLE 1160 U.A.E. NUTS MARKET, BY NATURE, 2018-2032 (USD THOUSAND)
TABLE 1161 U.A.E. NUTS MARKET, BY PROCESSING METHOD, 2018-2032 (USD THOUSAND)
TABLE 1162 U.A.E. ROASTED IN NUTS MARKET, BY TYPE, 2018-2032 (USD THOUSAND)
TABLE 1163 U.A.E. FLAVORED IN NUTS MARKET, BY TYPE, 2018-2032 (USD THOUSAND)
TABLE 1164 U.A.E. NUTS MARKET, BY GRADE, 2018-2032 (USD THOUSAND)
TABLE 1165 U.A.E. NUTS MARKET, BY SHELF LIFE, 2018-2032 (USD THOUSAND)
TABLE 1166 U.A.E. NUTS MARKET, BY CERTIFICATION, 2018-2032 (USD THOUSAND)
TABLE 1167 U.A.E. NUTS MARKET, BY PACKAGING, 2018-2032 (USD THOUSAND)
TABLE 1168 U.A.E. PLASTIC POUCHES IN NUTS MARKET, BY TYPE, 2018-2032 (USD THOUSAND)
TABLE 1169 U.A.E. NUTS MARKET, BY PACKAGING SIZE, 2018-2032 (USD THOUSAND)
TABLE 1170 U.A.E. NUTS MARKET, BY PRICE RANGE, 2018-2032 (USD THOUSAND)
TABLE 1171 U.A.E. NUTS MARKET, BY END-USE, 2018-2032 (USD THOUSAND)
TABLE 1172 U.A.E. FUNCTIONAL NUTRITION IN NUTS MARKET, BY TYPE, 2018-2032 (USD THOUSAND)
TABLE 1173 U.A.E. BEVERAGE INDUSTRY IN NUTS MARKET, BY TYPE, 2018-2032 (USD THOUSAND)
TABLE 1174 U.A.E. CULINARY IN NUTS MARKET, BY TYPE, 2018-2032 (USD THOUSAND)
TABLE 1175 U.A.E. PERSONAL CARE PRODUCTS IN NUTS MARKET, BY TYPE, 2018-2032 (USD THOUSAND)
TABLE 1176 U.A.E. BIO-BASED & AGRO-INDUSTRIAL USES IN NUTS MARKET, BY TYPE, 2018-2032 (USD THOUSAND)
TABLE 1177 U.A.E. ANIMAL FEED IN NUTS MARKET, BY TYPE, 2018-2032 (USD THOUSAND)
TABLE 1178 U.A.E. NUTS MARKET, BY DISTRIBUTION CHANNEL, 2018-2032 (USD THOUSAND)
TABLE 1179 U.A.E. B2C IN NUTS MARKET, BY TYPE, 2018-2032 (USD THOUSAND)
TABLE 1180 U.A.E. OFFLINE IN NUTS MARKET, BY TYPE, 2018-2032 (USD THOUSAND)
TABLE 1181 U.A.E. ONLINE IN NUTS MARKET, BY TYPE, 2018-2032 (USD THOUSAND)
TABLE 1182 SAUDI ARABIA NUTS MARKET, BY PRODUCT TYPE, 2018-2032 (USD THOUSAND)
TABLE 1183 SAUDI ARABIA NUTS MARKET, BY PRODUCT TYPE, 2018-2032 (THOUSAND TONS)
TABLE 1184 SAUDI ARABIA TREE NUTS IN NUTS MARKET, BY TYPE, 2018-2032 (USD THOUSAND)
TABLE 1185 SAUDI ARABIA GROUND NUTS IN NUTS MARKET, BY PEANUTS, 2018-2032 (USD THOUSAND)
TABLE 1186 SAUDI ARABIA HYBRID/OTHER NUTS IN NUTS MARKET, BY TYPE, 2018-2032 (USD THOUSAND)
TABLE 1187 SAUDI ARABIA NUTS MARKET, BY FORM, 2018-2032 (USD THOUSAND)
TABLE 1188 SAUDI ARABIA NUTS MARKET, BY NATURE, 2018-2032 (USD THOUSAND)
TABLE 1189 SAUDI ARABIA NUTS MARKET, BY PROCESSING METHOD, 2018-2032 (USD THOUSAND)
TABLE 1190 SAUDI ARABIA ROASTED IN NUTS MARKET, BY TYPE, 2018-2032 (USD THOUSAND)
TABLE 1191 SAUDI ARABIA FLAVORED IN NUTS MARKET, BY TYPE, 2018-2032 (USD THOUSAND)
TABLE 1192 SAUDI ARABIA NUTS MARKET, BY GRADE, 2018-2032 (USD THOUSAND)
TABLE 1193 SAUDI ARABIA NUTS MARKET, BY SHELF LIFE, 2018-2032 (USD THOUSAND)
TABLE 1194 SAUDI ARABIA NUTS MARKET, BY CERTIFICATION, 2018-2032 (USD THOUSAND)
TABLE 1195 SAUDI ARABIA NUTS MARKET, BY PACKAGING, 2018-2032 (USD THOUSAND)
TABLE 1196 SAUDI ARABIA PLASTIC POUCHES IN NUTS MARKET, BY TYPE, 2018-2032 (USD THOUSAND)
TABLE 1197 SAUDI ARABIA NUTS MARKET, BY PACKAGING SIZE, 2018-2032 (USD THOUSAND)
TABLE 1198 SAUDI ARABIA NUTS MARKET, BY PRICE RANGE, 2018-2032 (USD THOUSAND)
TABLE 1199 SAUDI ARABIA NUTS MARKET, BY END-USE, 2018-2032 (USD THOUSAND)
TABLE 1200 SAUDI ARABIA FUNCTIONAL NUTRITION IN NUTS MARKET, BY TYPE, 2018-2032 (USD THOUSAND)
TABLE 1201 SAUDI ARABIA BEVERAGE INDUSTRY IN NUTS MARKET, BY TYPE, 2018-2032 (USD THOUSAND)
TABLE 1202 SAUDI ARABIA CULINARY IN NUTS MARKET, BY TYPE, 2018-2032 (USD THOUSAND)
TABLE 1203 SAUDI ARABIA PERSONAL CARE PRODUCTS IN NUTS MARKET, BY TYPE, 2018-2032 (USD THOUSAND)
TABLE 1204 SAUDI ARABIA BIO-BASED & AGRO-INDUSTRIAL USES IN NUTS MARKET, BY TYPE, 2018-2032 (USD THOUSAND)
TABLE 1205 SAUDI ARABIA ANIMAL FEED IN NUTS MARKET, BY TYPE, 2018-2032 (USD THOUSAND)
TABLE 1206 SAUDI ARABIA NUTS MARKET, BY DISTRIBUTION CHANNEL, 2018-2032 (USD THOUSAND)
TABLE 1207 SAUDI ARABIA B2C IN NUTS MARKET, BY TYPE, 2018-2032 (USD THOUSAND)
TABLE 1208 SAUDI ARABIA OFFLINE IN NUTS MARKET, BY TYPE, 2018-2032 (USD THOUSAND)
TABLE 1209 SAUDI ARABIA ONLINE IN NUTS MARKET, BY TYPE, 2018-2032 (USD THOUSAND)
TABLE 1210 EGYPT NUTS MARKET, BY PRODUCT TYPE, 2018-2032 (USD THOUSAND)
TABLE 1211 EGYPT NUTS MARKET, BY PRODUCT TYPE, 2018-2032 (THOUSAND TONS)
TABLE 1212 EGYPT TREE NUTS IN NUTS MARKET, BY TYPE, 2018-2032 (USD THOUSAND)
TABLE 1213 EGYPT GROUND NUTS IN NUTS MARKET, BY PEANUTS, 2018-2032 (USD THOUSAND)
TABLE 1214 EGYPT HYBRID/OTHER NUTS IN NUTS MARKET, BY TYPE, 2018-2032 (USD THOUSAND)
TABLE 1215 EGYPT NUTS MARKET, BY FORM, 2018-2032 (USD THOUSAND)
TABLE 1216 EGYPT NUTS MARKET, BY NATURE, 2018-2032 (USD THOUSAND)
TABLE 1217 EGYPT NUTS MARKET, BY PROCESSING METHOD, 2018-2032 (USD THOUSAND)
TABLE 1218 EGYPT ROASTED IN NUTS MARKET, BY TYPE, 2018-2032 (USD THOUSAND)
TABLE 1219 EGYPT FLAVORED IN NUTS MARKET, BY TYPE, 2018-2032 (USD THOUSAND)
TABLE 1220 EGYPT NUTS MARKET, BY GRADE, 2018-2032 (USD THOUSAND)
TABLE 1221 EGYPT NUTS MARKET, BY SHELF LIFE, 2018-2032 (USD THOUSAND)
TABLE 1222 EGYPT NUTS MARKET, BY CERTIFICATION, 2018-2032 (USD THOUSAND)
TABLE 1223 EGYPT NUTS MARKET, BY PACKAGING, 2018-2032 (USD THOUSAND)
TABLE 1224 EGYPT PLASTIC POUCHES IN NUTS MARKET, BY TYPE, 2018-2032 (USD THOUSAND)
TABLE 1225 EGYPT NUTS MARKET, BY PACKAGING SIZE, 2018-2032 (USD THOUSAND)
TABLE 1226 EGYPT NUTS MARKET, BY PRICE RANGE, 2018-2032 (USD THOUSAND)
TABLE 1227 EGYPT NUTS MARKET, BY END-USE, 2018-2032 (USD THOUSAND)
TABLE 1228 EGYPT FUNCTIONAL NUTRITION IN NUTS MARKET, BY TYPE, 2018-2032 (USD THOUSAND)
TABLE 1229 EGYPT BEVERAGE INDUSTRY IN NUTS MARKET, BY TYPE, 2018-2032 (USD THOUSAND)
TABLE 1230 EGYPT CULINARY IN NUTS MARKET, BY TYPE, 2018-2032 (USD THOUSAND)
TABLE 1231 EGYPT PERSONAL CARE PRODUCTS IN NUTS MARKET, BY TYPE, 2018-2032 (USD THOUSAND)
TABLE 1232 EGYPT BIO-BASED & AGRO-INDUSTRIAL USES IN NUTS MARKET, BY TYPE, 2018-2032 (USD THOUSAND)
TABLE 1233 EGYPT ANIMAL FEED IN NUTS MARKET, BY TYPE, 2018-2032 (USD THOUSAND)
TABLE 1234 EGYPT NUTS MARKET, BY DISTRIBUTION CHANNEL, 2018-2032 (USD THOUSAND)
TABLE 1235 EGYPT B2C IN NUTS MARKET, BY TYPE, 2018-2032 (USD THOUSAND)
TABLE 1236 EGYPT OFFLINE IN NUTS MARKET, BY TYPE, 2018-2032 (USD THOUSAND)
TABLE 1237 EGYPT ONLINE IN NUTS MARKET, BY TYPE, 2018-2032 (USD THOUSAND)
TABLE 1238 SOUTH AFRICA NUTS MARKET, BY PRODUCT TYPE, 2018-2032 (USD THOUSAND)
TABLE 1239 SOUTH AFRICA NUTS MARKET, BY PRODUCT TYPE, 2018-2032 (THOUSAND TONS)
TABLE 1240 SOUTH AFRICA TREE NUTS IN NUTS MARKET, BY TYPE, 2018-2032 (USD THOUSAND)
TABLE 1241 SOUTH AFRICA GROUND NUTS IN NUTS MARKET, BY PEANUTS, 2018-2032 (USD THOUSAND)
TABLE 1242 SOUTH AFRICA HYBRID/OTHER NUTS IN NUTS MARKET, BY TYPE, 2018-2032 (USD THOUSAND)
TABLE 1243 SOUTH AFRICA NUTS MARKET, BY FORM, 2018-2032 (USD THOUSAND)
TABLE 1244 SOUTH AFRICA NUTS MARKET, BY NATURE, 2018-2032 (USD THOUSAND)
TABLE 1245 SOUTH AFRICA NUTS MARKET, BY PROCESSING METHOD, 2018-2032 (USD THOUSAND)
TABLE 1246 SOUTH AFRICA ROASTED IN NUTS MARKET, BY TYPE, 2018-2032 (USD THOUSAND)
TABLE 1247 SOUTH AFRICA FLAVORED IN NUTS MARKET, BY TYPE, 2018-2032 (USD THOUSAND)
TABLE 1248 SOUTH AFRICA NUTS MARKET, BY GRADE, 2018-2032 (USD THOUSAND)
TABLE 1249 SOUTH AFRICA NUTS MARKET, BY SHELF LIFE, 2018-2032 (USD THOUSAND)
TABLE 1250 SOUTH AFRICA NUTS MARKET, BY CERTIFICATION, 2018-2032 (USD THOUSAND)
TABLE 1251 SOUTH AFRICA NUTS MARKET, BY PACKAGING, 2018-2032 (USD THOUSAND)
TABLE 1252 SOUTH AFRICA PLASTIC POUCHES IN NUTS MARKET, BY TYPE, 2018-2032 (USD THOUSAND)
TABLE 1253 SOUTH AFRICA NUTS MARKET, BY PACKAGING SIZE, 2018-2032 (USD THOUSAND)
TABLE 1254 SOUTH AFRICA NUTS MARKET, BY PRICE RANGE, 2018-2032 (USD THOUSAND)
TABLE 1255 SOUTH AFRICA NUTS MARKET, BY END-USE, 2018-2032 (USD THOUSAND)
TABLE 1256 SOUTH AFRICA FUNCTIONAL NUTRITION IN NUTS MARKET, BY TYPE, 2018-2032 (USD THOUSAND)
TABLE 1257 SOUTH AFRICA BEVERAGE INDUSTRY IN NUTS MARKET, BY TYPE, 2018-2032 (USD THOUSAND)
TABLE 1258 SOUTH AFRICA CULINARY IN NUTS MARKET, BY TYPE, 2018-2032 (USD THOUSAND)
TABLE 1259 SOUTH AFRICA PERSONAL CARE PRODUCTS IN NUTS MARKET, BY TYPE, 2018-2032 (USD THOUSAND)
TABLE 1260 SOUTH AFRICA BIO-BASED & AGRO-INDUSTRIAL USES IN NUTS MARKET, BY TYPE, 2018-2032 (USD THOUSAND)
TABLE 1261 SOUTH AFRICA ANIMAL FEED IN NUTS MARKET, BY TYPE, 2018-2032 (USD THOUSAND)
TABLE 1262 SOUTH AFRICA NUTS MARKET, BY DISTRIBUTION CHANNEL, 2018-2032 (USD THOUSAND)
TABLE 1263 SOUTH AFRICA B2C IN NUTS MARKET, BY TYPE, 2018-2032 (USD THOUSAND)
TABLE 1264 SOUTH AFRICA OFFLINE IN NUTS MARKET, BY TYPE, 2018-2032 (USD THOUSAND)
TABLE 1265 SOUTH AFRICA ONLINE IN NUTS MARKET, BY TYPE, 2018-2032 (USD THOUSAND)
TABLE 1266 ISRAEL NUTS MARKET, BY PRODUCT TYPE, 2018-2032 (USD THOUSAND)
TABLE 1267 ISRAEL NUTS MARKET, BY PRODUCT TYPE, 2018-2032 (THOUSAND TONS)
TABLE 1268 ISRAEL TREE NUTS IN NUTS MARKET, BY TYPE, 2018-2032 (USD THOUSAND)
TABLE 1269 ISRAEL GROUND NUTS IN NUTS MARKET, BY PEANUTS, 2018-2032 (USD THOUSAND)
TABLE 1270 ISRAEL HYBRID/OTHER NUTS IN NUTS MARKET, BY TYPE, 2018-2032 (USD THOUSAND)
TABLE 1271 ISRAEL NUTS MARKET, BY FORM, 2018-2032 (USD THOUSAND)
TABLE 1272 ISRAEL NUTS MARKET, BY NATURE, 2018-2032 (USD THOUSAND)
TABLE 1273 ISRAEL NUTS MARKET, BY PROCESSING METHOD, 2018-2032 (USD THOUSAND)
TABLE 1274 ISRAEL ROASTED IN NUTS MARKET, BY TYPE, 2018-2032 (USD THOUSAND)
TABLE 1275 ISRAEL FLAVORED IN NUTS MARKET, BY TYPE, 2018-2032 (USD THOUSAND)
TABLE 1276 ISRAEL NUTS MARKET, BY GRADE, 2018-2032 (USD THOUSAND)
TABLE 1277 ISRAEL NUTS MARKET, BY SHELF LIFE, 2018-2032 (USD THOUSAND)
TABLE 1278 ISRAEL NUTS MARKET, BY CERTIFICATION, 2018-2032 (USD THOUSAND)
TABLE 1279 ISRAEL NUTS MARKET, BY PACKAGING, 2018-2032 (USD THOUSAND)
TABLE 1280 ISRAEL PLASTIC POUCHES IN NUTS MARKET, BY TYPE, 2018-2032 (USD THOUSAND)
TABLE 1281 ISRAEL NUTS MARKET, BY PACKAGING SIZE, 2018-2032 (USD THOUSAND)
TABLE 1282 ISRAEL NUTS MARKET, BY PRICE RANGE, 2018-2032 (USD THOUSAND)
TABLE 1283 ISRAEL NUTS MARKET, BY END-USE, 2018-2032 (USD THOUSAND)
TABLE 1284 ISRAEL FUNCTIONAL NUTRITION IN NUTS MARKET, BY TYPE, 2018-2032 (USD THOUSAND)
TABLE 1285 ISRAEL BEVERAGE INDUSTRY IN NUTS MARKET, BY TYPE, 2018-2032 (USD THOUSAND)
TABLE 1286 ISRAEL CULINARY IN NUTS MARKET, BY TYPE, 2018-2032 (USD THOUSAND)
TABLE 1287 ISRAEL PERSONAL CARE PRODUCTS IN NUTS MARKET, BY TYPE, 2018-2032 (USD THOUSAND)
TABLE 1288 ISRAEL BIO-BASED & AGRO-INDUSTRIAL USES IN NUTS MARKET, BY TYPE, 2018-2032 (USD THOUSAND)
TABLE 1289 ISRAEL ANIMAL FEED IN NUTS MARKET, BY TYPE, 2018-2032 (USD THOUSAND)
TABLE 1290 ISRAEL NUTS MARKET, BY DISTRIBUTION CHANNEL, 2018-2032 (USD THOUSAND)
TABLE 1291 ISRAEL B2C IN NUTS MARKET, BY TYPE, 2018-2032 (USD THOUSAND)
TABLE 1292 ISRAEL OFFLINE IN NUTS MARKET, BY TYPE, 2018-2032 (USD THOUSAND)
TABLE 1293 ISRAEL ONLINE IN NUTS MARKET, BY TYPE, 2018-2032 (USD THOUSAND)
TABLE 1294 KUWAIT NUTS MARKET, BY PRODUCT TYPE, 2018-2032 (USD THOUSAND)
TABLE 1295 KUWAIT NUTS MARKET, BY PRODUCT TYPE, 2018-2032 (THOUSAND TONS)
TABLE 1296 KUWAIT TREE NUTS IN NUTS MARKET, BY TYPE, 2018-2032 (USD THOUSAND)
TABLE 1297 KUWAIT GROUND NUTS IN NUTS MARKET, BY PEANUTS, 2018-2032 (USD THOUSAND)
TABLE 1298 KUWAIT HYBRID/OTHER NUTS IN NUTS MARKET, BY TYPE, 2018-2032 (USD THOUSAND)
TABLE 1299 KUWAIT NUTS MARKET, BY FORM, 2018-2032 (USD THOUSAND)
TABLE 1300 KUWAIT NUTS MARKET, BY NATURE, 2018-2032 (USD THOUSAND)
TABLE 1301 KUWAIT NUTS MARKET, BY PROCESSING METHOD, 2018-2032 (USD THOUSAND)
TABLE 1302 KUWAIT ROASTED IN NUTS MARKET, BY TYPE, 2018-2032 (USD THOUSAND)
TABLE 1303 KUWAIT FLAVORED IN NUTS MARKET, BY TYPE, 2018-2032 (USD THOUSAND)
TABLE 1304 KUWAIT NUTS MARKET, BY GRADE, 2018-2032 (USD THOUSAND)
TABLE 1305 KUWAIT NUTS MARKET, BY SHELF LIFE, 2018-2032 (USD THOUSAND)
TABLE 1306 KUWAIT NUTS MARKET, BY CERTIFICATION, 2018-2032 (USD THOUSAND)
TABLE 1307 KUWAIT NUTS MARKET, BY PACKAGING, 2018-2032 (USD THOUSAND)
TABLE 1308 KUWAIT PLASTIC POUCHES IN NUTS MARKET, BY TYPE, 2018-2032 (USD THOUSAND)
TABLE 1309 KUWAIT NUTS MARKET, BY PACKAGING SIZE, 2018-2032 (USD THOUSAND)
TABLE 1310 KUWAIT NUTS MARKET, BY PRICE RANGE, 2018-2032 (USD THOUSAND)
TABLE 1311 KUWAIT NUTS MARKET, BY END-USE, 2018-2032 (USD THOUSAND)
TABLE 1312 KUWAIT FUNCTIONAL NUTRITION IN NUTS MARKET, BY TYPE, 2018-2032 (USD THOUSAND)
TABLE 1313 KUWAIT BEVERAGE INDUSTRY IN NUTS MARKET, BY TYPE, 2018-2032 (USD THOUSAND)
TABLE 1314 KUWAIT CULINARY IN NUTS MARKET, BY TYPE, 2018-2032 (USD THOUSAND)
TABLE 1315 KUWAIT PERSONAL CARE PRODUCTS IN NUTS MARKET, BY TYPE, 2018-2032 (USD THOUSAND)
TABLE 1316 KUWAIT BIO-BASED & AGRO-INDUSTRIAL USES IN NUTS MARKET, BY TYPE, 2018-2032 (USD THOUSAND)
TABLE 1317 KUWAIT ANIMAL FEED IN NUTS MARKET, BY TYPE, 2018-2032 (USD THOUSAND)
TABLE 1318 KUWAIT NUTS MARKET, BY DISTRIBUTION CHANNEL, 2018-2032 (USD THOUSAND)
TABLE 1319 KUWAIT B2C IN NUTS MARKET, BY TYPE, 2018-2032 (USD THOUSAND)
TABLE 1320 KUWAIT OFFLINE IN NUTS MARKET, BY TYPE, 2018-2032 (USD THOUSAND)
TABLE 1321 KUWAIT ONLINE IN NUTS MARKET, BY TYPE, 2018-2032 (USD THOUSAND)
TABLE 1322 OMAN NUTS MARKET, BY PRODUCT TYPE, 2018-2032 (USD THOUSAND)
TABLE 1323 OMAN NUTS MARKET, BY PRODUCT TYPE, 2018-2032 (THOUSAND TONS)
TABLE 1324 OMAN TREE NUTS IN NUTS MARKET, BY TYPE, 2018-2032 (USD THOUSAND)
TABLE 1325 OMAN GROUND NUTS IN NUTS MARKET, BY PEANUTS, 2018-2032 (USD THOUSAND)
TABLE 1326 OMAN HYBRID/OTHER NUTS IN NUTS MARKET, BY TYPE, 2018-2032 (USD THOUSAND)
TABLE 1327 OMAN NUTS MARKET, BY FORM, 2018-2032 (USD THOUSAND)
TABLE 1328 OMAN NUTS MARKET, BY NATURE, 2018-2032 (USD THOUSAND)
TABLE 1329 OMAN NUTS MARKET, BY PROCESSING METHOD, 2018-2032 (USD THOUSAND)
TABLE 1330 OMAN ROASTED IN NUTS MARKET, BY TYPE, 2018-2032 (USD THOUSAND)
TABLE 1331 OMAN FLAVORED IN NUTS MARKET, BY TYPE, 2018-2032 (USD THOUSAND)
TABLE 1332 OMAN NUTS MARKET, BY GRADE, 2018-2032 (USD THOUSAND)
TABLE 1333 OMAN NUTS MARKET, BY SHELF LIFE, 2018-2032 (USD THOUSAND)
TABLE 1334 OMAN NUTS MARKET, BY CERTIFICATION, 2018-2032 (USD THOUSAND)
TABLE 1335 OMAN NUTS MARKET, BY PACKAGING, 2018-2032 (USD THOUSAND)
TABLE 1336 OMAN PLASTIC POUCHES IN NUTS MARKET, BY TYPE, 2018-2032 (USD THOUSAND)
TABLE 1337 OMAN NUTS MARKET, BY PACKAGING SIZE, 2018-2032 (USD THOUSAND)
TABLE 1338 OMAN NUTS MARKET, BY PRICE RANGE, 2018-2032 (USD THOUSAND)
TABLE 1339 OMAN NUTS MARKET, BY END-USE, 2018-2032 (USD THOUSAND)
TABLE 1340 OMAN FUNCTIONAL NUTRITION IN NUTS MARKET, BY TYPE, 2018-2032 (USD THOUSAND)
TABLE 1341 OMAN BEVERAGE INDUSTRY IN NUTS MARKET, BY TYPE, 2018-2032 (USD THOUSAND)
TABLE 1342 OMAN CULINARY IN NUTS MARKET, BY TYPE, 2018-2032 (USD THOUSAND)
TABLE 1343 OMAN PERSONAL CARE PRODUCTS IN NUTS MARKET, BY TYPE, 2018-2032 (USD THOUSAND)
TABLE 1344 OMAN BIO-BASED & AGRO-INDUSTRIAL USES IN NUTS MARKET, BY TYPE, 2018-2032 (USD THOUSAND)
TABLE 1345 OMAN ANIMAL FEED IN NUTS MARKET, BY TYPE, 2018-2032 (USD THOUSAND)
TABLE 1346 OMAN NUTS MARKET, BY DISTRIBUTION CHANNEL, 2018-2032 (USD THOUSAND)
TABLE 1347 OMAN B2C IN NUTS MARKET, BY TYPE, 2018-2032 (USD THOUSAND)
TABLE 1348 OMAN OFFLINE IN NUTS MARKET, BY TYPE, 2018-2032 (USD THOUSAND)
TABLE 1349 OMAN ONLINE IN NUTS MARKET, BY TYPE, 2018-2032 (USD THOUSAND)
TABLE 1350 BAHRAIN NUTS MARKET, BY PRODUCT TYPE, 2018-2032 (USD THOUSAND)
TABLE 1351 BAHRAIN NUTS MARKET, BY PRODUCT TYPE, 2018-2032 (THOUSAND TONS)
TABLE 1352 BAHRAIN TREE NUTS IN NUTS MARKET, BY TYPE, 2018-2032 (USD THOUSAND)
TABLE 1353 BAHRAIN GROUND NUTS IN NUTS MARKET, BY PEANUTS, 2018-2032 (USD THOUSAND)
TABLE 1354 BAHRAIN HYBRID/OTHER NUTS IN NUTS MARKET, BY TYPE, 2018-2032 (USD THOUSAND)
TABLE 1355 BAHRAIN NUTS MARKET, BY FORM, 2018-2032 (USD THOUSAND)
TABLE 1356 BAHRAIN NUTS MARKET, BY NATURE, 2018-2032 (USD THOUSAND)
TABLE 1357 BAHRAIN NUTS MARKET, BY PROCESSING METHOD, 2018-2032 (USD THOUSAND)
TABLE 1358 BAHRAIN ROASTED IN NUTS MARKET, BY TYPE, 2018-2032 (USD THOUSAND)
TABLE 1359 BAHRAIN FLAVORED IN NUTS MARKET, BY TYPE, 2018-2032 (USD THOUSAND)
TABLE 1360 BAHRAIN NUTS MARKET, BY GRADE, 2018-2032 (USD THOUSAND)
TABLE 1361 BAHRAIN NUTS MARKET, BY SHELF LIFE, 2018-2032 (USD THOUSAND)
TABLE 1362 BAHRAIN NUTS MARKET, BY CERTIFICATION, 2018-2032 (USD THOUSAND)
TABLE 1363 BAHRAIN NUTS MARKET, BY PACKAGING, 2018-2032 (USD THOUSAND)
TABLE 1364 BAHRAIN PLASTIC POUCHES IN NUTS MARKET, BY TYPE, 2018-2032 (USD THOUSAND)
TABLE 1365 BAHRAIN NUTS MARKET, BY PACKAGING SIZE, 2018-2032 (USD THOUSAND)
TABLE 1366 BAHRAIN NUTS MARKET, BY PRICE RANGE, 2018-2032 (USD THOUSAND)
TABLE 1367 BAHRAIN NUTS MARKET, BY END-USE, 2018-2032 (USD THOUSAND)
TABLE 1368 BAHRAIN FUNCTIONAL NUTRITION IN NUTS MARKET, BY TYPE, 2018-2032 (USD THOUSAND)
TABLE 1369 BAHRAIN BEVERAGE INDUSTRY IN NUTS MARKET, BY TYPE, 2018-2032 (USD THOUSAND)
TABLE 1370 BAHRAIN CULINARY IN NUTS MARKET, BY TYPE, 2018-2032 (USD THOUSAND)
TABLE 1371 BAHRAIN PERSONAL CARE PRODUCTS IN NUTS MARKET, BY TYPE, 2018-2032 (USD THOUSAND)
TABLE 1372 BAHRAIN BIO-BASED & AGRO-INDUSTRIAL USES IN NUTS MARKET, BY TYPE, 2018-2032 (USD THOUSAND)
TABLE 1373 BAHRAIN ANIMAL FEED IN NUTS MARKET, BY TYPE, 2018-2032 (USD THOUSAND)
TABLE 1374 BAHRAIN NUTS MARKET, BY DISTRIBUTION CHANNEL, 2018-2032 (USD THOUSAND)
TABLE 1375 BAHRAIN B2C IN NUTS MARKET, BY TYPE, 2018-2032 (USD THOUSAND)
TABLE 1376 BAHRAIN OFFLINE IN NUTS MARKET, BY TYPE, 2018-2032 (USD THOUSAND)
TABLE 1377 BAHRAIN ONLINE IN NUTS MARKET, BY TYPE, 2018-2032 (USD THOUSAND)
TABLE 1378 QATAR NUTS MARKET, BY PRODUCT TYPE, 2018-2032 (USD THOUSAND)
TABLE 1379 QATAR NUTS MARKET, BY PRODUCT TYPE, 2018-2032 (THOUSAND TONS)
TABLE 1380 QATAR TREE NUTS IN NUTS MARKET, BY TYPE, 2018-2032 (USD THOUSAND)
TABLE 1381 QATAR GROUND NUTS IN NUTS MARKET, BY PEANUTS, 2018-2032 (USD THOUSAND)
TABLE 1382 QATAR HYBRID/OTHER NUTS IN NUTS MARKET, BY TYPE, 2018-2032 (USD THOUSAND)
TABLE 1383 QATAR NUTS MARKET, BY FORM, 2018-2032 (USD THOUSAND)
TABLE 1384 QATAR NUTS MARKET, BY NATURE, 2018-2032 (USD THOUSAND)
TABLE 1385 QATAR NUTS MARKET, BY PROCESSING METHOD, 2018-2032 (USD THOUSAND)
TABLE 1386 QATAR ROASTED IN NUTS MARKET, BY TYPE, 2018-2032 (USD THOUSAND)
TABLE 1387 QATAR FLAVORED IN NUTS MARKET, BY TYPE, 2018-2032 (USD THOUSAND)
TABLE 1388 QATAR NUTS MARKET, BY GRADE, 2018-2032 (USD THOUSAND)
TABLE 1389 QATAR NUTS MARKET, BY SHELF LIFE, 2018-2032 (USD THOUSAND)
TABLE 1390 QATAR NUTS MARKET, BY CERTIFICATION, 2018-2032 (USD THOUSAND)
TABLE 1391 QATAR NUTS MARKET, BY PACKAGING, 2018-2032 (USD THOUSAND)
TABLE 1392 QATAR PLASTIC POUCHES IN NUTS MARKET, BY TYPE, 2018-2032 (USD THOUSAND)
TABLE 1393 QATAR NUTS MARKET, BY PACKAGING SIZE, 2018-2032 (USD THOUSAND)
TABLE 1394 QATAR NUTS MARKET, BY PRICE RANGE, 2018-2032 (USD THOUSAND)
TABLE 1395 QATAR NUTS MARKET, BY END-USE, 2018-2032 (USD THOUSAND)
TABLE 1396 QATAR FUNCTIONAL NUTRITION IN NUTS MARKET, BY TYPE, 2018-2032 (USD THOUSAND)
TABLE 1397 QATAR BEVERAGE INDUSTRY IN NUTS MARKET, BY TYPE, 2018-2032 (USD THOUSAND)
TABLE 1398 QATAR CULINARY IN NUTS MARKET, BY TYPE, 2018-2032 (USD THOUSAND)
TABLE 1399 QATAR PERSONAL CARE PRODUCTS IN NUTS MARKET, BY TYPE, 2018-2032 (USD THOUSAND)
TABLE 1400 QATAR BIO-BASED & AGRO-INDUSTRIAL USES IN NUTS MARKET, BY TYPE, 2018-2032 (USD THOUSAND)
TABLE 1401 QATAR ANIMAL FEED IN NUTS MARKET, BY TYPE, 2018-2032 (USD THOUSAND)
TABLE 1402 QATAR NUTS MARKET, BY DISTRIBUTION CHANNEL, 2018-2032 (USD THOUSAND)
TABLE 1403 QATAR B2C IN NUTS MARKET, BY TYPE, 2018-2032 (USD THOUSAND)
TABLE 1404 QATAR OFFLINE IN NUTS MARKET, BY TYPE, 2018-2032 (USD THOUSAND)
TABLE 1405 QATAR ONLINE IN NUTS MARKET, BY TYPE, 2018-2032 (USD THOUSAND)
TABLE 1406 REST OF MIDDLE EAST AND AFRICA NUTS MARKET, BY PRODUCT TYPE, 2018-2032 (USD THOUSAND)
TABLE 1407 REST OF MIDDLE EAST AND AFRICA NUTS MARKET, BY PRODUCT TYPE, 2018-2032 (THOUSAND TONS)
TABLE 1408 SOUTH AMERICA NUTS MARKET, BY COUNTRY, 2018-2032 (USD THOUSAND)
TABLE 1409 SOUTH AMERICA NUTS MARKET, BY PRODUCT TYPE, 2018-2032 (USD THOUSAND)
TABLE 1410 SOUTH AMERICA NUTS MARKET, BY PRODUCT TYPE, 2018-2032 (THOUSAND TONS)
TABLE 1411 SOUTH AMERICA TREE NUTS IN NUTS MARKET, BY TYPE, 2018-2032 (USD THOUSAND)
TABLE 1412 SOUTH AMERICA GROUND NUTS IN NUTS MARKET, BY PEANUTS, 2018-2032 (USD THOUSAND)
TABLE 1413 SOUTH AMERICA HYBRID/OTHER NUTS IN NUTS MARKET, BY TYPE, 2018-2032 (USD THOUSAND)
TABLE 1414 SOUTH AMERICA NUTS MARKET, BY FORM, 2018-2032 (USD THOUSAND)
TABLE 1415 SOUTH AMERICA NUTS MARKET, BY NATURE, 2018-2032 (USD THOUSAND)
TABLE 1416 SOUTH AMERICA NUTS MARKET, BY PROCESSING METHOD, 2018-2032 (USD THOUSAND)
TABLE 1417 SOUTH AMERICA ROASTED IN NUTS MARKET, BY TYPE, 2018-2032 (USD THOUSAND)
TABLE 1418 SOUTH AMERICA FLAVORED IN NUTS MARKET, BY TYPE, 2018-2032 (USD THOUSAND)
TABLE 1419 SOUTH AMERICA NUTS MARKET, BY GRADE, 2018-2032 (USD THOUSAND)
TABLE 1420 SOUTH AMERICA NUTS MARKET, BY SHELF LIFE, 2018-2032 (USD THOUSAND)
TABLE 1421 SOUTH AMERICA NUTS MARKET, BY CERTIFICATION, 2018-2032 (USD THOUSAND)
TABLE 1422 SOUTH AMERICA NUTS MARKET, BY PACKAGING, 2018-2032 (USD THOUSAND)
TABLE 1423 SOUTH AMERICA PLASTIC POUCHES IN NUTS MARKET, BY TYPE, 2018-2032 (USD THOUSAND)
TABLE 1424 SOUTH AMERICA NUTS MARKET, BY PACKAGING SIZE, 2018-2032 (USD THOUSAND)
TABLE 1425 SOUTH AMERICA NUTS MARKET, BY PRICE RANGE, 2018-2032 (USD THOUSAND)
TABLE 1426 SOUTH AMERICA NUTS MARKET, BY END-USE, 2018-2032 (USD THOUSAND)
TABLE 1427 SOUTH AMERICA FUNCTIONAL NUTRITION IN NUTS MARKET, BY TYPE, 2018-2032 (USD THOUSAND)
TABLE 1428 SOUTH AMERICA BEVERAGE INDUSTRY IN NUTS MARKET, BY TYPE, 2018-2032 (USD THOUSAND)
TABLE 1429 SOUTH AMERICA CULINARY IN NUTS MARKET, BY TYPE, 2018-2032 (USD THOUSAND)
TABLE 1430 SOUTH AMERICA PERSONAL CARE PRODUCTS IN NUTS MARKET, BY TYPE, 2018-2032 (USD THOUSAND)
TABLE 1431 SOUTH AMERICA BIO-BASED & AGRO-INDUSTRIAL USES IN NUTS MARKET, BY TYPE, 2018-2032 (USD THOUSAND)
TABLE 1432 SOUTH AMERICA ANIMAL FEED IN NUTS MARKET, BY TYPE, 2018-2032 (USD THOUSAND)
TABLE 1433 SOUTH AMERICA NUTS MARKET, BY DISTRIBUTION CHANNEL, 2018-2032 (USD THOUSAND)
TABLE 1434 SOUTH AMERICA B2C IN NUTS MARKET, BY TYPE, 2018-2032 (USD THOUSAND)
TABLE 1435 SOUTH AMERICA OFFLINE IN NUTS MARKET, BY TYPE, 2018-2032 (USD THOUSAND)
TABLE 1436 SOUTH AMERICA ONLINE IN NUTS MARKET, BY TYPE, 2018-2032 (USD THOUSAND)
TABLE 1437 BRAZIL NUTS MARKET, BY PRODUCT TYPE, 2018-2032 (USD THOUSAND)
TABLE 1438 BRAZIL NUTS MARKET, BY PRODUCT TYPE, 2018-2032 (THOUSAND TONS)
TABLE 1439 BRAZIL TREE NUTS IN NUTS MARKET, BY TYPE, 2018-2032 (USD THOUSAND)
TABLE 1440 BRAZIL GROUND NUTS IN NUTS MARKET, BY PEANUTS, 2018-2032 (USD THOUSAND)
TABLE 1441 BRAZIL HYBRID/OTHER NUTS IN NUTS MARKET, BY TYPE, 2018-2032 (USD THOUSAND)
TABLE 1442 BRAZIL NUTS MARKET, BY FORM, 2018-2032 (USD THOUSAND)
TABLE 1443 BRAZIL NUTS MARKET, BY NATURE, 2018-2032 (USD THOUSAND)
TABLE 1444 BRAZIL NUTS MARKET, BY PROCESSING METHOD, 2018-2032 (USD THOUSAND)
TABLE 1445 BRAZIL ROASTED IN NUTS MARKET, BY TYPE, 2018-2032 (USD THOUSAND)
TABLE 1446 BRAZIL FLAVORED IN NUTS MARKET, BY TYPE, 2018-2032 (USD THOUSAND)
TABLE 1447 BRAZIL NUTS MARKET, BY GRADE, 2018-2032 (USD THOUSAND)
TABLE 1448 BRAZIL NUTS MARKET, BY SHELF LIFE, 2018-2032 (USD THOUSAND)
TABLE 1449 BRAZIL NUTS MARKET, BY CERTIFICATION, 2018-2032 (USD THOUSAND)
TABLE 1450 BRAZIL NUTS MARKET, BY PACKAGING, 2018-2032 (USD THOUSAND)
TABLE 1451 BRAZIL PLASTIC POUCHES IN NUTS MARKET, BY TYPE, 2018-2032 (USD THOUSAND)
TABLE 1452 BRAZIL NUTS MARKET, BY PACKAGING SIZE, 2018-2032 (USD THOUSAND)
TABLE 1453 BRAZIL NUTS MARKET, BY PRICE RANGE, 2018-2032 (USD THOUSAND)
TABLE 1454 BRAZIL NUTS MARKET, BY END-USE, 2018-2032 (USD THOUSAND)
TABLE 1455 BRAZIL FUNCTIONAL NUTRITION IN NUTS MARKET, BY TYPE, 2018-2032 (USD THOUSAND)
TABLE 1456 BRAZIL BEVERAGE INDUSTRY IN NUTS MARKET, BY TYPE, 2018-2032 (USD THOUSAND)
TABLE 1457 BRAZIL CULINARY IN NUTS MARKET, BY TYPE, 2018-2032 (USD THOUSAND)
TABLE 1458 BRAZIL PERSONAL CARE PRODUCTS IN NUTS MARKET, BY TYPE, 2018-2032 (USD THOUSAND)
TABLE 1459 BRAZIL BIO-BASED & AGRO-INDUSTRIAL USES IN NUTS MARKET, BY TYPE, 2018-2032 (USD THOUSAND)
TABLE 1460 BRAZIL ANIMAL FEED IN NUTS MARKET, BY TYPE, 2018-2032 (USD THOUSAND)
TABLE 1461 BRAZIL NUTS MARKET, BY DISTRIBUTION CHANNEL, 2018-2032 (USD THOUSAND)
TABLE 1462 BRAZIL B2C IN NUTS MARKET, BY TYPE, 2018-2032 (USD THOUSAND)
TABLE 1463 BRAZIL OFFLINE IN NUTS MARKET, BY TYPE, 2018-2032 (USD THOUSAND)
TABLE 1464 BRAZIL ONLINE IN NUTS MARKET, BY TYPE, 2018-2032 (USD THOUSAND)
TABLE 1465 CHILE NUTS MARKET, BY PRODUCT TYPE, 2018-2032 (USD THOUSAND)
TABLE 1466 CHILE NUTS MARKET, BY PRODUCT TYPE, 2018-2032 (THOUSAND TONS)
TABLE 1467 CHILE TREE NUTS IN NUTS MARKET, BY TYPE, 2018-2032 (USD THOUSAND)
TABLE 1468 CHILE GROUND NUTS IN NUTS MARKET, BY PEANUTS, 2018-2032 (USD THOUSAND)
TABLE 1469 CHILE HYBRID/OTHER NUTS IN NUTS MARKET, BY TYPE, 2018-2032 (USD THOUSAND)
TABLE 1470 CHILE NUTS MARKET, BY FORM, 2018-2032 (USD THOUSAND)
TABLE 1471 CHILE NUTS MARKET, BY NATURE, 2018-2032 (USD THOUSAND)
TABLE 1472 CHILE NUTS MARKET, BY PROCESSING METHOD, 2018-2032 (USD THOUSAND)
TABLE 1473 CHILE ROASTED IN NUTS MARKET, BY TYPE, 2018-2032 (USD THOUSAND)
TABLE 1474 CHILE FLAVORED IN NUTS MARKET, BY TYPE, 2018-2032 (USD THOUSAND)
TABLE 1475 CHILE NUTS MARKET, BY GRADE, 2018-2032 (USD THOUSAND)
TABLE 1476 CHILE NUTS MARKET, BY SHELF LIFE, 2018-2032 (USD THOUSAND)
TABLE 1477 CHILE NUTS MARKET, BY CERTIFICATION, 2018-2032 (USD THOUSAND)
TABLE 1478 CHILE NUTS MARKET, BY PACKAGING, 2018-2032 (USD THOUSAND)
TABLE 1479 CHILE PLASTIC POUCHES IN NUTS MARKET, BY TYPE, 2018-2032 (USD THOUSAND)
TABLE 1480 CHILE NUTS MARKET, BY PACKAGING SIZE, 2018-2032 (USD THOUSAND)
TABLE 1481 CHILE NUTS MARKET, BY PRICE RANGE, 2018-2032 (USD THOUSAND)
TABLE 1482 CHILE NUTS MARKET, BY END-USE, 2018-2032 (USD THOUSAND)
TABLE 1483 CHILE FUNCTIONAL NUTRITION IN NUTS MARKET, BY TYPE, 2018-2032 (USD THOUSAND)
TABLE 1484 CHILE BEVERAGE INDUSTRY IN NUTS MARKET, BY TYPE, 2018-2032 (USD THOUSAND)
TABLE 1485 CHILE CULINARY IN NUTS MARKET, BY TYPE, 2018-2032 (USD THOUSAND)
TABLE 1486 CHILE PERSONAL CARE PRODUCTS IN NUTS MARKET, BY TYPE, 2018-2032 (USD THOUSAND)
TABLE 1487 CHILE BIO-BASED & AGRO-INDUSTRIAL USES IN NUTS MARKET, BY TYPE, 2018-2032 (USD THOUSAND)
TABLE 1488 CHILE ANIMAL FEED IN NUTS MARKET, BY TYPE, 2018-2032 (USD THOUSAND)
TABLE 1489 CHILE NUTS MARKET, BY DISTRIBUTION CHANNEL, 2018-2032 (USD THOUSAND)
TABLE 1490 CHILE B2C IN NUTS MARKET, BY TYPE, 2018-2032 (USD THOUSAND)
TABLE 1491 CHILE OFFLINE IN NUTS MARKET, BY TYPE, 2018-2032 (USD THOUSAND)
TABLE 1492 CHILE ONLINE IN NUTS MARKET, BY TYPE, 2018-2032 (USD THOUSAND)
TABLE 1493 ARGENTINA NUTS MARKET, BY PRODUCT TYPE, 2018-2032 (USD THOUSAND)
TABLE 1494 ARGENTINA NUTS MARKET, BY PRODUCT TYPE, 2018-2032 (THOUSAND TONS)
TABLE 1495 ARGENTINA TREE NUTS IN NUTS MARKET, BY TYPE, 2018-2032 (USD THOUSAND)
TABLE 1496 ARGENTINA GROUND NUTS IN NUTS MARKET, BY PEANUTS, 2018-2032 (USD THOUSAND)
TABLE 1497 ARGENTINA HYBRID/OTHER NUTS IN NUTS MARKET, BY TYPE, 2018-2032 (USD THOUSAND)
TABLE 1498 ARGENTINA NUTS MARKET, BY FORM, 2018-2032 (USD THOUSAND)
TABLE 1499 ARGENTINA NUTS MARKET, BY NATURE, 2018-2032 (USD THOUSAND)
TABLE 1500 ARGENTINA NUTS MARKET, BY PROCESSING METHOD, 2018-2032 (USD THOUSAND)
TABLE 1501 ARGENTINA ROASTED IN NUTS MARKET, BY TYPE, 2018-2032 (USD THOUSAND)
TABLE 1502 ARGENTINA FLAVORED IN NUTS MARKET, BY TYPE, 2018-2032 (USD THOUSAND)
TABLE 1503 ARGENTINA NUTS MARKET, BY GRADE, 2018-2032 (USD THOUSAND)
TABLE 1504 ARGENTINA NUTS MARKET, BY SHELF LIFE, 2018-2032 (USD THOUSAND)
TABLE 1505 ARGENTINA NUTS MARKET, BY CERTIFICATION, 2018-2032 (USD THOUSAND)
TABLE 1506 ARGENTINA NUTS MARKET, BY PACKAGING, 2018-2032 (USD THOUSAND)
TABLE 1507 ARGENTINA PLASTIC POUCHES IN NUTS MARKET, BY TYPE, 2018-2032 (USD THOUSAND)
TABLE 1508 ARGENTINA NUTS MARKET, BY PACKAGING SIZE, 2018-2032 (USD THOUSAND)
TABLE 1509 ARGENTINA NUTS MARKET, BY PRICE RANGE, 2018-2032 (USD THOUSAND)
TABLE 1510 ARGENTINA NUTS MARKET, BY END-USE, 2018-2032 (USD THOUSAND)
TABLE 1511 ARGENTINA FUNCTIONAL NUTRITION IN NUTS MARKET, BY TYPE, 2018-2032 (USD THOUSAND)
TABLE 1512 ARGENTINA BEVERAGE INDUSTRY IN NUTS MARKET, BY TYPE, 2018-2032 (USD THOUSAND)
TABLE 1513 ARGENTINA CULINARY IN NUTS MARKET, BY TYPE, 2018-2032 (USD THOUSAND)
TABLE 1514 ARGENTINA PERSONAL CARE PRODUCTS IN NUTS MARKET, BY TYPE, 2018-2032 (USD THOUSAND)
TABLE 1515 ARGENTINA BIO-BASED & AGRO-INDUSTRIAL USES IN NUTS MARKET, BY TYPE, 2018-2032 (USD THOUSAND)
TABLE 1516 ARGENTINA ANIMAL FEED IN NUTS MARKET, BY TYPE, 2018-2032 (USD THOUSAND)
TABLE 1517 ARGENTINA NUTS MARKET, BY DISTRIBUTION CHANNEL, 2018-2032 (USD THOUSAND)
TABLE 1518 ARGENTINA B2C IN NUTS MARKET, BY TYPE, 2018-2032 (USD THOUSAND)
TABLE 1519 ARGENTINA OFFLINE IN NUTS MARKET, BY TYPE, 2018-2032 (USD THOUSAND)
TABLE 1520 ARGENTINA ONLINE IN NUTS MARKET, BY TYPE, 2018-2032 (USD THOUSAND)
TABLE 1521 PERU NUTS MARKET, BY PRODUCT TYPE, 2018-2032 (USD THOUSAND)
TABLE 1522 PERU NUTS MARKET, BY PRODUCT TYPE, 2018-2032 (THOUSAND TONS)
TABLE 1523 PERU TREE NUTS IN NUTS MARKET, BY TYPE, 2018-2032 (USD THOUSAND)
TABLE 1524 PERU GROUND NUTS IN NUTS MARKET, BY PEANUTS, 2018-2032 (USD THOUSAND)
TABLE 1525 PERU HYBRID/OTHER NUTS IN NUTS MARKET, BY TYPE, 2018-2032 (USD THOUSAND)
TABLE 1526 PERU NUTS MARKET, BY FORM, 2018-2032 (USD THOUSAND)
TABLE 1527 PERU NUTS MARKET, BY NATURE, 2018-2032 (USD THOUSAND)
TABLE 1528 PERU NUTS MARKET, BY PROCESSING METHOD, 2018-2032 (USD THOUSAND)
TABLE 1529 PERU ROASTED IN NUTS MARKET, BY TYPE, 2018-2032 (USD THOUSAND)
TABLE 1530 PERU FLAVORED IN NUTS MARKET, BY TYPE, 2018-2032 (USD THOUSAND)
TABLE 1531 PERU NUTS MARKET, BY GRADE, 2018-2032 (USD THOUSAND)
TABLE 1532 PERU NUTS MARKET, BY SHELF LIFE, 2018-2032 (USD THOUSAND)
TABLE 1533 PERU NUTS MARKET, BY CERTIFICATION, 2018-2032 (USD THOUSAND)
TABLE 1534 PERU NUTS MARKET, BY PACKAGING, 2018-2032 (USD THOUSAND)
TABLE 1535 PERU PLASTIC POUCHES IN NUTS MARKET, BY TYPE, 2018-2032 (USD THOUSAND)
TABLE 1536 PERU NUTS MARKET, BY PACKAGING SIZE, 2018-2032 (USD THOUSAND)
TABLE 1537 PERU NUTS MARKET, BY PRICE RANGE, 2018-2032 (USD THOUSAND)
TABLE 1538 PERU NUTS MARKET, BY END-USE, 2018-2032 (USD THOUSAND)
TABLE 1539 PERU FUNCTIONAL NUTRITION IN NUTS MARKET, BY TYPE, 2018-2032 (USD THOUSAND)
TABLE 1540 PERU BEVERAGE INDUSTRY IN NUTS MARKET, BY TYPE, 2018-2032 (USD THOUSAND)
TABLE 1541 PERU CULINARY IN NUTS MARKET, BY TYPE, 2018-2032 (USD THOUSAND)
TABLE 1542 PERU PERSONAL CARE PRODUCTS IN NUTS MARKET, BY TYPE, 2018-2032 (USD THOUSAND)
TABLE 1543 PERU BIO-BASED & AGRO-INDUSTRIAL USES IN NUTS MARKET, BY TYPE, 2018-2032 (USD THOUSAND)
TABLE 1544 PERU ANIMAL FEED IN NUTS MARKET, BY TYPE, 2018-2032 (USD THOUSAND)
TABLE 1545 PERU NUTS MARKET, BY DISTRIBUTION CHANNEL, 2018-2032 (USD THOUSAND)
TABLE 1546 PERU B2C IN NUTS MARKET, BY TYPE, 2018-2032 (USD THOUSAND)
TABLE 1547 PERU OFFLINE IN NUTS MARKET, BY TYPE, 2018-2032 (USD THOUSAND)
TABLE 1548 PERU ONLINE IN NUTS MARKET, BY TYPE, 2018-2032 (USD THOUSAND)
TABLE 1549 COLOMBIA NUTS MARKET, BY PRODUCT TYPE, 2018-2032 (USD THOUSAND)
TABLE 1550 COLOMBIA NUTS MARKET, BY PRODUCT TYPE, 2018-2032 (THOUSAND TONS)
TABLE 1551 COLOMBIA TREE NUTS IN NUTS MARKET, BY TYPE, 2018-2032 (USD THOUSAND)
TABLE 1552 COLOMBIA GROUND NUTS IN NUTS MARKET, BY PEANUTS, 2018-2032 (USD THOUSAND)
TABLE 1553 COLOMBIA HYBRID/OTHER NUTS IN NUTS MARKET, BY TYPE, 2018-2032 (USD THOUSAND)
TABLE 1554 COLOMBIA NUTS MARKET, BY FORM, 2018-2032 (USD THOUSAND)
TABLE 1555 COLOMBIA NUTS MARKET, BY NATURE, 2018-2032 (USD THOUSAND)
TABLE 1556 COLOMBIA NUTS MARKET, BY PROCESSING METHOD, 2018-2032 (USD THOUSAND)
TABLE 1557 COLOMBIA ROASTED IN NUTS MARKET, BY TYPE, 2018-2032 (USD THOUSAND)
TABLE 1558 COLOMBIA FLAVORED IN NUTS MARKET, BY TYPE, 2018-2032 (USD THOUSAND)
TABLE 1559 COLOMBIA NUTS MARKET, BY GRADE, 2018-2032 (USD THOUSAND)
TABLE 1560 COLOMBIA NUTS MARKET, BY SHELF LIFE, 2018-2032 (USD THOUSAND)
TABLE 1561 COLOMBIA NUTS MARKET, BY CERTIFICATION, 2018-2032 (USD THOUSAND)
TABLE 1562 COLOMBIA NUTS MARKET, BY PACKAGING, 2018-2032 (USD THOUSAND)
TABLE 1563 COLOMBIA PLASTIC POUCHES IN NUTS MARKET, BY TYPE, 2018-2032 (USD THOUSAND)
TABLE 1564 COLOMBIA NUTS MARKET, BY PACKAGING SIZE, 2018-2032 (USD THOUSAND)
TABLE 1565 COLOMBIA NUTS MARKET, BY PRICE RANGE, 2018-2032 (USD THOUSAND)
TABLE 1566 COLOMBIA NUTS MARKET, BY END-USE, 2018-2032 (USD THOUSAND)
TABLE 1567 COLOMBIA FUNCTIONAL NUTRITION IN NUTS MARKET, BY TYPE, 2018-2032 (USD THOUSAND)
TABLE 1568 COLOMBIA BEVERAGE INDUSTRY IN NUTS MARKET, BY TYPE, 2018-2032 (USD THOUSAND)
TABLE 1569 COLOMBIA CULINARY IN NUTS MARKET, BY TYPE, 2018-2032 (USD THOUSAND)
TABLE 1570 COLOMBIA PERSONAL CARE PRODUCTS IN NUTS MARKET, BY TYPE, 2018-2032 (USD THOUSAND)
TABLE 1571 COLOMBIA BIO-BASED & AGRO-INDUSTRIAL USES IN NUTS MARKET, BY TYPE, 2018-2032 (USD THOUSAND)
TABLE 1572 COLOMBIA ANIMAL FEED IN NUTS MARKET, BY TYPE, 2018-2032 (USD THOUSAND)
TABLE 1573 COLOMBIA NUTS MARKET, BY DISTRIBUTION CHANNEL, 2018-2032 (USD THOUSAND)
TABLE 1574 COLOMBIA B2C IN NUTS MARKET, BY TYPE, 2018-2032 (USD THOUSAND)
TABLE 1575 COLOMBIA OFFLINE IN NUTS MARKET, BY TYPE, 2018-2032 (USD THOUSAND)
TABLE 1576 COLOMBIA ONLINE IN NUTS MARKET, BY TYPE, 2018-2032 (USD THOUSAND)
TABLE 1577 BOLIVIA NUTS MARKET, BY PRODUCT TYPE, 2018-2032 (USD THOUSAND)
TABLE 1578 BOLIVIA NUTS MARKET, BY PRODUCT TYPE, 2018-2032 (THOUSAND TONS)
TABLE 1579 BOLIVIA TREE NUTS IN NUTS MARKET, BY TYPE, 2018-2032 (USD THOUSAND)
TABLE 1580 BOLIVIA GROUND NUTS IN NUTS MARKET, BY PEANUTS, 2018-2032 (USD THOUSAND)
TABLE 1581 BOLIVIA HYBRID/OTHER NUTS IN NUTS MARKET, BY TYPE, 2018-2032 (USD THOUSAND)
TABLE 1582 BOLIVIA NUTS MARKET, BY FORM, 2018-2032 (USD THOUSAND)
TABLE 1583 BOLIVIA NUTS MARKET, BY NATURE, 2018-2032 (USD THOUSAND)
TABLE 1584 BOLIVIA NUTS MARKET, BY PROCESSING METHOD, 2018-2032 (USD THOUSAND)
TABLE 1585 BOLIVIA ROASTED IN NUTS MARKET, BY TYPE, 2018-2032 (USD THOUSAND)
TABLE 1586 BOLIVIA FLAVORED IN NUTS MARKET, BY TYPE, 2018-2032 (USD THOUSAND)
TABLE 1587 BOLIVIA NUTS MARKET, BY GRADE, 2018-2032 (USD THOUSAND)
TABLE 1588 BOLIVIA NUTS MARKET, BY SHELF LIFE, 2018-2032 (USD THOUSAND)
TABLE 1589 BOLIVIA NUTS MARKET, BY CERTIFICATION, 2018-2032 (USD THOUSAND)
TABLE 1590 BOLIVIA NUTS MARKET, BY PACKAGING, 2018-2032 (USD THOUSAND)
TABLE 1591 BOLIVIA PLASTIC POUCHES IN NUTS MARKET, BY TYPE, 2018-2032 (USD THOUSAND)
TABLE 1592 BOLIVIA NUTS MARKET, BY PACKAGING SIZE, 2018-2032 (USD THOUSAND)
TABLE 1593 BOLIVIA NUTS MARKET, BY PRICE RANGE, 2018-2032 (USD THOUSAND)
TABLE 1594 BOLIVIA NUTS MARKET, BY END-USE, 2018-2032 (USD THOUSAND)
TABLE 1595 BOLIVIA FUNCTIONAL NUTRITION IN NUTS MARKET, BY TYPE, 2018-2032 (USD THOUSAND)
TABLE 1596 BOLIVIA BEVERAGE INDUSTRY IN NUTS MARKET, BY TYPE, 2018-2032 (USD THOUSAND)
TABLE 1597 BOLIVIA CULINARY IN NUTS MARKET, BY TYPE, 2018-2032 (USD THOUSAND)
TABLE 1598 BOLIVIA PERSONAL CARE PRODUCTS IN NUTS MARKET, BY TYPE, 2018-2032 (USD THOUSAND)
TABLE 1599 BOLIVIA BIO-BASED & AGRO-INDUSTRIAL USES IN NUTS MARKET, BY TYPE, 2018-2032 (USD THOUSAND)
TABLE 1600 BOLIVIA ANIMAL FEED IN NUTS MARKET, BY TYPE, 2018-2032 (USD THOUSAND)
TABLE 1601 BOLIVIA NUTS MARKET, BY DISTRIBUTION CHANNEL, 2018-2032 (USD THOUSAND)
TABLE 1602 BOLIVIA B2C IN NUTS MARKET, BY TYPE, 2018-2032 (USD THOUSAND)
TABLE 1603 BOLIVIA OFFLINE IN NUTS MARKET, BY TYPE, 2018-2032 (USD THOUSAND)
TABLE 1604 BOLIVIA ONLINE IN NUTS MARKET, BY TYPE, 2018-2032 (USD THOUSAND)
TABLE 1605 ECUADOR NUTS MARKET, BY PRODUCT TYPE, 2018-2032 (USD THOUSAND)
TABLE 1606 ECUADOR NUTS MARKET, BY PRODUCT TYPE, 2018-2032 (THOUSAND TONS)
TABLE 1607 ECUADOR TREE NUTS IN NUTS MARKET, BY TYPE, 2018-2032 (USD THOUSAND)
TABLE 1608 ECUADOR GROUND NUTS IN NUTS MARKET, BY PEANUTS, 2018-2032 (USD THOUSAND)
TABLE 1609 ECUADOR HYBRID/OTHER NUTS IN NUTS MARKET, BY TYPE, 2018-2032 (USD THOUSAND)
TABLE 1610 ECUADOR NUTS MARKET, BY FORM, 2018-2032 (USD THOUSAND)
TABLE 1611 ECUADOR NUTS MARKET, BY NATURE, 2018-2032 (USD THOUSAND)
TABLE 1612 ECUADOR NUTS MARKET, BY PROCESSING METHOD, 2018-2032 (USD THOUSAND)
TABLE 1613 ECUADOR ROASTED IN NUTS MARKET, BY TYPE, 2018-2032 (USD THOUSAND)
TABLE 1614 ECUADOR FLAVORED IN NUTS MARKET, BY TYPE, 2018-2032 (USD THOUSAND)
TABLE 1615 ECUADOR NUTS MARKET, BY GRADE, 2018-2032 (USD THOUSAND)
TABLE 1616 ECUADOR NUTS MARKET, BY SHELF LIFE, 2018-2032 (USD THOUSAND)
TABLE 1617 ECUADOR NUTS MARKET, BY CERTIFICATION, 2018-2032 (USD THOUSAND)
TABLE 1618 ECUADOR NUTS MARKET, BY PACKAGING, 2018-2032 (USD THOUSAND)
TABLE 1619 ECUADOR PLASTIC POUCHES IN NUTS MARKET, BY TYPE, 2018-2032 (USD THOUSAND)
TABLE 1620 ECUADOR NUTS MARKET, BY PACKAGING SIZE, 2018-2032 (USD THOUSAND)
TABLE 1621 ECUADOR NUTS MARKET, BY PRICE RANGE, 2018-2032 (USD THOUSAND)
TABLE 1622 ECUADOR NUTS MARKET, BY END-USE, 2018-2032 (USD THOUSAND)
TABLE 1623 ECUADOR FUNCTIONAL NUTRITION IN NUTS MARKET, BY TYPE, 2018-2032 (USD THOUSAND)
TABLE 1624 ECUADOR BEVERAGE INDUSTRY IN NUTS MARKET, BY TYPE, 2018-2032 (USD THOUSAND)
TABLE 1625 ECUADOR CULINARY IN NUTS MARKET, BY TYPE, 2018-2032 (USD THOUSAND)
TABLE 1626 ECUADOR PERSONAL CARE PRODUCTS IN NUTS MARKET, BY TYPE, 2018-2032 (USD THOUSAND)
TABLE 1627 ECUADOR BIO-BASED & AGRO-INDUSTRIAL USES IN NUTS MARKET, BY TYPE, 2018-2032 (USD THOUSAND)
TABLE 1628 ECUADOR ANIMAL FEED IN NUTS MARKET, BY TYPE, 2018-2032 (USD THOUSAND)
TABLE 1629 ECUADOR NUTS MARKET, BY DISTRIBUTION CHANNEL, 2018-2032 (USD THOUSAND)
TABLE 1630 ECUADOR B2C IN NUTS MARKET, BY TYPE, 2018-2032 (USD THOUSAND)
TABLE 1631 ECUADOR OFFLINE IN NUTS MARKET, BY TYPE, 2018-2032 (USD THOUSAND)
TABLE 1632 ECUADOR ONLINE IN NUTS MARKET, BY TYPE, 2018-2032 (USD THOUSAND)
TABLE 1633 PARAGUAY NUTS MARKET, BY PRODUCT TYPE, 2018-2032 (USD THOUSAND)
TABLE 1634 PARAGUAY NUTS MARKET, BY PRODUCT TYPE, 2018-2032 (THOUSAND TONS)
TABLE 1635 PARAGUAY TREE NUTS IN NUTS MARKET, BY TYPE, 2018-2032 (USD THOUSAND)
TABLE 1636 PARAGUAY GROUND NUTS IN NUTS MARKET, BY PEANUTS, 2018-2032 (USD THOUSAND)
TABLE 1637 PARAGUAY HYBRID/OTHER NUTS IN NUTS MARKET, BY TYPE, 2018-2032 (USD THOUSAND)
TABLE 1638 PARAGUAY NUTS MARKET, BY FORM, 2018-2032 (USD THOUSAND)
TABLE 1639 PARAGUAY NUTS MARKET, BY NATURE, 2018-2032 (USD THOUSAND)
TABLE 1640 PARAGUAY NUTS MARKET, BY PROCESSING METHOD, 2018-2032 (USD THOUSAND)
TABLE 1641 PARAGUAY ROASTED IN NUTS MARKET, BY TYPE, 2018-2032 (USD THOUSAND)
TABLE 1642 PARAGUAY FLAVORED IN NUTS MARKET, BY TYPE, 2018-2032 (USD THOUSAND)
TABLE 1643 PARAGUAY NUTS MARKET, BY GRADE, 2018-2032 (USD THOUSAND)
TABLE 1644 PARAGUAY NUTS MARKET, BY SHELF LIFE, 2018-2032 (USD THOUSAND)
TABLE 1645 PARAGUAY NUTS MARKET, BY CERTIFICATION, 2018-2032 (USD THOUSAND)
TABLE 1646 PARAGUAY NUTS MARKET, BY PACKAGING, 2018-2032 (USD THOUSAND)
TABLE 1647 PARAGUAY PLASTIC POUCHES IN NUTS MARKET, BY TYPE, 2018-2032 (USD THOUSAND)
TABLE 1648 PARAGUAY NUTS MARKET, BY PACKAGING SIZE, 2018-2032 (USD THOUSAND)
TABLE 1649 PARAGUAY NUTS MARKET, BY PRICE RANGE, 2018-2032 (USD THOUSAND)
TABLE 1650 PARAGUAY NUTS MARKET, BY END-USE, 2018-2032 (USD THOUSAND)
TABLE 1651 PARAGUAY FUNCTIONAL NUTRITION IN NUTS MARKET, BY TYPE, 2018-2032 (USD THOUSAND)
TABLE 1652 PARAGUAY BEVERAGE INDUSTRY IN NUTS MARKET, BY TYPE, 2018-2032 (USD THOUSAND)
TABLE 1653 PARAGUAY CULINARY IN NUTS MARKET, BY TYPE, 2018-2032 (USD THOUSAND)
TABLE 1654 PARAGUAY PERSONAL CARE PRODUCTS IN NUTS MARKET, BY TYPE, 2018-2032 (USD THOUSAND)
TABLE 1655 PARAGUAY BIO-BASED & AGRO-INDUSTRIAL USES IN NUTS MARKET, BY TYPE, 2018-2032 (USD THOUSAND)
TABLE 1656 PARAGUAY ANIMAL FEED IN NUTS MARKET, BY TYPE, 2018-2032 (USD THOUSAND)
TABLE 1657 PARAGUAY NUTS MARKET, BY DISTRIBUTION CHANNEL, 2018-2032 (USD THOUSAND)
TABLE 1658 PARAGUAY B2C IN NUTS MARKET, BY TYPE, 2018-2032 (USD THOUSAND)
TABLE 1659 PARAGUAY OFFLINE IN NUTS MARKET, BY TYPE, 2018-2032 (USD THOUSAND)
TABLE 1660 PARAGUAY ONLINE IN NUTS MARKET, BY TYPE, 2018-2032 (USD THOUSAND)
TABLE 1661 URUGUAY NUTS MARKET, BY PRODUCT TYPE, 2018-2032 (USD THOUSAND)
TABLE 1662 URUGUAY NUTS MARKET, BY PRODUCT TYPE, 2018-2032 (THOUSAND TONS)
TABLE 1663 URUGUAY TREE NUTS IN NUTS MARKET, BY TYPE, 2018-2032 (USD THOUSAND)
TABLE 1664 URUGUAY GROUND NUTS IN NUTS MARKET, BY PEANUTS, 2018-2032 (USD THOUSAND)
TABLE 1665 URUGUAY HYBRID/OTHER NUTS IN NUTS MARKET, BY TYPE, 2018-2032 (USD THOUSAND)
TABLE 1666 URUGUAY NUTS MARKET, BY FORM, 2018-2032 (USD THOUSAND)
TABLE 1667 URUGUAY NUTS MARKET, BY NATURE, 2018-2032 (USD THOUSAND)
TABLE 1668 URUGUAY NUTS MARKET, BY PROCESSING METHOD, 2018-2032 (USD THOUSAND)
TABLE 1669 URUGUAY ROASTED IN NUTS MARKET, BY TYPE, 2018-2032 (USD THOUSAND)
TABLE 1670 URUGUAY FLAVORED IN NUTS MARKET, BY TYPE, 2018-2032 (USD THOUSAND)
TABLE 1671 URUGUAY NUTS MARKET, BY GRADE, 2018-2032 (USD THOUSAND)
TABLE 1672 URUGUAY NUTS MARKET, BY SHELF LIFE, 2018-2032 (USD THOUSAND)
TABLE 1673 URUGUAY NUTS MARKET, BY CERTIFICATION, 2018-2032 (USD THOUSAND)
TABLE 1674 URUGUAY NUTS MARKET, BY PACKAGING, 2018-2032 (USD THOUSAND)
TABLE 1675 URUGUAY PLASTIC POUCHES IN NUTS MARKET, BY TYPE, 2018-2032 (USD THOUSAND)
TABLE 1676 URUGUAY NUTS MARKET, BY PACKAGING SIZE, 2018-2032 (USD THOUSAND)
TABLE 1677 URUGUAY NUTS MARKET, BY PRICE RANGE, 2018-2032 (USD THOUSAND)
TABLE 1678 URUGUAY NUTS MARKET, BY END-USE, 2018-2032 (USD THOUSAND)
TABLE 1679 URUGUAY FUNCTIONAL NUTRITION IN NUTS MARKET, BY TYPE, 2018-2032 (USD THOUSAND)
TABLE 1680 URUGUAY BEVERAGE INDUSTRY IN NUTS MARKET, BY TYPE, 2018-2032 (USD THOUSAND)
TABLE 1681 URUGUAY CULINARY IN NUTS MARKET, BY TYPE, 2018-2032 (USD THOUSAND)
TABLE 1682 URUGUAY PERSONAL CARE PRODUCTS IN NUTS MARKET, BY TYPE, 2018-2032 (USD THOUSAND)
TABLE 1683 URUGUAY BIO-BASED & AGRO-INDUSTRIAL USES IN NUTS MARKET, BY TYPE, 2018-2032 (USD THOUSAND)
TABLE 1684 URUGUAY ANIMAL FEED IN NUTS MARKET, BY TYPE, 2018-2032 (USD THOUSAND)
TABLE 1685 URUGUAY NUTS MARKET, BY DISTRIBUTION CHANNEL, 2018-2032 (USD THOUSAND)
TABLE 1686 URUGUAY B2C IN NUTS MARKET, BY TYPE, 2018-2032 (USD THOUSAND)
TABLE 1687 URUGUAY OFFLINE IN NUTS MARKET, BY TYPE, 2018-2032 (USD THOUSAND)
TABLE 1688 URUGUAY ONLINE IN NUTS MARKET, BY TYPE, 2018-2032 (USD THOUSAND)
TABLE 1689 VENEZUELA NUTS MARKET, BY PRODUCT TYPE, 2018-2032 (USD THOUSAND)
TABLE 1690 VENEZUELA NUTS MARKET, BY PRODUCT TYPE, 2018-2032 (THOUSAND TONS)
TABLE 1691 VENEZUELA TREE NUTS IN NUTS MARKET, BY TYPE, 2018-2032 (USD THOUSAND)
TABLE 1692 VENEZUELA GROUND NUTS IN NUTS MARKET, BY PEANUTS, 2018-2032 (USD THOUSAND)
TABLE 1693 VENEZUELA HYBRID/OTHER NUTS IN NUTS MARKET, BY TYPE, 2018-2032 (USD THOUSAND)
TABLE 1694 VENEZUELA NUTS MARKET, BY FORM, 2018-2032 (USD THOUSAND)
TABLE 1695 VENEZUELA NUTS MARKET, BY NATURE, 2018-2032 (USD THOUSAND)
TABLE 1696 VENEZUELA NUTS MARKET, BY PROCESSING METHOD, 2018-2032 (USD THOUSAND)
TABLE 1697 VENEZUELA ROASTED IN NUTS MARKET, BY TYPE, 2018-2032 (USD THOUSAND)
TABLE 1698 VENEZUELA FLAVORED IN NUTS MARKET, BY TYPE, 2018-2032 (USD THOUSAND)
TABLE 1699 VENEZUELA NUTS MARKET, BY GRADE, 2018-2032 (USD THOUSAND)
TABLE 1700 VENEZUELA NUTS MARKET, BY SHELF LIFE, 2018-2032 (USD THOUSAND)
TABLE 1701 VENEZUELA NUTS MARKET, BY CERTIFICATION, 2018-2032 (USD THOUSAND)
TABLE 1702 VENEZUELA NUTS MARKET, BY PACKAGING, 2018-2032 (USD THOUSAND)
TABLE 1703 VENEZUELA PLASTIC POUCHES IN NUTS MARKET, BY TYPE, 2018-2032 (USD THOUSAND)
TABLE 1704 VENEZUELA NUTS MARKET, BY PACKAGING SIZE, 2018-2032 (USD THOUSAND)
TABLE 1705 VENEZUELA NUTS MARKET, BY PRICE RANGE, 2018-2032 (USD THOUSAND)
TABLE 1706 VENEZUELA NUTS MARKET, BY END-USE, 2018-2032 (USD THOUSAND)
TABLE 1707 VENEZUELA FUNCTIONAL NUTRITION IN NUTS MARKET, BY TYPE, 2018-2032 (USD THOUSAND)
TABLE 1708 VENEZUELA BEVERAGE INDUSTRY IN NUTS MARKET, BY TYPE, 2018-2032 (USD THOUSAND)
TABLE 1709 VENEZUELA CULINARY IN NUTS MARKET, BY TYPE, 2018-2032 (USD THOUSAND)
TABLE 1710 VENEZUELA PERSONAL CARE PRODUCTS IN NUTS MARKET, BY TYPE, 2018-2032 (USD THOUSAND)
TABLE 1711 VENEZUELA BIO-BASED & AGRO-INDUSTRIAL USES IN NUTS MARKET, BY TYPE, 2018-2032 (USD THOUSAND)
TABLE 1712 VENEZUELA ANIMAL FEED IN NUTS MARKET, BY TYPE, 2018-2032 (USD THOUSAND)
TABLE 1713 VENEZUELA NUTS MARKET, BY DISTRIBUTION CHANNEL, 2018-2032 (USD THOUSAND)
TABLE 1714 VENEZUELA B2C IN NUTS MARKET, BY TYPE, 2018-2032 (USD THOUSAND)
TABLE 1715 VENEZUELA OFFLINE IN NUTS MARKET, BY TYPE, 2018-2032 (USD THOUSAND)
TABLE 1716 VENEZUELA ONLINE IN NUTS MARKET, BY TYPE, 2018-2032 (USD THOUSAND)
TABLE 1717 REST OF SOUTH AMERICA NUTS MARKET, BY PRODUCT TYPE, 2018-2032 (USD THOUSAND)
TABLE 1718 REST OF SOUTH AMERICA NUTS MARKET, BY PRODUCT TYPE, 2018-2032 (THOUSAND TONS)
List of Figure
FIGURE 1 EUROPE NUTS MARKET
FIGURE 2 EUROPE NUTS MARKET: DATA TRIANGULATION
FIGURE 3 EUROPE NUTS MARKET: DROC ANALYSIS
FIGURE 4 EUROPE NUTS MARKET: EUROPE VS REGIONAL MARKET ANALYSIS
FIGURE 5 EUROPE NUTS MARKET: COMPANY RESEARCH ANALYSIS
FIGURE 6 EUROPE NUTS MARKET: MULTIVARIATE MODELLING
FIGURE 7 EUROPE NUTS MARKET TIME LINE CURVE
FIGURE 8 EUROPE NUTS MARKET: INTERVIEW DEMOGRAPHICS
FIGURE 9 EUROPE NUTS MARKET: DBMR MARKET POSITION GRID
FIGURE 10 EUROPE NUTS MARKET: MARKET END-USE COVERAGE GRID
FIGURE 11 EUROPE NUTS MARKET: VENDOR SHARE ANALYSIS
FIGURE 12 EUROPE NUTS MARKET: SEGMENTATION
FIGURE 13 EXECUTIVE SUMMARY
FIGURE 14 EUROPE NUTS MARKET STRATEGIC DEVELOPMENT
FIGURE 15 FOUR SEGMENTS COMPRISE THE EUROPE NUTS MARKET, BY PRODUCT TYPE
FIGURE 16 NORTH AMERICA IS EXPECTED TO DOMINATE THE EUROPE NUTS MARKET, AND ASIA-PACIFIC IS EXPECTED TO GROW WITH THE HIGHEST CAGR IN THE FORECAST PERIOD
FIGURE 17 GROWING EUROPE TREND TOWARD HEALTHIER SNACKING AND NUTRITIOUS CHOICES IS EXPECTED TO DRIVE THE EUROPE NUTS MARKET IN THE FORECAST PERIOD
FIGURE 18 TREE NUT SEGMENT IS EXPECTED TO ACCOUNT FOR THE LARGEST SHARE OF THE EUROPE NUTS MARKET IN 2025 AND 2032
FIGURE 19 ASIA-PACIFIC IS THE FASTEST-GROWING MARKET FOR EUROPE NUTS MARKET IN THE FORECAST PERIOD
FIGURE 20 NUTS MARKET VALUE CHAIN
FIGURE 21 NUTS MARKET SUPPLY CHAIN ANALYSIS
FIGURE 22 TOTAL NUMBER OF DEALS
FIGURE 23 DEALS BY TYPE
FIGURE 24 DEALS BY SEGMENT
FIGURE 25 PRODUCTION CAPACITY OUTLOOK
FIGURE 26 PRODUCT AND BRAND OVERVIEW
FIGURE 27 PATENT FAMILIES
FIGURE 28 PATENT FAMILIES
FIGURE 29 COMPANY EVALUATION QUADRANT
FIGURE 30 PRICE TREND ANALYSIS, 2018-2032 (USD/KG)
FIGURE 31 PROJECT THREE NUT EXPORT INDEX (2021-2025)
FIGURE 32 DROC ANALYSIS
FIGURE 33 FREQUENCY OF NUT CONSUMPTION
FIGURE 34 EUROPE NUTS MARKET: BY PRODUCT TYPE, 2024
FIGURE 35 EUROPE NUTS MARKET: FORM, 2024
FIGURE 36 EUROPE NUTS MARKET: BY NATURE, 2024
FIGURE 37 EUROPE NUTS MARKET: BY PROCESSING METHOD, 2024
FIGURE 38 EUROPE NUTS MARKET: BY GRADE, 2024
FIGURE 39 EUROPE NUTS MARKET: BY SHELF LIFE, 2024
FIGURE 40 EUROPE NUTS MARKET: BY CERTIFICATION, 2024
FIGURE 41 EUROPE NUTS MARKET: PACKAGING, 2024
FIGURE 42 EUROPE NUTS MARKET: BY PACKAGING SIZE, 2024
FIGURE 43 EUROPE NUTS MARKET: BY PRICE RANGE, 2024
FIGURE 44 EUROPE NUTS MARKET: BY END-USE, 2024
FIGURE 45 EUROPE NUTS MARKET: BY DISTRIBUTION CHANNEL, 2024
FIGURE 46 EUROPE NUT MARKET: BY SNAPSHOT
FIGURE 47 NORTH AMERICA NUT MARKET: BY SNAPSHOT
FIGURE 48 EUROPE NUT MARKET: BY SNAPSHOT
FIGURE 49 ASIA-PACIFIC NUT MARKET: BY SNAPSHOT
FIGURE 50 MIDDLE EAST AND AFRICA NUT MARKET
FIGURE 51 SOUTH AMERICA NUT MARKET
FIGURE 52 EUROPE NUTS MARKET: COMPANY SHARE 2024 (%)
FIGURE 53 NORTH AMERICA NUTS MARKET: COMPANY SHARE 2024 (%)
FIGURE 54 APAC NUTS MARKET: COMPANY SHARE 2024 (%)
FIGURE 55 EUROPE NUTS MARKET: COMPANY SHARE 2024 (%)
Europe Nuts Market, Supply Chain Analysis and Ecosystem Framework
To support market growth and help clients navigate the impact of geopolitical shifts, DBMR has integrated in-depth supply chain analysis into its Europe Nuts Market research reports. This addition empowers clients to respond effectively to global changes affecting their industries. The supply chain analysis section includes detailed insights such as Europe Nuts Market consumption and production by country, price trend analysis, the impact of tariffs and geopolitical developments, and import and export trends by country and HSN code. It also highlights major suppliers with data on production capacity and company profiles, as well as key importers and exporters. In addition to research, DBMR offers specialized supply chain consulting services backed by over a decade of experience, providing solutions like supplier discovery, supplier risk assessment, price trend analysis, impact evaluation of inflation and trade route changes, and comprehensive market trend analysis.
Data collection and base year analysis are done using data collection modules with large sample sizes. The stage includes obtaining market information or related data through various sources and strategies. It includes examining and planning all the data acquired from the past in advance. It likewise envelops the examination of information inconsistencies seen across different information sources. The market data is analysed and estimated using market statistical and coherent models. Also, market share analysis and key trend analysis are the major success factors in the market report. To know more, please request an analyst call or drop down your inquiry.
The key research methodology used by DBMR research team is data triangulation which involves data mining, analysis of the impact of data variables on the market and primary (industry expert) validation. Data models include Vendor Positioning Grid, Market Time Line Analysis, Market Overview and Guide, Company Positioning Grid, Patent Analysis, Pricing Analysis, Company Market Share Analysis, Standards of Measurement, Global versus Regional and Vendor Share Analysis. To know more about the research methodology, drop in an inquiry to speak to our industry experts.
Data Bridge Market Research is a leader in advanced formative research. We take pride in servicing our existing and new customers with data and analysis that match and suits their goal. The report can be customized to include price trend analysis of target brands understanding the market for additional countries (ask for the list of countries), clinical trial results data, literature review, refurbished market and product base analysis. Market analysis of target competitors can be analyzed from technology-based analysis to market portfolio strategies. We can add as many competitors that you require data about in the format and data style you are looking for. Our team of analysts can also provide you data in crude raw excel files pivot tables (Fact book) or can assist you in creating presentations from the data sets available in the report.


