
Europe Polypropylene Compounds Market
Market Size in USD Billion
 USD
7.28 Billion
USD
10.50 Billion
2025
2033
USD
7.28 Billion
USD
10.50 Billion
2025
2033
| 2026 - 2033 | |
| USD 7.28 Billion | |
| USD 10.50 Billion | |
| % | |
|
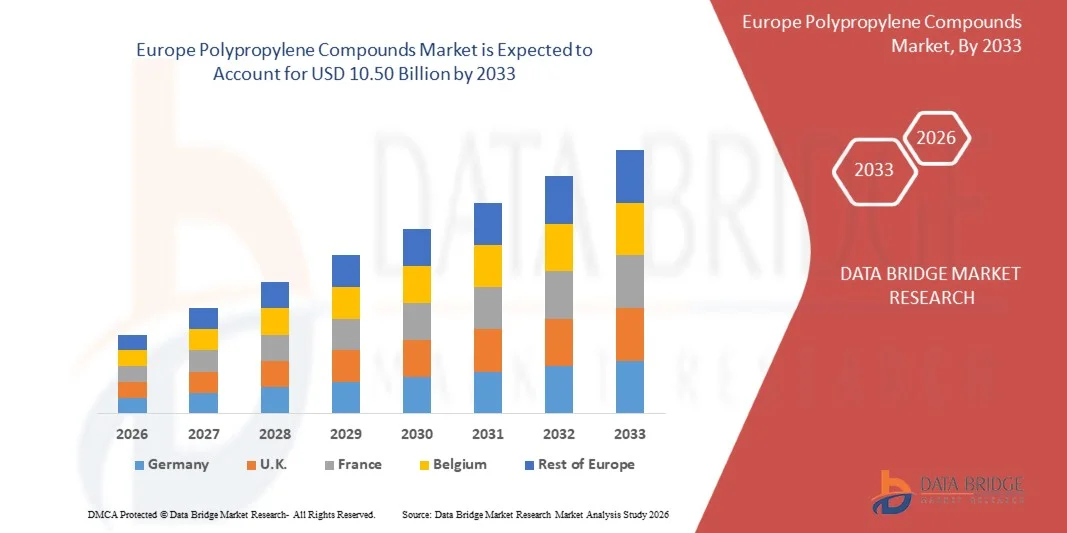
Europe Polypropylene Compounds Market Size
- The Europe polypropylene compounds market size was valued at USD 7.28 billion in 2025 and is expected to reach USD 10.50 billion by 2033, at a CAGR of 4.79% during the forecast period.
- Market growth is primarily driven by the increasing use of lightweight, durable, and cost-efficient materials across automotive, electrical & electronics, consumer goods, and packaging industries. The shift toward vehicle lightweighting to meet stringent CO₂ emission norms, along with the rising adoption of high-performance polymer solutions, is significantly boosting the demand for polypropylene compounds across Europe.
- Technological advancements in compounding processes—such as improved reinforcement techniques, enhanced recyclability, and the integration of sustainable fillers—are further supporting market expansion. These innovations are enabling manufacturers to achieve superior mechanical, thermal, and aesthetic properties in PP compounds while aligning with the EU’s circular economy initiatives.
- Growing consumer and industry preference for sustainable, recyclable, and eco-friendly materials is strengthening the adoption of polypropylene compounds as viable alternatives to heavier and non-recyclable materials. Together, these factors are accelerating product utilization and contributing substantially to the overall growth of the Europe polypropylene compounds market.
Europe Polypropylene Compounds Market Analysis
- Polypropylene compounds, formulated with fillers, reinforcements, impact modifiers, and additives, are gaining significant importance across automotive, electrical & electronics, consumer goods, industrial applications, and packaging sectors due to their lightweight, high rigidity, chemical resistance, thermal stability, and excellent processability. Their ability to replace metals and traditional plastics is strengthening their role in performance-driven applications across Europe.
- The rising demand for polypropylene compounds in Europe is primarily driven by the region’s strong shift toward lightweight materials, sustainability, and circular-economy–compliant solutions. Increasing regulatory pressure to reduce carbon emissions, coupled with the push for higher recyclability and energy-efficient materials, is accelerating the adoption of pp compounds across key industries.
- Germany is the dominant country in the Europe polypropylene compounds market, accounting for 18.74% of the regional share in 2026, and is projected to grow at a CAGR of 5.51% from 2026 to 2033. This growth is supported by the country’s robust automotive manufacturing base, strong industrial output, advanced material R&D capabilities, and the presence of leading polymer compounders. Additionally, Germany’s rapid adoption of lightweight and energy-efficient components in electric vehicles and industrial machinery continues to propel demand.
- The mineral-filled polypropylene segment is projected to lead the Europe market with a 43.34% share in 2026, supported by its extensive use in automotive interior and exterior components, appliance housings, industrial equipment, and packaging applications. Enhancements in mechanical strength, dimensional stability, and cost-effectiveness are driving manufacturers to increasingly prefer mineral-filled pp compounds over conventional plastics and metal alternatives.
Report Scope and Europe Polypropylene Compounds Market Segmentation
|
Attributes |
Europe Polypropylene Compounds Key Market Insights |
|
Segments Covered |
|
|
Countries Covered |
Europe
|
|
Key Market Players |
|
|
Market Opportunities |
|
|
Value Added Data Infosets |
In addition to the insights on market scenarios such as market value, growth rate, segmentation, geographical coverage, and major players, the market reports curated by the Data Bridge Market Research also include import export analysis, production capacity overview, production consumption analysis, price trend analysis, climate change scenario, supply chain analysis, value chain analysis, raw material/consumables overview, vendor selection criteria, PESTLE Analysis, Porter Analysis, and regulatory framework. |
Europe Polypropylene Compounds Market Trends
“Adoption of Recycled and Bio-Based Polypropylene Compounds to Support Circular Economy Goals”
- A prominent and rapidly accelerating trend in the Europe polypropylene compounds market is the strong industry-wide shift toward recycled and bio-based pp compounds to meet the EU’s circular economy targets, reduce carbon footprints, and align with strict sustainability regulations. This trend is being driven by the growing emphasis on closed-loop manufacturing, product recyclability, and the rising demand for low-emission materials across automotive, packaging, and consumer goods sectors.
- Leading companies such as borealis, Sabic, Totalenergies, Lyondellbasell, and Repsol are significantly expanding their portfolios of mechanically and chemically recycled pp compounds. These advanced materials are engineered to maintain or exceed the performance characteristics of virgin polypropylene—offering high impact strength, improved heat resistance, and enhanced processability—while delivering substantial reductions in lifecycle emissions.
- Bio-based polypropylene compounds, derived from renewable feedstocks such as biomass, waste cooking oils, and bio-naphtha, are also gaining traction due to increasing customer preference for environmentally friendly materials and the need to comply with brand-owner sustainability commitments. These materials offer comparable mechanical properties to fossil-based pp and are being widely adopted in packaging, automotive interiors, and household products.
- In the automotive industry, the use of recycled pp reinforced with glass fibers, talc, and mineral fillers is rising sharply to support lightweighting, end-of-life vehicle (ELV) recycling mandates, and oem sustainability scorecards. Manufacturers are increasingly demanding high-quality post-consumer and post-industrial pp compounds that deliver both regulatory compliance and cost efficiency.
- Across packaging and consumer goods, advanced sorting, depolymerization, odor-removal, and contamination-reduction technologies are enabling the production of food-grade and high-clarity recycled pp compounds. Digital traceability systems and certification frameworks are also being coupled with recycled pp to ensure transparency and circularity throughout the value chain.
- This shift toward next-generation recycled and bio-based polypropylene compounds is redefining material standards in Europe, pushing the market toward high-performance, low-impact, and circular-economy-aligned solutions that are rapidly replacing traditional petroleum-based alternatives.
Europe Polypropylene Compounds Market Dynamics
Driver
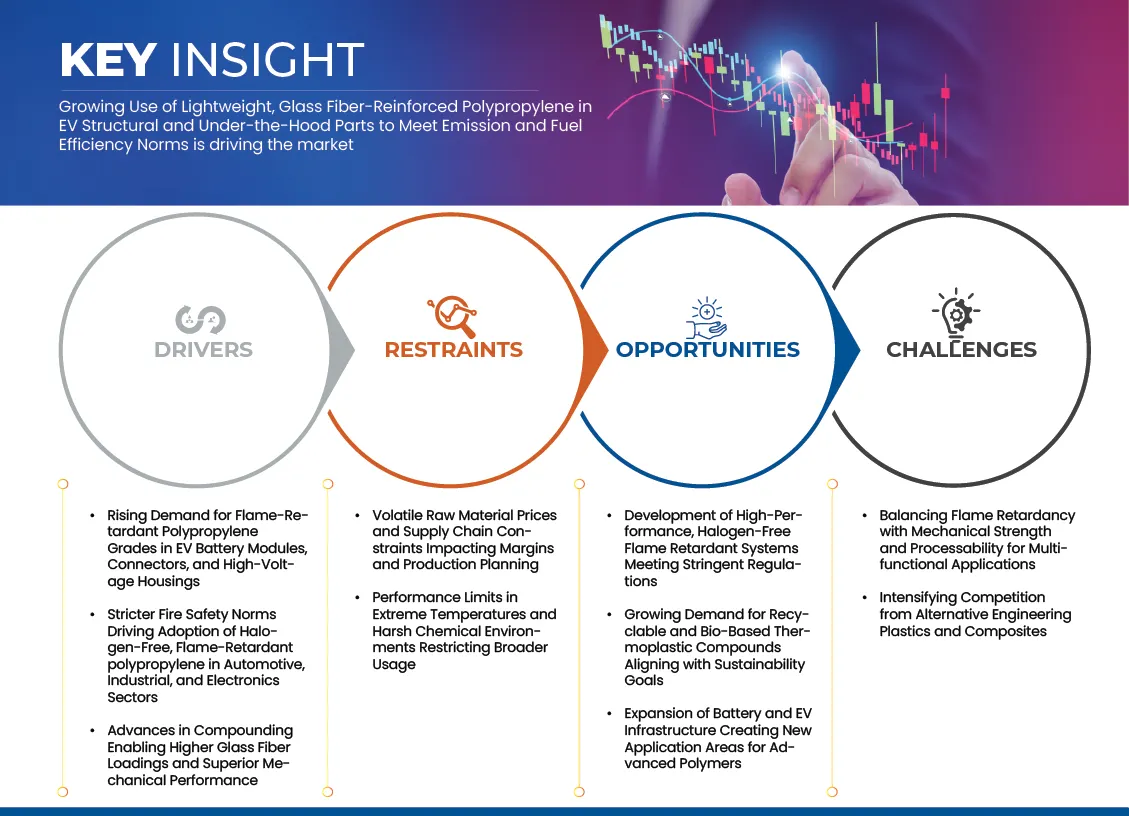
“Growing Use of Lightweight, Glass Fiber-Reinforced Polypropylene in EV Structural and Under-the-Hood Parts to Meet Emission and Fuel Efficiency Norms”
- The push for electric vehicle (EV) adoption and stricter global emissions standards has fundamentally changed the automotive manufacturing landscape. Manufacturers are under immense pressure to reduce vehicle weight to extend battery range and improve overall efficiency.
- This has led to a significant shift from traditional metal components to advanced, lightweight polymers. Glass fiber-reinforced polyphenylene ether (polypropylene) compounds are emerging as a key material in this transition.
- These compounds offer a superior balance of high strength, rigidity, and low density, making them ideal for structural and under-the-hood applications where they can replace heavier metal parts. Their excellent heat resistance and dimensional stability ensure they can withstand the demanding thermal and mechanical stress of an EV's engine bay and chassis. This trend is particularly pronounced globally as there is rapid growth in EV production and adoption.
- For Instance- In March 2024, according to Plastics Today, E-Works Mobility replaced aluminum battery boxes with glass-fiber-reinforced plastic (GFRP) in its Heero electric van. The plastic casings offer improved energy efficiency, fire safety, and lighter weight—all critical to emission compliance and range improvement in commercial EVs
- The shift to glass fiber-reinforced polypropylene compounds is a direct response to the automotive industry's need for lighter, stronger, and more efficient materials.
- The combination of its superior mechanical properties and the relentless pursuit of fuel efficiency and extended battery range in the EV sector ensures its continued growth
Opportunity
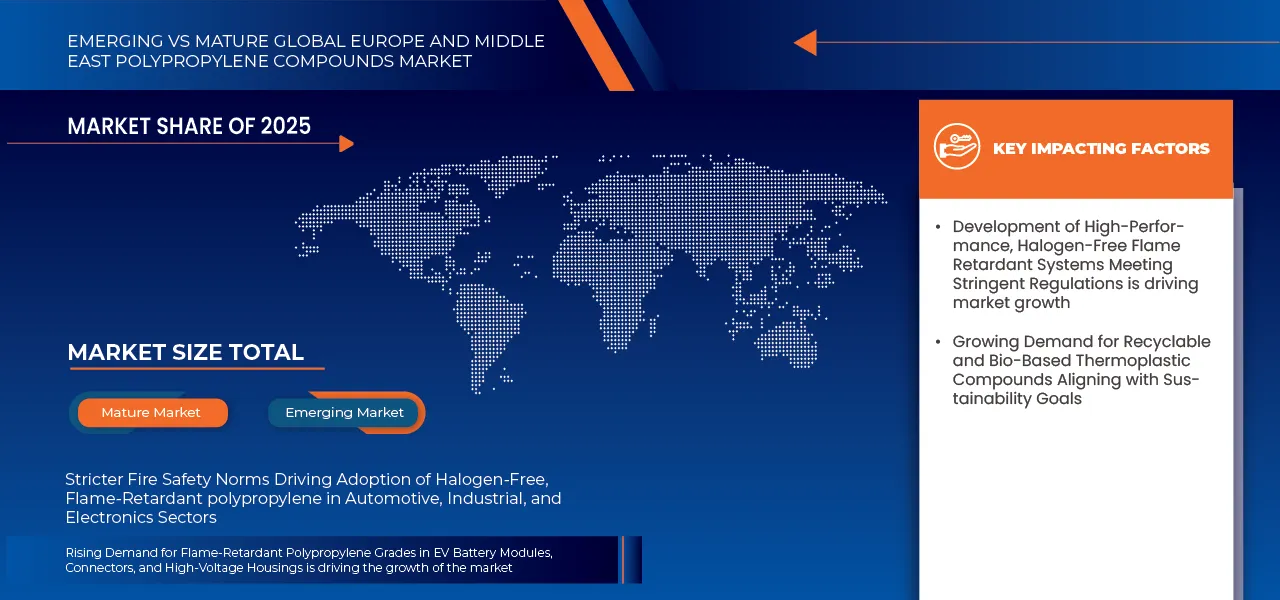
“Development of High-Performance, Halogen-Free Flame Retardant Systems Meeting Stringent Regulations”
- As environmental and safety regulations become more stringent, there is a substantial opportunity for manufacturers to innovate and develop advanced, halogen-free flame retardant (HFFR) systems for polypropylene compounds.
- Traditional halogenated flame retardants are falling out of favor due to the release of toxic dioxins and furans during combustion. The market is increasingly demanding safer alternatives that still provide a high level of fire protection. This has created a fertile ground for R&D into phosphorus-based, inorganic, and intumescent HFFR additives that can be compounded with polypropylene to meet the most stringent fire safety standards without compromising the polymer's mechanical and electrical properties.
- For instance, In April 2025, according to Modern Plastics Asia, Tosaf launched FR8719PP, a halogen-free flame retardant enabling sustainable PP solutions across construction, automotive, and packaging. It preserves impact strength, stability, and UV resistance even at low doses and avoids long-term migration issues.
- The demand for safer, more sustainable materials is a significant opportunity for innovation in flame-retardant systems. The opportunity lies in the development of high-performance, halogen-free solutions that meet strict regulations without sacrificing a material's key properties. For polypropylene compounders, this is not just about compliance but also about market leadership.
Restraint/Challenge
“Balancing Flame Retardancy with Mechanical Strength and Processability for Multifunctional Applications”
- A significant challenge in the polypropylene compounds market is the complex trade-off between achieving high flame retardancy and maintaining a material's essential mechanical properties and processability.
- The very additives that impart flame resistance can sometimes negatively impact the polymer's strength, stiffness, or ductility. This can make it difficult for compounders to create a single material that meets all the demanding requirements of multifunctional applications, such as a structural component that must also be flame-retardant and easily molded. The task of finding the right balance is a delicate one, requiring sophisticated R&D and formulation expertise.
- For Instance- In February 2025, according to Polymer Engineering & Science, a case study on FR-PP for electronics reveals that adding phosphorus-based flame retardants increased the melt viscosity by over 30%, requiring higher processing temperatures that risk thermal degradation—highlighting trade-offs between processability and safety.
- The inherent conflict between flame retardancy and mechanical performance is a key challenge that prevents polypropylene compounds from becoming a universal solution for all applications. It requires a delicate balancing act to create materials that are safe, strong, and easy to process.
- This is a constant area of focus for R&D departments in the polymer industry. The ability to successfully overcome this challenge will determine which companies can capture the most valuable and demanding applications, particularly in the fast-growing electric vehicle and electronics sectors.
Europe Polypropylene Compounds Market Scope
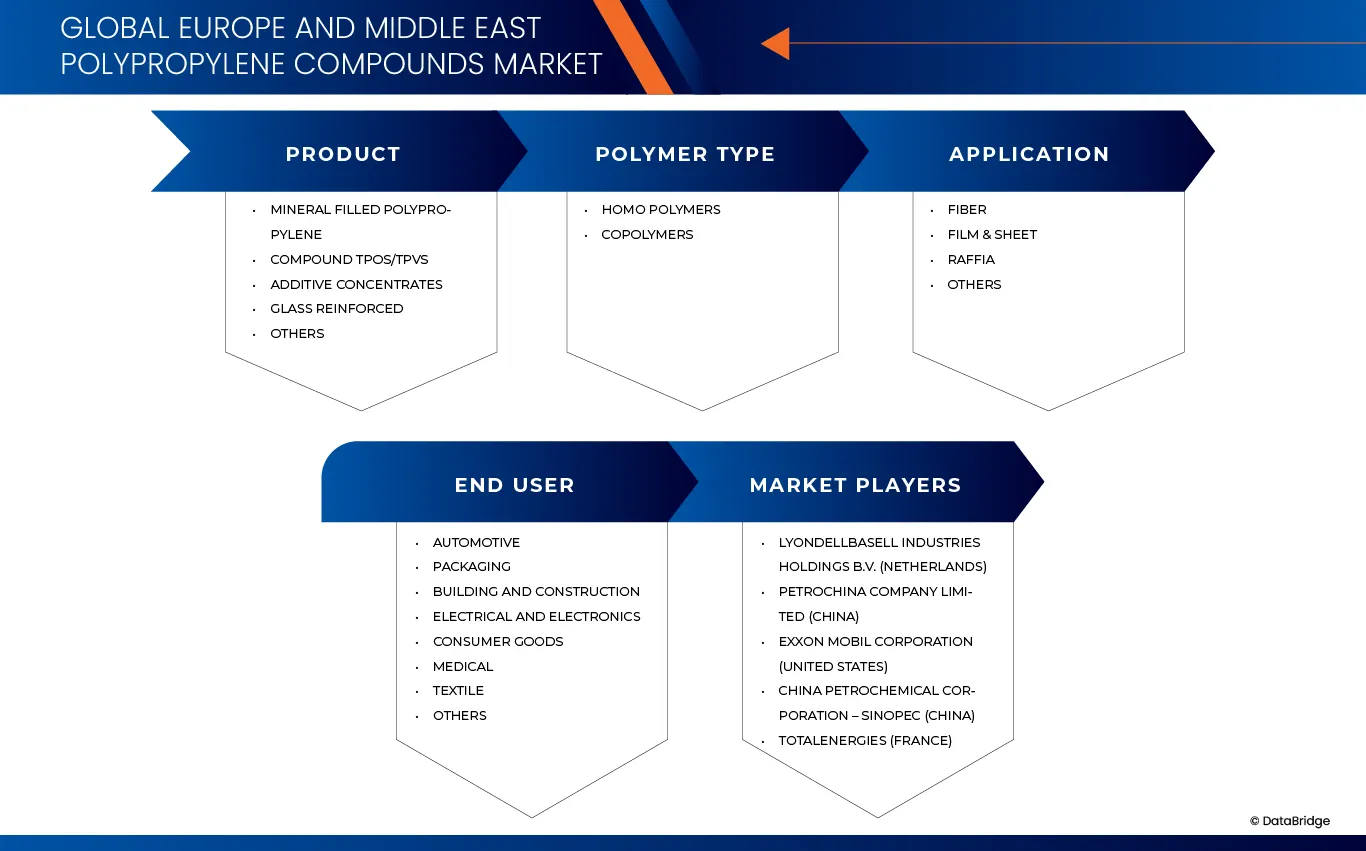
The Europe polypropylene compounds market is segmented into four notable segments based on product, polymer type, application, and end use.
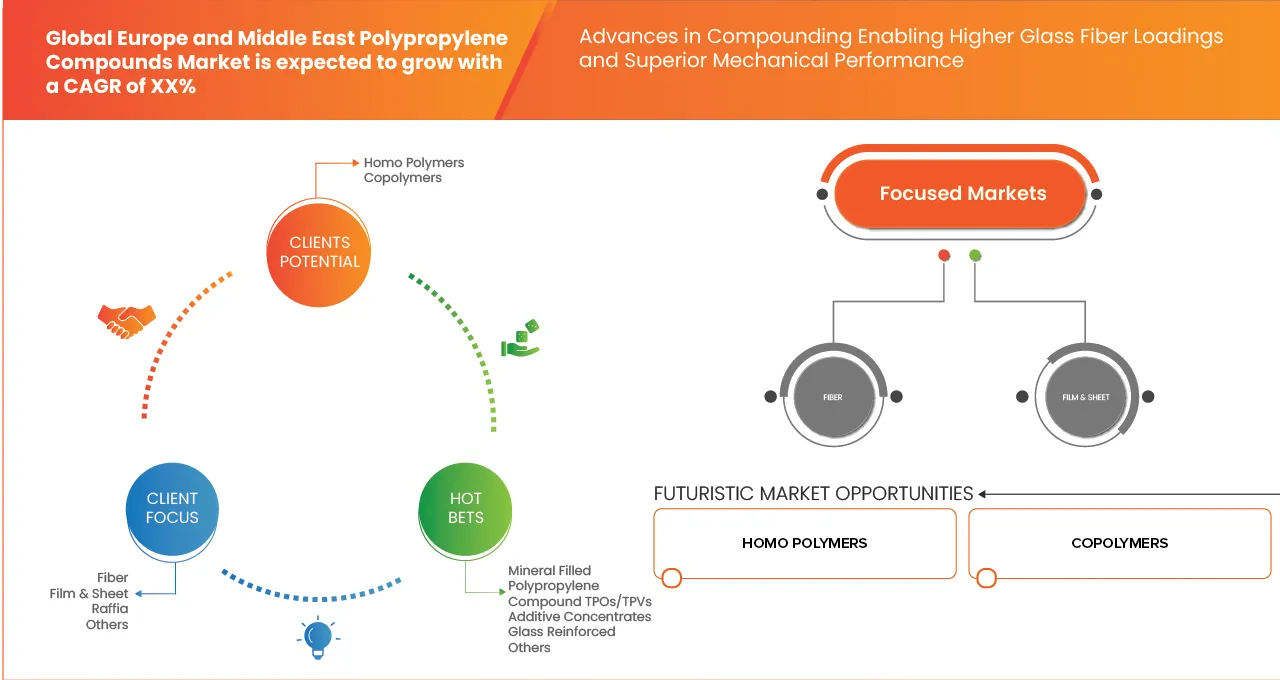
- By Product
On the basis of product, the market is segmented into mineral filled polypropylene, compound TPOs/TPVs, additive concentrates, glass reinforced, and others. In 2026, the mineral filled polypropylene segment is expected to dominate the market with a 43.34% market share.
Mineral filled polypropylene segment is also expected to register the highest CAGR of 4.78% due to its high mechanical stiffness, thermal stability, low-temperature properties, and good dimensional stability over a wide temperature range. Available as a natural colored, colorable, UV-stabilized compound
- By Polymer Type
On the basis of polymer type, the market is segmented into homopolymers and copolymers. In 2026, the homopolymers segment is expected to dominate the market with a 76.01% market share.
Homopolymer segment is also expected to register the highest CAGR of 4.92% due to its high strength-to-weight ratio, excellent chemical resistance, high performance in thermoforming and corrosive environments, no moisture absorption, resist most acids, alkalis, degreasing agents, and organic solvents, good weldability, lightweight, and non-toxic and non-staining
- By Application
On the basis of application, the market is segmented into fiber, film & sheet, raffia, and others. In 2026, the fiber segment is expected to dominate the market with a 40.37% market share.
Fiber segment is also expected to register the highest CAGR of 5.09% due to its more cost effectiveness, fast, and easy-to-use alternative to mesh as a reinforcement method. It poses lower thermal conductivity than other fibers. Increased impact resistance while preventing erosion. Reduces the formation of retraction and contraction cracks.
- By End Use
On the basis of end use, the market is segmented into automotive, packaging, building and construction, electrical and electronics, consumer goods, medical, textile, and others. In 2026, the automotive segment is expected to dominate the market with a 35.98% market share.
Automotive segment is also expected to register the highest CAGR of 5.33% due to its low cost but has out- standing mechanical properties and moldability, it accounts for more than half of all the plastic materials used in automobiles. PP compounds are used for a variety of parts, including bumper facias, instrumental panels and door trims
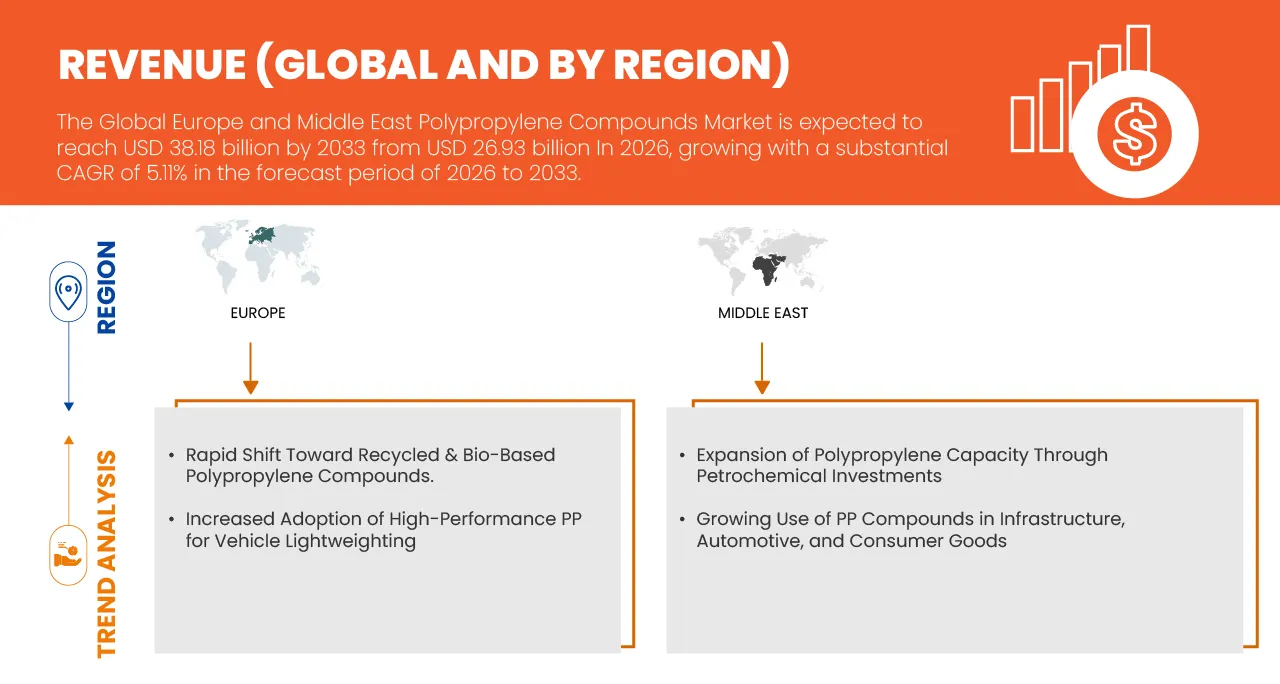
Europe Polypropylene Compounds Market Regional Analysis
The Europe polypropylene compounds market is experiencing steady and strong growth, driven by the rising adoption of lightweight and high-performance materials across automotive, electrical & electronics, industrial equipment, and packaging sectors. The region’s stringent environmental regulations, including EU directives promoting recyclability, carbon reduction, and circular economy practices, are accelerating the shift toward advanced PP compounds—particularly recycled, bio-based, and mineral-filled grades. Countries such as Germany, France, the UK, and Italy are witnessing robust demand due to expanding automotive production, growing electric vehicle manufacturing, and increasing investment in sustainable packaging solutions. Additionally, advancements in compounding technologies, reinforcement techniques, and polymer modification are enabling manufacturers to achieve superior mechanical strength, thermal stability, and design flexibility, further strengthening the regional market outlook.
Germany polypropylene compounds market Insights
Germany represents one of the most influential and high-growth markets within Europe’s polypropylene compounds industry, supported by a strong manufacturing base and rapid technological advancements. The market is expanding at a robust CAGR of 5.51% from 2026 to 2033. Growth is primarily driven by the country’s dominant automotive sector, where polypropylene compounds are widely used for lightweighting applications in bumpers, interior trims, dashboards, battery housings, and under-the-hood components. Germany’s accelerating shift toward electric vehicles (EVs), combined with stringent CO₂ emission norms, is further boosting demand for high-performance PP compounds that offer improved structural rigidity, heat resistance, and recyclability.
Europe Polypropylene Compounds Market share
The polypropylene compounds industry is primarily led by well-established companies, including:
- LyondellBasell Industries Holdings B.V. (Netherlands)
- PetroChina Company Limited (China)
- Exxon Mobil Corporation (United States)
- China Petrochemical Corporation – SINOPEC (China)
- TotalEnergies (France)
- Borealis GmbH (Austria)
- SABIC (Saudi Arabia)
- Sasol (South Africa)
- Reliance Industries Limited (India)
- Mitsubishi Chemical Group Corporation (Japan)
- Avient Corporation (United States)
- BASF (Germany)
- Celanese Corporation (United States)
- Trinseo (United States)
- Repsol (Spain)
Latest Developments in Europe Polypropylene Compounds Market
- In May 2023, LyondellBasell announced that Alujain National Industrial Company (Alujain) has chosen LyondellBasell polypropylene process technology for a new Spherizone process technology line. National Petrochemical Industrial Co. (NatPet), which operates a Spheripol process technology line, is owned by Alujain. This technological leadership is a critical facilitator of growth.
- In December 2022, Exxon Mobil Corporation has announced the successful launch of its new polypropylene manufacturing unit at its Polyolefins Plant in Baton Rouge, Louisiana. The facility expands Gulf Coast polypropylene manufacturing capacity by 450,000 metric tons per year, satisfying rising demand for high-performance, lightweight, and durable polymers, notably for automobile parts that enhance fuel economy and decrease vehicle emissions. This enables the organization to expand both output and income.
- In November 2022, Avient Corporation has expanded its Gravi-Tech density modified line with the inclusion of additional high-impact polypropylene (PP) based grades. The unique hybrid product technology is designed to replace die-cast or machined metals in premium brand high-impact applications, delivering both the look and weighted feel of metal. This includes increased metallic surface finishes and handles for personal, oral, skin, and cosmetic products to provide aesthetic appeal and value.
- In 0ctober 2021, BASF SE has broadened the color spectrum of its Neopolen expanded polypropylene foam (EPP). The new color grade is distinguished by a deep light blue and compliments BASF's EPP's current spectrum of four brilliant hues signal red, azure blue, dark green, and sunny yellow. The new color grade essentially eliminates color limitations in a wide range of applications.
- In June 2023, Borealis has agreed to acquire Rialti, one of Europe's top manufacturers of mechanically recovered polypropylene (PP) compounds for injection moulding and extrusion. The project will expand Borealis' circular range by adding 50,000 tonnes of recycled compounding capacity and satisfying rising customer demand for environmentally friendly solutions.
SKU-

- Interactive Data Analysis Dashboard
- Company Analysis Dashboard for high growth potential opportunities
- Research Analyst Access for customization & queries
- Competitor Analysis with Interactive dashboard
- Latest News, Updates & Trend analysis
- Harness the Power of Benchmark Analysis for Comprehensive Competitor Tracking
Table of Content
1 INTRODUCTION
1.1 OBJECTIVES OF THE STUDY
1.2 MARKET DEFINITION
1.3 OVERVIEW
1.4 LIMITATIONS
1.5 MARKETS COVERED
2 MARKET SEGMENTATION
2.1 MARKETS COVERED
2.2 GEOGRAPHICAL SCOPE
2.3 YEARS CONSIDERED FOR THE STUDY
2.4 CURRENCY AND PRICING
2.5 DBMR TRIPOD DATA VALIDATION MODEL
2.6 PRODUCT LIFELINE CURVE
2.7 MULTIVARIATE MODELING
2.8 PRIMARY INTERVIEWS WITH KEY OPINION LEADERS
2.9 DBMR MARKET POSITION GRID
2.1 MARKET APPLICATION COVERAGE GRID
2.11 DBMR MARKET CHALLENGE MATRIX
2.12 DBMR VENDOR SHARE ANALYSIS
2.13 SECONDARY SOURCES
2.14 ASSUMPTIONS
3 EXECUTIVE SUMMARY
4 PREMIUM INSIGHTS
4.1 PORTER’S FIVE FORCES
4.2 PESTEL ANALYSIS
4.3 CLIMATE CHANGE SCENARIO
4.3.1 ENVIRONMENTAL CONCERNS
4.3.2 INDUSTRY RESPONSE
4.3.3 GOVERNMENT’S ROLE
4.3.4 ANALYST RECOMMENDATION
4.4 RAW MATERIAL COVERAGE
4.4.1 PROPYLENE
4.4.2 ADDITIVES
4.4.3 FILLERS
4.4.4 LUBRICANTS
4.4.5 FLAME RETARDANTS
4.4.6 ANTISTATIC AGENTS
4.5 SUPPLY CHAIN OF THE EUROPE AND MIDDLE EAST POLYPROPYLENE COMPOUNDS MARKET,
4.5.1 OVERVIEW:
4.5.2 IMPORTANCE OF LOGISTICS SERVICE PROVIDERS:
4.6 TECHNOLOGICAL ADVANCEMENT BY MANUFACTURERS
5 REGULATION COVERAGE
6 MARKET OVERVIEW
6.1 DRIVERS
6.1.1 GROWING USE OF LIGHTWEIGHT, GLASS FIBER-REINFORCED POLYPROPYLENE IN EV STRUCTURAL AND UNDER-THE-HOOD PARTS TO MEET EMISSION AND FUEL EFFICIENCY NORMS
6.1.2 RISING DEMAND FOR FLAME-RETARDANT POLYPROPYLENE GRADES IN EV BATTERY MODULES, CONNECTORS, AND HIGH-VOLTAGE HOUSINGS
6.1.3 STRICTER FIRE SAFETY NORMS DRIVING ADOPTION OF HALOGEN-FREE, FLAME-RETARDANT POLYPROPYLENE IN AUTOMOTIVE, INDUSTRIAL, AND ELECTRONICS SECTORS
6.1.4 ADVANCES IN COMPOUNDING ENABLING HIGHER GLASS FIBER LOADINGS AND SUPERIOR MECHANICAL PERFORMANCE
6.2 RESTRAINTS
6.2.1 VOLATILE RAW MATERIAL PRICES AND SUPPLY CHAIN CONSTRAINTS IMPACTING MARGINS AND PRODUCTION PLANNING
6.2.2 PERFORMANCE LIMITS IN EXTREME TEMPERATURES AND HARSH CHEMICAL ENVIRONMENTS RESTRICTING BROADER USAGE
6.3 OPPORTUNITIES
6.3.1 DEVELOPMENT OF HIGH-PERFORMANCE, HALOGEN-FREE FLAME RETARDANT SYSTEMS MEETING STRINGENT REGULATIONS
6.3.2 GROWING DEMAND FOR RECYCLABLE AND BIO-BASED THERMOPLASTIC COMPOUNDS ALIGNING WITH SUSTAINABILITY GOALS
6.3.3 EXPANSION OF BATTERY AND EV INFRASTRUCTURE CREATING NEW APPLICATION AREAS FOR ADVANCED POLYMERS
6.4 CHALLENGES
6.4.1 BALANCING FLAME RETARDANCY WITH MECHANICAL STRENGTH AND PROCESSABILITY FOR MULTIFUNCTIONAL APPLICATIONS
6.4.2 INTENSIFYING COMPETITION FROM ALTERNATIVE ENGINEERING PLASTICS AND COMPOSITES
7 EUROPE AND MIDDLE EAST POLYPROPYLENE COMPOUNDS MARKET, BY PRODUCT
7.1 OVERVIEW
7.2 MINERAL FILLED POLYPROPYLENE
7.3 COMPOUND TPOS/TPVS
7.4 ADDITIVE CONCENTRATES
7.5 GLASS REINFORCED
7.6 OTHERS
8 EUROPE AND MIDDLE EAST POLYPROPYLENE COMPOUNDS MARKET, BY POLYMER TYPE
8.1 OVERVIEW
8.2 HOMO POLYMERS
8.3 COPOLYMERS
8.3.1 IMPACT/BLOCK COPOLYMERS
8.3.2 RANDOM COPOLYMERS
9 EUROPE AND MIDDLE EAST POLYPROPYLENE COMPOUNDS MARKET, BY APPLICATION
9.1 OVERVIEW
9.2 FIBER
9.3 FILM & SHEET
9.4 RAFFIA
9.5 OTHERS
10 EUROPE AND MIDDLE EAST POLYPROPYLENE COMPOUNDS MARKET, BY END USE
10.1 OVERVIEW
10.2 AUTOMOTIVE
10.2.1 INTERNAL COMBUSTION ENGINE (ICE) VEHICLES
10.2.2 ELECTRICAL VEHICLES (EVS)
10.2.2.1 INTERIOR
10.2.2.2 EXTERIOR
10.2.2.3 UNDER THE HOOD COMPONENTS
10.2.2.4 CHASSIS
10.2.2.5 ELECTRICAL COMPONENTS
10.2.2.6 POWERTRAIN
10.2.2.7 OTHERS
10.3 PACKAGING
10.3.1 TRAYS & CONTAINERS
10.3.2 BOTTLES & JARS
10.3.3 BAGS
10.3.4 WRAPS & JARS
10.3.5 POUCHES
10.3.6 OTHERS
10.3.6.1 FOOD & BEVERAGE
10.3.6.2 PHARMACEUTICAL
10.3.6.3 PERSONAL CARE
10.3.6.4 INDUSTRIAL
10.3.6.5 CONSUMER GOODS
10.3.6.6 HOME CARE
10.3.6.7 OTHERS
10.4 BUILDING AND CONSTRUCTION
10.4.1 COMMERCIAL BUILDINGS
10.4.2 RESIDENTIAL BUILDINGS
10.4.2.1 PIPES
10.4.2.2 WINDOWS & DOORS
10.4.2.3 INSULATION MATERIALS
10.4.2.4 OTHERS
10.5 ELECTRICAL AND ELECTRONICS
10.5.1 HOUSEHOLD APPLIANCES
10.5.2 CONSUMER SMALL APPLIANCES
10.5.3 CONSUMER APPLIANCES
10.5.4 LIGHTING EQUIPMENT
10.5.5 OTHERS
10.6 CONSUMER GOODS
10.7 MEDICAL
10.7.1 MEDICAL DISPOSABLES
10.7.2 MEDICAL INSTRUMENTS & TOOLS
10.7.3 DRUG DELIVERY
10.7.4 PROSTHETICS
10.7.5 OTHERS
10.8 TEXTILE
10.9 OTHERS
11 EUROPE AND MIDDLE EAST POLYPROPYLENE COMPOUNDS, BY REGION
11.1 OVERVIEW
11.2 EUROPE
11.2.1 GERMANY
11.2.2 ITALY
11.2.3 FRANCE
11.2.4 U.K.
11.2.5 SPAIN
11.2.6 RUSSIA
11.2.7 TURKEY
11.2.8 BELGIUM
11.2.9 NETHERLANDS
11.2.10 SWEDEN
11.2.11 SWITZERLAND
11.2.12 DENMARK
11.2.13 FINLAND
11.2.14 REST OF EUROPE
11.3 MIDDLE EAST
11.3.1 SAUDI ARABIA
11.3.2 UNITED ARAB EMIRATES
11.3.3 EGYPT
11.3.4 ISRAEL
11.3.5 KUWAIT
11.3.6 OMAN
11.3.7 QATAR
11.3.8 BAHRAIN
11.3.9 REST OF MIDDLE EAST
12 EUROPE AND MIDDLE EAST POLYPROPYLENE COMPOUNDS MARKET, COMPANY LANDSCAPE
12.1 COMPANY SHARE ANALYSIS: EUROPE AND MIDDLE EAST
13 SWOT ANALYSIS
14 COMPANY PROFILE
14.1 LYONDELLBASELL INDUSTRIES HOLDINGS B.V.
14.1.1 COMPANY SNAPSHOT
14.1.2 REVENUE ANALYSIS
14.1.3 PRODUCT PORTFOLIO
14.1.4 RECENT DEVELOPMENT
14.2 PETROCHINA COMPANY LIMITED
14.2.1 COMPANY SNAPSHOT
14.2.2 REVENUE ANALYSIS
14.2.3 PRODUCT PORTFOLIO
14.2.4 RECENT DEVELOPMENT
14.3 EXXON MOBIL CORPORATION
14.3.1 COMPANY SNAPSHOT
14.3.2 REVENUE ANALYSIS
14.3.3 PRODUCT PORTFOLIO
14.3.4 RECENT DEVELOPMENT
14.4 CHINA PETROCHEMICAL CORPORATION (SINOPEC)
14.4.1 COMPANY SNAPSHOT
14.4.2 REVENUE ANALYSIS
14.4.3 PRODUCT PORTFOLIO
14.4.4 RECENT DEVELOPMENT
14.5 TOTALENERGIES
14.5.1 COMPANY SNAPSHOT
14.5.2 REVENUE ANALYSIS
14.5.3 PRODUCT PORTFOLIO
14.5.4 RECENT DEVELOPMENT
14.6 BOREALIS GMBH
14.6.1 COMPANY SNAPSHOT
14.6.2 REVENUE ANALYSIS
14.6.3 PRODUCT PORTFOLIO
14.6.4 RECENT DEVELOPMENT
14.7 SABIC
14.7.1 COMPANY SNAPSHOT
14.7.2 REVENUE ANALYSIS
14.7.3 PRODUCT PORTFOLIO
14.7.4 RECENT DEVELOPMENT
14.8 AVIENT CORPORATION
14.8.1 COMPANY SNAPSHOT
14.8.2 REVENUE ANALYSIS
14.8.3 PRODUCT PORTFOLIO
14.8.4 RECENT DEVELOPMENT
14.9 BASF
14.9.1 COMPANY SNAPSHOT
14.9.2 REVENUE ANALYSIS
14.9.3 PRODUCT PORTFOLIO
14.9.4 RECENT DEVELOPMENT
14.1 CELANESE CORPORATION
14.10.1 COMPANY SNAPSHOT
14.10.2 REVENUE ANALYSIS
14.10.3 PRODUCT PORTFOLIO
14.10.4 RECENT DEVELOPMENT
14.11 MITSUBISHI CHEMICAL GROUP CORPORATION.
14.11.1 COMPANY SNAPSHOT
14.11.2 REVENUE ANALYSIS
14.11.3 PRODUCT PORTFOLIO
14.11.4 RECENT DEVELOPMENT
14.12 RELIANCE INDUSTRIES LIMITED
14.12.1 COMPANY SNAPSHOT
14.12.2 REVENUE ANALYSIS
14.12.3 PRODUCT PORTFOLIO
14.12.4 RECENT DEVELOPMENT
14.13 REPSOL
14.13.1 COMPANY SNAPSHOT
14.13.2 REVENUE ANALYSIS
14.13.3 PRODUCT PORTFOLIO
14.13.4 RECENT DEVELOPMENT
14.14 SASOL
14.14.1 COMPANY SNAPSHOT
14.14.2 REVENUE ANALYSIS
14.14.3 PRODUCT PORTFOLIO
14.14.4 RECENT DEVELOPMENT
14.15 TRINSEO
14.15.1 COMPANY SNAPSHOT
14.15.2 REVENUE ANALYSIS
14.15.3 PRODUCT PORTFOLIO
14.15.4 RECENT DEVELOPMENT
15 QUESTIONNAIRE
16 RELATED REPORTS
List of Table
TABLE 1 REGULATORY COVERAGE
TABLE 2 EUROPE AND MIDDLE EAST POLYPROPYLENE COMPOUNDS MARKET, BY PRODUCT, 2018-2033 (USD THOUSAND)
TABLE 3 EUROPE AND MIDDLE EAST POLYPROPYLENE COMPOUNDS MARKET, BY POLYMER TYPE, 2018-2033 (USD THOUSAND)
TABLE 4 EUROPE AND MIDDLE EAST COPOLYMERS IN POLYPROPYLENE COMPOUNDS MARKET, BY TYPE, 2018-2033 (USD THOUSAND)
TABLE 5 EUROPE AND MIDDLE EAST POLYPROPYLENE COMPOUNDS MARKET, BY APPLICATION, 2018-2033 (USD THOUSAND)
TABLE 6 EUROPE AND MIDDLE EAST POLYPROPYLENE COMPOUNDS MARKET, BY END USE, 2018-2033 (USD THOUSAND)
TABLE 7 EUROPE AND MIDDLE EAST AUTOMOTIVE IN POLYPROPYLENE COMPOUNDS MARKET, BY VEHICLE TYPE, 2018-2033 (USD THOUSAND)
TABLE 8 EUROPE AND MIDDLE EAST AUTOMOTIVE IN POLYPROPYLENE COMPOUNDS MARKET, BY END USE, 2018-2033 (USD THOUSAND)
TABLE 9 EUROPE AND MIDDLE EAST PACKAGING IN POLYPROPYLENE COMPOUNDS MARKET, BY TYPE, 2018-2033 (USD THOUSAND)
TABLE 10 EUROPE AND MIDDLE EAST PACKAGING IN POLYPROPYLENE COMPOUNDS MARKET, BY END USE, 2018-2033 (USD THOUSAND)
TABLE 11 EUROPE AND MIDDLE EAST BUILDING AND CONSTRUCTION IN POLYPROPYLENE COMPOUNDS MARKET, BY TYPE, 2018-2033 (USD THOUSAND)
TABLE 12 EUROPE AND MIDDLE EAST BUILDING AND CONSTRUCTION IN POLYPROPYLENE COMPOUNDS MARKET, BY END USE, 2018-2033 (USD THOUSAND)
TABLE 13 EUROPE AND MIDDLE EAST ELECTRICAL AND ELECTRONICS IN POLYPROPYLENE COMPOUNDS MARKET, BY TYPE, 2018-2033 (USD THOUSAND)
TABLE 14 EUROPE AND MIDDLE EAST MEDICAL IN POLYPROPYLENE COMPOUNDS MARKET, BY TYPE, 2018-2033 (USD THOUSAND)
TABLE 15 EUROPE AND MIDDLE EAST POLYPROPYLENE COMPOUNDS MARKET, BY REGION, 2018-2033 (USD THOUSAND)
TABLE 16 EUROPE AND MIDDLE EAST POLYPROPYLENE COMPOUNDS MARKET, BY REGION, 2018-2033 (KILO TONS)
TABLE 17 EUROPE POLYPROPYLENE COMPOUNDS MARKET, 2018-2033
TABLE 18 EUROPE POLYPROPYLENE COMPOUNDS MARKET, BY COUNTRY, 2018-2033 (USD THOUSAND)
TABLE 19 EUROPE POLYPROPYLENE COMPOUNDS MARKET, BY PRODUCT, 2018-2033 (USD THOUSAND)
TABLE 20 EUROPE POLYPROPYLENE COMPOUNDS MARKET, BY POLYMER TYPE, 2018-2033 (USD THOUSAND)
TABLE 21 EUROPE COPOLYMERS IN POLYPROPYLENE COMPOUNDS MARKET, BY TYPE, 2018-2033 (USD THOUSAND)
TABLE 22 EUROPE POLYPROPYLENE COMPOUNDS MARKET, BY APPLICATION, 2018-2033 (USD THOUSAND)
TABLE 23 EUROPE POLYPROPYLENE COMPOUNDS MARKET, BY END USE, 2018-2033 (USD THOUSAND)
TABLE 24 EUROPE PACKAGING IN POLYPROPYLENE COMPOUNDS MARKET, BY TYPE, 2018-2033 (USD THOUSAND)
TABLE 25 EUROPE PACKAGING IN POLYPROPYLENE COMPOUNDS MARKET, BY END USE, 2018-2033 (USD THOUSAND)
TABLE 26 EUROPE AUTOMOTIVE IN POLYPROPYLENE COMPOUNDS MARKET, BY VEHICLE TYPE, 2018-2033 (USD THOUSAND)
TABLE 27 EUROPE AUTOMOTIVE IN POLYPROPYLENE COMPOUNDS MARKET, BY END USE, 2018-2033 (USD THOUSAND)
TABLE 28 EUROPE BUILDING AND CONSTRUCTION IN POLYPROPYLENE COMPOUNDS MARKET, BY TYPE, 2018-2033 (USD THOUSAND)
TABLE 29 EUROPE BUILDING AND CONSTRUCTION IN POLYPROPYLENE COMPOUNDS MARKET, BY END USE, 2018-2033 (USD THOUSAND)
TABLE 30 EUROPE MEDICAL IN POLYPROPYLENE COMPOUNDS MARKET, BY TYPE, 2018-2033 (USD THOUSAND)
TABLE 31 EUROPE ELECTRICAL AND ELECTRONICS IN POLYPROPYLENE COMPOUNDS MARKET, BY TYPE, 2018-2033 (USD THOUSAND)
TABLE 32 GERMANY POLYPROPYLENE COMPOUNDS MARKET, BY PRODUCT, 2018-2033 (USD THOUSAND)
TABLE 33 GERMANY POLYPROPYLENE COMPOUNDS MARKET, BY POLYMER TYPE, 2018-2033 (USD THOUSAND)
TABLE 34 GERMANY COPOLYMERS IN POLYPROPYLENE COMPOUNDS MARKET, BY TYPE, 2018-2033 (USD THOUSAND)
TABLE 35 GERMANY POLYPROPYLENE COMPOUNDS MARKET, BY APPLICATION, 2018-2033 (USD THOUSAND)
TABLE 36 GERMANY POLYPROPYLENE COMPOUNDS MARKET, BY END USE, 2018-2033 (USD THOUSAND)
TABLE 37 GERMANY PACKAGING IN POLYPROPYLENE COMPOUNDS MARKET, BY TYPE, 2018-2033 (USD THOUSAND)
TABLE 38 GERMANY PACKAGING IN POLYPROPYLENE COMPOUNDS MARKET, BY END USE, 2018-2033 (USD THOUSAND)
TABLE 39 GERMANY AUTOMOTIVE IN POLYPROPYLENE COMPOUNDS MARKET, BY VEHICLE TYPE, 2018-2033 (USD THOUSAND)
TABLE 40 GERMANY AUTOMOTIVE IN POLYPROPYLENE COMPOUNDS MARKET, BY END USE, 2018-2033 (USD THOUSAND)
TABLE 41 GERMANY BUILDING AND CONSTRUCTION IN POLYPROPYLENE COMPOUNDS MARKET, BY TYPE, 2018-2033 (USD THOUSAND)
TABLE 42 GERMANY BUILDING AND CONSTRUCTION IN POLYPROPYLENE COMPOUNDS MARKET, BY END USE, 2018-2033 (USD THOUSAND)
TABLE 43 GERMANY MEDICAL IN POLYPROPYLENE COMPOUNDS MARKET, BY TYPE, 2018-2033 (USD THOUSAND)
TABLE 44 GERMANY ELECTRICAL AND ELECTRONICS IN POLYPROPYLENE COMPOUNDS MARKET, BY TYPE, 2018-2033 (USD THOUSAND)
TABLE 45 ITALY POLYPROPYLENE COMPOUNDS MARKET, BY PRODUCT, 2018-2033 (USD THOUSAND)
TABLE 46 ITALY POLYPROPYLENE COMPOUNDS MARKET, BY POLYMER TYPE, 2018-2033 (USD THOUSAND)
TABLE 47 ITALY COPOLYMERS IN POLYPROPYLENE COMPOUNDS MARKET, BY TYPE, 2018-2033 (USD THOUSAND)
TABLE 48 ITALY POLYPROPYLENE COMPOUNDS MARKET, BY APPLICATION, 2018-2033 (USD THOUSAND)
TABLE 49 ITALY POLYPROPYLENE COMPOUNDS MARKET, BY END USE, 2018-2033 (USD THOUSAND)
TABLE 50 ITALY PACKAGING IN POLYPROPYLENE COMPOUNDS MARKET, BY TYPE, 2018-2033 (USD THOUSAND)
TABLE 51 ITALY PACKAGING IN POLYPROPYLENE COMPOUNDS MARKET, BY END USE, 2018-2033 (USD THOUSAND)
TABLE 52 ITALY AUTOMOTIVE IN POLYPROPYLENE COMPOUNDS MARKET, BY VEHICLE TYPE, 2018-2033 (USD THOUSAND)
TABLE 53 ITALY AUTOMOTIVE IN POLYPROPYLENE COMPOUNDS MARKET, BY END USE, 2018-2033 (USD THOUSAND)
TABLE 54 ITALY BUILDING AND CONSTRUCTION IN POLYPROPYLENE COMPOUNDS MARKET, BY TYPE, 2018-2033 (USD THOUSAND)
TABLE 55 ITALY BUILDING AND CONSTRUCTION IN POLYPROPYLENE COMPOUNDS MARKET, BY END USE, 2018-2033 (USD THOUSAND)
TABLE 56 ITALY MEDICAL IN POLYPROPYLENE COMPOUNDS MARKET, BY TYPE, 2018-2033 (USD THOUSAND)
TABLE 57 ITALY ELECTRICAL AND ELECTRONICS IN POLYPROPYLENE COMPOUNDS MARKET, BY TYPE, 2018-2033 (USD THOUSAND)
TABLE 58 FRANCE POLYPROPYLENE COMPOUNDS MARKET, BY PRODUCT, 2018-2033 (USD THOUSAND)
TABLE 59 RANCE POLYPROPYLENE COMPOUNDS MARKET, BY POLYMER TYPE, 2018-2033 (USD THOUSAND)
TABLE 60 FRANCE COPOLYMERS IN POLYPROPYLENE COMPOUNDS MARKET, BY TYPE, 2018-2033 (USD THOUSAND)
TABLE 61 FRANCE POLYPROPYLENE COMPOUNDS MARKET, BY APPLICATION, 2018-2033 (USD THOUSAND)
TABLE 62 FRANCE POLYPROPYLENE COMPOUNDS MARKET, BY END USE, 2018-2033 (USD THOUSAND)
TABLE 63 FRANCE PACKAGING IN POLYPROPYLENE COMPOUNDS MARKET, BY TYPE, 2018-2033 (USD THOUSAND)
TABLE 64 FRANCE PACKAGING IN POLYPROPYLENE COMPOUNDS MARKET, BY END USE, 2018-2033 (USD THOUSAND)
TABLE 65 FRANCE AUTOMOTIVE IN POLYPROPYLENE COMPOUNDS MARKET, BY VEHICLE TYPE, 2018-2033 (USD THOUSAND)
TABLE 66 FRANCE AUTOMOTIVE IN POLYPROPYLENE COMPOUNDS MARKET, BY END USE, 2018-2033 (USD THOUSAND)
TABLE 67 FRANCE BUILDING AND CONSTRUCTION IN POLYPROPYLENE COMPOUNDS MARKET, BY TYPE, 2018-2033 (USD THOUSAND)
TABLE 68 FRANCE BUILDING AND CONSTRUCTION IN POLYPROPYLENE COMPOUNDS MARKET, BY END USE, 2018-2033 (USD THOUSAND)
TABLE 69 FRANCE MEDICAL IN POLYPROPYLENE COMPOUNDS MARKET, BY TYPE, 2018-2033 (USD THOUSAND)
TABLE 70 FRANCE ELECTRICAL AND ELECTRONICS IN POLYPROPYLENE COMPOUNDS MARKET, BY TYPE, 2018-2033 (USD THOUSAND)
TABLE 71 U.K. POLYPROPYLENE COMPOUNDS MARKET, BY PRODUCT, 2018-2033 (USD THOUSAND)
TABLE 72 U.K. POLYPROPYLENE COMPOUNDS MARKET, BY POLYMER TYPE, 2018-2033 (USD THOUSAND)
TABLE 73 U.K. COPOLYMERS IN POLYPROPYLENE COMPOUNDS MARKET, BY TYPE, 2018-2033 (USD THOUSAND)
TABLE 74 U.K. POLYPROPYLENE COMPOUNDS MARKET, BY APPLICATION, 2018-2033 (USD THOUSAND)
TABLE 75 U.K. POLYPROPYLENE COMPOUNDS MARKET, BY END USE, 2018-2033 (USD THOUSAND)
TABLE 76 U.K. PACKAGING IN POLYPROPYLENE COMPOUNDS MARKET, BY TYPE, 2018-2033 (USD THOUSAND)
TABLE 77 U.K. PACKAGING IN POLYPROPYLENE COMPOUNDS MARKET, BY END USE, 2018-2033 (USD THOUSAND)
TABLE 78 U.K. AUTOMOTIVE IN POLYPROPYLENE COMPOUNDS MARKET, BY VEHICLE TYPE, 2018-2033 (USD THOUSAND)
TABLE 79 U.K. AUTOMOTIVE IN POLYPROPYLENE COMPOUNDS MARKET, BY END USE, 2018-2033 (USD THOUSAND)
TABLE 80 U.K. BUILDING AND CONSTRUCTION IN POLYPROPYLENE COMPOUNDS MARKET, BY TYPE, 2018-2033 (USD THOUSAND)
TABLE 81 U.K. BUILDING AND CONSTRUCTION IN POLYPROPYLENE COMPOUNDS MARKET, BY END USE, 2018-2033 (USD THOUSAND)
TABLE 82 U.K. MEDICAL IN POLYPROPYLENE COMPOUNDS MARKET, BY TYPE, 2018-2033 (USD THOUSAND)
TABLE 83 U.K. ELECTRICAL AND ELECTRONICS IN POLYPROPYLENE COMPOUNDS MARKET, BY TYPE, 2018-2033 (USD THOUSAND)
TABLE 84 SPAIN POLYPROPYLENE COMPOUNDS MARKET, BY PRODUCT, 2018-2033 (USD THOUSAND)
TABLE 85 SPAIN POLYPROPYLENE COMPOUNDS MARKET, BY POLYMER TYPE, 2018-2033 (USD THOUSAND)
TABLE 86 SPAIN COPOLYMERS IN POLYPROPYLENE COMPOUNDS MARKET, BY TYPE, 2018-2033 (USD THOUSAND)
TABLE 87 SPAIN POLYPROPYLENE COMPOUNDS MARKET, BY APPLICATION, 2018-2033 (USD THOUSAND)
TABLE 88 SPAIN POLYPROPYLENE COMPOUNDS MARKET, BY END USE, 2018-2033 (USD THOUSAND)
TABLE 89 SPAIN PACKAGING IN POLYPROPYLENE COMPOUNDS MARKET, BY TYPE, 2018-2033 (USD THOUSAND)
TABLE 90 SPAIN PACKAGING IN POLYPROPYLENE COMPOUNDS MARKET, BY END USE, 2018-2033 (USD THOUSAND)
TABLE 91 SPAIN AUTOMOTIVE IN POLYPROPYLENE COMPOUNDS MARKET, BY VEHICLE TYPE, 2018-2033 (USD THOUSAND)
TABLE 92 SPAIN AUTOMOTIVE IN POLYPROPYLENE COMPOUNDS MARKET, BY END USE, 2018-2033 (USD THOUSAND)
TABLE 93 SPAIN BUILDING AND CONSTRUCTION IN POLYPROPYLENE COMPOUNDS MARKET, BY TYPE, 2018-2033 (USD THOUSAND)
TABLE 94 SPAIN BUILDING AND CONSTRUCTION IN POLYPROPYLENE COMPOUNDS MARKET, BY END USE, 2018-2033 (USD THOUSAND)
TABLE 95 SPAIN MEDICAL IN POLYPROPYLENE COMPOUNDS MARKET, BY TYPE, 2018-2033 (USD THOUSAND)
TABLE 96 SPAIN ELECTRICAL AND ELECTRONICS IN POLYPROPYLENE COMPOUNDS MARKET, BY TYPE, 2018-2033 (USD THOUSAND)
TABLE 97 RUSSIA POLYPROPYLENE COMPOUNDS MARKET, BY PRODUCT, 2018-2033 (USD THOUSAND)
TABLE 98 RUSSIA POLYPROPYLENE COMPOUNDS MARKET, BY POLYMER TYPE, 2018-2033 (USD THOUSAND)
TABLE 99 RUSSIA COPOLYMERS IN POLYPROPYLENE COMPOUNDS MARKET, BY TYPE, 2018-2033 (USD THOUSAND)
TABLE 100 RUSSIA POLYPROPYLENE COMPOUNDS MARKET, BY APPLICATION, 2018-2033 (USD THOUSAND)
TABLE 101 RUSSIA POLYPROPYLENE COMPOUNDS MARKET, BY END USE, 2018-2033 (USD THOUSAND)
TABLE 102 RUSSIA PACKAGING IN POLYPROPYLENE COMPOUNDS MARKET, BY TYPE, 2018-2033 (USD THOUSAND)
TABLE 103 RUSSIA PACKAGING IN POLYPROPYLENE COMPOUNDS MARKET, BY END USE, 2018-2033 (USD THOUSAND)
TABLE 104 RUSSIA AUTOMOTIVE IN POLYPROPYLENE COMPOUNDS MARKET, BY VEHICLE TYPE, 2018-2033 (USD THOUSAND)
TABLE 105 RUSSIA AUTOMOTIVE IN POLYPROPYLENE COMPOUNDS MARKET, BY END USE, 2018-2033 (USD THOUSAND)
TABLE 106 RUSSIA BUILDING AND CONSTRUCTION IN POLYPROPYLENE COMPOUNDS MARKET, BY TYPE, 2018-2033 (USD THOUSAND)
TABLE 107 RUSSIA BUILDING AND CONSTRUCTION IN POLYPROPYLENE COMPOUNDS MARKET, BY END USE, 2018-2033 (USD THOUSAND)
TABLE 108 RUSSIA MEDICAL IN POLYPROPYLENE COMPOUNDS MARKET, BY TYPE, 2018-2033 (USD THOUSAND)
TABLE 109 RUSSIA ELECTRICAL AND ELECTRONICS IN POLYPROPYLENE COMPOUNDS MARKET, BY TYPE, 2018-2033 (USD THOUSAND)
TABLE 110 TURKEY POLYPROPYLENE COMPOUNDS MARKET, BY PRODUCT, 2018-2033 (USD THOUSAND)
TABLE 111 TURKEY POLYPROPYLENE COMPOUNDS MARKET, BY POLYMER TYPE, 2018-2033 (USD THOUSAND)
TABLE 112 TURKEY COPOLYMERS IN POLYPROPYLENE COMPOUNDS MARKET, BY TYPE, 2018-2033 (USD THOUSAND)
TABLE 113 TURKEY POLYPROPYLENE COMPOUNDS MARKET, BY APPLICATION, 2018-2033 (USD THOUSAND)
TABLE 114 TURKEY POLYPROPYLENE COMPOUNDS MARKET, BY END USE, 2018-2033 (USD THOUSAND)
TABLE 115 TURKEY PACKAGING IN POLYPROPYLENE COMPOUNDS MARKET, BY TYPE, 2018-2033 (USD THOUSAND)
TABLE 116 TURKEY PACKAGING IN POLYPROPYLENE COMPOUNDS MARKET, BY END USE, 2018-2033 (USD THOUSAND)
TABLE 117 TURKEY AUTOMOTIVE IN POLYPROPYLENE COMPOUNDS MARKET, BY VEHICLE TYPE, 2018-2033 (USD THOUSAND)
TABLE 118 TURKEY AUTOMOTIVE IN POLYPROPYLENE COMPOUNDS MARKET, BY END USE, 2018-2033 (USD THOUSAND)
TABLE 119 TURKEY BUILDING AND CONSTRUCTION IN POLYPROPYLENE COMPOUNDS MARKET, BY TYPE, 2018-2033 (USD THOUSAND)
TABLE 120 TURKEY BUILDING AND CONSTRUCTION IN POLYPROPYLENE COMPOUNDS MARKET, BY END USE, 2018-2033 (USD THOUSAND)
TABLE 121 TURKEY MEDICAL IN POLYPROPYLENE COMPOUNDS MARKET, BY TYPE, 2018-2033 (USD THOUSAND)
TABLE 122 TURKEY ELECTRICAL AND ELECTRONICS IN POLYPROPYLENE COMPOUNDS MARKET, BY TYPE, 2018-2033 (USD THOUSAND)
TABLE 123 BELGIUM POLYPROPYLENE COMPOUNDS MARKET, BY PRODUCT, 2018-2033 (USD THOUSAND)
TABLE 124 BELGIUM POLYPROPYLENE COMPOUNDS MARKET, BY POLYMER TYPE, 2018-2033 (USD THOUSAND)
TABLE 125 BELGIUM COPOLYMERS IN POLYPROPYLENE COMPOUNDS MARKET, BY TYPE, 2018-2033 (USD THOUSAND)
TABLE 126 BELGIUM POLYPROPYLENE COMPOUNDS MARKET, BY APPLICATION, 2018-2033 (USD THOUSAND)
TABLE 127 BELGIUM POLYPROPYLENE COMPOUNDS MARKET, BY END USE, 2018-2033 (USD THOUSAND)
TABLE 128 BELGIUM PACKAGING IN POLYPROPYLENE COMPOUNDS MARKET, BY TYPE, 2018-2033 (USD THOUSAND)
TABLE 129 BELGIUM PACKAGING IN POLYPROPYLENE COMPOUNDS MARKET, BY END USE, 2018-2033 (USD THOUSAND)
TABLE 130 BELGIUM AUTOMOTIVE IN POLYPROPYLENE COMPOUNDS MARKET, BY VEHICLE TYPE, 2018-2033 (USD THOUSAND)
TABLE 131 BELGIUM AUTOMOTIVE IN POLYPROPYLENE COMPOUNDS MARKET, BY END USE, 2018-2033 (USD THOUSAND)
TABLE 132 BELGIUM BUILDING AND CONSTRUCTION IN POLYPROPYLENE COMPOUNDS MARKET, BY TYPE, 2018-2033 (USD THOUSAND)
TABLE 133 BELGIUM BUILDING AND CONSTRUCTION IN POLYPROPYLENE COMPOUNDS MARKET, BY END USE, 2018-2033 (USD THOUSAND)
TABLE 134 BELGIUM MEDICAL IN POLYPROPYLENE COMPOUNDS MARKET, BY TYPE, 2018-2033 (USD THOUSAND)
TABLE 135 BELGIUM ELECTRICAL AND ELECTRONICS IN POLYPROPYLENE COMPOUNDS MARKET, BY TYPE, 2018-2033 (USD THOUSAND)
TABLE 136 NETHERLANDS POLYPROPYLENE COMPOUNDS MARKET, BY PRODUCT, 2018-2033 (USD THOUSAND)
TABLE 137 NETHERLANDS POLYPROPYLENE COMPOUNDS MARKET, BY POLYMER TYPE, 2018-2033 (USD THOUSAND)
TABLE 138 NETHERLANDS COPOLYMERS IN POLYPROPYLENE COMPOUNDS MARKET, BY TYPE, 2018-2033 (USD THOUSAND)
TABLE 139 NETHERLANDS POLYPROPYLENE COMPOUNDS MARKET, BY APPLICATION, 2018-2033 (USD THOUSAND)
TABLE 140 NETHERLANDS POLYPROPYLENE COMPOUNDS MARKET, BY END USE, 2018-2033 (USD THOUSAND)
TABLE 141 NETHERLANDS PACKAGING IN POLYPROPYLENE COMPOUNDS MARKET, BY TYPE, 2018-2033 (USD THOUSAND)
TABLE 142 NETHERLANDS PACKAGING IN POLYPROPYLENE COMPOUNDS MARKET, BY END USE, 2018-2033 (USD THOUSAND)
TABLE 143 NETHERLANDS AUTOMOTIVE IN POLYPROPYLENE COMPOUNDS MARKET, BY VEHICLE TYPE, 2018-2033 (USD THOUSAND)
TABLE 144 NETHERLANDS AUTOMOTIVE IN POLYPROPYLENE COMPOUNDS MARKET, BY END USE, 2018-2033 (USD THOUSAND)
TABLE 145 NETHERLANDS BUILDING AND CONSTRUCTION IN POLYPROPYLENE COMPOUNDS MARKET, BY TYPE, 2018-2033 (USD THOUSAND)
TABLE 146 NETHERLANDS BUILDING AND CONSTRUCTION IN POLYPROPYLENE COMPOUNDS MARKET, BY END USE, 2018-2033 (USD THOUSAND)
TABLE 147 NETHERLANDS MEDICAL IN POLYPROPYLENE COMPOUNDS MARKET, BY TYPE, 2018-2033 (USD THOUSAND)
TABLE 148 NETHERLANDS ELECTRICAL AND ELECTRONICS IN POLYPROPYLENE COMPOUNDS MARKET, BY TYPE, 2018-2033 (USD THOUSAND)
TABLE 149 SWEDEN POLYPROPYLENE COMPOUNDS MARKET, BY PRODUCT, 2018-2033 (USD THOUSAND)
TABLE 150 SWEDEN POLYPROPYLENE COMPOUNDS MARKET, BY POLYMER TYPE, 2018-2033 (USD THOUSAND)
TABLE 151 SWEDEN COPOLYMERS IN POLYPROPYLENE COMPOUNDS MARKET, BY TYPE, 2018-2033 (USD THOUSAND)
TABLE 152 SWEDEN POLYPROPYLENE COMPOUNDS MARKET, BY APPLICATION, 2018-2033 (USD THOUSAND)
TABLE 153 SWEDEN POLYPROPYLENE COMPOUNDS MARKET, BY END USE, 2018-2033 (USD THOUSAND)
TABLE 154 SWEDEN PACKAGING IN POLYPROPYLENE COMPOUNDS MARKET, BY TYPE, 2018-2033 (USD THOUSAND)
TABLE 155 SWEDEN PACKAGING IN POLYPROPYLENE COMPOUNDS MARKET, BY END USE, 2018-2033 (USD THOUSAND)
TABLE 156 SWEDEN AUTOMOTIVE IN POLYPROPYLENE COMPOUNDS MARKET, BY VEHICLE TYPE, 2018-2033 (USD THOUSAND)
TABLE 157 SWEDEN AUTOMOTIVE IN POLYPROPYLENE COMPOUNDS MARKET, BY END USE, 2018-2033 (USD THOUSAND)
TABLE 158 SWEDEN BUILDING AND CONSTRUCTION IN POLYPROPYLENE COMPOUNDS MARKET, BY TYPE, 2018-2033 (USD THOUSAND)
TABLE 159 SWEDEN BUILDING AND CONSTRUCTION IN POLYPROPYLENE COMPOUNDS MARKET, BY END USE, 2018-2033 (USD THOUSAND)
TABLE 160 SWEDEN MEDICAL IN POLYPROPYLENE COMPOUNDS MARKET, BY TYPE, 2018-2033 (USD THOUSAND)
TABLE 161 SWEDEN ELECTRICAL AND ELECTRONICS IN POLYPROPYLENE COMPOUNDS MARKET, BY TYPE, 2018-2033 (USD THOUSAND)
TABLE 162 SWITZERLAND POLYPROPYLENE COMPOUNDS MARKET, BY PRODUCT, 2018-2033 (USD THOUSAND)
TABLE 163 SWITZERLAND POLYPROPYLENE COMPOUNDS MARKET, BY POLYMER TYPE, 2018-2033 (USD THOUSAND)
TABLE 164 SWITZERLAND COPOLYMERS IN POLYPROPYLENE COMPOUNDS MARKET, BY TYPE, 2018-2033 (USD THOUSAND)
TABLE 165 SWITZERLAND POLYPROPYLENE COMPOUNDS MARKET, BY APPLICATION, 2018-2033 (USD THOUSAND)
TABLE 166 SWITZERLAND POLYPROPYLENE COMPOUNDS MARKET, BY END USE, 2018-2033 (USD THOUSAND)
TABLE 167 SWITZERLAND PACKAGING IN POLYPROPYLENE COMPOUNDS MARKET, BY TYPE, 2018-2033 (USD THOUSAND)
TABLE 168 SWITZERLAND PACKAGING IN POLYPROPYLENE COMPOUNDS MARKET, BY END USE, 2018-2033 (USD THOUSAND)
TABLE 169 SWITZERLAND AUTOMOTIVE IN POLYPROPYLENE COMPOUNDS MARKET, BY VEHICLE TYPE, 2018-2033 (USD THOUSAND)
TABLE 170 SWITZERLAND AUTOMOTIVE IN POLYPROPYLENE COMPOUNDS MARKET, BY END USE, 2018-2033 (USD THOUSAND)
TABLE 171 SWITZERLAND BUILDING AND CONSTRUCTION IN POLYPROPYLENE COMPOUNDS MARKET, BY TYPE, 2018-2033 (USD THOUSAND)
TABLE 172 SWITZERLAND BUILDING AND CONSTRUCTION IN POLYPROPYLENE COMPOUNDS MARKET, BY END USE, 2018-2033 (USD THOUSAND)
TABLE 173 SWITZERLAND MEDICAL IN POLYPROPYLENE COMPOUNDS MARKET, BY TYPE, 2018-2033 (USD THOUSAND)
TABLE 174 SWITZERLAND ELECTRICAL AND ELECTRONICS IN POLYPROPYLENE COMPOUNDS MARKET, BY TYPE, 2018-2033 (USD THOUSAND)
TABLE 175 DENMARK POLYPROPYLENE COMPOUNDS MARKET, BY PRODUCT, 2018-2033 (USD THOUSAND)
TABLE 176 DENMARK POLYPROPYLENE COMPOUNDS MARKET, BY POLYMER TYPE, 2018-2033 (USD THOUSAND)
TABLE 177 DENMARK COPOLYMERS IN POLYPROPYLENE COMPOUNDS MARKET, BY TYPE, 2018-2033 (USD THOUSAND)
TABLE 178 DENMARK POLYPROPYLENE COMPOUNDS MARKET, BY APPLICATION, 2018-2033 (USD THOUSAND)
TABLE 179 DENMARK POLYPROPYLENE COMPOUNDS MARKET, BY END USE, 2018-2033 (USD THOUSAND)
TABLE 180 DENMARK PACKAGING IN POLYPROPYLENE COMPOUNDS MARKET, BY TYPE, 2018-2033 (USD THOUSAND)
TABLE 181 DENMARK PACKAGING IN POLYPROPYLENE COMPOUNDS MARKET, BY END USE, 2018-2033 (USD THOUSAND)
TABLE 182 DENMARK AUTOMOTIVE IN POLYPROPYLENE COMPOUNDS MARKET, BY VEHICLE TYPE, 2018-2033 (USD THOUSAND)
TABLE 183 DENMARK AUTOMOTIVE IN POLYPROPYLENE COMPOUNDS MARKET, BY END USE, 2018-2033 (USD THOUSAND)
TABLE 184 DENMARK BUILDING AND CONSTRUCTION IN POLYPROPYLENE COMPOUNDS MARKET, BY TYPE, 2018-2033 (USD THOUSAND)
TABLE 185 DENMARK BUILDING AND CONSTRUCTION IN POLYPROPYLENE COMPOUNDS MARKET, BY END USE, 2018-2033 (USD THOUSAND)
TABLE 186 DENMARK MEDICAL IN POLYPROPYLENE COMPOUNDS MARKET, BY TYPE, 2018-2033 (USD THOUSAND)
TABLE 187 DENMARK ELECTRICAL AND ELECTRONICS IN POLYPROPYLENE COMPOUNDS MARKET, BY TYPE, 2018-2033 (USD THOUSAND)
TABLE 188 NORWAY
TABLE 189 NORWAY POLYPROPYLENE COMPOUNDS MARKET, BY PRODUCT, 2018-2033 (USD THOUSAND)
TABLE 190 NORWAY POLYPROPYLENE COMPOUNDS MARKET, BY POLYMER TYPE, 2018-2033 (USD THOUSAND)
TABLE 191 NORWAY COPOLYMERS IN POLYPROPYLENE COMPOUNDS MARKET, BY TYPE, 2018-2033 (USD THOUSAND)
TABLE 192 NORWAY POLYPROPYLENE COMPOUNDS MARKET, BY APPLICATION, 2018-2033 (USD THOUSAND)
TABLE 193 ORWAY POLYPROPYLENE COMPOUNDS MARKET, BY END USE, 2018-2033 (USD THOUSAND)
TABLE 194 NORWAY PACKAGING IN POLYPROPYLENE COMPOUNDS MARKET, BY TYPE, 2018-2033 (USD THOUSAND)
TABLE 195 NORWAY PACKAGING IN POLYPROPYLENE COMPOUNDS MARKET, BY END USE, 2018-2033 (USD THOUSAND)
TABLE 196 NORWAY AUTOMOTIVE IN POLYPROPYLENE COMPOUNDS MARKET, BY VEHICLE TYPE, 2018-2033 (USD THOUSAND)
TABLE 197 NORWAY AUTOMOTIVE IN POLYPROPYLENE COMPOUNDS MARKET, BY END USE, 2018-2033 (USD THOUSAND)
TABLE 198 NORWAY BUILDING AND CONSTRUCTION IN POLYPROPYLENE COMPOUNDS MARKET, BY TYPE, 2018-2033 (USD THOUSAND)
TABLE 199 NORWAY BUILDING AND CONSTRUCTION IN POLYPROPYLENE COMPOUNDS MARKET, BY END USE, 2018-2033 (USD THOUSAND)
TABLE 200 NORWAY MEDICAL IN POLYPROPYLENE COMPOUNDS MARKET, BY TYPE, 2018-2033 (USD THOUSAND)
TABLE 201 NORWAY ELECTRICAL AND ELECTRONICS IN POLYPROPYLENE COMPOUNDS MARKET, BY TYPE, 2018-2033 (USD THOUSAND)
TABLE 202 FINLAND POLYPROPYLENE COMPOUNDS MARKET, BY PRODUCT, 2018-2033 (USD THOUSAND)
TABLE 203 FINLAND POLYPROPYLENE COMPOUNDS MARKET, BY POLYMER TYPE, 2018-2033 (USD THOUSAND)
TABLE 204 FINLAND COPOLYMERS IN POLYPROPYLENE COMPOUNDS MARKET, BY TYPE, 2018-2033 (USD THOUSAND)
TABLE 205 FINLAND POLYPROPYLENE COMPOUNDS MARKET, BY APPLICATION, 2018-2033 (USD THOUSAND)
TABLE 206 FINLAND POLYPROPYLENE COMPOUNDS MARKET, BY END USE, 2018-2033 (USD THOUSAND)
TABLE 207 FINLAND PACKAGING IN POLYPROPYLENE COMPOUNDS MARKET, BY TYPE, 2018-2033 (USD THOUSAND)
TABLE 208 FINLAND PACKAGING IN POLYPROPYLENE COMPOUNDS MARKET, BY END USE, 2018-2033 (USD THOUSAND)
TABLE 209 FINLAND AUTOMOTIVE IN POLYPROPYLENE COMPOUNDS MARKET, BY VEHICLE TYPE, 2018-2033 (USD THOUSAND)
TABLE 210 FINLAND AUTOMOTIVE IN POLYPROPYLENE COMPOUNDS MARKET, BY END USE, 2018-2033 (USD THOUSAND)
TABLE 211 FINLAND BUILDING AND CONSTRUCTION IN POLYPROPYLENE COMPOUNDS MARKET, BY TYPE, 2018-2033 (USD THOUSAND)
TABLE 212 FINLAND BUILDING AND CONSTRUCTION IN POLYPROPYLENE COMPOUNDS MARKET, BY END USE, 2018-2033 (USD THOUSAND)
TABLE 213 FINLAND MEDICAL IN POLYPROPYLENE COMPOUNDS MARKET, BY TYPE, 2018-2033 (USD THOUSAND)
TABLE 214 FINLAND ELECTRICAL AND ELECTRONICS IN POLYPROPYLENE COMPOUNDS MARKET, BY TYPE, 2018-2033 (USD THOUSAND)
TABLE 215 REST OF EUROPE POLYPROPYLENE COMPOUNDS MARKET, BY PRODUCT, 2018-2033 (USD THOUSAND)
TABLE 216 MIDDLE EAST POLYPROPYLENE COMPOUNDS MARKET, 2018-2033
TABLE 217 MIDDLE EAST POLYPROPYLENE COMPOUNDS MARKET, BY COUNTRY, 2018-2033 (USD THOUSAND)
TABLE 218 MIDDLE EAST POLYPROPYLENE COMPOUNDS MARKET, BY PRODUCT, 2018-2033 (USD THOUSAND)
TABLE 219 MIDDLE EAST POLYPROPYLENE COMPOUNDS MARKET, BY POLYMER TYPE, 2018-2033 (USD THOUSAND)
TABLE 220 MIDDLE EAST COPOLYMERS IN POLYPROPYLENE COMPOUNDS MARKET, BY TYPE, 2018-2033 (USD THOUSAND)
TABLE 221 MIDDLE EAST POLYPROPYLENE COMPOUNDS MARKET, BY APPLICATION, 2018-2033 (USD THOUSAND)
TABLE 222 MIDDLE EAST POLYPROPYLENE COMPOUNDS MARKET, BY END USE, 2018-2033 (USD THOUSAND)
TABLE 223 MIDDLE EAST AUTOMOTIVE IN POLYPROPYLENE COMPOUNDS MARKET, BY VEHICLE TYPE, 2018-2033 (USD THOUSAND)
TABLE 224 MIDDLE EAST AUTOMOTIVE IN POLYPROPYLENE COMPOUNDS MARKET, BY END USE, 2018-2033 (USD THOUSAND)
TABLE 225 MIDDLE EAST PACKAGING IN POLYPROPYLENE COMPOUNDS MARKET, BY TYPE, 2018-2033 (USD THOUSAND)
TABLE 226 MIDDLE EAST PACKAGING IN POLYPROPYLENE COMPOUNDS MARKET, BY END USE, 2018-2033 (USD THOUSAND)
TABLE 227 MIDDLE EAST BUILDING AND CONSTRUCTION IN POLYPROPYLENE COMPOUNDS MARKET, BY TYPE, 2018-2033 (USD THOUSAND)
TABLE 228 MIDDLE EAST BUILDING AND CONSTRUCTION IN POLYPROPYLENE COMPOUNDS MARKET, BY END USE, 2018-2033 (USD THOUSAND)
TABLE 229 MIDDLE EAST ELECTRICAL AND ELECTRONICS IN POLYPROPYLENE COMPOUNDS MARKET, BY TYPE, 2018-2033 (USD THOUSAND)
TABLE 230 MIDDLE EAST MEDICAL IN POLYPROPYLENE COMPOUNDS MARKET, BY TYPE, 2018-2033 (USD THOUSAND)
TABLE 231 SAUDI ARABIA POLYPROPYLENE COMPOUNDS MARKET, BY PRODUCT, 2018-2033 (USD THOUSAND)
TABLE 232 SAUDI ARABIA POLYPROPYLENE COMPOUNDS MARKET, BY POLYMER TYPE, 2018-2033 (USD THOUSAND)
TABLE 233 SAUDI ARABIA COPOLYMERS IN POLYPROPYLENE COMPOUNDS MARKET, BY TYPE, 2018-2033 (USD THOUSAND)
TABLE 234 SAUDI ARABIA POLYPROPYLENE COMPOUNDS MARKET, BY APPLICATION, 2018-2033 (USD THOUSAND)
TABLE 235 SAUDI ARABIA POLYPROPYLENE COMPOUNDS MARKET, BY END USE, 2018-2033 (USD THOUSAND)
TABLE 236 SAUDI ARABIA AUTOMOTIVE IN POLYPROPYLENE COMPOUNDS MARKET, BY VEHICLE TYPE, 2018-2033 (USD THOUSAND)
TABLE 237 SAUDI ARABIA AUTOMOTIVE IN POLYPROPYLENE COMPOUNDS MARKET, BY END USE, 2018-2033 (USD THOUSAND)
TABLE 238 SAUDI ARABIA PACKAGING IN POLYPROPYLENE COMPOUNDS MARKET, BY TYPE, 2018-2033 (USD THOUSAND)
TABLE 239 SAUDI ARABIA PACKAGING IN POLYPROPYLENE COMPOUNDS MARKET, BY END USE, 2018-2033 (USD THOUSAND)
TABLE 240 SAUDI ARABIA BUILDING AND CONSTRUCTION IN POLYPROPYLENE COMPOUNDS MARKET, BY TYPE, 2018-2033 (USD THOUSAND)
TABLE 241 SAUDI ARABIA BUILDING AND CONSTRUCTION IN POLYPROPYLENE COMPOUNDS MARKET, BY END USE, 2018-2033 (USD THOUSAND)
TABLE 242 SAUDI ARABIA ELECTRICAL AND ELECTRONICS IN POLYPROPYLENE COMPOUNDS MARKET, BY TYPE, 2018-2033 (USD THOUSAND)
TABLE 243 SAUDI ARABIA MEDICAL IN POLYPROPYLENE COMPOUNDS MARKET, BY TYPE, 2018-2033 (USD THOUSAND)
TABLE 244 UNITED ARAB EMIRATES POLYPROPYLENE COMPOUNDS MARKET, BY PRODUCT, 2018-2033 (USD THOUSAND)
TABLE 245 UNITED ARAB EMIRATES POLYPROPYLENE COMPOUNDS MARKET, BY POLYMER TYPE, 2018-2033 (USD THOUSAND)
TABLE 246 UNITED ARAB EMIRATES COPOLYMERS IN POLYPROPYLENE COMPOUNDS MARKET, BY TYPE, 2018-2033 (USD THOUSAND)
TABLE 247 UNITED ARAB EMIRATES POLYPROPYLENE COMPOUNDS MARKET, BY APPLICATION, 2018-2033 (USD THOUSAND)
TABLE 248 UNITED ARAB EMIRATES POLYPROPYLENE COMPOUNDS MARKET, BY END USE, 2018-2033 (USD THOUSAND)
TABLE 249 UNITED ARAB EMIRATES AUTOMOTIVE IN POLYPROPYLENE COMPOUNDS MARKET, BY VEHICLE TYPE, 2018-2033 (USD THOUSAND)
TABLE 250 UNITED ARAB EMIRATES AUTOMOTIVE IN POLYPROPYLENE COMPOUNDS MARKET, BY END USE, 2018-2033 (USD THOUSAND)
TABLE 251 UNITED ARAB EMIRATES PACKAGING IN POLYPROPYLENE COMPOUNDS MARKET, BY TYPE, 2018-2033 (USD THOUSAND)
TABLE 252 UNITED ARAB EMIRATES PACKAGING IN POLYPROPYLENE COMPOUNDS MARKET, BY END USE, 2018-2033 (USD THOUSAND)
TABLE 253 UNITED ARAB EMIRATES BUILDING AND CONSTRUCTION IN POLYPROPYLENE COMPOUNDS MARKET, BY TYPE, 2018-2033 (USD THOUSAND)
TABLE 254 UNITED ARAB EMIRATES BUILDING AND CONSTRUCTION IN POLYPROPYLENE COMPOUNDS MARKET, BY END USE, 2018-2033 (USD THOUSAND)
TABLE 255 UNITED ARAB EMIRATES ELECTRICAL AND ELECTRONICS IN POLYPROPYLENE COMPOUNDS MARKET, BY TYPE, 2018-2033 (USD THOUSAND)
TABLE 256 UNITED ARAB EMIRATES MEDICAL IN POLYPROPYLENE COMPOUNDS MARKET, BY TYPE, 2018-2033 (USD THOUSAND)
TABLE 257 EGYPT POLYPROPYLENE COMPOUNDS MARKET, BY PRODUCT, 2018-2033 (USD THOUSAND)
TABLE 258 EGYPT POLYPROPYLENE COMPOUNDS MARKET, BY POLYMER TYPE, 2018-2033 (USD THOUSAND)
TABLE 259 EGYPT COPOLYMERS IN POLYPROPYLENE COMPOUNDS MARKET, BY TYPE, 2018-2033 (USD THOUSAND)
TABLE 260 EGYPT POLYPROPYLENE COMPOUNDS MARKET, BY APPLICATION, 2018-2033 (USD THOUSAND)
TABLE 261 EGYPT POLYPROPYLENE COMPOUNDS MARKET, BY END USE, 2018-2033 (USD THOUSAND)
TABLE 262 EGYPT AUTOMOTIVE IN POLYPROPYLENE COMPOUNDS MARKET, BY VEHICLE TYPE, 2018-2033 (USD THOUSAND)
TABLE 263 EGYPT AUTOMOTIVE IN POLYPROPYLENE COMPOUNDS MARKET, BY END USE, 2018-2033 (USD THOUSAND)
TABLE 264 EGYPT PACKAGING IN POLYPROPYLENE COMPOUNDS MARKET, BY TYPE, 2018-2033 (USD THOUSAND)
TABLE 265 EGYPT PACKAGING IN POLYPROPYLENE COMPOUNDS MARKET, BY END USE, 2018-2033 (USD THOUSAND)
TABLE 266 EGYPT BUILDING AND CONSTRUCTION IN POLYPROPYLENE COMPOUNDS MARKET, BY TYPE, 2018-2033 (USD THOUSAND)
TABLE 267 EGYPT BUILDING AND CONSTRUCTION IN POLYPROPYLENE COMPOUNDS MARKET, BY END USE, 2018-2033 (USD THOUSAND)
TABLE 268 EGYPT ELECTRICAL AND ELECTRONICS IN POLYPROPYLENE COMPOUNDS MARKET, BY TYPE, 2018-2033 (USD THOUSAND)
TABLE 269 EGYPT MEDICAL IN POLYPROPYLENE COMPOUNDS MARKET, BY TYPE, 2018-2033 (USD THOUSAND)
TABLE 270 ISRAEL POLYPROPYLENE COMPOUNDS MARKET, BY PRODUCT, 2018-2033 (USD THOUSAND)
TABLE 271 ISRAEL POLYPROPYLENE COMPOUNDS MARKET, BY POLYMER TYPE, 2018-2033 (USD THOUSAND)
TABLE 272 ISRAEL COPOLYMERS IN POLYPROPYLENE COMPOUNDS MARKET, BY TYPE, 2018-2033 (USD THOUSAND)
TABLE 273 ISRAEL POLYPROPYLENE COMPOUNDS MARKET, BY APPLICATION, 2018-2033 (USD THOUSAND)
TABLE 274 ISRAEL POLYPROPYLENE COMPOUNDS MARKET, BY END USE, 2018-2033 (USD THOUSAND)
TABLE 275 ISRAEL AUTOMOTIVE IN POLYPROPYLENE COMPOUNDS MARKET, BY VEHICLE TYPE, 2018-2033 (USD THOUSAND)
TABLE 276 ISRAEL AUTOMOTIVE IN POLYPROPYLENE COMPOUNDS MARKET, BY END USE, 2018-2033 (USD THOUSAND)
TABLE 277 ISRAEL PACKAGING IN POLYPROPYLENE COMPOUNDS MARKET, BY TYPE, 2018-2033 (USD THOUSAND)
TABLE 278 ISRAEL PACKAGING IN POLYPROPYLENE COMPOUNDS MARKET, BY END USE, 2018-2033 (USD THOUSAND)
TABLE 279 ISRAEL BUILDING AND CONSTRUCTION IN POLYPROPYLENE COMPOUNDS MARKET, BY TYPE, 2018-2033 (USD THOUSAND)
TABLE 280 ISRAEL BUILDING AND CONSTRUCTION IN POLYPROPYLENE COMPOUNDS MARKET, BY END USE, 2018-2033 (USD THOUSAND)
TABLE 281 ISRAEL ELECTRICAL AND ELECTRONICS IN POLYPROPYLENE COMPOUNDS MARKET, BY TYPE, 2018-2033 (USD THOUSAND)
TABLE 282 ISRAEL MEDICAL IN POLYPROPYLENE COMPOUNDS MARKET, BY TYPE, 2018-2033 (USD THOUSAND)
TABLE 283 KUWAIT POLYPROPYLENE COMPOUNDS MARKET, BY PRODUCT, 2018-2033 (USD THOUSAND)
TABLE 284 KUWAIT POLYPROPYLENE COMPOUNDS MARKET, BY POLYMER TYPE, 2018-2033 (USD THOUSAND)
TABLE 285 KUWAIT COPOLYMERS IN POLYPROPYLENE COMPOUNDS MARKET, BY TYPE, 2018-2033 (USD THOUSAND)
TABLE 286 KUWAIT POLYPROPYLENE COMPOUNDS MARKET, BY APPLICATION, 2018-2033 (USD THOUSAND)
TABLE 287 KUWAIT POLYPROPYLENE COMPOUNDS MARKET, BY END USE, 2018-2033 (USD THOUSAND)
TABLE 288 KUWAIT AUTOMOTIVE IN POLYPROPYLENE COMPOUNDS MARKET, BY VEHICLE TYPE, 2018-2033 (USD THOUSAND)
TABLE 289 KUWAIT AUTOMOTIVE IN POLYPROPYLENE COMPOUNDS MARKET, BY END USE, 2018-2033 (USD THOUSAND)
TABLE 290 KUWAIT PACKAGING IN POLYPROPYLENE COMPOUNDS MARKET, BY TYPE, 2018-2033 (USD THOUSAND)
TABLE 291 KUWAIT PACKAGING IN POLYPROPYLENE COMPOUNDS MARKET, BY END USE, 2018-2033 (USD THOUSAND)
TABLE 292 KUWAIT BUILDING AND CONSTRUCTION IN POLYPROPYLENE COMPOUNDS MARKET, BY TYPE, 2018-2033 (USD THOUSAND)
TABLE 293 KUWAIT BUILDING AND CONSTRUCTION IN POLYPROPYLENE COMPOUNDS MARKET, BY END USE, 2018-2033 (USD THOUSAND)
TABLE 294 KUWAIT ELECTRICAL AND ELECTRONICS IN POLYPROPYLENE COMPOUNDS MARKET, BY TYPE, 2018-2033 (USD THOUSAND)
TABLE 295 KUWAIT MEDICAL IN POLYPROPYLENE COMPOUNDS MARKET, BY TYPE, 2018-2033 (USD THOUSAND)
TABLE 296 OMAN POLYPROPYLENE COMPOUNDS MARKET, BY PRODUCT, 2018-2033 (USD THOUSAND)
TABLE 297 OMAN POLYPROPYLENE COMPOUNDS MARKET, BY POLYMER TYPE, 2018-2033 (USD THOUSAND)
TABLE 298 OMAN COPOLYMERS IN POLYPROPYLENE COMPOUNDS MARKET, BY TYPE, 2018-2033 (USD THOUSAND)
TABLE 299 OMAN POLYPROPYLENE COMPOUNDS MARKET, BY APPLICATION, 2018-2033 (USD THOUSAND)
TABLE 300 OMAN POLYPROPYLENE COMPOUNDS MARKET, BY END USE, 2018-2033 (USD THOUSAND)
TABLE 301 OMAN AUTOMOTIVE IN POLYPROPYLENE COMPOUNDS MARKET, BY VEHICLE TYPE, 2018-2033 (USD THOUSAND)
TABLE 302 OMAN AUTOMOTIVE IN POLYPROPYLENE COMPOUNDS MARKET, BY END USE, 2018-2033 (USD THOUSAND)
TABLE 303 OMAN PACKAGING IN POLYPROPYLENE COMPOUNDS MARKET, BY TYPE, 2018-2033 (USD THOUSAND)
TABLE 304 OMAN PACKAGING IN POLYPROPYLENE COMPOUNDS MARKET, BY END USE, 2018-2033 (USD THOUSAND)
TABLE 305 OMAN BUILDING AND CONSTRUCTION IN POLYPROPYLENE COMPOUNDS MARKET, BY TYPE, 2018-2033 (USD THOUSAND)
TABLE 306 OMAN BUILDING AND CONSTRUCTION IN POLYPROPYLENE COMPOUNDS MARKET, BY END USE, 2018-2033 (USD THOUSAND)
TABLE 307 OMAN ELECTRICAL AND ELECTRONICS IN POLYPROPYLENE COMPOUNDS MARKET, BY TYPE, 2018-2033 (USD THOUSAND)
TABLE 308 OMAN MEDICAL IN POLYPROPYLENE COMPOUNDS MARKET, BY TYPE, 2018-2033 (USD THOUSAND)
TABLE 309 QATAR POLYPROPYLENE COMPOUNDS MARKET, BY PRODUCT, 2018-2033 (USD THOUSAND)
TABLE 310 QATAR POLYPROPYLENE COMPOUNDS MARKET, BY POLYMER TYPE, 2018-2033 (USD THOUSAND)
TABLE 311 QATAR COPOLYMERS IN POLYPROPYLENE COMPOUNDS MARKET, BY TYPE, 2018-2033 (USD THOUSAND)
TABLE 312 QATAR POLYPROPYLENE COMPOUNDS MARKET, BY APPLICATION, 2018-2033 (USD THOUSAND)
TABLE 313 QATAR POLYPROPYLENE COMPOUNDS MARKET, BY END USE, 2018-2033 (USD THOUSAND)
TABLE 314 QATAR AUTOMOTIVE IN POLYPROPYLENE COMPOUNDS MARKET, BY VEHICLE TYPE, 2018-2033 (USD THOUSAND)
TABLE 315 QATAR AUTOMOTIVE IN POLYPROPYLENE COMPOUNDS MARKET, BY END USE, 2018-2033 (USD THOUSAND)
TABLE 316 QATAR PACKAGING IN POLYPROPYLENE COMPOUNDS MARKET, BY TYPE, 2018-2033 (USD THOUSAND)
TABLE 317 QATAR PACKAGING IN POLYPROPYLENE COMPOUNDS MARKET, BY END USE, 2018-2033 (USD THOUSAND)
TABLE 318 QATAR BUILDING AND CONSTRUCTION IN POLYPROPYLENE COMPOUNDS MARKET, BY TYPE, 2018-2033 (USD THOUSAND)
TABLE 319 QATAR BUILDING AND CONSTRUCTION IN POLYPROPYLENE COMPOUNDS MARKET, BY END USE, 2018-2033 (USD THOUSAND)
TABLE 320 QATAR ELECTRICAL AND ELECTRONICS IN POLYPROPYLENE COMPOUNDS MARKET, BY TYPE, 2018-2033 (USD THOUSAND)
TABLE 321 QATAR MEDICAL IN POLYPROPYLENE COMPOUNDS MARKET, BY TYPE, 2018-2033 (USD THOUSAND)
TABLE 322 BAHRAIN POLYPROPYLENE COMPOUNDS MARKET, BY PRODUCT, 2018-2033 (USD THOUSAND)
TABLE 323 BAHRAIN POLYPROPYLENE COMPOUNDS MARKET, BY POLYMER TYPE, 2018-2033 (USD THOUSAND)
TABLE 324 BAHRAIN COPOLYMERS IN POLYPROPYLENE COMPOUNDS MARKET, BY TYPE, 2018-2033 (USD THOUSAND)
TABLE 325 BAHRAIN POLYPROPYLENE COMPOUNDS MARKET, BY APPLICATION, 2018-2033 (USD THOUSAND)
TABLE 326 BAHRAIN POLYPROPYLENE COMPOUNDS MARKET, BY END USE, 2018-2033 (USD THOUSAND)
TABLE 327 BAHRAIN AUTOMOTIVE IN POLYPROPYLENE COMPOUNDS MARKET, BY VEHICLE TYPE, 2018-2033 (USD THOUSAND)
TABLE 328 BAHRAIN AUTOMOTIVE IN POLYPROPYLENE COMPOUNDS MARKET, BY END USE, 2018-2033 (USD THOUSAND)
TABLE 329 BAHRAIN PACKAGING IN POLYPROPYLENE COMPOUNDS MARKET, BY TYPE, 2018-2033 (USD THOUSAND)
TABLE 330 BAHRAIN PACKAGING IN POLYPROPYLENE COMPOUNDS MARKET, BY END USE, 2018-2033 (USD THOUSAND)
TABLE 331 BAHRAIN BUILDING AND CONSTRUCTION IN POLYPROPYLENE COMPOUNDS MARKET, BY TYPE, 2018-2033 (USD THOUSAND)
TABLE 332 BAHRAIN BUILDING AND CONSTRUCTION IN POLYPROPYLENE COMPOUNDS MARKET, BY END USE, 2018-2033 (USD THOUSAND)
BAHRAIN ELECTRICAL AND ELECTRONICS IN POLYPROPYLENE COMPOUNDS MARKET, BY TYPE, 2018-2033 (USD THOUSAND) 260
TABLE 333 BAHRAIN MEDICAL IN POLYPROPYLENE COMPOUNDS MARKET, BY TYPE, 2018-2033 (USD THOUSAND)
TABLE 334 REST OF MIDDLE EAST POLYPROPYLENE COMPOUNDS MARKET, BY PRODUCT, 2018-2033 (USD THOUSAND)
List of Figure
FIGURE 1 EUROPE AND MIDDLE EAST POLYPROPYLENE COMPOUNDS MARKET
FIGURE 2 EUROPE AND MIDDLE EAST POLYPROPYLENE COMPOUNDS MARKET: DATA TRIANGULATION
FIGURE 3 EUROPE AND MIDDLE EAST POLYPROPYLENE COMPOUNDS MARKET: DROC ANALYSIS
FIGURE 4 EUROPE AND MIDDLE EAST POLYPROPYLENE COMPOUNDS MARKET: GLOBAL VS REGIONAL MARKET ANALYSIS
FIGURE 5 EUROPE AND MIDDLE EAST POLYPROPYLENE COMPOUNDS MARKET: COMPANY RESEARCH ANALYSIS
FIGURE 6 EUROPE AND MIDDLE EAST POLYPROPYLENE COMPOUNDS MARKET: THE PRODUCT LIFELINE CURVE
FIGURE 7 EUROPE AND MIDDLE EAST POLYPROPYLENE COMPOUNDS MARKET: MULTIVARIATE MODELLING
FIGURE 8 EUROPE AND MIDDLE EAST POLYPROPYLENE COMPOUNDS MARKET: INTERVIEW DEMOGRAPHICS
FIGURE 9 EUROPE AND MIDDLE EAST POLYPROPYLENE COMPOUNDS MARKET: DBMR MARKET POSITION GRID
FIGURE 10 EUROPE AND MIDDLE EAST POLYPROPYLENE COMPOUNDS MARKET: MARKET APPLICATION COVERAGE GRID
FIGURE 11 EUROPE AND MIDDLE EAST POLYPROPYLENE COMPOUNDS MARKET: THE MARKET CHALLENGE MATRIX
FIGURE 12 EUROPE AND MIDDLE EAST POLYPROPYLENE COMPOUNDS MARKET: VENDOR SHARE ANALYSIS
FIGURE 13 EUROPE AND MIDDLE EAST POLYPROPYLENE COMPOUNDS MARKET: SEGMENTATION
FIGURE 14 FIVE SEGMENTS COMPRISE THE GLOBAL EUROPE AND MIDDLE EAST POLYPROPYLENE COMPOUNDS, BY PRODUCT (2025)
FIGURE 15 STRATEGIC DECISIONS
FIGURE 16 EXECUTIVE SUMMARY
FIGURE 17 EUROPE IS EXPECTED TO DOMINATE THE EUROPE AND MIDDLE EAST POLYPROPYLENE COMPOUNDS MARKET, WHILE MIDDLE EAST IS EXPECTED TO GROW WITH THE HIGHEST CAGR IN THE FORECAST PERIOD
FIGURE 18 GROWING USE OF LIGHTWEIGHT, GLASS FIBER-REINFORCED POLYPROPYLENE IN EV STRUCTURAL AND UNDER-THE-HOOD PARTS TO MEET EMISSION AND FUEL EFFICIENCY NORMS IS EXPECTED TO DRIVE THE EUROPE AND MIDDLE EAST POLYPROPYLENE COMPOUNDS MARKET IN THE FORECAST PERIOD
FIGURE 19 THE MINERAL FILLED POLYPROPYLENE IS EXPECTED TO ACCOUNT FOR THE LARGEST SHARE OF THE EUROPE AND MIDDLE EAST POLYPROPYLENE COMPOUNDS MARKET IN 2026 AND 2033
FIGURE 20 MIDDLE EAST AND AFRICA IS THE FASTEST-GROWING MARKET FOR POLYPROPYLENE COMPOUNDS MARKET MANUFACTURERS IN THE FORECAST PERIOD
FIGURE 21 DRIVERS, RESTRAINTS, OPPORTUNITIES, AND CHALLENGES OF THE MIDDLE EAST, ASEAN, CHINA, AND INDIA POLYPROPYLENE COMPOUNDS MARKET
FIGURE 22 EUROPE AND MIDDLE EAST POLYPROPYLENE COMPOUNDS MARKET: BY PRODUCT, 2025
FIGURE 23 EUROPE AND MIDDLE EAST POLYPROPYLENE COMPOUNDS MARKET: BY POLYMER TYPE, 2025
FIGURE 24 EUROPE AND MIDDLE EAST POLYPROPYLENE COMPOUNDS MARKET: BY APPLICATION, 2025
FIGURE 25 EUROPE AND MIDDLE EAST POLYPROPYLENE COMPOUNDS MARKET: BY END USE, 2025
FIGURE 26 EUROPE AND MIDDLE EAST POLYPROPYLENE COMPOUNDS MARKET: SNAPSHOT
FIGURE 27 EUROPE POLYPROPYLENE COMPOUNDS MARKET: SNAPSHOT (2025)
FIGURE 28 MIDDLE EAST POLYPROPYLENE COMPOUNDS MARKET: SNAPSHOT (2025)
FIGURE 29 EUROPE AND MIDDLE EAST POLYPROPYLENE COMPOUNDS MARKET: COMPANY SHARE 2025 (%)
Europe Polypropylene Compounds Market, Supply Chain Analysis and Ecosystem Framework
To support market growth and help clients navigate the impact of geopolitical shifts, DBMR has integrated in-depth supply chain analysis into its Europe Polypropylene Compounds Market research reports. This addition empowers clients to respond effectively to global changes affecting their industries. The supply chain analysis section includes detailed insights such as Europe Polypropylene Compounds Market consumption and production by country, price trend analysis, the impact of tariffs and geopolitical developments, and import and export trends by country and HSN code. It also highlights major suppliers with data on production capacity and company profiles, as well as key importers and exporters. In addition to research, DBMR offers specialized supply chain consulting services backed by over a decade of experience, providing solutions like supplier discovery, supplier risk assessment, price trend analysis, impact evaluation of inflation and trade route changes, and comprehensive market trend analysis.
Data collection and base year analysis are done using data collection modules with large sample sizes. The stage includes obtaining market information or related data through various sources and strategies. It includes examining and planning all the data acquired from the past in advance. It likewise envelops the examination of information inconsistencies seen across different information sources. The market data is analysed and estimated using market statistical and coherent models. Also, market share analysis and key trend analysis are the major success factors in the market report. To know more, please request an analyst call or drop down your inquiry.
The key research methodology used by DBMR research team is data triangulation which involves data mining, analysis of the impact of data variables on the market and primary (industry expert) validation. Data models include Vendor Positioning Grid, Market Time Line Analysis, Market Overview and Guide, Company Positioning Grid, Patent Analysis, Pricing Analysis, Company Market Share Analysis, Standards of Measurement, Global versus Regional and Vendor Share Analysis. To know more about the research methodology, drop in an inquiry to speak to our industry experts.
Data Bridge Market Research is a leader in advanced formative research. We take pride in servicing our existing and new customers with data and analysis that match and suits their goal. The report can be customized to include price trend analysis of target brands understanding the market for additional countries (ask for the list of countries), clinical trial results data, literature review, refurbished market and product base analysis. Market analysis of target competitors can be analyzed from technology-based analysis to market portfolio strategies. We can add as many competitors that you require data about in the format and data style you are looking for. Our team of analysts can also provide you data in crude raw excel files pivot tables (Fact book) or can assist you in creating presentations from the data sets available in the report.


