
Europe Power Tools Market
Market Size in USD Billion
 USD
13.47 Billion
USD
21.08 Billion
2024
2032
USD
13.47 Billion
USD
21.08 Billion
2024
2032
| 2025 - 2032 | |
| USD 13.47 Billion | |
| USD 21.08 Billion | |
| % | |
|
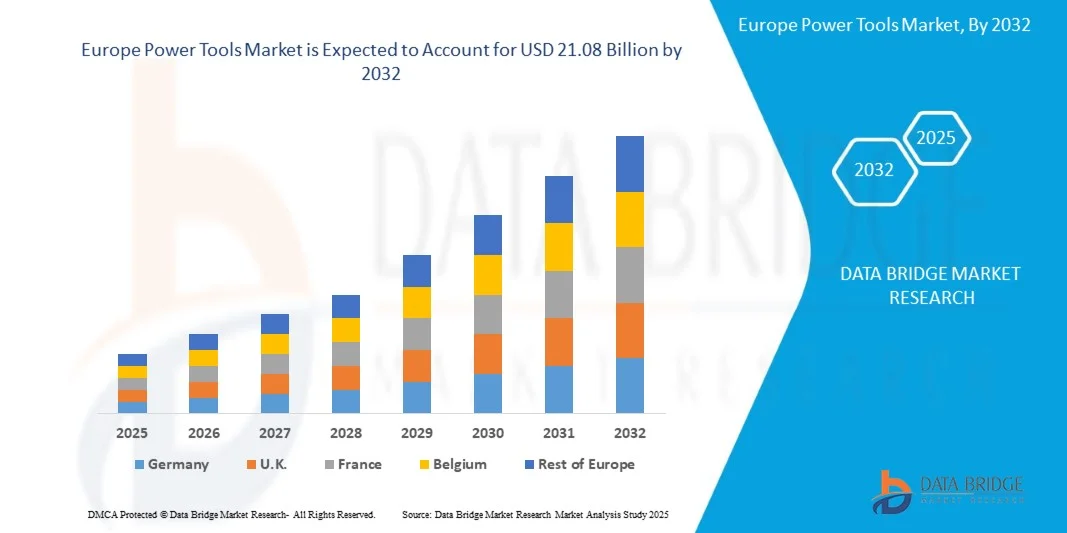
Europe Power Tools Market Size
- The Europe Power tools Market size was valued at USD 13.47 Billion in 2024 and is expected to reach USD 21.08 Billion by 2032, at a CAGR of 5.5% during the forecast period
- Power tools can be defined as those types of tools which require additional power sources to run their mechanism, they consist of motor to power their operation. These motors can be driven through electric power, compressed air, or through internal combustion using fuel. These power tools are used for various operations such as drilling, demolition, cutting and sawing, material removal, polishing and others. These operations require various types of tools such as drills, hammer, jigsaw, and sanders.
Europe Power Tools Market Analysis
- power tools are being used in both industry and residential purposes to ease the work of the users. They provide better accuracy, ease of working and higher productivity. The work gets simpler and faster when working with power tools. These tools are majorly used in construction and automobile industry for concrete work, wood work and metal work. The production capacities of these industries are enhanced with the use of power tools. Power tools are compact in size and can be easily transported, the cordless power tools running on batteries have even made the working more flexible.
- Industries are continuously trying to find out ways to increase their productivity and the precision of work. The requirement to increase the productivity is being fulfilled through the use of power tools as they reduce the time and increase the efficiency. The power tools are being used widely due to increasing integration of advanced technologies. The companies are launching smart apps which are integrated with the tools and give information about the tool, can track down its location and help in inventory management.
- Germany is expected to dominate the Europe Power tools market and it is anticipated to show the fastest growth during the forecast period. Germany’s power tools market is being driven by its backbone manufacturing sectors—automotive, aerospace, machinery—and a push toward automation and Industry 4.0. Rising demand for battery-powered, cordless tools with brushless motors is strong.
- In 2024, Drilling And Fastening Tools dominated the market with over 21.13% revenue share and it is anticipated to show the fastest growth during the forecast period, The drilling and fastening tools segment is driven by growing construction and manufacturing activities across Europe, where precision, durability, and efficiency are critical. Increasing adoption of cordless and brushless motor technologies enhances portability and performance. Demand from the automotive and aerospace sectors for high-torque fastening tools supports market expansion. Additionally, rising home improvement and DIY trends, coupled with industrial refurbishment projects, boost product penetration. Innovations such as smart connectivity, quick-change chucks, and lightweight ergonomic designs further strengthen market growth across commercial and residential applications.
Report Scope and Europe Power Tools Market Segmentation
|
Attributes |
Europe Power Tools Key Market Insights |
|
Segments Covered |
|
|
Countries Covered |
Europe
|
|
Key Market Players |
|
|
Market Opportunities |
|
|
Value Added Data Infosets |
In addition to the insights on market scenarios such as market value, growth rate, segmentation, geographical coverage, and major players, the market reports curated by the Data Bridge Market Research also include in-depth expert analysis, geographically represented company-wise production and capacity, network layouts of distributors and partners, detailed and updated price trend analysis and deficit analysis of supply chain and demand.. |
Europe Power Tools Market Trends
“Smart Connectivity in Power Tools”
- The integration of smart connectivity, enabled by advancements in digital technology and the Internet of Things (IoT), has been transforming the Europe power tools market. Companies across the region have released tools equipped with real-time data analytics, remote monitoring, and app-based diagnostics, allowing users to manage performance, schedule predictive maintenance, and monitor battery levels from smartphones or enterprise platforms. These developments are facilitating the shift to smart factories and connected job sites throughout the region.
- A wide range of benefits has been associated with digitally connected tools. Users can track inventory and device usage to prevent theft, access operational records to optimize tool deployment, and receive alerts pertaining to charge levels or maintenance schedules, reducing downtime. Leading industry players—including Bosch, Hilti Group, and Makita—have introduced models capable of delivering automated calibration alerts and remote lockout features to ensure compliance and safety in professional and industrial applications. In automotive and electronics assembly, smart wrenches and drills have become essential for torque control and traceable assembly operations, aligning with the sector’s move toward stringent quality and safety standards.
- As announced by Bosch Power Tools in January 2025, the company introduced more than 30 cordless tools, batteries, and chargers equipped with smart connectivity features. These tools are designed to enhance the user experience by integrating with digital platforms to improve performance tracking and maintenance scheduling. This move underscores Bosch's commitment to advancing smart technology in power tools across various trades.
- In a press release dated January 2025, Bosch Power Tools announced the launch of over 30 new cordless tools, batteries, and chargers, many of which feature smart connectivity capabilities. These innovations aim to provide users with enhanced performance tracking, predictive maintenance, and improved tool management, reflecting the industry's shift towards smarter, connected power tools
Europe Power Tools Market Dynamics
Driver
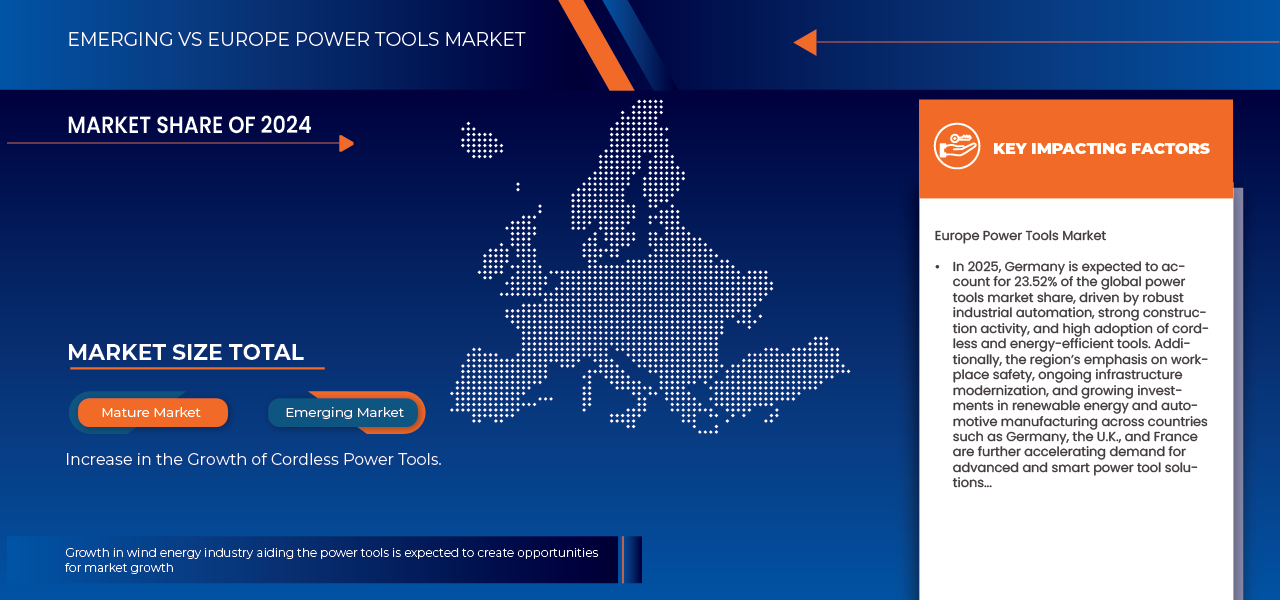
“Increase in The Growth of Cordless Power Tools”
- Cordless tools, powered by advanced lithium-ion and brushless motor technologies, offer enhanced convenience, portability, and efficiency, highly valued in professional and DIY applications. The construction, automotive, and manufacturing industries across Europe are increasingly shifting toward cordless models due to their improved ergonomics and ability to operate without external power sources, reducing downtime and improving productivity.
- Additionally, countries such as Germany, France, and the UK are seeing rising demand for sustainable, energy-efficient tools, further encouraging the adoption of rechargeable battery systems. The integration of smart features such as Bluetooth connectivity, battery health indicators, and power control modes enhances the user experience and operational precision. The expansion of residential renovation projects and DIY culture, particularly post-pandemic, has also boosted sales of compact and lightweight cordless devices.
- In January 2022, according to a press release by Europawire, Bosch launched four new cordless drill/driver models in its “18V Power for All System,” including EasyDrill 18V-40 and UniversalImpact 18V-60. These drills share a single battery platform and are part of a system that covers 40 DIY, garden, and home tools, boosting user convenience and ecosystem loyalty.
- In December 2024, according to a press release by Einhell Germany AG, the company opened a new production facility in Hungary (Nagykanizsa) dedicated to its “Power X-Change” batteries and chargers. The plant aims to produce over 1 million battery packs and 500,000 chargers annually, bolstering supply chain localization and reinforcing growth in cordless battery tools.
Restraint/Challenge
“High Maintenance of Power Tools”
- Many industrial-grade and professional power tools are complex in design, featuring multiple moving parts, electronic components, and specialized motors. Regular maintenance, including lubrication, calibration, replacement of worn-out components, and periodic inspections, is necessary to ensure optimal performance and longevity. This maintenance demand increases operational costs for end users, especially for small- and medium-sized enterprises that may lack dedicated maintenance teams.
- Additionally, the need for specialized knowledge and tools to perform repairs or preventive maintenance often compels users to rely on authorized service centers, which can be expensive and time-consuming. Frequent maintenance requirements may also lead to downtime, reducing productivity in professional settings. For DIY users, high maintenance complexity can discourage frequent use or prompt a switch to lower-maintenance alternatives, affecting overall market adoption. Furthermore, environmental regulations on the disposal and servicing of tools containing specific electronic or chemical components add another layer of compliance and cost. Collectively, these factors act as a restraint on the growth of the Europe power tools market, influencing purchasing decisions and slowing market expansion.
- In November 2024, according to an article by National World Publishing Ltd, rising tool prices and high maintenance costs are pushing many UK tradespeople to delay new purchases or rely on self-repairs. Around one-third of tradespeople said they were holding off on buying new tools due to expenses, while 13% admitted to continuing work with tools that are not in ideal condition because repairs are too costly. The article also emphasized that cumulative repair costs for frequently used tools such as hammer drills and saws can exceed replacement costs after multiple fixes, making tool upkeep a significant financial strain.
- In July 2023, according to an article by Insight Retail Group Ltd, UK tradespeople face significant expenses maintaining their tools, with an average of GBP 246 annually spent on repairs. Many admit to using damaged tools due to unaffordable maintenance, illustrating a significant restraint on practical tool usage and market demand
Opportunity
“Growth in Wind Energy Industry Aiding the Power Tools”
- The expansion of the wind energy industry has been recognized as a significant driver of new opportunities for the Europe power tools market. Increased investments in wind turbine installations have been accompanied by a corresponding rise in demand for specialized bolting tools, which are essential during both assembly and maintenance phases. In this context, electric torque wrenches have been increasingly adopted, as their performance and precision are considered superior to those of manual torque multipliers.
- These tools have been valued for their ability to ensure consistent torque application, reduce operator fatigue, and improve safety in high-demand operational environments. In wind turbine construction, where critical bolted connections must be secured to exact specifications, enhanced accuracy has been viewed as essential to overall structural performance and long-term reliability. Furthermore, as sustainability objectives continue to be prioritized across Europe, the efficiency gains delivered by advanced electric torque
- As reported by WindEurope in September 2025, Europe installed 16.4 GW of new wind power capacity in 2024, with 84% of this capacity installed onshore. The EU aims to install 140 GW of new wind capacity by 2030, averaging 23 GW per year. This significant growth in wind energy projects is increasing the demand for specialized power tools used in the construction and maintenance of wind turbines
- In September 2025, Reuters reported that Europe's wind turbines are poised to become the primary driver of clean electricity supply growth for the remainder of 2025, as windier conditions prevail. This increase in wind generation, starting mid-September, is expected to drive demand for advanced power tools designed for offshore wind farm installations and maintenance, helping the region reach new records in clean electricity production

Europe Power Tools Market Scope
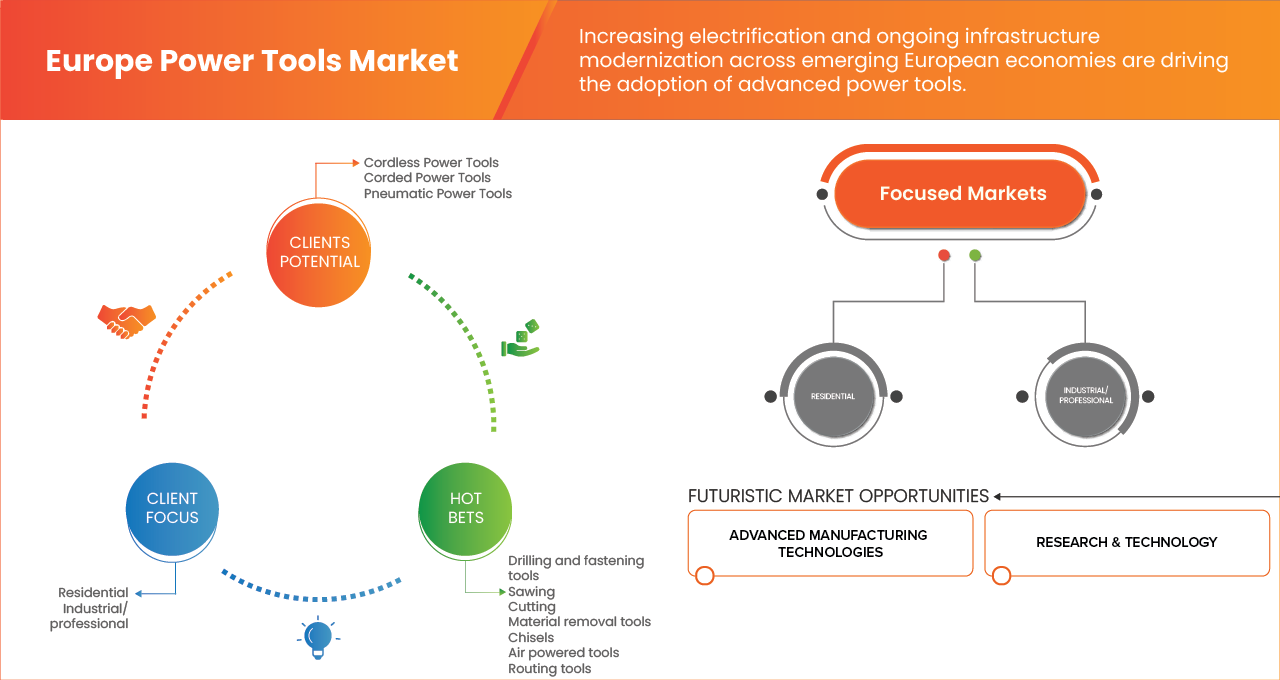
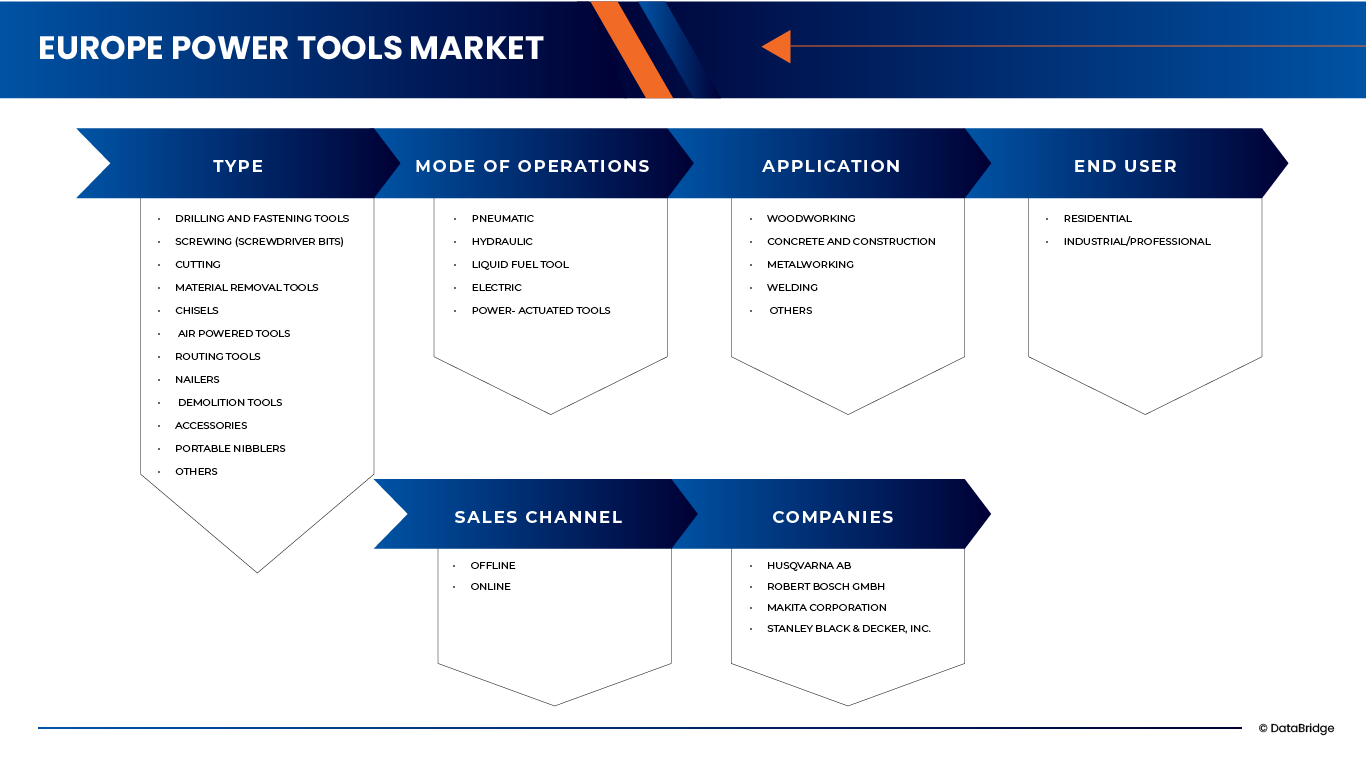
The power tools market is segmented into five notable segments which are based on type, mode of operation, application, end user, and sales channel.
- By Type
On the basis of type, the market is segmented into drilling and fastening tools, sawing, cutting, demolition tools, nailers, routing tools, portable nibblers, air-powered tools, material removal tools, screwing (screwdriver bits), chisels, accessories, others. In 2025, drilling and fastening tools segment is expected to dominate with the largest share 21.43% and it is anticipated to show the fastest growth during the forecast period The drilling and fastening tools segment is driven by growing construction and manufacturing activities across Europe, where precision, durability, and efficiency are critical. Increasing adoption of cordless and brushless motor technologies enhances portability and performance. Demand from the automotive and aerospace sectors for high-torque fastening tools supports market expansion. Additionally, rising home improvement and DIY trends, coupled with industrial refurbishment projects, boost product penetration. Innovations such as smart connectivity, quick-change chucks, and lightweight ergonomic designs further strengthen market growth across commercial and residential applications.
- By mode of operation
On the basis of mode of operation, the market is segmented into electric, liquid fuel tool, hydraulic, pneumatic, and powder-actuated tools. Electric segment is further segmented into corded tool, cordless tool. In 2025, the electric segment is expected to dominate the market share 35.98% and it is anticipated to show the fastest growth during the forecast period the European market due to rising infrastructure development and industrial automation. The shift from manual to powered equipment enhances productivity and safety, reducing project timelines. Growth in energy-efficient and battery-operated solutions supports sustainability initiatives. Cordless electric models are increasingly preferred for flexibility and mobility in professional and DIY applications. Major manufacturers focus on integrating brushless motors and smart controls for better performance and energy optimization. The surge in construction, automotive repair, and renovation activities further propels electric power tool demand.
- By application
On the basis of application, the market is segmented into concrete and construction, woodworking, metalworking, welding, and others. In 2025, concrete and construction segment is expected to dominate market share 35.89% and it is anticipated to show the fastest growth during the forecast period. Concrete and construction power tools experience strong demand across Europe, supported by large-scale urbanization, smart city projects, and public infrastructure investments. Increased usage in road, bridge, and housing development fuels sales of concrete cutters, demolition hammers, and rotary hammers. Advancements in vibration-control technologies and durable materials improve user safety and efficiency. Cordless innovations and integrated dust-management systems enhance worksite productivity and compliance with EU safety standards. Additionally, demand for lightweight, high-performance tools from contractors and builders continues to drive this segment’s growth.
- By end user
On the basis of end user, the market is segmented into industrial/professional and residential. In 2025, industrial/professional segment is expected to dominate market share 72.20% and it is anticipated to show the fastest growth during the forecast period. The industrial and professional power tools segment is driven by expanding manufacturing, automotive, and aerospace industries across Europe. Growing automation, coupled with the demand for high-precision assembly tools, fuels market growth. Professionals increasingly prefer ergonomic, high-torque, and low-maintenance devices for efficiency and reliability. Manufacturers are integrating IoT-enabled systems for predictive maintenance and operational monitoring. Additionally, rising investments in renewable energy projects and offshore construction increase tool utilization. The focus on safety compliance, energy efficiency, and productivity improvement continues to strengthen professional tool adoption.
- By sales channel
On the basis of sales channel, the market is segmented into online and offline. In 2025, offline segment is expected to dominate market share 64.42%. Offline sales dominate the European power tools market due to strong customer preference for physical inspection, after-sales services, and brand trust. Hardware stores, authorized distributors, and retail chains like Leroy Merlin and Würth play key roles in product accessibility. Demonstration facilities, bulk discounts, and immediate product availability attract professional users. Additionally, offline channels provide personalized assistance, which is crucial for industrial and construction buyers. Increasing partnerships between manufacturers and regional dealers enhance distribution efficiency, driving the steady performance of this sales channel across Europe.
Online Segment is anticipated to show the fastest growth during the forecast period. The online segment of the power tools market is driven by the rapid expansion of e-commerce platforms, offering wide product availability, competitive pricing, and convenient home delivery. Increased digitalization, consumer preference for contactless shopping, manufacturer-direct online sales, and easy product comparisons further boost online power tool sales across residential and professional users.
Europe Power Tools Market Regional Analysis
Germany
- Germany dominates the Market with the largest share 23.52% in 2025, Germany’s power tools market is being driven by its backbone manufacturing sectors—automotive, aerospace, machinery—and a push toward automation and Industry 4.0. Rising demand for battery-powered, cordless tools with brushless motors is strong. Strict safety, environmental, and energy-efficiency regulations force innovation in low-emission, ergonomic tools. The construction industry, along with infrastructure and housing development (including modular and prefabricated building), fuels demand for tools for fastening, cutting, drilling. Online channels and e-commerce make tools more accessible. Investments in R&D and local brands’ reputation for durability and precision also reinforce market growth.
France
France dominates the Market with the second largest share 16.18% in 2025 In France, growth is propelled by increasing popularity of cordless (battery-powered) tools, lightweight designs, and brushless motor technology. The construction, automotive, aerospace, and manufacturing sectors demand precision and efficiency. DIY culture, aided by social media, home renovation trends, and lighter ergonomic tools, is expanding the consumer base. Regulatory pressure for sustainability, energy efficiency, and safety is influencing product design. E-commerce gives consumers greater choice and convenience. Regionally, the renewable energy, shipbuilding, and industrial hubs in northern, eastern, and southern France raise demand for specialized, durable tools. Drilling & fastening tools lead by value.
U.K
U.K dominates the Market with the third largest share 10.07% in 2025 The UK power tools market is being supported by infrastructure investment and expanding residential and commercial construction. There’s a strong DIY segment—home improvement and renovation trends are rising, aided by online tutorials and e-commerce channels that make tools more accessible. Professional users (tradespeople, contractors) demand cordless, high-performance, lightweight tools, and there’s increasing focus on safety features (anti-vibration, automatic shut-off). Environmental policies and net-zero goals push adoption of energy-efficient and brushless motor tools. Also, supply chain diversification and brand innovation are helping meet evolving demands
Europe Power Tools Market Share
The Europe Power tools industry is primarily led by well-established companies, including
- Husqvarna AB (Sweden)
- Robert Bosch GmbH (Germany)
- Makita Corporation (Japan)
- Stanley Black & Decker, Inc. (U.S.)
- Hilti AG (Liechtenstein)
- Atlas Copco AB ( Sweden)
- Delta Power Equipment Corporation (U.S.)
- Apex Tool Group, LLC (U.S.)
- Ingersoll Rand (U.S.)
- Snap-on Incorporated (U.S.)
- Ferm International B.V. (Netherlands)
- Emerson Electric Co. (U.S.)
- KYOCERA Corporation (Japan)
- Panasonic Corporation (Japan)
Latest Developments in Europe Power Tools Market
- In October 2024, Husqvarna announced the launch of four new professional boundary wire-free robotic lawnmowers, namely, 580L EPOS, 580 EPOS, 560 EPOS, and an updated 535 AWD EPOS, equipped with GPS navigation, selectable mowing patterns, and future-compatible AI and solar features. These products are relevant to the Europe Power Tools Market as they fall under advanced battery-powered outdoor tools, reflecting trends in smart connectivity, technological innovation, and sustainable power tools.
- In January 2025, Bosch Power Tools launched over 15 new products, mainly in the 18V cordless tool category, along with 30 cordless tools, batteries, and chargers targeted at professionals, reinforcing their commitment to cordless solutions.
- In October 2025, Makita introduced the Power Cutter Water Supply Hose (1915Y2-3), designed to connect Makita Sprayers with Power Cutters. This accessory ensures consistent water flow for dust suppression and blade cooling, supporting OSHA compliance and compatibility with XGT® and LXT® systems.
- In November, DEWALT introduced the POWERSHIFT™ system, a sustainable alternative to traditional gas-powered concrete tools. The system reduces CO₂ emissions by nearly 60% and was recognized by Popular Science as one of the “50 Greatest Innovations of 2024.
SKU-

- Interactive Data Analysis Dashboard
- Company Analysis Dashboard for high growth potential opportunities
- Research Analyst Access for customization & queries
- Competitor Analysis with Interactive dashboard
- Latest News, Updates & Trend analysis
- Harness the Power of Benchmark Analysis for Comprehensive Competitor Tracking
Table of Content
1 INTRODUCTION
1.1 OBJECTIVES OF THE STUDY
1.2 MARKET DEFINITION
1.3 OVERVIEW OF EUROPE POWER TOOLS MARKET
1.4 CURRENCY AND PRICING
1.5 LIMITATIONS
1.6 MARKETS COVERED
2 MARKET SEGMENTATION
2.1 MARKETS COVERED
2.2 GEOGRAPHICAL SCOPE
2.3 YEARS CONSIDERED FOR THE STUDY
2.4 DBMR TRIPOD DATA VALIDATION MODEL
2.5 PRIMARY INTERVIEWS WITH KEY OPINION LEADERS
2.6 DBMR MARKET POSITION GRID
2.7 VENDOR SHARE ANALYSIS
2.8 MULTIVARIATE MODELING
2.9 TYPE TIMELINE CURVE
2.1 MARKET APPLICATION COVERAGE GRID
2.11 SECONDARY SOURCES
2.12 ASSUMPTIONS
3 EXECUTIVE SUMMARY
4 PREMIUM INSIGHTS
4.1 PORTER’S FIVE FORCES ANALYSIS
4.2 REGULATORY STANDARDS IN THE EUROPE POWER TOOLS MARKET
4.3 CASE STUDY: GROWTH DYNAMICS, CHALLENGES, AND STRATEGIC DEVELOPMENTS
4.4 PATENT ANALYSIS
4.4.1 MARKET CONTEXT
4.5 COMPETITIVE ANALYSIS FRAMEWORK
4.5.1 MARKET CONTEXT
5 MARKET OVERVIEW
5.1 DRIVERS
5.1.1 INCREASE IN THE GROWTH OF CORDLESS POWER TOOLS
5.1.2 INTEGRATION OF BRUSHLESS MOTORS IN POWER TOOLS
5.1.3 INCREASING GROWTH IN INFRASTRUCTURE PROJECTS
5.2 RESTRAINS
5.2.1 HIGH MAINTENANCE OF POWER TOOLS
5.2.2 FLUCTUATION IN THE PRICES OF RAW MATERIALS
5.3 OPPORTUNITIES
5.3.1 GROWTH IN WIND ENERGY INDUSTRY AIDING THE POWER TOOLS
5.3.2 SMART CONNECTIVITY IN POWER TOOLS
5.3.3 TECHNOLOGICAL INNOVATIONS IN INDUSTRY 4.0
5.4 CHALLENGES
5.4.1 DESIGNING ERGONOMIC AND LIGHTWEIGHT POWER TOOLS
5.4.2 REGULATORY COMPLIANCE AND POWER TOOL SAFETY
6 EUROPE POWER TOOLS MARKET, BY TYPE
6.1 OVERVIEW
6.2 DRILLING AND FASTENING TOOLS
6.2.1 DRILLING AND FASTENING TOOLS, BY TYPE
6.2.1.1 DRILLS
6.2.1.2 SCREWDRIVERS AND NUTRUNNERS
6.2.1.3 IMPACT WRENCHES
6.2.1.4 IMPACT DRIVERS
6.2.2 DRILLING AND FASTENING TOOLS, BY MATERIAL
6.2.2.1 CONCRETE
6.2.2.2 METAL
6.2.2.3 MULTI PURPOSE
6.2.2.4 WOODS
6.2.2.5 STONE
6.2.3 DRILLING AND FASTENING TOOLS, BY SALES CHANNEL
6.2.3.1 OFFLINE
6.2.3.1.1 OFFLINE, BY TYPE
6.2.3.1.1.1 DISTRIBUTORS
6.2.3.1.1.2 WHOLESALER
6.2.3.1.1.3 OTHERS
6.2.3.2 ONLINE
6.2.3.2.1 ONLINE, BY TYPE
6.2.3.2.1.1 COMPANY WEBSITE
6.2.3.2.1.2 E-COMMERCE WEBSITES
6.3 SAWING
6.3.1 SAWING, BY MATERIAL
6.3.1.1 CIRCULAR SAWS
6.3.1.2 JIG SAWS
6.3.1.3 MULTI-CUTTER SAWS
6.3.1.4 CHOP SAWS
6.3.1.5 BAND SAWS
6.3.1.6 HOLE SAWS
6.3.1.7 RECIPROCATING SAWS
6.3.1.8 SHEARS AND NIBBLERS
6.3.2 SAWING, BY SALES CHANNEL
6.3.2.1 OFFLINE
6.3.2.1.1 OFFLINE, BY TYPE
6.3.2.1.1.1 DISTRIBUTORS
6.3.2.1.1.2 WHOLESALER
6.3.2.1.1.3 OTHERS
6.3.2.2 ONLINE
6.3.2.2.1 ONLINE, BY TYPE
6.3.2.2.1.1 COMPANY WEBSITE
6.3.2.2.1.2 E-COMMERCE WEBSITES
6.4 CUTTING
6.4.1 CUTTING, BY TYPE
6.4.1.1 BONDED CUTTING
6.4.1.2 DIAMOND CUTTING
6.4.2 CUTTING, BY SALES CHANNEL
6.4.2.1 OFFLINE
6.4.2.1.1 OFFLINE, BY TYPE
6.4.2.1.1.1 DISTRIBUTORS
6.4.2.1.1.2 WHOLESALER
6.4.2.1.1.3 OTHERS
6.4.2.2 ONLINE
6.4.2.2.1 ONLINE, BY TYPE
6.4.2.2.1.1 COMPANY WEBSITE
6.4.2.2.1.2 E-COMMERCE WEBSITES
6.5 DEMOLITION TOOLS
6.5.1 DEMOLITION TOOLS, BY TYPE
6.5.1.1 DEMOLITION HAMMER
6.5.1.2 HAMMER DRILL
6.5.1.3 BREAKER
6.5.1.4 ROTARY HAMMER
6.5.1.5 OTHERS
6.5.2 DEMOLITION TOOLS, BY SALES CHANNEL
6.5.2.1 OFFLINE
6.5.2.1.1 OFFLINE, BY TYPE
6.5.2.1.1.1 DISTRIBUTORS
6.5.2.1.1.2 WHOLESALER
6.5.2.1.1.3 OTHERS
6.5.2.2 ONLINE
6.5.2.2.1 ONLINE, BY TYPE
6.5.2.2.1.1 COMPANY WEBSITE
6.5.2.2.1.2 E-COMMERCE WEBSITES
6.6 NAILERS
6.6.1 NAILERS, BY SALES CHANNEL
6.6.1.1 OFFLINE
6.6.1.1.1 OFFLINE, BY TYPE
6.6.1.1.1.1 DISTRIBUTORS
6.6.1.1.1.2 WHOLESALER
6.6.1.1.1.3 OTHERS
6.6.1.2 ONLINE
6.6.1.2.1 ONLINE, BY TYPE
6.6.1.2.1.1 COMPANY WEBSITE
6.6.1.2.1.2 E-COMMERCE WEBSITES
6.7 ROUTING TOOLS
6.7.1 ROUTING TOOLS, BY TYPE
6.7.1.1 ROUTERS/PLANER
6.7.1.2 JOINERS
6.7.2 ROUTING TOOLS, BY SALES CHANNEL
6.7.2.1 OFFLINE
6.7.2.1.1 OFFLINE, BY TYPE
6.7.2.1.1.1 DISTRIBUTORS
6.7.2.1.1.2 WHOLESALER
6.7.2.1.1.3 OTHERS
6.7.2.2 ONLINE
6.7.2.2.1 ONLINE, BY TYPE
6.7.2.2.1.1 COMPANY WEBSITE
6.7.2.2.1.2 E-COMMERCE WEBSITES
6.8 PORTABLE NIBBLERS
6.8.1 PORTABLE NIBBLERS, BY SALES CHANNEL
6.8.1.1 OFFLINE
6.8.1.1.1 OFFLINE, BY TYPE
6.8.1.1.1.1 DISTRIBUTORS
6.8.1.1.1.2 WHOLESALER
6.8.1.1.1.3 OTHERS
6.8.1.2 ONLINE
6.8.1.2.1 ONLINE, BY TYPE
6.8.1.2.1.1 COMPANY WEBSITE
6.8.1.2.1.2 E-COMMERCE WEBSITES
6.9 AIR-POWERED TOOLS
6.9.1 AIR-POWERED TOOLS, BY TYPE
6.9.1.1 AIR HOSES
6.9.1.2 AIR HAMMERS
6.9.1.3 AIR SCALERS
6.9.1.4 OTHERS
6.9.2 AIR-POWERED TOOLS, BY SALES CHANNEL
6.9.2.1 OFFLINE
6.9.2.1.1 OFFLINE, BY TYPE
6.9.2.1.1.1 DISTRIBUTORS
6.9.2.1.1.2 WHOLESALER
6.9.2.1.1.3 OTHERS
6.9.2.2 ONLINE
6.9.2.2.1 ONLINE, BY TYPE
6.9.2.2.1.1 COMPANY WEBSITE
6.9.2.2.1.2 E-COMMERCE WEBSITES
6.1 MATERIAL REMOVAL TOOLS
6.10.1 MATERIAL REMOVAL TOOLS, BY TYPE
6.10.1.1 GRINDERS
6.10.1.1.1 GRINDERS, BY TYPE
6.10.1.1.1.1 DIE AND STRAIGHT GRINDER
6.10.1.1.1.2 ANGLE GRINDER
6.10.1.1.1.3 ROTARY FILES
6.10.1.1.1.4 BENCH GRINDER
6.10.1.1.1.5 PENCIL GRINDERS
6.10.2 SANDERS
6.10.2.1 SANDERS, BY TYPE
6.10.2.1.1 WOOD SANDING
6.10.2.1.2 METAL SANDING
6.10.2.1.3 COMPOSITE SANDING
6.10.2.2 POLISHERS/BUFFERS
6.10.3 MATERIAL REMOVAL TOOLS, BY SALES CHANNEL
6.10.3.1 OFFLINE
6.10.3.1.1 OFFLINE, BY TYPE
6.10.3.1.1.1 DISTRIBUTORS
6.10.3.1.1.2 WHOLESALER
6.10.3.1.1.3 OTHERS
6.10.3.2 ONLINE
6.10.3.2.1 ONLINE, BY TYPE
6.10.3.2.1.1 COMPANY WEBSITE
6.10.3.2.1.2 E-COMMERCE WEBSITES
6.11 SCREWING (SCREWDRIVER BITS)
6.11.1 SCREWING (SCREWDRIVER BITS), BY SALES CHANNEL
6.11.1.1 OFFLINE
6.11.1.1.1 OFFLINE, BY TYPE
6.11.1.1.1.1 DISTRIBUTORS
6.11.1.1.1.2 WHOLESALER
6.11.1.1.1.3 OTHERS
6.11.1.2 ONLINE
6.11.1.2.1 ONLINE, BY TYPE
6.11.1.2.1.1 COMPANY WEBSITE
6.11.1.2.1.2 E-COMMERCE WEBSITES
6.12 CHISELS
6.12.1 CHISELS, BY SALES CHANNEL
6.12.1.1 OFFLINE
6.12.1.1.1 OFFLINE, BY TYPE
6.12.1.1.1.1 DISTRIBUTORS
6.12.1.1.1.2 WHOLESALER
6.12.1.1.1.3 OTHERS
6.12.1.2 ONLINE
6.12.1.2.1 ONLINE, BY TYPE
6.12.1.2.1.1 COMPANY WEBSITE
6.12.1.2.1.2 E-COMMERCE WEBSITES
6.13 ACCESSORIES
6.13.1 ACCESSORIES, BY SALES CHANNEL
6.13.1.1 OFFLINE
6.13.1.1.1 OFFLINE, BY TYPE
6.13.1.1.2 DISTRIBUTORS
6.13.1.1.3 WHOLESALER
6.13.1.1.4 OTHERS
6.13.1.2 ONLINE
6.13.1.2.1 ONLINE, BY TYPE
6.13.1.2.1.1 COMPANY WEBSITE
6.13.1.2.1.2 E-COMMERCE WEBSITES
6.14 OTHERS
6.14.1 OTHERS, BY SALES CHANNEL
6.14.1.1 OFFLINE
6.14.1.1.1 OFFLINE, BY TYPE
6.14.1.1.1.1 DISTRIBUTORS
6.14.1.1.1.2 WHOLESALER
6.14.1.1.1.3 OTHERS
6.14.1.2 ONLINE
6.14.1.2.1 ONLINE, BY TYPE
6.14.1.2.1.1 COMPANY WEBSITE
6.14.1.2.1.2 E-COMMERCE WEBSITES
7 EUROPE POWER TOOLS MARKET, BY MODE OF OPERATION
7.1 OVERVIEW
7.2 ELECTRIC
7.2.1 ELECTRIC, BY TYPE
7.2.1.1 CORDED TOOL
7.2.1.2 CORDLESS TOOL
7.3 LIQUID FUEL TOOL
7.4 HYDRAULIC
7.5 PNEUMATIC
7.6 POWDER-ACTUATED TOOLS
8 EUROPE POWER TOOLS MARKET, BY APPLICATION
8.1 OVERVIEW
8.2 CONCRETE AND CONSTRUCTION
8.3 WOODWORKING
8.4 METALWORKING
8.5 WELDING
8.6 OTHERS
9 EUROPE POWER TOOLS MARKET, BY END USER
9.1 OVERVIEW
9.2 INDUSTRIAL/PROFESSIONAL
9.2.1 INDUSTRIAL/PROFESSIONAL, BY TYPE
9.2.1.1 CONSTRUCTION
9.2.1.2 MANUFACTURING
9.2.1.3 AUTOMOTIVE
9.2.1.4 WOOD WORKING AND ART
9.2.1.5 ENERGY
9.2.1.6 AEROSPACE
9.2.1.7 SHIPBUILDING
9.2.1.8 CHEMICAL
9.2.1.9 OTHERS
9.2.2 INDUSTRIAL/PROFESSIONAL, BY TYPE
9.2.2.1 DRILLING AND FASTENING TOOLS
9.2.2.2 SAWING
9.2.2.3 CUTTING
9.2.2.4 DEMOLITION TOOLS
9.2.2.5 NAILERS
9.2.2.6 ROUTING TOOLS
9.2.2.7 PORTABLE NIBBLERS
9.2.2.8 AIR-POWERED TOOLS
9.2.2.9 MATERIAL REMOVAL TOOLS
9.2.2.10 SCREWING (SCREWDRIVER BITS)
9.2.2.11 CHISELS
9.2.2.12 ACCESSORIES
9.2.2.13 OTHERS
9.2.3 INDUSTRIAL/PROFESSIONAL, BY MODE OF OPERATION
9.2.3.1 ELECTRIC
9.2.3.2 LIQUID FUEL TOOL
9.2.3.3 HYDRAULIC
9.2.3.4 PNEUMATIC
9.2.3.5 POWDER-ACTUATED TOOLS
9.3 RESIDENTIAL
9.3.1 RESIDENTIAL, BY TYPE
9.3.1.1 SINGLE FAMILY HOME
9.3.1.2 DUPLEXES
9.3.1.3 APARTMENTS
9.3.1.4 OTHERS
9.3.2 RESIDENTIAL, BY TYPE
9.3.2.1 DRILLING AND FASTENING TOOLS
9.3.2.2 SAWING
9.3.2.3 CUTTING
9.3.2.4 DEMOLITION TOOLS
9.3.2.5 NAILERS
9.3.2.6 ROUTING TOOLS
9.3.2.7 PORTABLE NIBBLERS
9.3.2.8 AIR-POWERED TOOLS
9.3.2.9 MATERIAL REMOVAL TOOLS
9.3.2.10 SCREWING (SCREWDRIVER BITS)
9.3.2.11 CHISELS
9.3.2.12 ACCESSORIES
9.3.2.13 OTHERS
9.3.3 RESIDENTIAL, BY MODE OF OPERATION
9.3.3.1 ELECTRIC
9.3.3.2 LIQUID FUEL TOOL
9.3.3.3 HYDRAULIC
9.3.3.4 PNEUMATIC
9.3.3.5 POWDER-ACTUATED TOOLS
10 EUROPE POWER TOOLS MARKET, BY SALES CHANNEL
10.1 OVERVIEW
10.2 OFFLINE
10.2.1 OFFLINE, BY TYPE
10.2.1.1 WHOLESALER
10.2.1.2 DISTRIBUTORS
10.2.1.3 OTHERS
10.3 ONLINE
10.3.1 ONLINE, BY TYPE
10.3.1.1 COMPANY WEBSITE
10.3.1.2 E-COMMERCE WEBSITES
11 EUROPE POWER TOOLS MARKET BY COUNTRIES
11.1 EUROPE
11.1.1 GERMANY
11.1.2 FRANCE
11.1.3 U.K.
11.1.4 ITALY
11.1.5 SPAIN
11.1.6 POLAND
11.1.7 TURKEY
11.1.8 RUSSIA
11.1.9 NETHERLANDS
11.1.10 SWEDEN
11.1.11 BELGIUM
11.1.12 SWITZERLAND
11.1.13 DENMARK
11.1.14 NORWAY
11.1.15 FINLAND
11.1.16 REST OF EUROPE
12 EUROPE POWER TOOLS MARKET COMPANY LANDSCAPE
12.1 COMPANY SHARE ANALYSIS: EUROPE
13 SWOT ANALYSIS
14 COMPANY PROFILE
14.1 HUSQVARNA GROUP
14.1.1 COMPANY SNAPSHOT
14.1.2 REVENUE ANALYSIS
14.1.3 PRODUCT PORTFOLIO
14.1.4 RECENT DEVELOPMENTS
14.2 ROBERT BOSCH POWER TOOLS GMBH
14.2.1 COMPANY SNAPSHOT
14.2.2 PRODUCT PORTFOLIO
14.2.3 RECENT DEVELOPMENT
14.3 MAKITA CORPORATION
14.3.1 COMPANY SNAPSHOT
14.3.2 REVENUE ANALYSIS
14.3.3 PRODUCT PORTFOLIO
14.3.4 RECENT DEVELOPMENT
14.4 STANLEY BLACK & DECKER, INC.
14.4.1 COMPANY SNAPSHOT
14.4.2 REVENUE ANALYSIS
14.4.3 PRODUCT PORTFOLIO
14.4.4 RECENT DEVELOPMENT
14.5 HILTI AKTIENGESELLSCHAFT
14.5.1 COMPANY SNAPSHOT
14.5.2 PRODUCT PORTFOLIO
14.5.3 RECENT DEVELOPMENT
14.6 ATLAS COPCO GROUP
14.6.1 COMPANY SNAPSHOT
14.6.2 REVENUE ANALYSIS
14.6.3 PRODUCT PORTFOLIO
14.6.4 RECENT DEVELOPMENT
14.7 APEX TOOL GROUP, LLC
14.7.1 COMPANY SNAPSHOT
14.7.2 PRODUCT PORTFOLIO
14.7.3 RECENT DEVELOPMENT
14.8 DELTA POWER EQUIPMENT CORPORATION
14.8.1 COMPANY SNAPSHOT
14.8.2 PRODUCT PORTFOLIO
14.8.3 RECENT DEVELOPMENT
14.9 EMERSON ELECTRIC CO.
14.9.1 COMPANY SNAPSHOT
14.9.2 REVENUE ANALYSIS
14.9.3 PRODUCT PORTFOLIO
14.9.4 RECENT DEVELOPMENT
14.1 FERM INTERNATIONAL B.V.
14.10.1 COMPANY SNAPSHOT
14.10.2 PRODUCT PORTFOLIO
14.10.3 RECENT DEVELOPMENT
14.11 INGERSOLL RAND
14.11.1 COMPANY SNAPSHOT
14.11.2 REVENUE ANALYSIS
14.11.3 PRODUCT PORTFOLIO
14.11.4 RECENT DEVELOPMENT
14.12 KYOCERA CORPORATION
14.12.1 COMPANY SNAPSHOT
14.12.2 REVENUE ANALYSIS
14.12.3 PRODUCT PORTFOLIO
14.12.4 RECENT DEVELOPMENTS
14.13 PANASONIC CORPORATION
14.13.1 COMPANY SNAPSHOT
14.13.2 REVENUE ANALYSIS
14.13.3 PRODUCT PORTFOLIO
14.13.4 RECENT DEVELOPMENT
14.14 SNAP-ON INCORPORATED
14.14.1 COMPANY SNAPSHOT
14.14.2 REVENUE ANALYSIS
14.14.3 PRODUCT PORTFOLIO
14.14.4 RECENT DEVELOPMENT
15 QUESTIONNAIRE
16 RELATED REPORTS
List of Table
TABLE 1 OVERVIEW OF PATENT LANDSCAPE IN THE EUROPE POWER TOOLS MARKET
TABLE 2 COMPARATIVE ANALYSIS OF LEADING POWER TOOLS COMPANIES IN THE EUROPEAN MARKET (2025)
TABLE 3 EUROPE POWER TOOLS MARKET, BY TYPE, 2018-2032 (USD THOUSAND)
TABLE 4 EUROPE DRILLING AND FASTENING TOOLS IN POWER TOOLS MARKET, BY TYPE, 2018-2032 (USD THOUSAND)
TABLE 5 EUROPE DRILLING AND FASTENING TOOLS IN POWER TOOLS MARKET, BY MATERIAL, 2018-2032 (USD THOUSAND)
TABLE 6 EUROPE DRILLING AND FASTENING TOOLS IN POWER TOOLS MARKET, BY SALES CHANNEL, 2018-2032 (USD THOUSAND)
TABLE 7 EUROPE OFFLINE IN POWER TOOLS MARKET, BY TYPE, 2018-2032 (USD THOUSAND)
TABLE 8 EUROPE ONLINE IN POWER TOOLS MARKET, BY TYPE, 2018-2032 (USD THOUSAND)
TABLE 9 EUROPE SAWING IN POWER TOOLS MARKET, BY TYPE, 2018-2032 (USD THOUSAND)
TABLE 10 EUROPE SAWING TOOLS IN POWER TOOLS MARKET, BY SALES CHANNEL, 2018-2032 (USD THOUSAND)
TABLE 11 EUROPE OFFLINE IN POWER TOOLS MARKET, BY TYPE, 2018-2032 (USD THOUSAND)
TABLE 12 EUROPE ONLINE IN POWER TOOLS MARKET, BY TYPE, 2018-2032 (USD THOUSAND)
TABLE 13 EUROPE CUTING IN POWER TOOLS MARKET, BY TYPE, 2018-2032 (USD THOUSAND)
TABLE 14 EUROPE CUTING IN POWER TOOLS MARKET, BY SALES CHANNEL, 2018-2032 (USD THOUSAND)
TABLE 15 EUROPE OFFLINE IN POWER TOOLS MARKET, BY TYPE, 2018-2032 (USD THOUSAND)
TABLE 16 EUROPE ONLINE IN POWER TOOLS MARKET, BY TYPE, 2018-2032 (USD THOUSAND)
TABLE 17 EUROPE DEMOLITION TOOLS IN POWER TOOLS MARKET, BY TYPE, 2018-2032 (USD THOUSAND)
TABLE 18 EUROPE DEMOLITION TOOLS IN POWER TOOLS MARKET, BY SALES CHANNEL, 2018-2032 (USD THOUSAND)
TABLE 19 EUROPE OFFLINE IN POWER TOOLS MARKET, BY TYPE, 2018-2032 (USD THOUSAND)
TABLE 20 EUROPE ONLINE IN POWER TOOLS MARKET, BY TYPE, 2018-2032 (USD THOUSAND)
TABLE 21 EUROPE NAILERS IN POWER TOOLS MARKET, BY SALES CHANNEL, 2018-2032 (USD THOUSAND)
TABLE 22 EUROPE OFFLINE IN POWER TOOLS MARKET, BY TYPE, 2018-2032 (USD THOUSAND)
TABLE 23 EUROPE ONLINE IN POWER TOOLS MARKET, BY TYPE, 2018-2032 (USD THOUSAND)
TABLE 24 EUROPE ROUTING TOOLS IN POWER TOOLS MARKET, BY TYPE, 2018-2032 (USD THOUSAND)
TABLE 25 EUROPE ROUTING TOOLS IN POWER TOOLS MARKET, BY SALES CHANNEL, 2018-2032 (USD THOUSAND)
TABLE 26 EUROPE OFFLINE IN POWER TOOLS MARKET, BY TYPE, 2018-2032 (USD THOUSAND)
TABLE 27 EUROPE ONLINE IN POWER TOOLS MARKET, BY TYPE, 2018-2032 (USD THOUSAND)
TABLE 28 EUROPE PORTABLE NIBBLERS IN POWER TOOLS MARKET, BY SALES CHANNEL, 2018-2032 (USD THOUSAND)
TABLE 29 EUROPE OFFLINE IN POWER TOOLS MARKET, BY TYPE, 2018-2032 (USD THOUSAND)
TABLE 30 EUROPE ONLINE IN POWER TOOLS MARKET, BY TYPE, 2018-2032 (USD THOUSAND)
TABLE 31 EUROPE AIR-POWERED TOOLS IN POWER TOOLS MARKET, BY TYPE, 2018-2032 (USD THOUSAND)
TABLE 32 EUROPE AIR-POWERED TOOLS IN POWER TOOLS MARKET, BY SALES CHANNEL, 2018-2032 (USD THOUSAND)
TABLE 33 EUROPE OFFLINE IN POWER TOOLS MARKET, BY TYPE, 2018-2032 (USD THOUSAND)
TABLE 34 EUROPE ONLINE IN POWER TOOLS MARKET, BY TYPE, 2018-2032 (USD THOUSAND)
TABLE 35 EUROPE MATERIAL REMOVAL TOOLS IN POWER TOOLS MARKET, BY TYPE, 2018-2032 (USD THOUSAND)
TABLE 36 EUROPE GRINDERS IN POWER TOOLS MARKET, BY TYPE, 2018-2032 (USD THOUSAND)
TABLE 37 EUROPE SANDERS IN POWER TOOLS MARKET, BY TYPE, 2018-2032 (USD THOUSAND)
TABLE 38 EUROPE MATERIAL REMOVAL TOOLS IN POWER TOOLS MARKET, BY SALES CHANNEL, 2018-2032 (USD THOUSAND)
TABLE 39 EUROPE OFFLINE IN POWER TOOLS MARKET, BY TYPE, 2018-2032 (USD THOUSAND)
TABLE 40 EUROPE ONLINE IN POWER TOOLS MARKET, BY TYPE, 2018-2032 (USD THOUSAND)
TABLE 41 EUROPE SCREWING (SCREWDRIVER BITS) IN POWER TOOLS MARKET, BY SALES CHANNEL, 2018-2032 (USD THOUSAND)
TABLE 42 EUROPE OFFLINE IN POWER TOOLS MARKET, BY TYPE, 2018-2032 (USD THOUSAND)
TABLE 43 EUROPE ONLINE IN POWER TOOLS MARKET, BY TYPE, 2018-2032 (USD THOUSAND)
TABLE 44 EUROPE CHISELS IN POWER TOOLS MARKET, BY SALES CHANNEL, 2018-2032 (USD THOUSAND)
TABLE 45 EUROPE OFFLINE IN POWER TOOLS MARKET, BY TYPE, 2018-2032 (USD THOUSAND)
TABLE 46 EUROPE ONLINE IN POWER TOOLS MARKET, BY TYPE, 2018-2032 (USD THOUSAND)
TABLE 47 EUROPE ACCESSORIES IN POWER TOOLS MARKET, BY SALES CHANNEL, 2018-2032 (USD THOUSAND)
TABLE 48 EUROPE OFFLINE IN POWER TOOLS MARKET, BY TYPE, 2018-2032 (USD THOUSAND)
TABLE 49 EUROPE ONLINE IN POWER TOOLS MARKET, BY TYPE, 2018-2032 (USD THOUSAND)
TABLE 50 TABLE 49 EUROPE OTHERS IN POWER TOOLS MARKET, BY SALES CHANNEL, 2018-2032 (USD THOUSAND)
TABLE 51 EUROPE OFFLINE IN POWER TOOLS MARKET, BY TYPE, 2018-2032 (USD THOUSAND)
TABLE 52 EUROPE ONLINE IN POWER TOOLS MARKET, BY TYPE, 2018-2032 (USD THOUSAND)
TABLE 53 EUROPE POWER TOOLS MARKET, BY MODE OF OPERATION, 2018-2032 (USD THOUSAND)
TABLE 54 EUROPE ELECTRIC IN POWER TOOLS MARKET, BY TYPE, 2018-2032 (USD THOUSAND)
TABLE 55 EUROPE POWER TOOLS MARKET, BY APPLICATION, 2018-2032 (USD THOUSAND)
TABLE 56 EUROPE POWER TOOLS MARKET, BY END USER, 2018-2032 (USD THOUSAND)
TABLE 57 EUROPE INDUSTRIAL/PROFESSIONAL IN POWER TOOLS MARKET, BY INDUSTRIAL/PROFESSIONAL TYPE, 2018-2032 (USD THOUSAND)
TABLE 58 EUROPE INDUSTRIAL/PROFESSIONAL IN POWER TOOLS MARKET, BY TYPE, 2018-2032 (USD THOUSAND)
TABLE 59 EUROPE INDUSTRIAL/PROFESSIONAL IN POWER TOOLS MARKET, BY MODE OF OPERATION, 2018-2032 (USD THOUSAND)
TABLE 60 EUROPE RESIDENTIAL IN POWER TOOLS MARKET, BY RESIDENTIAL TYPE, 2018-2032 (USD THOUSAND)
TABLE 61 EUROPE RESIDENTIAL IN POWER TOOLS MARKET, BY TYPE, 2018-2032 (USD THOUSAND)
TABLE 62 EUROPE RESIDENTIAL IN POWER TOOLS MARKET, BY MODE OF OPERATION, 2018-2032 (USD THOUSAND)
TABLE 63 EUROPE POWER TOOLS MARKET, BY SALES CHANNEL, 2018-2032 (USD THOUSAND)
TABLE 64 EUROPE OFFLINE IN POWER TOOLS MARKET, BY TYPE, 2018-2032 (USD THOUSAND)
TABLE 65 EUROPE ONLINE IN POWER TOOLS MARKET, BY TYPE, 2018-2032 (USD THOUSAND)
TABLE 66 EUROPE POWER TOOLS MARKET, BY COUNTRY, 2018-2032 (USD THOUSAND)
TABLE 67 GERMANY POWER TOOLS MARKET, BY TYPE, 2018-2032 (USD THOUSAND)
TABLE 68 GERMANY DRILLING AND FASTENING TOOLS IN POWER TOOLS MARKET, BY TYPE, 2018-2032 (USD THOUSAND)
TABLE 69 GERMANY DRILLING AND FASTENING TOOLS IN POWER TOOLS MARKET, BY MATERIAL, 2018-2032 (USD THOUSAND)
TABLE 70 GERMANY DRILLING AND FASTENING TOOLS IN POWER TOOLS MARKET, BY SALES CHANNEL, 2018-2032 (USD THOUSAND)
TABLE 71 GERMANY ONLINE IN POWER TOOLS MARKET, BY TYPE, 2018-2032 (USD THOUSAND)
TABLE 72 GERMANY OFFLINE IN POWER TOOLS MARKET, BY TYPE, 2018-2032 (USD THOUSAND)
TABLE 73 GERMANY SAWING IN POWER TOOLS MARKET, BY TYPE, 2018-2032 (USD THOUSAND)
TABLE 74 GERMANY SAWING TOOLS IN POWER TOOLS MARKET, BY SALES CHANNEL, 2018-2032 (USD THOUSAND)
TABLE 75 GERMANY ONLINE IN POWER TOOLS MARKET, BY TYPE, 2018-2032 (USD THOUSAND)
TABLE 76 GERMANY OFFLINE IN POWER TOOLS MARKET, BY TYPE, 2018-2032 (USD THOUSAND)
TABLE 77 GERMANY CUTING IN POWER TOOLS MARKET, BY TYPE, 2018-2032 (USD THOUSAND)
TABLE 78 GERMANY CUTING IN POWER TOOLS MARKET, BY SALES CHANNEL, 2018-2032 (USD THOUSAND)
TABLE 79 GERMANY ONLINE IN POWER TOOLS MARKET, BY TYPE, 2018-2032 (USD THOUSAND)
TABLE 80 GERMANY OFFLINE IN POWER TOOLS MARKET, BY TYPE, 2018-2032 (USD THOUSAND)
TABLE 81 GERMANY DEMOLITION TOOLS IN POWER TOOLS MARKET, BY TYPE, 2018-2032 (USD THOUSAND)
TABLE 82 GERMANY DEMOLITION TOOLS IN POWER TOOLS MARKET, BY SALES CHANNEL, 2018-2032 (USD THOUSAND)
TABLE 83 GERMANY ONLINE IN POWER TOOLS MARKET, BY TYPE, 2018-2032 (USD THOUSAND)
TABLE 84 GERMANY OFFLINE IN POWER TOOLS MARKET, BY TYPE, 2018-2032 (USD THOUSAND)
TABLE 85 GERMANY NAILERS IN POWER TOOLS MARKET, BY SALES CHANNEL, 2018-2032 (USD THOUSAND)
TABLE 86 GERMANY ONLINE IN POWER TOOLS MARKET, BY TYPE, 2018-2032 (USD THOUSAND)
TABLE 87 GERMANY OFFLINE IN POWER TOOLS MARKET, BY TYPE, 2018-2032 (USD THOUSAND)
TABLE 88 GERMANY ROUTING TOOLS IN POWER TOOLS MARKET, BY TYPE, 2018-2032 (USD THOUSAND)
TABLE 89 GERMANY ROUTING TOOLS IN POWER TOOLS MARKET, BY SALES CHANNEL, 2018-2032 (USD THOUSAND)
TABLE 90 GERMANY ONLINE IN POWER TOOLS MARKET, BY TYPE, 2018-2032 (USD THOUSAND)
TABLE 91 GERMANY OFFLINE IN POWER TOOLS MARKET, BY TYPE, 2018-2032 (USD THOUSAND)
TABLE 92 GERMANY PORTABLE NIBBLERS IN POWER TOOLS MARKET, BY SALES CHANNEL, 2018-2032 (USD THOUSAND)
TABLE 93 GERMANY ONLINE IN POWER TOOLS MARKET, BY TYPE, 2018-2032 (USD THOUSAND)
TABLE 94 GERMANY OFFLINE IN POWER TOOLS MARKET, BY TYPE, 2018-2032 (USD THOUSAND)
TABLE 95 GERMANY AIR-POWERED TOOLS IN POWER TOOLS MARKET, BY TYPE, 2018-2032 (USD THOUSAND)
TABLE 96 GERMANY AIR-POWERED TOOLS IN POWER TOOLS MARKET, BY SALES CHANNEL, 2018-2032 (USD THOUSAND)
TABLE 97 GERMANY ONLINE IN POWER TOOLS MARKET, BY TYPE, 2018-2032 (USD THOUSAND)
TABLE 98 GERMANY OFFLINE IN POWER TOOLS MARKET, BY TYPE, 2018-2032 (USD THOUSAND)
TABLE 99 GERMANY MATERIAL REMOVAL TOOLS IN POWER TOOLS MARKET, BY TYPE, 2018-2032 (USD THOUSAND)
TABLE 100 GERMANY GRINDERS IN POWER TOOLS MARKET, BY TYPE, 2018-2032 (USD THOUSAND)
TABLE 101 GERMANY SANDERS IN POWER TOOLS MARKET, BY TYPE, 2018-2032 (USD THOUSAND)
TABLE 102 GERMANY MATERIAL REMOVAL TOOLS IN POWER TOOLS MARKET, BY SALES CHANNEL, 2018-2032 (USD THOUSAND)
TABLE 103 GERMANY ONLINE IN POWER TOOLS MARKET, BY TYPE, 2018-2032 (USD THOUSAND)
TABLE 104 GERMANY OFFLINE IN POWER TOOLS MARKET, BY TYPE, 2018-2032 (USD THOUSAND)
TABLE 105 GERMANY SCREWING (SCREWDRIVER BITS) IN POWER TOOLS MARKET, BY SALES CHANNEL, 2018-2032 (USD THOUSAND)
TABLE 106 GERMANY ONLINE IN POWER TOOLS MARKET, BY TYPE, 2018-2032 (USD THOUSAND)
TABLE 107 GERMANY OFFLINE IN POWER TOOLS MARKET, BY TYPE, 2018-2032 (USD THOUSAND)
TABLE 108 GERMANY CHISELS IN POWER TOOLS MARKET, BY SALES CHANNEL, 2018-2032 (USD THOUSAND)
TABLE 109 GERMANY ONLINE IN POWER TOOLS MARKET, BY TYPE, 2018-2032 (USD THOUSAND)
TABLE 110 GERMANY OFFLINE IN POWER TOOLS MARKET, BY TYPE, 2018-2032 (USD THOUSAND)
TABLE 111 GERMANY ACCESSORIES IN POWER TOOLS MARKET, BY SALES CHANNEL, 2018-2032 (USD THOUSAND)
TABLE 112 GERMANY ONLINE IN POWER TOOLS MARKET, BY TYPE, 2018-2032 (USD THOUSAND)
TABLE 113 GERMANY OFFLINE IN POWER TOOLS MARKET, BY TYPE, 2018-2032 (USD THOUSAND)
TABLE 114 GERMANY OTHERS IN POWER TOOLS MARKET, BY SALES CHANNEL, 2018-2032 (USD THOUSAND)
TABLE 115 GERMANY ONLINE IN POWER TOOLS MARKET, BY TYPE, 2018-2032 (USD THOUSAND)
TABLE 116 GERMANY OFFLINE IN POWER TOOLS MARKET, BY TYPE, 2018-2032 (USD THOUSAND)
TABLE 117 GERMANY POWER TOOLS MARKET, BY MODE OF OPERATION, 2018-2032 (USD THOUSAND)
TABLE 118 GERMANY ELECTRIC IN POWER TOOLS MARKET, BY TYPE, 2018-2032 (USD THOUSAND)
TABLE 119 GERMANY POWER TOOLS MARKET, BY APPLICATION, 2018-2032 (USD THOUSAND)
TABLE 120 GERMANY POWER TOOLS MARKET, BY END USER, 2018-2032 (USD THOUSAND)
TABLE 121 GERMANY INDUSTRIAL/PROFESSIONAL IN POWER TOOLS MARKET, BY INDUSTRIAL/PROFESSIONAL TYPE, 2018-2032 (USD THOUSAND)
TABLE 122 GERMANY INDUSTRIAL/PROFESSIONAL IN POWER TOOLS MARKET, BY TYPE, 2018-2032 (USD THOUSAND)
TABLE 123 GERMANY INDUSTRIAL/PROFESSIONAL IN POWER TOOLS MARKET, BY MODE OF OPERATION, 2018-2032 (USD THOUSAND)
TABLE 124 GERMANY RESIDENTIAL IN POWER TOOLS MARKET, BY RESIDENTIAL TYPE, 2018-2032 (USD THOUSAND)
TABLE 125 GERMANY RESIDENTIAL IN POWER TOOLS MARKET, BY TYPE, 2018-2032 (USD THOUSAND)
TABLE 126 GERMANY RESIDENTIAL IN POWER TOOLS MARKET, BY MODE OF OPERATION, 2018-2032 (USD THOUSAND)
TABLE 127 GERMANY POWER TOOLS MARKET, BY SALES CHANNEL, 2018-2032 (USD THOUSAND)
TABLE 128 GERMANY ONLINE IN POWER TOOLS MARKET, BY TYPE, 2018-2032 (USD THOUSAND)
TABLE 129 GERMANY OFFLINE IN POWER TOOLS MARKET, BY TYPE, 2018-2032 (USD THOUSAND)
TABLE 130 FRANCE POWER TOOLS MARKET, BY TYPE, 2018-2032 (USD THOUSAND)
TABLE 131 FRANCE DRILLING AND FASTENING TOOLS IN POWER TOOLS MARKET, BY TYPE, 2018-2032 (USD THOUSAND)
TABLE 132 FRANCE DRILLING AND FASTENING TOOLS IN POWER TOOLS MARKET, BY MATERIAL, 2018-2032 (USD THOUSAND)
TABLE 133 FRANCE DRILLING AND FASTENING TOOLS IN POWER TOOLS MARKET, BY SALES CHANNEL, 2018-2032 (USD THOUSAND)
TABLE 134 FRANCE ONLINE IN POWER TOOLS MARKET, BY TYPE, 2018-2032 (USD THOUSAND)
TABLE 135 FRANCE OFFLINE IN POWER TOOLS MARKET, BY TYPE, 2018-2032 (USD THOUSAND)
TABLE 136 FRANCE SAWING IN POWER TOOLS MARKET, BY TYPE, 2018-2032 (USD THOUSAND)
TABLE 137 FRANCE SAWING TOOLS IN POWER TOOLS MARKET, BY SALES CHANNEL, 2018-2032 (USD THOUSAND)
TABLE 138 FRANCE ONLINE IN POWER TOOLS MARKET, BY TYPE, 2018-2032 (USD THOUSAND)
TABLE 139 FRANCE OFFLINE IN POWER TOOLS MARKET, BY TYPE, 2018-2032 (USD THOUSAND)
TABLE 140 FRANCE CUTING IN POWER TOOLS MARKET, BY TYPE, 2018-2032 (USD THOUSAND)
TABLE 141 FRANCE CUTING IN POWER TOOLS MARKET, BY SALES CHANNEL, 2018-2032 (USD THOUSAND)
TABLE 142 FRANCE ONLINE IN POWER TOOLS MARKET, BY TYPE, 2018-2032 (USD THOUSAND)
TABLE 143 FRANCE OFFLINE IN POWER TOOLS MARKET, BY TYPE, 2018-2032 (USD THOUSAND)
TABLE 144 FRANCE DEMOLITION TOOLS IN POWER TOOLS MARKET, BY TYPE, 2018-2032 (USD THOUSAND)
TABLE 145 FRANCE DEMOLITION TOOLS IN POWER TOOLS MARKET, BY SALES CHANNEL, 2018-2032 (USD THOUSAND)
TABLE 146 FRANCE ONLINE IN POWER TOOLS MARKET, BY TYPE, 2018-2032 (USD THOUSAND)
TABLE 147 FRANCE OFFLINE IN POWER TOOLS MARKET, BY TYPE, 2018-2032 (USD THOUSAND)
TABLE 148 FRANCE NAILERS IN POWER TOOLS MARKET, BY SALES CHANNEL, 2018-2032 (USD THOUSAND)
TABLE 149 FRANCE ONLINE IN POWER TOOLS MARKET, BY TYPE, 2018-2032 (USD THOUSAND)
TABLE 150 FRANCE OFFLINE IN POWER TOOLS MARKET, BY TYPE, 2018-2032 (USD THOUSAND)
TABLE 151 FRANCE ROUTING TOOLS IN POWER TOOLS MARKET, BY TYPE, 2018-2032 (USD THOUSAND)
TABLE 152 FRANCE ROUTING TOOLS IN POWER TOOLS MARKET, BY SALES CHANNEL, 2018-2032 (USD THOUSAND)
TABLE 153 FRANCE ONLINE IN POWER TOOLS MARKET, BY TYPE, 2018-2032 (USD THOUSAND)
TABLE 154 FRANCE OFFLINE IN POWER TOOLS MARKET, BY TYPE, 2018-2032 (USD THOUSAND)
TABLE 155 FRANCE PORTABLE NIBBLERS IN POWER TOOLS MARKET, BY SALES CHANNEL, 2018-2032 (USD THOUSAND)
TABLE 156 FRANCE ONLINE IN POWER TOOLS MARKET, BY TYPE, 2018-2032 (USD THOUSAND)
TABLE 157 FRANCE OFFLINE IN POWER TOOLS MARKET, BY TYPE, 2018-2032 (USD THOUSAND)
TABLE 158 FRANCE AIR-POWERED TOOLS IN POWER TOOLS MARKET, BY TYPE, 2018-2032 (USD THOUSAND)
TABLE 159 FRANCE AIR-POWERED TOOLS IN POWER TOOLS MARKET, BY SALES CHANNEL, 2018-2032 (USD THOUSAND)
TABLE 160 FRANCE ONLINE IN POWER TOOLS MARKET, BY TYPE, 2018-2032 (USD THOUSAND)
TABLE 161 FRANCE OFFLINE IN POWER TOOLS MARKET, BY TYPE, 2018-2032 (USD THOUSAND)
TABLE 162 FRANCE MATERIAL REMOVAL TOOLS IN POWER TOOLS MARKET, BY TYPE, 2018-2032 (USD THOUSAND)
TABLE 163 FRANCE GRINDERS IN POWER TOOLS MARKET, BY TYPE, 2018-2032 (USD THOUSAND)
TABLE 164 FRANCE SANDERS IN POWER TOOLS MARKET, BY TYPE, 2018-2032 (USD THOUSAND)
TABLE 165 FRANCE MATERIAL REMOVAL TOOLS IN POWER TOOLS MARKET, BY SALES CHANNEL, 2018-2032 (USD THOUSAND)
TABLE 166 FRANCE ONLINE IN POWER TOOLS MARKET, BY TYPE, 2018-2032 (USD THOUSAND)
TABLE 167 FRANCE OFFLINE IN POWER TOOLS MARKET, BY TYPE, 2018-2032 (USD THOUSAND)
TABLE 168 FRANCE SCREWING (SCREWDRIVER BITS) IN POWER TOOLS MARKET, BY SALES CHANNEL, 2018-2032 (USD THOUSAND)
TABLE 169 FRANCE ONLINE IN POWER TOOLS MARKET, BY TYPE, 2018-2032 (USD THOUSAND)
TABLE 170 FRANCE OFFLINE IN POWER TOOLS MARKET, BY TYPE, 2018-2032 (USD THOUSAND)
TABLE 171 FRANCE CHISELS IN POWER TOOLS MARKET, BY SALES CHANNEL, 2018-2032 (USD THOUSAND)
TABLE 172 FRANCE ONLINE IN POWER TOOLS MARKET, BY TYPE, 2018-2032 (USD THOUSAND)
TABLE 173 FRANCE OFFLINE IN POWER TOOLS MARKET, BY TYPE, 2018-2032 (USD THOUSAND)
TABLE 174 FRANCE ACCESSORIES IN POWER TOOLS MARKET, BY SALES CHANNEL, 2018-2032 (USD THOUSAND)
TABLE 175 FRANCE ONLINE IN POWER TOOLS MARKET, BY TYPE, 2018-2032 (USD THOUSAND)
TABLE 176 FRANCE OFFLINE IN POWER TOOLS MARKET, BY TYPE, 2018-2032 (USD THOUSAND)
TABLE 177 FRANCE OTHERS IN POWER TOOLS MARKET, BY SALES CHANNEL, 2018-2032 (USD THOUSAND)
TABLE 178 FRANCE ONLINE IN POWER TOOLS MARKET, BY TYPE, 2018-2032 (USD THOUSAND)
TABLE 179 FRANCE OFFLINE IN POWER TOOLS MARKET, BY TYPE, 2018-2032 (USD THOUSAND)
TABLE 180 FRANCE POWER TOOLS MARKET, BY MODE OF OPERATION, 2018-2032 (USD THOUSAND)
TABLE 181 FRANCE ELECTRIC IN POWER TOOLS MARKET, BY TYPE, 2018-2032 (USD THOUSAND)
TABLE 182 FRANCE POWER TOOLS MARKET, BY APPLICATION, 2018-2032 (USD THOUSAND)
TABLE 183 FRANCE POWER TOOLS MARKET, BY END USER, 2018-2032 (USD THOUSAND)
TABLE 184 FRANCE INDUSTRIAL/PROFESSIONAL IN POWER TOOLS MARKET, BY INDUSTRIAL/PROFESSIONAL TYPE, 2018-2032 (USD THOUSAND)
TABLE 185 FRANCE INDUSTRIAL/PROFESSIONAL IN POWER TOOLS MARKET, BY TYPE, 2018-2032 (USD THOUSAND)
TABLE 186 FRANCE INDUSTRIAL/PROFESSIONAL IN POWER TOOLS MARKET, BY MODE OF OPERATION, 2018-2032 (USD THOUSAND)
TABLE 187 FRANCE RESIDENTIAL IN POWER TOOLS MARKET, BY RESIDENTIAL TYPE, 2018-2032 (USD THOUSAND)
TABLE 188 FRANCE RESIDENTIAL IN POWER TOOLS MARKET, BY TYPE, 2018-2032 (USD THOUSAND)
TABLE 189 FRANCE RESIDENTIAL IN POWER TOOLS MARKET, BY MODE OF OPERATION, 2018-2032 (USD THOUSAND)
TABLE 190 FRANCE POWER TOOLS MARKET, BY SALES CHANNEL, 2018-2032 (USD THOUSAND)
TABLE 191 FRANCE ONLINE IN POWER TOOLS MARKET, BY TYPE, 2018-2032 (USD THOUSAND)
TABLE 192 FRANCE OFFLINE IN POWER TOOLS MARKET, BY TYPE, 2018-2032 (USD THOUSAND)
TABLE 193 U.K. POWER TOOLS MARKET, BY TYPE, 2018-2032 (USD THOUSAND)
TABLE 194 U.K. DRILLING AND FASTENING TOOLS IN POWER TOOLS MARKET, BY TYPE, 2018-2032 (USD THOUSAND)
TABLE 195 U.K. DRILLING AND FASTENING TOOLS IN POWER TOOLS MARKET, BY MATERIAL, 2018-2032 (USD THOUSAND)
TABLE 196 U.K. DRILLING AND FASTENING TOOLS IN POWER TOOLS MARKET, BY SALES CHANNEL, 2018-2032 (USD THOUSAND)
TABLE 197 U.K. ONLINE IN POWER TOOLS MARKET, BY TYPE, 2018-2032 (USD THOUSAND)
TABLE 198 U.K. OFFLINE IN POWER TOOLS MARKET, BY TYPE, 2018-2032 (USD THOUSAND)
TABLE 199 U.K. SAWING IN POWER TOOLS MARKET, BY TYPE, 2018-2032 (USD THOUSAND)
TABLE 200 U.K. SAWING TOOLS IN POWER TOOLS MARKET, BY SALES CHANNEL, 2018-2032 (USD THOUSAND)
TABLE 201 U.K. ONLINE IN POWER TOOLS MARKET, BY TYPE, 2018-2032 (USD THOUSAND)
TABLE 202 U.K. OFFLINE IN POWER TOOLS MARKET, BY TYPE, 2018-2032 (USD THOUSAND)
TABLE 203 U.K. CUTING IN POWER TOOLS MARKET, BY TYPE, 2018-2032 (USD THOUSAND)
TABLE 204 U.K. CUTING IN POWER TOOLS MARKET, BY SALES CHANNEL, 2018-2032 (USD THOUSAND)
TABLE 205 U.K. ONLINE IN POWER TOOLS MARKET, BY TYPE, 2018-2032 (USD THOUSAND)
TABLE 206 U.K. OFFLINE IN POWER TOOLS MARKET, BY TYPE, 2018-2032 (USD THOUSAND)
TABLE 207 U.K. DEMOLITION TOOLS IN POWER TOOLS MARKET, BY TYPE, 2018-2032 (USD THOUSAND)
TABLE 208 U.K. DEMOLITION TOOLS IN POWER TOOLS MARKET, BY SALES CHANNEL, 2018-2032 (USD THOUSAND)
TABLE 209 U.K. ONLINE IN POWER TOOLS MARKET, BY TYPE, 2018-2032 (USD THOUSAND)
TABLE 210 U.K. OFFLINE IN POWER TOOLS MARKET, BY TYPE, 2018-2032 (USD THOUSAND)
TABLE 211 U.K. NAILERS IN POWER TOOLS MARKET, BY SALES CHANNEL, 2018-2032 (USD THOUSAND)
TABLE 212 U.K. ONLINE IN POWER TOOLS MARKET, BY TYPE, 2018-2032 (USD THOUSAND)
TABLE 213 U.K. OFFLINE IN POWER TOOLS MARKET, BY TYPE, 2018-2032 (USD THOUSAND)
TABLE 214 U.K. ROUTING TOOLS IN POWER TOOLS MARKET, BY TYPE, 2018-2032 (USD THOUSAND)
TABLE 215 U.K. ROUTING TOOLS IN POWER TOOLS MARKET, BY SALES CHANNEL, 2018-2032 (USD THOUSAND)
TABLE 216 U.K. ONLINE IN POWER TOOLS MARKET, BY TYPE, 2018-2032 (USD THOUSAND)
TABLE 217 U.K. OFFLINE IN POWER TOOLS MARKET, BY TYPE, 2018-2032 (USD THOUSAND)
TABLE 218 U.K. PORTABLE NIBBLERS IN POWER TOOLS MARKET, BY SALES CHANNEL, 2018-2032 (USD THOUSAND)
TABLE 219 U.K. ONLINE IN POWER TOOLS MARKET, BY TYPE, 2018-2032 (USD THOUSAND)
TABLE 220 U.K. OFFLINE IN POWER TOOLS MARKET, BY TYPE, 2018-2032 (USD THOUSAND)
TABLE 221 U.K. AIR-POWERED TOOLS IN POWER TOOLS MARKET, BY TYPE, 2018-2032 (USD THOUSAND)
TABLE 222 U.K. AIR-POWERED TOOLS IN POWER TOOLS MARKET, BY SALES CHANNEL, 2018-2032 (USD THOUSAND)
TABLE 223 U.K. ONLINE IN POWER TOOLS MARKET, BY TYPE, 2018-2032 (USD THOUSAND)
TABLE 224 U.K. OFFLINE IN POWER TOOLS MARKET, BY TYPE, 2018-2032 (USD THOUSAND)
TABLE 225 U.K. MATERIAL REMOVAL TOOLS IN POWER TOOLS MARKET, BY TYPE, 2018-2032 (USD THOUSAND)
TABLE 226 U.K. GRINDERS IN POWER TOOLS MARKET, BY TYPE, 2018-2032 (USD THOUSAND)
TABLE 227 U.K. SANDERS IN POWER TOOLS MARKET, BY TYPE, 2018-2032 (USD THOUSAND)
TABLE 228 U.K. MATERIAL REMOVAL TOOLS IN POWER TOOLS MARKET, BY SALES CHANNEL, 2018-2032 (USD THOUSAND)
TABLE 229 U.K. ONLINE IN POWER TOOLS MARKET, BY TYPE, 2018-2032 (USD THOUSAND)
TABLE 230 U.K. OFFLINE IN POWER TOOLS MARKET, BY TYPE, 2018-2032 (USD THOUSAND)
TABLE 231 U.K. SCREWING (SCREWDRIVER BITS) IN POWER TOOLS MARKET, BY SALES CHANNEL, 2018-2032 (USD THOUSAND)
TABLE 232 U.K. ONLINE IN POWER TOOLS MARKET, BY TYPE, 2018-2032 (USD THOUSAND)
TABLE 233 U.K. OFFLINE IN POWER TOOLS MARKET, BY TYPE, 2018-2032 (USD THOUSAND)
TABLE 234 U.K. CHISELS IN POWER TOOLS MARKET, BY SALES CHANNEL, 2018-2032 (USD THOUSAND)
TABLE 235 U.K. ONLINE IN POWER TOOLS MARKET, BY TYPE, 2018-2032 (USD THOUSAND)
TABLE 236 U.K. OFFLINE IN POWER TOOLS MARKET, BY TYPE, 2018-2032 (USD THOUSAND)
TABLE 237 U.K. ACCESSORIES IN POWER TOOLS MARKET, BY SALES CHANNEL, 2018-2032 (USD THOUSAND)
TABLE 238 U.K. ONLINE IN POWER TOOLS MARKET, BY TYPE, 2018-2032 (USD THOUSAND)
TABLE 239 U.K. OFFLINE IN POWER TOOLS MARKET, BY TYPE, 2018-2032 (USD THOUSAND)
TABLE 240 U.K. OTHERS IN POWER TOOLS MARKET, BY SALES CHANNEL, 2018-2032 (USD THOUSAND)
TABLE 241 U.K. ONLINE IN POWER TOOLS MARKET, BY TYPE, 2018-2032 (USD THOUSAND)
TABLE 242 U.K. OFFLINE IN POWER TOOLS MARKET, BY TYPE, 2018-2032 (USD THOUSAND)
TABLE 243 U.K. POWER TOOLS MARKET, BY MODE OF OPERATION, 2018-2032 (USD THOUSAND)
TABLE 244 U.K. ELECTRIC IN POWER TOOLS MARKET, BY TYPE, 2018-2032 (USD THOUSAND)
TABLE 245 U.K. POWER TOOLS MARKET, BY APPLICATION, 2018-2032 (USD THOUSAND)
TABLE 246 U.K. POWER TOOLS MARKET, BY END USER, 2018-2032 (USD THOUSAND)
TABLE 247 U.K. INDUSTRIAL/PROFESSIONAL IN POWER TOOLS MARKET, BY INDUSTRIAL/PROFESSIONAL TYPE, 2018-2032 (USD THOUSAND)
TABLE 248 U.K. INDUSTRIAL/PROFESSIONAL IN POWER TOOLS MARKET, BY TYPE, 2018-2032 (USD THOUSAND)
TABLE 249 U.K. INDUSTRIAL/PROFESSIONAL IN POWER TOOLS MARKET, BY MODE OF OPERATION, 2018-2032 (USD THOUSAND)
TABLE 250 U.K. RESIDENTIAL IN POWER TOOLS MARKET, BY RESIDENTIAL TYPE, 2018-2032 (USD THOUSAND)
TABLE 251 U.K. RESIDENTIAL IN POWER TOOLS MARKET, BY TYPE, 2018-2032 (USD THOUSAND)
TABLE 252 U.K. RESIDENTIAL IN POWER TOOLS MARKET, BY MODE OF OPERATION, 2018-2032 (USD THOUSAND)
TABLE 253 U.K. POWER TOOLS MARKET, BY SALES CHANNEL, 2018-2032 (USD THOUSAND)
TABLE 254 U.K. ONLINE IN POWER TOOLS MARKET, BY TYPE, 2018-2032 (USD THOUSAND)
TABLE 255 U.K. OFFLINE IN POWER TOOLS MARKET, BY TYPE, 2018-2032 (USD THOUSAND)
TABLE 256 ITALY POWER TOOLS MARKET, BY TYPE, 2018-2032 (USD THOUSAND)
TABLE 257 ITALY DRILLING AND FASTENING TOOLS IN POWER TOOLS MARKET, BY TYPE, 2018-2032 (USD THOUSAND)
TABLE 258 ITALY DRILLING AND FASTENING TOOLS IN POWER TOOLS MARKET, BY MATERIAL, 2018-2032 (USD THOUSAND)
TABLE 259 ITALY DRILLING AND FASTENING TOOLS IN POWER TOOLS MARKET, BY SALES CHANNEL, 2018-2032 (USD THOUSAND)
TABLE 260 ITALY ONLINE IN POWER TOOLS MARKET, BY TYPE, 2018-2032 (USD THOUSAND)
TABLE 261 ITALY OFFLINE IN POWER TOOLS MARKET, BY TYPE, 2018-2032 (USD THOUSAND)
TABLE 262 ITALY SAWING IN POWER TOOLS MARKET, BY TYPE, 2018-2032 (USD THOUSAND)
TABLE 263 ITALY SAWING TOOLS IN POWER TOOLS MARKET, BY SALES CHANNEL, 2018-2032 (USD THOUSAND)
TABLE 264 ITALY ONLINE IN POWER TOOLS MARKET, BY TYPE, 2018-2032 (USD THOUSAND)
TABLE 265 ITALY OFFLINE IN POWER TOOLS MARKET, BY TYPE, 2018-2032 (USD THOUSAND)
TABLE 266 ITALY CUTING IN POWER TOOLS MARKET, BY TYPE, 2018-2032 (USD THOUSAND)
TABLE 267 ITALY CUTING IN POWER TOOLS MARKET, BY SALES CHANNEL, 2018-2032 (USD THOUSAND)
TABLE 268 ITALY ONLINE IN POWER TOOLS MARKET, BY TYPE, 2018-2032 (USD THOUSAND)
TABLE 269 ITALY OFFLINE IN POWER TOOLS MARKET, BY TYPE, 2018-2032 (USD THOUSAND)
TABLE 270 ITALY DEMOLITION TOOLS IN POWER TOOLS MARKET, BY TYPE, 2018-2032 (USD THOUSAND)
TABLE 271 ITALY DEMOLITION TOOLS IN POWER TOOLS MARKET, BY SALES CHANNEL, 2018-2032 (USD THOUSAND)
TABLE 272 ITALY ONLINE IN POWER TOOLS MARKET, BY TYPE, 2018-2032 (USD THOUSAND)
TABLE 273 ITALY OFFLINE IN POWER TOOLS MARKET, BY TYPE, 2018-2032 (USD THOUSAND)
TABLE 274 ITALY NAILERS IN POWER TOOLS MARKET, BY SALES CHANNEL, 2018-2032 (USD THOUSAND)
TABLE 275 ITALY ONLINE IN POWER TOOLS MARKET, BY TYPE, 2018-2032 (USD THOUSAND)
TABLE 276 ITALY OFFLINE IN POWER TOOLS MARKET, BY TYPE, 2018-2032 (USD THOUSAND)
TABLE 277 ITALY ROUTING TOOLS IN POWER TOOLS MARKET, BY TYPE, 2018-2032 (USD THOUSAND)
TABLE 278 ITALY ROUTING TOOLS IN POWER TOOLS MARKET, BY SALES CHANNEL, 2018-2032 (USD THOUSAND)
TABLE 279 ITALY ONLINE IN POWER TOOLS MARKET, BY TYPE, 2018-2032 (USD THOUSAND)
TABLE 280 ITALY OFFLINE IN POWER TOOLS MARKET, BY TYPE, 2018-2032 (USD THOUSAND)
TABLE 281 ITALY PORTABLE NIBBLERS IN POWER TOOLS MARKET, BY SALES CHANNEL, 2018-2032 (USD THOUSAND)
TABLE 282 ITALY ONLINE IN POWER TOOLS MARKET, BY TYPE, 2018-2032 (USD THOUSAND)
TABLE 283 ITALY OFFLINE IN POWER TOOLS MARKET, BY TYPE, 2018-2032 (USD THOUSAND)
TABLE 284 ITALY AIR-POWERED TOOLS IN POWER TOOLS MARKET, BY TYPE, 2018-2032 (USD THOUSAND)
TABLE 285 ITALY AIR-POWERED TOOLS IN POWER TOOLS MARKET, BY SALES CHANNEL, 2018-2032 (USD THOUSAND)
TABLE 286 ITALY ONLINE IN POWER TOOLS MARKET, BY TYPE, 2018-2032 (USD THOUSAND)
TABLE 287 ITALY OFFLINE IN POWER TOOLS MARKET, BY TYPE, 2018-2032 (USD THOUSAND)
TABLE 288 ITALY MATERIAL REMOVAL TOOLS IN POWER TOOLS MARKET, BY TYPE, 2018-2032 (USD THOUSAND)
TABLE 289 ITALY GRINDERS IN POWER TOOLS MARKET, BY TYPE, 2018-2032 (USD THOUSAND)
TABLE 290 ITALY SANDERS IN POWER TOOLS MARKET, BY TYPE, 2018-2032 (USD THOUSAND)
TABLE 291 ITALY MATERIAL REMOVAL TOOLS IN POWER TOOLS MARKET, BY SALES CHANNEL, 2018-2032 (USD THOUSAND)
TABLE 292 ITALY ONLINE IN POWER TOOLS MARKET, BY TYPE, 2018-2032 (USD THOUSAND)
TABLE 293 ITALY OFFLINE IN POWER TOOLS MARKET, BY TYPE, 2018-2032 (USD THOUSAND)
TABLE 294 ITALY SCREWING (SCREWDRIVER BITS) IN POWER TOOLS MARKET, BY SALES CHANNEL, 2018-2032 (USD THOUSAND)
TABLE 295 ITALY ONLINE IN POWER TOOLS MARKET, BY TYPE, 2018-2032 (USD THOUSAND)
TABLE 296 ITALY OFFLINE IN POWER TOOLS MARKET, BY TYPE, 2018-2032 (USD THOUSAND)
TABLE 297 ITALY CHISELS IN POWER TOOLS MARKET, BY SALES CHANNEL, 2018-2032 (USD THOUSAND)
TABLE 298 ITALY ONLINE IN POWER TOOLS MARKET, BY TYPE, 2018-2032 (USD THOUSAND)
TABLE 299 ITALY OFFLINE IN POWER TOOLS MARKET, BY TYPE, 2018-2032 (USD THOUSAND)
TABLE 300 ITALY ACCESSORIES IN POWER TOOLS MARKET, BY SALES CHANNEL, 2018-2032 (USD THOUSAND)
TABLE 301 ITALY ONLINE IN POWER TOOLS MARKET, BY TYPE, 2018-2032 (USD THOUSAND)
TABLE 302 ITALY OFFLINE IN POWER TOOLS MARKET, BY TYPE, 2018-2032 (USD THOUSAND)
TABLE 303 ITALY OTHERS IN POWER TOOLS MARKET, BY SALES CHANNEL, 2018-2032 (USD THOUSAND)
TABLE 304 ITALY ONLINE IN POWER TOOLS MARKET, BY TYPE, 2018-2032 (USD THOUSAND)
TABLE 305 ITALY OFFLINE IN POWER TOOLS MARKET, BY TYPE, 2018-2032 (USD THOUSAND)
TABLE 306 ITALY POWER TOOLS MARKET, BY MODE OF OPERATION, 2018-2032 (USD THOUSAND)
TABLE 307 ITALY ELECTRIC IN POWER TOOLS MARKET, BY TYPE, 2018-2032 (USD THOUSAND)
TABLE 308 ITALY POWER TOOLS MARKET, BY APPLICATION, 2018-2032 (USD THOUSAND)
TABLE 309 ITALY POWER TOOLS MARKET, BY END USER, 2018-2032 (USD THOUSAND)
TABLE 310 ITALY INDUSTRIAL/PROFESSIONAL IN POWER TOOLS MARKET, BY INDUSTRIAL/PROFESSIONAL TYPE, 2018-2032 (USD THOUSAND)
TABLE 311 ITALY INDUSTRIAL/PROFESSIONAL IN POWER TOOLS MARKET, BY TYPE, 2018-2032 (USD THOUSAND)
TABLE 312 ITALY INDUSTRIAL/PROFESSIONAL IN POWER TOOLS MARKET, BY MODE OF OPERATION, 2018-2032 (USD THOUSAND)
TABLE 313 ITALY RESIDENTIAL IN POWER TOOLS MARKET, BY RESIDENTIAL TYPE, 2018-2032 (USD THOUSAND)
TABLE 314 ITALY RESIDENTIAL IN POWER TOOLS MARKET, BY TYPE, 2018-2032 (USD THOUSAND)
TABLE 315 ITALY RESIDENTIAL IN POWER TOOLS MARKET, BY MODE OF OPERATION, 2018-2032 (USD THOUSAND)
TABLE 316 ITALY POWER TOOLS MARKET, BY SALES CHANNEL, 2018-2032 (USD THOUSAND)
TABLE 317 ITALY ONLINE IN POWER TOOLS MARKET, BY TYPE, 2018-2032 (USD THOUSAND)
TABLE 318 ITALY OFFLINE IN POWER TOOLS MARKET, BY TYPE, 2018-2032 (USD THOUSAND)
TABLE 319 SPAIN POWER TOOLS MARKET, BY TYPE, 2018-2032 (USD THOUSAND)
TABLE 320 SPAIN DRILLING AND FASTENING TOOLS IN POWER TOOLS MARKET, BY TYPE, 2018-2032 (USD THOUSAND)
TABLE 321 SPAIN DRILLING AND FASTENING TOOLS IN POWER TOOLS MARKET, BY MATERIAL, 2018-2032 (USD THOUSAND)
TABLE 322 SPAIN DRILLING AND FASTENING TOOLS IN POWER TOOLS MARKET, BY SALES CHANNEL, 2018-2032 (USD THOUSAND)
TABLE 323 SPAIN ONLINE IN POWER TOOLS MARKET, BY TYPE, 2018-2032 (USD THOUSAND)
TABLE 324 SPAIN OFFLINE IN POWER TOOLS MARKET, BY TYPE, 2018-2032 (USD THOUSAND)
TABLE 325 SPAIN SAWING IN POWER TOOLS MARKET, BY TYPE, 2018-2032 (USD THOUSAND)
TABLE 326 SPAIN SAWING TOOLS IN POWER TOOLS MARKET, BY SALES CHANNEL, 2018-2032 (USD THOUSAND)
TABLE 327 SPAIN ONLINE IN POWER TOOLS MARKET, BY TYPE, 2018-2032 (USD THOUSAND)
TABLE 328 SPAIN OFFLINE IN POWER TOOLS MARKET, BY TYPE, 2018-2032 (USD THOUSAND)
TABLE 329 SPAIN CUTING IN POWER TOOLS MARKET, BY TYPE, 2018-2032 (USD THOUSAND)
TABLE 330 SPAIN CUTING IN POWER TOOLS MARKET, BY SALES CHANNEL, 2018-2032 (USD THOUSAND)
TABLE 331 SPAIN ONLINE IN POWER TOOLS MARKET, BY TYPE, 2018-2032 (USD THOUSAND)
TABLE 332 SPAIN OFFLINE IN POWER TOOLS MARKET, BY TYPE, 2018-2032 (USD THOUSAND)
TABLE 333 SPAIN DEMOLITION TOOLS IN POWER TOOLS MARKET, BY TYPE, 2018-2032 (USD THOUSAND)
TABLE 334 SPAIN DEMOLITION TOOLS IN POWER TOOLS MARKET, BY SALES CHANNEL, 2018-2032 (USD THOUSAND)
TABLE 335 SPAIN ONLINE IN POWER TOOLS MARKET, BY TYPE, 2018-2032 (USD THOUSAND)
TABLE 336 SPAIN OFFLINE IN POWER TOOLS MARKET, BY TYPE, 2018-2032 (USD THOUSAND)
TABLE 337 SPAIN NAILERS IN POWER TOOLS MARKET, BY SALES CHANNEL, 2018-2032 (USD THOUSAND)
TABLE 338 SPAIN ONLINE IN POWER TOOLS MARKET, BY TYPE, 2018-2032 (USD THOUSAND)
TABLE 339 SPAIN OFFLINE IN POWER TOOLS MARKET, BY TYPE, 2018-2032 (USD THOUSAND)
TABLE 340 SPAIN ROUTING TOOLS IN POWER TOOLS MARKET, BY TYPE, 2018-2032 (USD THOUSAND)
TABLE 341 SPAIN ROUTING TOOLS IN POWER TOOLS MARKET, BY SALES CHANNEL, 2018-2032 (USD THOUSAND)
TABLE 342 SPAIN ONLINE IN POWER TOOLS MARKET, BY TYPE, 2018-2032 (USD THOUSAND)
TABLE 343 SPAIN OFFLINE IN POWER TOOLS MARKET, BY TYPE, 2018-2032 (USD THOUSAND)
TABLE 344 SPAIN PORTABLE NIBBLERS IN POWER TOOLS MARKET, BY SALES CHANNEL, 2018-2032 (USD THOUSAND)
TABLE 345 SPAIN ONLINE IN POWER TOOLS MARKET, BY TYPE, 2018-2032 (USD THOUSAND)
TABLE 346 SPAIN OFFLINE IN POWER TOOLS MARKET, BY TYPE, 2018-2032 (USD THOUSAND)
TABLE 347 SPAIN AIR-POWERED TOOLS IN POWER TOOLS MARKET, BY TYPE, 2018-2032 (USD THOUSAND)
TABLE 348 SPAIN AIR-POWERED TOOLS IN POWER TOOLS MARKET, BY SALES CHANNEL, 2018-2032 (USD THOUSAND)
TABLE 349 SPAIN ONLINE IN POWER TOOLS MARKET, BY TYPE, 2018-2032 (USD THOUSAND)
TABLE 350 SPAIN OFFLINE IN POWER TOOLS MARKET, BY TYPE, 2018-2032 (USD THOUSAND)
TABLE 351 SPAIN MATERIAL REMOVAL TOOLS IN POWER TOOLS MARKET, BY TYPE, 2018-2032 (USD THOUSAND)
TABLE 352 SPAIN GRINDERS IN POWER TOOLS MARKET, BY TYPE, 2018-2032 (USD THOUSAND)
TABLE 353 SPAIN SANDERS IN POWER TOOLS MARKET, BY TYPE, 2018-2032 (USD THOUSAND)
TABLE 354 SPAIN MATERIAL REMOVAL TOOLS IN POWER TOOLS MARKET, BY SALES CHANNEL, 2018-2032 (USD THOUSAND)
TABLE 355 SPAIN ONLINE IN POWER TOOLS MARKET, BY TYPE, 2018-2032 (USD THOUSAND)
TABLE 356 SPAIN OFFLINE IN POWER TOOLS MARKET, BY TYPE, 2018-2032 (USD THOUSAND)
TABLE 357 SPAIN SCREWING (SCREWDRIVER BITS) IN POWER TOOLS MARKET, BY SALES CHANNEL, 2018-2032 (USD THOUSAND)
TABLE 358 SPAIN ONLINE IN POWER TOOLS MARKET, BY TYPE, 2018-2032 (USD THOUSAND)
TABLE 359 SPAIN OFFLINE IN POWER TOOLS MARKET, BY TYPE, 2018-2032 (USD THOUSAND)
TABLE 360 SPAIN CHISELS IN POWER TOOLS MARKET, BY SALES CHANNEL, 2018-2032 (USD THOUSAND)
TABLE 361 SPAIN ONLINE IN POWER TOOLS MARKET, BY TYPE, 2018-2032 (USD THOUSAND)
TABLE 362 SPAIN OFFLINE IN POWER TOOLS MARKET, BY TYPE, 2018-2032 (USD THOUSAND)
TABLE 363 SPAIN ACCESSORIES IN POWER TOOLS MARKET, BY SALES CHANNEL, 2018-2032 (USD THOUSAND)
TABLE 364 SPAIN ONLINE IN POWER TOOLS MARKET, BY TYPE, 2018-2032 (USD THOUSAND)
TABLE 365 SPAIN OFFLINE IN POWER TOOLS MARKET, BY TYPE, 2018-2032 (USD THOUSAND)
TABLE 366 SPAIN OTHERS IN POWER TOOLS MARKET, BY SALES CHANNEL, 2018-2032 (USD THOUSAND)
TABLE 367 SPAIN ONLINE IN POWER TOOLS MARKET, BY TYPE, 2018-2032 (USD THOUSAND)
TABLE 368 SPAIN OFFLINE IN POWER TOOLS MARKET, BY TYPE, 2018-2032 (USD THOUSAND)
TABLE 369 SPAIN POWER TOOLS MARKET, BY MODE OF OPERATION, 2018-2032 (USD THOUSAND)
TABLE 370 SPAIN ELECTRIC IN POWER TOOLS MARKET, BY TYPE, 2018-2032 (USD THOUSAND)
TABLE 371 SPAIN POWER TOOLS MARKET, BY APPLICATION, 2018-2032 (USD THOUSAND)
TABLE 372 SPAIN POWER TOOLS MARKET, BY END USER, 2018-2032 (USD THOUSAND)
TABLE 373 SPAIN INDUSTRIAL/PROFESSIONAL IN POWER TOOLS MARKET, BY INDUSTRIAL/PROFESSIONAL TYPE, 2018-2032 (USD THOUSAND)
TABLE 374 SPAIN INDUSTRIAL/PROFESSIONAL IN POWER TOOLS MARKET, BY TYPE, 2018-2032 (USD THOUSAND)
TABLE 375 SPAIN INDUSTRIAL/PROFESSIONAL IN POWER TOOLS MARKET, BY MODE OF OPERATION, 2018-2032 (USD THOUSAND)
TABLE 376 SPAIN RESIDENTIAL IN POWER TOOLS MARKET, BY RESIDENTIAL TYPE, 2018-2032 (USD THOUSAND)
TABLE 377 SPAIN RESIDENTIAL IN POWER TOOLS MARKET, BY TYPE, 2018-2032 (USD THOUSAND)
TABLE 378 SPAIN RESIDENTIAL IN POWER TOOLS MARKET, BY MODE OF OPERATION, 2018-2032 (USD THOUSAND)
TABLE 379 SPAIN POWER TOOLS MARKET, BY SALES CHANNEL, 2018-2032 (USD THOUSAND)
TABLE 380 SPAIN ONLINE IN POWER TOOLS MARKET, BY TYPE, 2018-2032 (USD THOUSAND)
TABLE 381 SPAIN OFFLINE IN POWER TOOLS MARKET, BY TYPE, 2018-2032 (USD THOUSAND)
TABLE 382 POLAND POWER TOOLS MARKET, BY TYPE, 2018-2032 (USD THOUSAND)
TABLE 383 POLAND DRILLING AND FASTENING TOOLS IN POWER TOOLS MARKET, BY TYPE, 2018-2032 (USD THOUSAND)
TABLE 384 POLAND DRILLING AND FASTENING TOOLS IN POWER TOOLS MARKET, BY MATERIAL, 2018-2032 (USD THOUSAND)
TABLE 385 POLAND DRILLING AND FASTENING TOOLS IN POWER TOOLS MARKET, BY SALES CHANNEL, 2018-2032 (USD THOUSAND)
TABLE 386 POLAND ONLINE IN POWER TOOLS MARKET, BY TYPE, 2018-2032 (USD THOUSAND)
TABLE 387 POLAND OFFLINE IN POWER TOOLS MARKET, BY TYPE, 2018-2032 (USD THOUSAND)
TABLE 388 POLAND SAWING IN POWER TOOLS MARKET, BY TYPE, 2018-2032 (USD THOUSAND)
TABLE 389 POLAND SAWING TOOLS IN POWER TOOLS MARKET, BY SALES CHANNEL, 2018-2032 (USD THOUSAND)
TABLE 390 POLAND ONLINE IN POWER TOOLS MARKET, BY TYPE, 2018-2032 (USD THOUSAND)
TABLE 391 POLAND OFFLINE IN POWER TOOLS MARKET, BY TYPE, 2018-2032 (USD THOUSAND)
TABLE 392 POLAND CUTING IN POWER TOOLS MARKET, BY TYPE, 2018-2032 (USD THOUSAND)
TABLE 393 POLAND CUTING IN POWER TOOLS MARKET, BY SALES CHANNEL, 2018-2032 (USD THOUSAND)
TABLE 394 POLAND ONLINE IN POWER TOOLS MARKET, BY TYPE, 2018-2032 (USD THOUSAND)
TABLE 395 POLAND OFFLINE IN POWER TOOLS MARKET, BY TYPE, 2018-2032 (USD THOUSAND)
TABLE 396 POLAND DEMOLITION TOOLS IN POWER TOOLS MARKET, BY TYPE, 2018-2032 (USD THOUSAND)
TABLE 397 POLAND DEMOLITION TOOLS IN POWER TOOLS MARKET, BY SALES CHANNEL, 2018-2032 (USD THOUSAND)
TABLE 398 POLAND ONLINE IN POWER TOOLS MARKET, BY TYPE, 2018-2032 (USD THOUSAND)
TABLE 399 POLAND OFFLINE IN POWER TOOLS MARKET, BY TYPE, 2018-2032 (USD THOUSAND)
TABLE 400 POLAND NAILERS IN POWER TOOLS MARKET, BY SALES CHANNEL, 2018-2032 (USD THOUSAND)
TABLE 401 POLAND ONLINE IN POWER TOOLS MARKET, BY TYPE, 2018-2032 (USD THOUSAND)
TABLE 402 POLAND OFFLINE IN POWER TOOLS MARKET, BY TYPE, 2018-2032 (USD THOUSAND)
TABLE 403 POLAND ROUTING TOOLS IN POWER TOOLS MARKET, BY TYPE, 2018-2032 (USD THOUSAND)
TABLE 404 POLAND ROUTING TOOLS IN POWER TOOLS MARKET, BY SALES CHANNEL, 2018-2032 (USD THOUSAND)
TABLE 405 POLAND ONLINE IN POWER TOOLS MARKET, BY TYPE, 2018-2032 (USD THOUSAND)
TABLE 406 POLAND OFFLINE IN POWER TOOLS MARKET, BY TYPE, 2018-2032 (USD THOUSAND)
TABLE 407 POLAND PORTABLE NIBBLERS IN POWER TOOLS MARKET, BY SALES CHANNEL, 2018-2032 (USD THOUSAND)
TABLE 408 POLAND ONLINE IN POWER TOOLS MARKET, BY TYPE, 2018-2032 (USD THOUSAND)
TABLE 409 POLAND OFFLINE IN POWER TOOLS MARKET, BY TYPE, 2018-2032 (USD THOUSAND)
TABLE 410 POLAND AIR-POWERED TOOLS IN POWER TOOLS MARKET, BY TYPE, 2018-2032 (USD THOUSAND)
TABLE 411 POLAND AIR-POWERED TOOLS IN POWER TOOLS MARKET, BY SALES CHANNEL, 2018-2032 (USD THOUSAND)
TABLE 412 POLAND ONLINE IN POWER TOOLS MARKET, BY TYPE, 2018-2032 (USD THOUSAND)
TABLE 413 POLAND OFFLINE IN POWER TOOLS MARKET, BY TYPE, 2018-2032 (USD THOUSAND)
TABLE 414 POLAND MATERIAL REMOVAL TOOLS IN POWER TOOLS MARKET, BY TYPE, 2018-2032 (USD THOUSAND)
TABLE 415 POLAND GRINDERS IN POWER TOOLS MARKET, BY TYPE, 2018-2032 (USD THOUSAND)
TABLE 416 POLAND SANDERS IN POWER TOOLS MARKET, BY TYPE, 2018-2032 (USD THOUSAND)
TABLE 417 POLAND MATERIAL REMOVAL TOOLS IN POWER TOOLS MARKET, BY SALES CHANNEL, 2018-2032 (USD THOUSAND)
TABLE 418 POLAND ONLINE IN POWER TOOLS MARKET, BY TYPE, 2018-2032 (USD THOUSAND)
TABLE 419 POLAND OFFLINE IN POWER TOOLS MARKET, BY TYPE, 2018-2032 (USD THOUSAND)
TABLE 420 POLAND SCREWING (SCREWDRIVER BITS) IN POWER TOOLS MARKET, BY SALES CHANNEL, 2018-2032 (USD THOUSAND)
TABLE 421 POLAND ONLINE IN POWER TOOLS MARKET, BY TYPE, 2018-2032 (USD THOUSAND)
TABLE 422 POLAND OFFLINE IN POWER TOOLS MARKET, BY TYPE, 2018-2032 (USD THOUSAND)
TABLE 423 POLAND CHISELS IN POWER TOOLS MARKET, BY SALES CHANNEL, 2018-2032 (USD THOUSAND)
TABLE 424 POLAND ONLINE IN POWER TOOLS MARKET, BY TYPE, 2018-2032 (USD THOUSAND)
TABLE 425 POLAND OFFLINE IN POWER TOOLS MARKET, BY TYPE, 2018-2032 (USD THOUSAND)
TABLE 426 POLAND ACCESSORIES IN POWER TOOLS MARKET, BY SALES CHANNEL, 2018-2032 (USD THOUSAND)
TABLE 427 POLAND ONLINE IN POWER TOOLS MARKET, BY TYPE, 2018-2032 (USD THOUSAND)
TABLE 428 POLAND OFFLINE IN POWER TOOLS MARKET, BY TYPE, 2018-2032 (USD THOUSAND)
TABLE 429 POLAND OTHERS IN POWER TOOLS MARKET, BY SALES CHANNEL, 2018-2032 (USD THOUSAND)
TABLE 430 POLAND ONLINE IN POWER TOOLS MARKET, BY TYPE, 2018-2032 (USD THOUSAND)
TABLE 431 POLAND OFFLINE IN POWER TOOLS MARKET, BY TYPE, 2018-2032 (USD THOUSAND)
TABLE 432 POLAND POWER TOOLS MARKET, BY MODE OF OPERATION, 2018-2032 (USD THOUSAND)
TABLE 433 POLAND ELECTRIC IN POWER TOOLS MARKET, BY TYPE, 2018-2032 (USD THOUSAND)
TABLE 434 POLAND POWER TOOLS MARKET, BY APPLICATION, 2018-2032 (USD THOUSAND)
TABLE 435 POLAND POWER TOOLS MARKET, BY END USER, 2018-2032 (USD THOUSAND)
TABLE 436 POLAND INDUSTRIAL/PROFESSIONAL IN POWER TOOLS MARKET, BY INDUSTRIAL/PROFESSIONAL TYPE, 2018-2032 (USD THOUSAND)
TABLE 437 POLAND INDUSTRIAL/PROFESSIONAL IN POWER TOOLS MARKET, BY TYPE, 2018-2032 (USD THOUSAND)
TABLE 438 POLAND INDUSTRIAL/PROFESSIONAL IN POWER TOOLS MARKET, BY MODE OF OPERATION, 2018-2032 (USD THOUSAND)
TABLE 439 POLAND RESIDENTIAL IN POWER TOOLS MARKET, BY RESIDENTIAL TYPE, 2018-2032 (USD THOUSAND)
TABLE 440 POLAND RESIDENTIAL IN POWER TOOLS MARKET, BY TYPE, 2018-2032 (USD THOUSAND)
TABLE 441 POLAND RESIDENTIAL IN POWER TOOLS MARKET, BY MODE OF OPERATION, 2018-2032 (USD THOUSAND)
TABLE 442 POLAND POWER TOOLS MARKET, BY SALES CHANNEL, 2018-2032 (USD THOUSAND)
TABLE 443 POLAND ONLINE IN POWER TOOLS MARKET, BY TYPE, 2018-2032 (USD THOUSAND)
TABLE 444 POLAND OFFLINE IN POWER TOOLS MARKET, BY TYPE, 2018-2032 (USD THOUSAND)
TABLE 445 TURKEY POWER TOOLS MARKET, BY TYPE, 2018-2032 (USD THOUSAND)
TABLE 446 TURKEY DRILLING AND FASTENING TOOLS IN POWER TOOLS MARKET, BY TYPE, 2018-2032 (USD THOUSAND)
TABLE 447 TURKEY DRILLING AND FASTENING TOOLS IN POWER TOOLS MARKET, BY MATERIAL, 2018-2032 (USD THOUSAND)
TABLE 448 TURKEY DRILLING AND FASTENING TOOLS IN POWER TOOLS MARKET, BY SALES CHANNEL, 2018-2032 (USD THOUSAND)
TABLE 449 TURKEY ONLINE IN POWER TOOLS MARKET, BY TYPE, 2018-2032 (USD THOUSAND)
TABLE 450 TURKEY OFFLINE IN POWER TOOLS MARKET, BY TYPE, 2018-2032 (USD THOUSAND)
TABLE 451 TURKEY SAWING IN POWER TOOLS MARKET, BY TYPE, 2018-2032 (USD THOUSAND)
TABLE 452 TURKEY SAWING TOOLS IN POWER TOOLS MARKET, BY SALES CHANNEL, 2018-2032 (USD THOUSAND)
TABLE 453 TURKEY ONLINE IN POWER TOOLS MARKET, BY TYPE, 2018-2032 (USD THOUSAND)
TABLE 454 TURKEY OFFLINE IN POWER TOOLS MARKET, BY TYPE, 2018-2032 (USD THOUSAND)
TABLE 455 TURKEY CUTING IN POWER TOOLS MARKET, BY TYPE, 2018-2032 (USD THOUSAND)
TABLE 456 TURKEY CUTING IN POWER TOOLS MARKET, BY SALES CHANNEL, 2018-2032 (USD THOUSAND)
TABLE 457 TURKEY ONLINE IN POWER TOOLS MARKET, BY TYPE, 2018-2032 (USD THOUSAND)
TABLE 458 TURKEY OFFLINE IN POWER TOOLS MARKET, BY TYPE, 2018-2032 (USD THOUSAND)
TABLE 459 TURKEY DEMOLITION TOOLS IN POWER TOOLS MARKET, BY TYPE, 2018-2032 (USD THOUSAND)
TABLE 460 TURKEY DEMOLITION TOOLS IN POWER TOOLS MARKET, BY SALES CHANNEL, 2018-2032 (USD THOUSAND)
TABLE 461 TURKEY ONLINE IN POWER TOOLS MARKET, BY TYPE, 2018-2032 (USD THOUSAND)
TABLE 462 TURKEY OFFLINE IN POWER TOOLS MARKET, BY TYPE, 2018-2032 (USD THOUSAND)
TABLE 463 TURKEY NAILERS IN POWER TOOLS MARKET, BY SALES CHANNEL, 2018-2032 (USD THOUSAND)
TABLE 464 TURKEY ONLINE IN POWER TOOLS MARKET, BY TYPE, 2018-2032 (USD THOUSAND)
TABLE 465 TURKEY OFFLINE IN POWER TOOLS MARKET, BY TYPE, 2018-2032 (USD THOUSAND)
TABLE 466 TURKEY ROUTING TOOLS IN POWER TOOLS MARKET, BY TYPE, 2018-2032 (USD THOUSAND)
TABLE 467 TURKEY ROUTING TOOLS IN POWER TOOLS MARKET, BY SALES CHANNEL, 2018-2032 (USD THOUSAND)
TABLE 468 TURKEY ONLINE IN POWER TOOLS MARKET, BY TYPE, 2018-2032 (USD THOUSAND)
TABLE 469 TURKEY OFFLINE IN POWER TOOLS MARKET, BY TYPE, 2018-2032 (USD THOUSAND)
TABLE 470 TURKEY PORTABLE NIBBLERS IN POWER TOOLS MARKET, BY SALES CHANNEL, 2018-2032 (USD THOUSAND)
TABLE 471 TURKEY ONLINE IN POWER TOOLS MARKET, BY TYPE, 2018-2032 (USD THOUSAND)
TABLE 472 TURKEY OFFLINE IN POWER TOOLS MARKET, BY TYPE, 2018-2032 (USD THOUSAND)
TABLE 473 TURKEY AIR-POWERED TOOLS IN POWER TOOLS MARKET, BY TYPE, 2018-2032 (USD THOUSAND)
TABLE 474 TURKEY AIR-POWERED TOOLS IN POWER TOOLS MARKET, BY SALES CHANNEL, 2018-2032 (USD THOUSAND)
TABLE 475 TURKEY ONLINE IN POWER TOOLS MARKET, BY TYPE, 2018-2032 (USD THOUSAND)
TABLE 476 TURKEY OFFLINE IN POWER TOOLS MARKET, BY TYPE, 2018-2032 (USD THOUSAND)
TABLE 477 TURKEY MATERIAL REMOVAL TOOLS IN POWER TOOLS MARKET, BY TYPE, 2018-2032 (USD THOUSAND)
TABLE 478 TURKEY GRINDERS IN POWER TOOLS MARKET, BY TYPE, 2018-2032 (USD THOUSAND)
TABLE 479 TURKEY SANDERS IN POWER TOOLS MARKET, BY TYPE, 2018-2032 (USD THOUSAND)
TABLE 480 TURKEY MATERIAL REMOVAL TOOLS IN POWER TOOLS MARKET, BY SALES CHANNEL, 2018-2032 (USD THOUSAND)
TABLE 481 TURKEY ONLINE IN POWER TOOLS MARKET, BY TYPE, 2018-2032 (USD THOUSAND)
TABLE 482 TURKEY OFFLINE IN POWER TOOLS MARKET, BY TYPE, 2018-2032 (USD THOUSAND)
TABLE 483 TURKEY SCREWING (SCREWDRIVER BITS) IN POWER TOOLS MARKET, BY SALES CHANNEL, 2018-2032 (USD THOUSAND)
TABLE 484 TURKEY ONLINE IN POWER TOOLS MARKET, BY TYPE, 2018-2032 (USD THOUSAND)
TABLE 485 TURKEY OFFLINE IN POWER TOOLS MARKET, BY TYPE, 2018-2032 (USD THOUSAND)
TABLE 486 TURKEY CHISELS IN POWER TOOLS MARKET, BY SALES CHANNEL, 2018-2032 (USD THOUSAND)
TABLE 487 TURKEY ONLINE IN POWER TOOLS MARKET, BY TYPE, 2018-2032 (USD THOUSAND)
TABLE 488 TURKEY OFFLINE IN POWER TOOLS MARKET, BY TYPE, 2018-2032 (USD THOUSAND)
TABLE 489 TURKEY ACCESSORIES IN POWER TOOLS MARKET, BY SALES CHANNEL, 2018-2032 (USD THOUSAND)
TABLE 490 TURKEY ONLINE IN POWER TOOLS MARKET, BY TYPE, 2018-2032 (USD THOUSAND)
TABLE 491 TURKEY OFFLINE IN POWER TOOLS MARKET, BY TYPE, 2018-2032 (USD THOUSAND)
TABLE 492 TURKEY OTHERS IN POWER TOOLS MARKET, BY SALES CHANNEL, 2018-2032 (USD THOUSAND)
TABLE 493 TURKEY ONLINE IN POWER TOOLS MARKET, BY TYPE, 2018-2032 (USD THOUSAND)
TABLE 494 TURKEY OFFLINE IN POWER TOOLS MARKET, BY TYPE, 2018-2032 (USD THOUSAND)
TABLE 495 TURKEY POWER TOOLS MARKET, BY MODE OF OPERATION, 2018-2032 (USD THOUSAND)
TABLE 496 TURKEY ELECTRIC IN POWER TOOLS MARKET, BY TYPE, 2018-2032 (USD THOUSAND)
TABLE 497 TURKEY POWER TOOLS MARKET, BY APPLICATION, 2018-2032 (USD THOUSAND)
TABLE 498 TURKEY POWER TOOLS MARKET, BY END USER, 2018-2032 (USD THOUSAND)
TABLE 499 TURKEY INDUSTRIAL/PROFESSIONAL IN POWER TOOLS MARKET, BY INDUSTRIAL/PROFESSIONAL TYPE, 2018-2032 (USD THOUSAND)
TABLE 500 TURKEY INDUSTRIAL/PROFESSIONAL IN POWER TOOLS MARKET, BY TYPE, 2018-2032 (USD THOUSAND)
TABLE 501 TURKEY INDUSTRIAL/PROFESSIONAL IN POWER TOOLS MARKET, BY MODE OF OPERATION, 2018-2032 (USD THOUSAND)
TABLE 502 TURKEY RESIDENTIAL IN POWER TOOLS MARKET, BY RESIDENTIAL TYPE, 2018-2032 (USD THOUSAND)
TABLE 503 TURKEY RESIDENTIAL IN POWER TOOLS MARKET, BY TYPE, 2018-2032 (USD THOUSAND)
TABLE 504 TURKEY RESIDENTIAL IN POWER TOOLS MARKET, BY MODE OF OPERATION, 2018-2032 (USD THOUSAND)
TABLE 505 TURKEY POWER TOOLS MARKET, BY SALES CHANNEL, 2018-2032 (USD THOUSAND)
TABLE 506 TURKEY ONLINE IN POWER TOOLS MARKET, BY TYPE, 2018-2032 (USD THOUSAND)
TABLE 507 TURKEY OFFLINE IN POWER TOOLS MARKET, BY TYPE, 2018-2032 (USD THOUSAND)
TABLE 508 RUSSIA POWER TOOLS MARKET, BY TYPE, 2018-2032 (USD THOUSAND)
TABLE 509 RUSSIA DRILLING AND FASTENING TOOLS IN POWER TOOLS MARKET, BY TYPE, 2018-2032 (USD THOUSAND)
TABLE 510 RUSSIA DRILLING AND FASTENING TOOLS IN POWER TOOLS MARKET, BY MATERIAL, 2018-2032 (USD THOUSAND)
TABLE 511 RUSSIA DRILLING AND FASTENING TOOLS IN POWER TOOLS MARKET, BY SALES CHANNEL, 2018-2032 (USD THOUSAND)
TABLE 512 RUSSIA ONLINE IN POWER TOOLS MARKET, BY TYPE, 2018-2032 (USD THOUSAND)
TABLE 513 RUSSIA OFFLINE IN POWER TOOLS MARKET, BY TYPE, 2018-2032 (USD THOUSAND)
TABLE 514 RUSSIA SAWING IN POWER TOOLS MARKET, BY TYPE, 2018-2032 (USD THOUSAND)
TABLE 515 RUSSIA SAWING TOOLS IN POWER TOOLS MARKET, BY SALES CHANNEL, 2018-2032 (USD THOUSAND)
TABLE 516 RUSSIA ONLINE IN POWER TOOLS MARKET, BY TYPE, 2018-2032 (USD THOUSAND)
TABLE 517 RUSSIA OFFLINE IN POWER TOOLS MARKET, BY TYPE, 2018-2032 (USD THOUSAND)
TABLE 518 RUSSIA CUTING IN POWER TOOLS MARKET, BY TYPE, 2018-2032 (USD THOUSAND)
TABLE 519 RUSSIA CUTING IN POWER TOOLS MARKET, BY SALES CHANNEL, 2018-2032 (USD THOUSAND)
TABLE 520 RUSSIA ONLINE IN POWER TOOLS MARKET, BY TYPE, 2018-2032 (USD THOUSAND)
TABLE 521 RUSSIA OFFLINE IN POWER TOOLS MARKET, BY TYPE, 2018-2032 (USD THOUSAND)
TABLE 522 RUSSIA DEMOLITION TOOLS IN POWER TOOLS MARKET, BY TYPE, 2018-2032 (USD THOUSAND)
TABLE 523 RUSSIA DEMOLITION TOOLS IN POWER TOOLS MARKET, BY SALES CHANNEL, 2018-2032 (USD THOUSAND)
TABLE 524 RUSSIA ONLINE IN POWER TOOLS MARKET, BY TYPE, 2018-2032 (USD THOUSAND)
TABLE 525 RUSSIA OFFLINE IN POWER TOOLS MARKET, BY TYPE, 2018-2032 (USD THOUSAND)
TABLE 526 RUSSIA NAILERS IN POWER TOOLS MARKET, BY SALES CHANNEL, 2018-2032 (USD THOUSAND)
TABLE 527 RUSSIA ONLINE IN POWER TOOLS MARKET, BY TYPE, 2018-2032 (USD THOUSAND)
TABLE 528 RUSSIA OFFLINE IN POWER TOOLS MARKET, BY TYPE, 2018-2032 (USD THOUSAND)
TABLE 529 RUSSIA ROUTING TOOLS IN POWER TOOLS MARKET, BY TYPE, 2018-2032 (USD THOUSAND)
TABLE 530 RUSSIA ROUTING TOOLS IN POWER TOOLS MARKET, BY SALES CHANNEL, 2018-2032 (USD THOUSAND)
TABLE 531 RUSSIA ONLINE IN POWER TOOLS MARKET, BY TYPE, 2018-2032 (USD THOUSAND)
TABLE 532 RUSSIA OFFLINE IN POWER TOOLS MARKET, BY TYPE, 2018-2032 (USD THOUSAND)
TABLE 533 RUSSIA PORTABLE NIBBLERS IN POWER TOOLS MARKET, BY SALES CHANNEL, 2018-2032 (USD THOUSAND)
TABLE 534 RUSSIA ONLINE IN POWER TOOLS MARKET, BY TYPE, 2018-2032 (USD THOUSAND)
TABLE 535 RUSSIA OFFLINE IN POWER TOOLS MARKET, BY TYPE, 2018-2032 (USD THOUSAND)
TABLE 536 RUSSIA AIR-POWERED TOOLS IN POWER TOOLS MARKET, BY TYPE, 2018-2032 (USD THOUSAND)
TABLE 537 RUSSIA AIR-POWERED TOOLS IN POWER TOOLS MARKET, BY SALES CHANNEL, 2018-2032 (USD THOUSAND)
TABLE 538 RUSSIA ONLINE IN POWER TOOLS MARKET, BY TYPE, 2018-2032 (USD THOUSAND)
TABLE 539 RUSSIA OFFLINE IN POWER TOOLS MARKET, BY TYPE, 2018-2032 (USD THOUSAND)
TABLE 540 RUSSIA MATERIAL REMOVAL TOOLS IN POWER TOOLS MARKET, BY TYPE, 2018-2032 (USD THOUSAND)
TABLE 541 RUSSIA GRINDERS IN POWER TOOLS MARKET, BY TYPE, 2018-2032 (USD THOUSAND)
TABLE 542 RUSSIA SANDERS IN POWER TOOLS MARKET, BY TYPE, 2018-2032 (USD THOUSAND)
TABLE 543 RUSSIA MATERIAL REMOVAL TOOLS IN POWER TOOLS MARKET, BY SALES CHANNEL, 2018-2032 (USD THOUSAND)
TABLE 544 RUSSIA ONLINE IN POWER TOOLS MARKET, BY TYPE, 2018-2032 (USD THOUSAND)
TABLE 545 RUSSIA OFFLINE IN POWER TOOLS MARKET, BY TYPE, 2018-2032 (USD THOUSAND)
TABLE 546 RUSSIA SCREWING (SCREWDRIVER BITS) IN POWER TOOLS MARKET, BY SALES CHANNEL, 2018-2032 (USD THOUSAND)
TABLE 547 RUSSIA ONLINE IN POWER TOOLS MARKET, BY TYPE, 2018-2032 (USD THOUSAND)
TABLE 548 RUSSIA OFFLINE IN POWER TOOLS MARKET, BY TYPE, 2018-2032 (USD THOUSAND)
TABLE 549 RUSSIA CHISELS IN POWER TOOLS MARKET, BY SALES CHANNEL, 2018-2032 (USD THOUSAND)
TABLE 550 RUSSIA ONLINE IN POWER TOOLS MARKET, BY TYPE, 2018-2032 (USD THOUSAND)
TABLE 551 RUSSIA OFFLINE IN POWER TOOLS MARKET, BY TYPE, 2018-2032 (USD THOUSAND)
TABLE 552 RUSSIA ACCESSORIES IN POWER TOOLS MARKET, BY SALES CHANNEL, 2018-2032 (USD THOUSAND)
TABLE 553 RUSSIA ONLINE IN POWER TOOLS MARKET, BY TYPE, 2018-2032 (USD THOUSAND)
TABLE 554 RUSSIA OFFLINE IN POWER TOOLS MARKET, BY TYPE, 2018-2032 (USD THOUSAND)
TABLE 555 RUSSIA OTHERS IN POWER TOOLS MARKET, BY SALES CHANNEL, 2018-2032 (USD THOUSAND)
TABLE 556 RUSSIA ONLINE IN POWER TOOLS MARKET, BY TYPE, 2018-2032 (USD THOUSAND)
TABLE 557 RUSSIA OFFLINE IN POWER TOOLS MARKET, BY TYPE, 2018-2032 (USD THOUSAND)
TABLE 558 RUSSIA POWER TOOLS MARKET, BY MODE OF OPERATION, 2018-2032 (USD THOUSAND)
TABLE 559 RUSSIA ELECTRIC IN POWER TOOLS MARKET, BY TYPE, 2018-2032 (USD THOUSAND)
TABLE 560 RUSSIA POWER TOOLS MARKET, BY APPLICATION, 2018-2032 (USD THOUSAND)
TABLE 561 RUSSIA POWER TOOLS MARKET, BY END USER, 2018-2032 (USD THOUSAND)
TABLE 562 RUSSIA INDUSTRIAL/PROFESSIONAL IN POWER TOOLS MARKET, BY INDUSTRIAL/PROFESSIONAL TYPE, 2018-2032 (USD THOUSAND)
TABLE 563 RUSSIA INDUSTRIAL/PROFESSIONAL IN POWER TOOLS MARKET, BY TYPE, 2018-2032 (USD THOUSAND)
TABLE 564 RUSSIA INDUSTRIAL/PROFESSIONAL IN POWER TOOLS MARKET, BY MODE OF OPERATION, 2018-2032 (USD THOUSAND)
TABLE 565 RUSSIA RESIDENTIAL IN POWER TOOLS MARKET, BY RESIDENTIAL TYPE, 2018-2032 (USD THOUSAND)
TABLE 566 RUSSIA RESIDENTIAL IN POWER TOOLS MARKET, BY TYPE, 2018-2032 (USD THOUSAND)
TABLE 567 RUSSIA RESIDENTIAL IN POWER TOOLS MARKET, BY MODE OF OPERATION, 2018-2032 (USD THOUSAND)
TABLE 568 RUSSIA POWER TOOLS MARKET, BY SALES CHANNEL, 2018-2032 (USD THOUSAND)
TABLE 569 RUSSIA ONLINE IN POWER TOOLS MARKET, BY TYPE, 2018-2032 (USD THOUSAND)
TABLE 570 RUSSIA OFFLINE IN POWER TOOLS MARKET, BY TYPE, 2018-2032 (USD THOUSAND)
TABLE 571 NETHERLANDS POWER TOOLS MARKET, BY TYPE, 2018-2032 (USD THOUSAND)
TABLE 572 NETHERLANDS DRILLING AND FASTENING TOOLS IN POWER TOOLS MARKET, BY TYPE, 2018-2032 (USD THOUSAND)
TABLE 573 NETHERLANDS DRILLING AND FASTENING TOOLS IN POWER TOOLS MARKET, BY MATERIAL, 2018-2032 (USD THOUSAND)
TABLE 574 NETHERLANDS DRILLING AND FASTENING TOOLS IN POWER TOOLS MARKET, BY SALES CHANNEL, 2018-2032 (USD THOUSAND)
TABLE 575 NETHERLANDS ONLINE IN POWER TOOLS MARKET, BY TYPE, 2018-2032 (USD THOUSAND)
TABLE 576 NETHERLANDS OFFLINE IN POWER TOOLS MARKET, BY TYPE, 2018-2032 (USD THOUSAND)
TABLE 577 NETHERLANDS SAWING IN POWER TOOLS MARKET, BY TYPE, 2018-2032 (USD THOUSAND)
TABLE 578 NETHERLANDS SAWING TOOLS IN POWER TOOLS MARKET, BY SALES CHANNEL, 2018-2032 (USD THOUSAND)
TABLE 579 NETHERLANDS ONLINE IN POWER TOOLS MARKET, BY TYPE, 2018-2032 (USD THOUSAND)
TABLE 580 NETHERLANDS OFFLINE IN POWER TOOLS MARKET, BY TYPE, 2018-2032 (USD THOUSAND)
TABLE 581 NETHERLANDS CUTING IN POWER TOOLS MARKET, BY TYPE, 2018-2032 (USD THOUSAND)
TABLE 582 NETHERLANDS CUTING IN POWER TOOLS MARKET, BY SALES CHANNEL, 2018-2032 (USD THOUSAND)
TABLE 583 NETHERLANDS ONLINE IN POWER TOOLS MARKET, BY TYPE, 2018-2032 (USD THOUSAND)
TABLE 584 NETHERLANDS OFFLINE IN POWER TOOLS MARKET, BY TYPE, 2018-2032 (USD THOUSAND)
TABLE 585 NETHERLANDS DEMOLITION TOOLS IN POWER TOOLS MARKET, BY TYPE, 2018-2032 (USD THOUSAND)
TABLE 586 NETHERLANDS DEMOLITION TOOLS IN POWER TOOLS MARKET, BY SALES CHANNEL, 2018-2032 (USD THOUSAND)
TABLE 587 NETHERLANDS ONLINE IN POWER TOOLS MARKET, BY TYPE, 2018-2032 (USD THOUSAND)
TABLE 588 NETHERLANDS OFFLINE IN POWER TOOLS MARKET, BY TYPE, 2018-2032 (USD THOUSAND)
TABLE 589 NETHERLANDS NAILERS IN POWER TOOLS MARKET, BY SALES CHANNEL, 2018-2032 (USD THOUSAND)
TABLE 590 NETHERLANDS ONLINE IN POWER TOOLS MARKET, BY TYPE, 2018-2032 (USD THOUSAND)
TABLE 591 NETHERLANDS OFFLINE IN POWER TOOLS MARKET, BY TYPE, 2018-2032 (USD THOUSAND)
TABLE 592 NETHERLANDS ROUTING TOOLS IN POWER TOOLS MARKET, BY TYPE, 2018-2032 (USD THOUSAND)
TABLE 593 NETHERLANDS ROUTING TOOLS IN POWER TOOLS MARKET, BY SALES CHANNEL, 2018-2032 (USD THOUSAND)
TABLE 594 NETHERLANDS ONLINE IN POWER TOOLS MARKET, BY TYPE, 2018-2032 (USD THOUSAND)
TABLE 595 NETHERLANDS OFFLINE IN POWER TOOLS MARKET, BY TYPE, 2018-2032 (USD THOUSAND)
TABLE 596 NETHERLANDS PORTABLE NIBBLERS IN POWER TOOLS MARKET, BY SALES CHANNEL, 2018-2032 (USD THOUSAND)
TABLE 597 NETHERLANDS ONLINE IN POWER TOOLS MARKET, BY TYPE, 2018-2032 (USD THOUSAND)
TABLE 598 NETHERLANDS OFFLINE IN POWER TOOLS MARKET, BY TYPE, 2018-2032 (USD THOUSAND)
TABLE 599 NETHERLANDS AIR-POWERED TOOLS IN POWER TOOLS MARKET, BY TYPE, 2018-2032 (USD THOUSAND)
TABLE 600 NETHERLANDS AIR-POWERED TOOLS IN POWER TOOLS MARKET, BY SALES CHANNEL, 2018-2032 (USD THOUSAND)
TABLE 601 NETHERLANDS ONLINE IN POWER TOOLS MARKET, BY TYPE, 2018-2032 (USD THOUSAND)
TABLE 602 NETHERLANDS OFFLINE IN POWER TOOLS MARKET, BY TYPE, 2018-2032 (USD THOUSAND)
TABLE 603 NETHERLANDS MATERIAL REMOVAL TOOLS IN POWER TOOLS MARKET, BY TYPE, 2018-2032 (USD THOUSAND)
TABLE 604 NETHERLANDS GRINDERS IN POWER TOOLS MARKET, BY TYPE, 2018-2032 (USD THOUSAND)
TABLE 605 NETHERLANDS SANDERS IN POWER TOOLS MARKET, BY TYPE, 2018-2032 (USD THOUSAND)
TABLE 606 NETHERLANDS MATERIAL REMOVAL TOOLS IN POWER TOOLS MARKET, BY SALES CHANNEL, 2018-2032 (USD THOUSAND)
TABLE 607 ETHERLANDS ONLINE IN POWER TOOLS MARKET, BY TYPE, 2018-2032 (USD THOUSAND)
TABLE 608 NETHERLANDS OFFLINE IN POWER TOOLS MARKET, BY TYPE, 2018-2032 (USD THOUSAND)
TABLE 609 NETHERLANDS SCREWING (SCREWDRIVER BITS) IN POWER TOOLS MARKET, BY SALES CHANNEL, 2018-2032 (USD THOUSAND)
TABLE 610 NETHERLANDS ONLINE IN POWER TOOLS MARKET, BY TYPE, 2018-2032 (USD THOUSAND)
TABLE 611 NETHERLANDS OFFLINE IN POWER TOOLS MARKET, BY TYPE, 2018-2032 (USD THOUSAND)
TABLE 612 NETHERLANDS CHISELS IN POWER TOOLS MARKET, BY SALES CHANNEL, 2018-2032 (USD THOUSAND)
TABLE 613 NETHERLANDS ONLINE IN POWER TOOLS MARKET, BY TYPE, 2018-2032 (USD THOUSAND)
TABLE 614 NETHERLANDS OFFLINE IN POWER TOOLS MARKET, BY TYPE, 2018-2032 (USD THOUSAND)
TABLE 615 NETHERLANDS ACCESSORIES IN POWER TOOLS MARKET, BY SALES CHANNEL, 2018-2032 (USD THOUSAND)
TABLE 616 NETHERLANDS ONLINE IN POWER TOOLS MARKET, BY TYPE, 2018-2032 (USD THOUSAND)
TABLE 617 NETHERLANDS OFFLINE IN POWER TOOLS MARKET, BY TYPE, 2018-2032 (USD THOUSAND)
TABLE 618 NETHERLANDS OTHERS IN POWER TOOLS MARKET, BY SALES CHANNEL, 2018-2032 (USD THOUSAND)
TABLE 619 NETHERLANDS ONLINE IN POWER TOOLS MARKET, BY TYPE, 2018-2032 (USD THOUSAND)
TABLE 620 NETHERLANDS OFFLINE IN POWER TOOLS MARKET, BY TYPE, 2018-2032 (USD THOUSAND)
TABLE 621 NETHERLANDS POWER TOOLS MARKET, BY MODE OF OPERATION, 2018-2032 (USD THOUSAND)
TABLE 622 NETHERLANDS ELECTRIC IN POWER TOOLS MARKET, BY TYPE, 2018-2032 (USD THOUSAND)
TABLE 623 NETHERLANDS POWER TOOLS MARKET, BY APPLICATION, 2018-2032 (USD THOUSAND)
TABLE 624 NETHERLANDS POWER TOOLS MARKET, BY END USER, 2018-2032 (USD THOUSAND)
TABLE 625 NETHERLANDS INDUSTRIAL/PROFESSIONAL IN POWER TOOLS MARKET, BY INDUSTRIAL/PROFESSIONAL TYPE, 2018-2032 (USD THOUSAND)
TABLE 626 NETHERLANDS INDUSTRIAL/PROFESSIONAL IN POWER TOOLS MARKET, BY TYPE, 2018-2032 (USD THOUSAND)
TABLE 627 NETHERLANDS INDUSTRIAL/PROFESSIONAL IN POWER TOOLS MARKET, BY MODE OF OPERATION, 2018-2032 (USD THOUSAND)
TABLE 628 NETHERLANDS RESIDENTIAL IN POWER TOOLS MARKET, BY RESIDENTIAL TYPE, 2018-2032 (USD THOUSAND)
TABLE 629 NETHERLANDS RESIDENTIAL IN POWER TOOLS MARKET, BY TYPE, 2018-2032 (USD THOUSAND)
TABLE 630 NETHERLANDS RESIDENTIAL IN POWER TOOLS MARKET, BY MODE OF OPERATION, 2018-2032 (USD THOUSAND)
TABLE 631 NETHERLANDS POWER TOOLS MARKET, BY SALES CHANNEL, 2018-2032 (USD THOUSAND)
TABLE 632 NETHERLANDS ONLINE IN POWER TOOLS MARKET, BY TYPE, 2018-2032 (USD THOUSAND)
TABLE 633 NETHERLANDS OFFLINE IN POWER TOOLS MARKET, BY TYPE, 2018-2032 (USD THOUSAND)
TABLE 634 SWEDEN POWER TOOLS MARKET, BY TYPE, 2018-2032 (USD THOUSAND)
TABLE 635 SWEDEN DRILLING AND FASTENING TOOLS IN POWER TOOLS MARKET, BY TYPE, 2018-2032 (USD THOUSAND)
TABLE 636 SWEDEN DRILLING AND FASTENING TOOLS IN POWER TOOLS MARKET, BY MATERIAL, 2018-2032 (USD THOUSAND)
TABLE 637 SWEDEN DRILLING AND FASTENING TOOLS IN POWER TOOLS MARKET, BY SALES CHANNEL, 2018-2032 (USD THOUSAND)
TABLE 638 SWEDEN ONLINE IN POWER TOOLS MARKET, BY TYPE, 2018-2032 (USD THOUSAND)
TABLE 639 SWEDEN OFFLINE IN POWER TOOLS MARKET, BY TYPE, 2018-2032 (USD THOUSAND)
TABLE 640 SWEDEN SAWING IN POWER TOOLS MARKET, BY TYPE, 2018-2032 (USD THOUSAND)
TABLE 641 SWEDEN SAWING TOOLS IN POWER TOOLS MARKET, BY SALES CHANNEL, 2018-2032 (USD THOUSAND)
TABLE 642 SWEDEN ONLINE IN POWER TOOLS MARKET, BY TYPE, 2018-2032 (USD THOUSAND)
TABLE 643 SWEDEN OFFLINE IN POWER TOOLS MARKET, BY TYPE, 2018-2032 (USD THOUSAND)
TABLE 644 SWEDEN CUTING IN POWER TOOLS MARKET, BY TYPE, 2018-2032 (USD THOUSAND)
TABLE 645 SWEDEN CUTING IN POWER TOOLS MARKET, BY SALES CHANNEL, 2018-2032 (USD THOUSAND)
TABLE 646 SWEDEN ONLINE IN POWER TOOLS MARKET, BY TYPE, 2018-2032 (USD THOUSAND)
TABLE 647 SWEDEN OFFLINE IN POWER TOOLS MARKET, BY TYPE, 2018-2032 (USD THOUSAND)
TABLE 648 SWEDEN DEMOLITION TOOLS IN POWER TOOLS MARKET, BY TYPE, 2018-2032 (USD THOUSAND)
TABLE 649 SWEDEN DEMOLITION TOOLS IN POWER TOOLS MARKET, BY SALES CHANNEL, 2018-2032 (USD THOUSAND)
TABLE 650 SWEDEN ONLINE IN POWER TOOLS MARKET, BY TYPE, 2018-2032 (USD THOUSAND)
TABLE 651 SWEDEN OFFLINE IN POWER TOOLS MARKET, BY TYPE, 2018-2032 (USD THOUSAND)
TABLE 652 SWEDEN NAILERS IN POWER TOOLS MARKET, BY SALES CHANNEL, 2018-2032 (USD THOUSAND)
TABLE 653 SWEDEN ONLINE IN POWER TOOLS MARKET, BY TYPE, 2018-2032 (USD THOUSAND)
TABLE 654 SWEDEN OFFLINE IN POWER TOOLS MARKET, BY TYPE, 2018-2032 (USD THOUSAND)
TABLE 655 SWEDEN ROUTING TOOLS IN POWER TOOLS MARKET, BY TYPE, 2018-2032 (USD THOUSAND)
TABLE 656 SWEDEN ROUTING TOOLS IN POWER TOOLS MARKET, BY SALES CHANNEL, 2018-2032 (USD THOUSAND)
TABLE 657 SWEDEN ONLINE IN POWER TOOLS MARKET, BY TYPE, 2018-2032 (USD THOUSAND)
TABLE 658 SWEDEN OFFLINE IN POWER TOOLS MARKET, BY TYPE, 2018-2032 (USD THOUSAND)
TABLE 659 SWEDEN PORTABLE NIBBLERS IN POWER TOOLS MARKET, BY SALES CHANNEL, 2018-2032 (USD THOUSAND)
TABLE 660 SWEDEN ONLINE IN POWER TOOLS MARKET, BY TYPE, 2018-2032 (USD THOUSAND)
TABLE 661 SWEDEN OFFLINE IN POWER TOOLS MARKET, BY TYPE, 2018-2032 (USD THOUSAND)
TABLE 662 SWEDEN AIR-POWERED TOOLS IN POWER TOOLS MARKET, BY TYPE, 2018-2032 (USD THOUSAND)
TABLE 663 SWEDEN AIR-POWERED TOOLS IN POWER TOOLS MARKET, BY SALES CHANNEL, 2018-2032 (USD THOUSAND)
TABLE 664 SWEDEN ONLINE IN POWER TOOLS MARKET, BY TYPE, 2018-2032 (USD THOUSAND)
TABLE 665 SWEDEN OFFLINE IN POWER TOOLS MARKET, BY TYPE, 2018-2032 (USD THOUSAND)
TABLE 666 SWEDEN MATERIAL REMOVAL TOOLS IN POWER TOOLS MARKET, BY TYPE, 2018-2032 (USD THOUSAND)
TABLE 667 SWEDEN GRINDERS IN POWER TOOLS MARKET, BY TYPE, 2018-2032 (USD THOUSAND)
TABLE 668 SWEDEN SANDERS IN POWER TOOLS MARKET, BY TYPE, 2018-2032 (USD THOUSAND)
TABLE 669 SWEDEN MATERIAL REMOVAL TOOLS IN POWER TOOLS MARKET, BY SALES CHANNEL, 2018-2032 (USD THOUSAND)
TABLE 670 SWEDEN ONLINE IN POWER TOOLS MARKET, BY TYPE, 2018-2032 (USD THOUSAND)
TABLE 671 SWEDEN OFFLINE IN POWER TOOLS MARKET, BY TYPE, 2018-2032 (USD THOUSAND)
TABLE 672 SWEDEN SCREWING (SCREWDRIVER BITS) IN POWER TOOLS MARKET, BY SALES CHANNEL, 2018-2032 (USD THOUSAND)
TABLE 673 SWEDEN ONLINE IN POWER TOOLS MARKET, BY TYPE, 2018-2032 (USD THOUSAND)
TABLE 674 SWEDEN OFFLINE IN POWER TOOLS MARKET, BY TYPE, 2018-2032 (USD THOUSAND)
TABLE 675 SWEDEN CHISELS IN POWER TOOLS MARKET, BY SALES CHANNEL, 2018-2032 (USD THOUSAND)
TABLE 676 SWEDEN ONLINE IN POWER TOOLS MARKET, BY TYPE, 2018-2032 (USD THOUSAND)
TABLE 677 SWEDEN OFFLINE IN POWER TOOLS MARKET, BY TYPE, 2018-2032 (USD THOUSAND)
TABLE 678 SWEDEN ACCESSORIES IN POWER TOOLS MARKET, BY SALES CHANNEL, 2018-2032 (USD THOUSAND)
TABLE 679 SWEDEN ONLINE IN POWER TOOLS MARKET, BY TYPE, 2018-2032 (USD THOUSAND)
TABLE 680 SWEDEN OFFLINE IN POWER TOOLS MARKET, BY TYPE, 2018-2032 (USD THOUSAND)
TABLE 681 SWEDEN OTHERS IN POWER TOOLS MARKET, BY SALES CHANNEL, 2018-2032 (USD THOUSAND)
TABLE 682 SWEDEN ONLINE IN POWER TOOLS MARKET, BY TYPE, 2018-2032 (USD THOUSAND)
TABLE 683 SWEDEN OFFLINE IN POWER TOOLS MARKET, BY TYPE, 2018-2032 (USD THOUSAND)
TABLE 684 SWEDEN POWER TOOLS MARKET, BY MODE OF OPERATION, 2018-2032 (USD THOUSAND)
TABLE 685 SWEDEN ELECTRIC IN POWER TOOLS MARKET, BY TYPE, 2018-2032 (USD THOUSAND)
TABLE 686 SWEDEN POWER TOOLS MARKET, BY APPLICATION, 2018-2032 (USD THOUSAND)
TABLE 687 SWEDEN POWER TOOLS MARKET, BY END USER, 2018-2032 (USD THOUSAND)
TABLE 688 SWEDEN INDUSTRIAL/PROFESSIONAL IN POWER TOOLS MARKET, BY INDUSTRIAL/PROFESSIONAL TYPE, 2018-2032 (USD THOUSAND)
TABLE 689 SWEDEN INDUSTRIAL/PROFESSIONAL IN POWER TOOLS MARKET, BY TYPE, 2018-2032 (USD THOUSAND)
TABLE 690 SWEDEN INDUSTRIAL/PROFESSIONAL IN POWER TOOLS MARKET, BY MODE OF OPERATION, 2018-2032 (USD THOUSAND)
TABLE 691 SWEDEN RESIDENTIAL IN POWER TOOLS MARKET, BY RESIDENTIAL TYPE, 2018-2032 (USD THOUSAND)
TABLE 692 SWEDEN RESIDENTIAL IN POWER TOOLS MARKET, BY TYPE, 2018-2032 (USD THOUSAND)
TABLE 693 SWEDEN RESIDENTIAL IN POWER TOOLS MARKET, BY MODE OF OPERATION, 2018-2032 (USD THOUSAND)
TABLE 694 SWEDEN POWER TOOLS MARKET, BY SALES CHANNEL, 2018-2032 (USD THOUSAND)
TABLE 695 SWEDEN ONLINE IN POWER TOOLS MARKET, BY TYPE, 2018-2032 (USD THOUSAND)
TABLE 696 SWEDEN OFFLINE IN POWER TOOLS MARKET, BY TYPE, 2018-2032 (USD THOUSAND)
TABLE 697 BELGIUM POWER TOOLS MARKET, BY TYPE, 2018-2032 (USD THOUSAND)
TABLE 698 BELGIUM DRILLING AND FASTENING TOOLS IN POWER TOOLS MARKET, BY TYPE, 2018-2032 (USD THOUSAND)
TABLE 699 BELGIUM DRILLING AND FASTENING TOOLS IN POWER TOOLS MARKET, BY MATERIAL, 2018-2032 (USD THOUSAND)
TABLE 700 BELGIUM DRILLING AND FASTENING TOOLS IN POWER TOOLS MARKET, BY SALES CHANNEL, 2018-2032 (USD THOUSAND)
TABLE 701 BELGIUM ONLINE IN POWER TOOLS MARKET, BY TYPE, 2018-2032 (USD THOUSAND)
TABLE 702 BELGIUM OFFLINE IN POWER TOOLS MARKET, BY TYPE, 2018-2032 (USD THOUSAND)
TABLE 703 BELGIUM SAWING IN POWER TOOLS MARKET, BY TYPE, 2018-2032 (USD THOUSAND)
TABLE 704 BELGIUM SAWING TOOLS IN POWER TOOLS MARKET, BY SALES CHANNEL, 2018-2032 (USD THOUSAND)
TABLE 705 BELGIUM ONLINE IN POWER TOOLS MARKET, BY TYPE, 2018-2032 (USD THOUSAND)
TABLE 706 BELGIUM OFFLINE IN POWER TOOLS MARKET, BY TYPE, 2018-2032 (USD THOUSAND)
TABLE 707 BELGIUM CUTING IN POWER TOOLS MARKET, BY TYPE, 2018-2032 (USD THOUSAND)
TABLE 708 BELGIUM CUTING IN POWER TOOLS MARKET, BY SALES CHANNEL, 2018-2032 (USD THOUSAND)
TABLE 709 BELGIUM ONLINE IN POWER TOOLS MARKET, BY TYPE, 2018-2032 (USD THOUSAND)
TABLE 710 BELGIUM OFFLINE IN POWER TOOLS MARKET, BY TYPE, 2018-2032 (USD THOUSAND)
TABLE 711 BELGIUM DEMOLITION TOOLS IN POWER TOOLS MARKET, BY TYPE, 2018-2032 (USD THOUSAND)
TABLE 712 BELGIUM DEMOLITION TOOLS IN POWER TOOLS MARKET, BY SALES CHANNEL, 2018-2032 (USD THOUSAND)
TABLE 713 BELGIUM ONLINE IN POWER TOOLS MARKET, BY TYPE, 2018-2032 (USD THOUSAND)
TABLE 714 BELGIUM OFFLINE IN POWER TOOLS MARKET, BY TYPE, 2018-2032 (USD THOUSAND)
TABLE 715 BELGIUM NAILERS IN POWER TOOLS MARKET, BY SALES CHANNEL, 2018-2032 (USD THOUSAND)
TABLE 716 BELGIUM ONLINE IN POWER TOOLS MARKET, BY TYPE, 2018-2032 (USD THOUSAND)
TABLE 717 BELGIUM OFFLINE IN POWER TOOLS MARKET, BY TYPE, 2018-2032 (USD THOUSAND)
TABLE 718 BELGIUM ROUTING TOOLS IN POWER TOOLS MARKET, BY TYPE, 2018-2032 (USD THOUSAND)
TABLE 719 BELGIUM ROUTING TOOLS IN POWER TOOLS MARKET, BY SALES CHANNEL, 2018-2032 (USD THOUSAND)
TABLE 720 BELGIUM ONLINE IN POWER TOOLS MARKET, BY TYPE, 2018-2032 (USD THOUSAND)
TABLE 721 BELGIUM OFFLINE IN POWER TOOLS MARKET, BY TYPE, 2018-2032 (USD THOUSAND)
TABLE 722 BELGIUM PORTABLE NIBBLERS IN POWER TOOLS MARKET, BY SALES CHANNEL, 2018-2032 (USD THOUSAND)
TABLE 723 BELGIUM ONLINE IN POWER TOOLS MARKET, BY TYPE, 2018-2032 (USD THOUSAND)
TABLE 724 BELGIUM OFFLINE IN POWER TOOLS MARKET, BY TYPE, 2018-2032 (USD THOUSAND)
TABLE 725 BELGIUM AIR-POWERED TOOLS IN POWER TOOLS MARKET, BY TYPE, 2018-2032 (USD THOUSAND)
TABLE 726 BELGIUM AIR-POWERED TOOLS IN POWER TOOLS MARKET, BY SALES CHANNEL, 2018-2032 (USD THOUSAND)
TABLE 727 BELGIUM ONLINE IN POWER TOOLS MARKET, BY TYPE, 2018-2032 (USD THOUSAND)
TABLE 728 BELGIUM OFFLINE IN POWER TOOLS MARKET, BY TYPE, 2018-2032 (USD THOUSAND)
TABLE 729 BELGIUM MATERIAL REMOVAL TOOLS IN POWER TOOLS MARKET, BY TYPE, 2018-2032 (USD THOUSAND)
TABLE 730 BELGIUM GRINDERS IN POWER TOOLS MARKET, BY TYPE, 2018-2032 (USD THOUSAND)
TABLE 731 BELGIUM SANDERS IN POWER TOOLS MARKET, BY TYPE, 2018-2032 (USD THOUSAND)
TABLE 732 BELGIUM MATERIAL REMOVAL TOOLS IN POWER TOOLS MARKET, BY SALES CHANNEL, 2018-2032 (USD THOUSAND)
TABLE 733 BELGIUM ONLINE IN POWER TOOLS MARKET, BY TYPE, 2018-2032 (USD THOUSAND)
TABLE 734 BELGIUM OFFLINE IN POWER TOOLS MARKET, BY TYPE, 2018-2032 (USD THOUSAND)
TABLE 735 BELGIUM SCREWING (SCREWDRIVER BITS) IN POWER TOOLS MARKET, BY SALES CHANNEL, 2018-2032 (USD THOUSAND)
TABLE 736 BELGIUM ONLINE IN POWER TOOLS MARKET, BY TYPE, 2018-2032 (USD THOUSAND)
TABLE 737 BELGIUM OFFLINE IN POWER TOOLS MARKET, BY TYPE, 2018-2032 (USD THOUSAND)
TABLE 738 BELGIUM CHISELS IN POWER TOOLS MARKET, BY SALES CHANNEL, 2018-2032 (USD THOUSAND)
TABLE 739 BELGIUM ONLINE IN POWER TOOLS MARKET, BY TYPE, 2018-2032 (USD THOUSAND)
TABLE 740 BELGIUM OFFLINE IN POWER TOOLS MARKET, BY TYPE, 2018-2032 (USD THOUSAND)
TABLE 741 BELGIUM ACCESSORIES IN POWER TOOLS MARKET, BY SALES CHANNEL, 2018-2032 (USD THOUSAND)
TABLE 742 BELGIUM ONLINE IN POWER TOOLS MARKET, BY TYPE, 2018-2032 (USD THOUSAND)
TABLE 743 BELGIUM OFFLINE IN POWER TOOLS MARKET, BY TYPE, 2018-2032 (USD THOUSAND)
TABLE 744 BELGIUM OTHERS IN POWER TOOLS MARKET, BY SALES CHANNEL, 2018-2032 (USD THOUSAND)
TABLE 745 BELGIUM ONLINE IN POWER TOOLS MARKET, BY TYPE, 2018-2032 (USD THOUSAND)
TABLE 746 BELGIUM OFFLINE IN POWER TOOLS MARKET, BY TYPE, 2018-2032 (USD THOUSAND)
TABLE 747 BELGIUM POWER TOOLS MARKET, BY MODE OF OPERATION, 2018-2032 (USD THOUSAND)
TABLE 748 BELGIUM ELECTRIC IN POWER TOOLS MARKET, BY TYPE, 2018-2032 (USD THOUSAND)
TABLE 749 BELGIUM POWER TOOLS MARKET, BY APPLICATION, 2018-2032 (USD THOUSAND)
TABLE 750 BELGIUM POWER TOOLS MARKET, BY END USER, 2018-2032 (USD THOUSAND)
TABLE 751 BELGIUM INDUSTRIAL/PROFESSIONAL IN POWER TOOLS MARKET, BY INDUSTRIAL/PROFESSIONAL TYPE, 2018-2032 (USD THOUSAND)
TABLE 752 BELGIUM INDUSTRIAL/PROFESSIONAL IN POWER TOOLS MARKET, BY TYPE, 2018-2032 (USD THOUSAND)
TABLE 753 BELGIUM INDUSTRIAL/PROFESSIONAL IN POWER TOOLS MARKET, BY MODE OF OPERATION, 2018-2032 (USD THOUSAND)
TABLE 754 BELGIUM RESIDENTIAL IN POWER TOOLS MARKET, BY RESIDENTIAL TYPE, 2018-2032 (USD THOUSAND)
TABLE 755 BELGIUM RESIDENTIAL IN POWER TOOLS MARKET, BY TYPE, 2018-2032 (USD THOUSAND)
TABLE 756 BELGIUM RESIDENTIAL IN POWER TOOLS MARKET, BY MODE OF OPERATION, 2018-2032 (USD THOUSAND)
TABLE 757 BELGIUM POWER TOOLS MARKET, BY SALES CHANNEL, 2018-2032 (USD THOUSAND)
TABLE 758 BELGIUM ONLINE IN POWER TOOLS MARKET, BY TYPE, 2018-2032 (USD THOUSAND)
TABLE 759 BELGIUM OFFLINE IN POWER TOOLS MARKET, BY TYPE, 2018-2032 (USD THOUSAND)
TABLE 760 SWITZERLAND POWER TOOLS MARKET, BY TYPE, 2018-2032 (USD THOUSAND)
TABLE 761 SWITZERLAND DRILLING AND FASTENING TOOLS IN POWER TOOLS MARKET, BY TYPE, 2018-2032 (USD THOUSAND)
TABLE 762 SWITZERLAND DRILLING AND FASTENING TOOLS IN POWER TOOLS MARKET, BY MATERIAL, 2018-2032 (USD THOUSAND)
TABLE 763 SWITZERLAND DRILLING AND FASTENING TOOLS IN POWER TOOLS MARKET, BY SALES CHANNEL, 2018-2032 (USD THOUSAND)
TABLE 764 SWITZERLAND ONLINE IN POWER TOOLS MARKET, BY TYPE, 2018-2032 (USD THOUSAND)
TABLE 765 SWITZERLAND OFFLINE IN POWER TOOLS MARKET, BY TYPE, 2018-2032 (USD THOUSAND)
TABLE 766 SWITZERLAND SAWING IN POWER TOOLS MARKET, BY TYPE, 2018-2032 (USD THOUSAND)
TABLE 767 SWITZERLAND SAWING TOOLS IN POWER TOOLS MARKET, BY SALES CHANNEL, 2018-2032 (USD THOUSAND)
TABLE 768 SWITZERLAND ONLINE IN POWER TOOLS MARKET, BY TYPE, 2018-2032 (USD THOUSAND)
TABLE 769 SWITZERLAND OFFLINE IN POWER TOOLS MARKET, BY TYPE, 2018-2032 (USD THOUSAND)
TABLE 770 SWITZERLAND CUTING IN POWER TOOLS MARKET, BY TYPE, 2018-2032 (USD THOUSAND)
TABLE 771 SWITZERLAND CUTING IN POWER TOOLS MARKET, BY SALES CHANNEL, 2018-2032 (USD THOUSAND)
TABLE 772 SWITZERLAND ONLINE IN POWER TOOLS MARKET, BY TYPE, 2018-2032 (USD THOUSAND)
TABLE 773 SWITZERLAND OFFLINE IN POWER TOOLS MARKET, BY TYPE, 2018-2032 (USD THOUSAND)
TABLE 774 SWITZERLAND DEMOLITION TOOLS IN POWER TOOLS MARKET, BY TYPE, 2018-2032 (USD THOUSAND)
TABLE 775 SWITZERLAND DEMOLITION TOOLS IN POWER TOOLS MARKET, BY SALES CHANNEL, 2018-2032 (USD THOUSAND)
TABLE 776 SWITZERLAND ONLINE IN POWER TOOLS MARKET, BY TYPE, 2018-2032 (USD THOUSAND)
TABLE 777 SWITZERLAND OFFLINE IN POWER TOOLS MARKET, BY TYPE, 2018-2032 (USD THOUSAND)
TABLE 778 SWITZERLAND NAILERS IN POWER TOOLS MARKET, BY SALES CHANNEL, 2018-2032 (USD THOUSAND)
TABLE 779 SWITZERLAND ONLINE IN POWER TOOLS MARKET, BY TYPE, 2018-2032 (USD THOUSAND)
TABLE 780 SWITZERLAND OFFLINE IN POWER TOOLS MARKET, BY TYPE, 2018-2032 (USD THOUSAND)
TABLE 781 SWITZERLAND ROUTING TOOLS IN POWER TOOLS MARKET, BY TYPE, 2018-2032 (USD THOUSAND)
TABLE 782 SWITZERLAND ROUTING TOOLS IN POWER TOOLS MARKET, BY SALES CHANNEL, 2018-2032 (USD THOUSAND)
TABLE 783 SWITZERLAND ONLINE IN POWER TOOLS MARKET, BY TYPE, 2018-2032 (USD THOUSAND)
TABLE 784 SWITZERLAND OFFLINE IN POWER TOOLS MARKET, BY TYPE, 2018-2032 (USD THOUSAND)
TABLE 785 SWITZERLAND PORTABLE NIBBLERS IN POWER TOOLS MARKET, BY SALES CHANNEL, 2018-2032 (USD THOUSAND)
TABLE 786 SWITZERLAND ONLINE IN POWER TOOLS MARKET, BY TYPE, 2018-2032 (USD THOUSAND)
TABLE 787 SWITZERLAND OFFLINE IN POWER TOOLS MARKET, BY TYPE, 2018-2032 (USD THOUSAND)
TABLE 788 SWITZERLAND AIR-POWERED TOOLS IN POWER TOOLS MARKET, BY TYPE, 2018-2032 (USD THOUSAND)
TABLE 789 SWITZERLAND AIR-POWERED TOOLS IN POWER TOOLS MARKET, BY SALES CHANNEL, 2018-2032 (USD THOUSAND)
TABLE 790 SWITZERLAND ONLINE IN POWER TOOLS MARKET, BY TYPE, 2018-2032 (USD THOUSAND)
TABLE 791 SWITZERLAND OFFLINE IN POWER TOOLS MARKET, BY TYPE, 2018-2032 (USD THOUSAND)
TABLE 792 SWITZERLAND MATERIAL REMOVAL TOOLS IN POWER TOOLS MARKET, BY TYPE, 2018-2032 (USD THOUSAND)
TABLE 793 SWITZERLAND GRINDERS IN POWER TOOLS MARKET, BY TYPE, 2018-2032 (USD THOUSAND)
TABLE 794 SWITZERLAND SANDERS IN POWER TOOLS MARKET, BY TYPE, 2018-2032 (USD THOUSAND)
TABLE 795 SWITZERLAND MATERIAL REMOVAL TOOLS IN POWER TOOLS MARKET, BY SALES CHANNEL, 2018-2032 (USD THOUSAND)
TABLE 796 SWITZERLAND ONLINE IN POWER TOOLS MARKET, BY TYPE, 2018-2032 (USD THOUSAND)
TABLE 797 SWITZERLAND OFFLINE IN POWER TOOLS MARKET, BY TYPE, 2018-2032 (USD THOUSAND)
TABLE 798 SWITZERLAND SCREWING (SCREWDRIVER BITS) IN POWER TOOLS MARKET, BY SALES CHANNEL, 2018-2032 (USD THOUSAND)
TABLE 799 SWITZERLAND ONLINE IN POWER TOOLS MARKET, BY TYPE, 2018-2032 (USD THOUSAND)
TABLE 800 SWITZERLAND OFFLINE IN POWER TOOLS MARKET, BY TYPE, 2018-2032 (USD THOUSAND)
TABLE 801 SWITZERLAND CHISELS IN POWER TOOLS MARKET, BY SALES CHANNEL, 2018-2032 (USD THOUSAND)
TABLE 802 SWITZERLAND ONLINE IN POWER TOOLS MARKET, BY TYPE, 2018-2032 (USD THOUSAND)
TABLE 803 SWITZERLAND OFFLINE IN POWER TOOLS MARKET, BY TYPE, 2018-2032 (USD THOUSAND)
TABLE 804 SWITZERLAND ACCESSORIES IN POWER TOOLS MARKET, BY SALES CHANNEL, 2018-2032 (USD THOUSAND)
TABLE 805 SWITZERLAND ONLINE IN POWER TOOLS MARKET, BY TYPE, 2018-2032 (USD THOUSAND)
TABLE 806 SWITZERLAND OFFLINE IN POWER TOOLS MARKET, BY TYPE, 2018-2032 (USD THOUSAND)
TABLE 807 SWITZERLAND OTHERS IN POWER TOOLS MARKET, BY SALES CHANNEL, 2018-2032 (USD THOUSAND)
TABLE 808 SWITZERLAND ONLINE IN POWER TOOLS MARKET, BY TYPE, 2018-2032 (USD THOUSAND)
TABLE 809 SWITZERLAND OFFLINE IN POWER TOOLS MARKET, BY TYPE, 2018-2032 (USD THOUSAND)
TABLE 810 SWITZERLAND POWER TOOLS MARKET, BY MODE OF OPERATION, 2018-2032 (USD THOUSAND)
TABLE 811 SWITZERLAND ELECTRIC IN POWER TOOLS MARKET, BY TYPE, 2018-2032 (USD THOUSAND)
TABLE 812 SWITZERLAND POWER TOOLS MARKET, BY APPLICATION, 2018-2032 (USD THOUSAND)
TABLE 813 SWITZERLAND POWER TOOLS MARKET, BY END USER, 2018-2032 (USD THOUSAND)
TABLE 814 SWITZERLAND INDUSTRIAL/PROFESSIONAL IN POWER TOOLS MARKET, BY INDUSTRIAL/PROFESSIONAL TYPE, 2018-2032 (USD THOUSAND)
TABLE 815 SWITZERLAND INDUSTRIAL/PROFESSIONAL IN POWER TOOLS MARKET, BY TYPE, 2018-2032 (USD THOUSAND)
TABLE 816 SWITZERLAND INDUSTRIAL/PROFESSIONAL IN POWER TOOLS MARKET, BY MODE OF OPERATION, 2018-2032 (USD THOUSAND)
TABLE 817 SWITZERLAND RESIDENTIAL IN POWER TOOLS MARKET, BY RESIDENTIAL TYPE, 2018-2032 (USD THOUSAND)
TABLE 818 SWITZERLAND RESIDENTIAL IN POWER TOOLS MARKET, BY TYPE, 2018-2032 (USD THOUSAND)
TABLE 819 SWITZERLAND RESIDENTIAL IN POWER TOOLS MARKET, BY MODE OF OPERATION, 2018-2032 (USD THOUSAND)
TABLE 820 SWITZERLAND POWER TOOLS MARKET, BY SALES CHANNEL, 2018-2032 (USD THOUSAND)
TABLE 821 SWITZERLAND ONLINE IN POWER TOOLS MARKET, BY TYPE, 2018-2032 (USD THOUSAND)
TABLE 822 SWITZERLAND OFFLINE IN POWER TOOLS MARKET, BY TYPE, 2018-2032 (USD THOUSAND)
TABLE 823 DENMARK POWER TOOLS MARKET, BY TYPE, 2018-2032 (USD THOUSAND)
TABLE 824 DENMARK DRILLING AND FASTENING TOOLS IN POWER TOOLS MARKET, BY TYPE, 2018-2032 (USD THOUSAND)
TABLE 825 DENMARK DRILLING AND FASTENING TOOLS IN POWER TOOLS MARKET, BY MATERIAL, 2018-2032 (USD THOUSAND)
TABLE 826 DENMARK DRILLING AND FASTENING TOOLS IN POWER TOOLS MARKET, BY SALES CHANNEL, 2018-2032 (USD THOUSAND)
TABLE 827 DENMARK ONLINE IN POWER TOOLS MARKET, BY TYPE, 2018-2032 (USD THOUSAND)
TABLE 828 DENMARK OFFLINE IN POWER TOOLS MARKET, BY TYPE, 2018-2032 (USD THOUSAND)
TABLE 829 DENMARK SAWING IN POWER TOOLS MARKET, BY TYPE, 2018-2032 (USD THOUSAND)
TABLE 830 DENMARK SAWING TOOLS IN POWER TOOLS MARKET, BY SALES CHANNEL, 2018-2032 (USD THOUSAND)
TABLE 831 DENMARK ONLINE IN POWER TOOLS MARKET, BY TYPE, 2018-2032 (USD THOUSAND)
TABLE 832 DENMARK OFFLINE IN POWER TOOLS MARKET, BY TYPE, 2018-2032 (USD THOUSAND)
TABLE 833 DENMARK CUTING IN POWER TOOLS MARKET, BY TYPE, 2018-2032 (USD THOUSAND)
TABLE 834 DENMARK CUTING IN POWER TOOLS MARKET, BY SALES CHANNEL, 2018-2032 (USD THOUSAND)
TABLE 835 DENMARK ONLINE IN POWER TOOLS MARKET, BY TYPE, 2018-2032 (USD THOUSAND)
TABLE 836 DENMARK OFFLINE IN POWER TOOLS MARKET, BY TYPE, 2018-2032 (USD THOUSAND)
TABLE 837 DENMARK DEMOLITION TOOLS IN POWER TOOLS MARKET, BY TYPE, 2018-2032 (USD THOUSAND)
TABLE 838 DENMARK DEMOLITION TOOLS IN POWER TOOLS MARKET, BY SALES CHANNEL, 2018-2032 (USD THOUSAND)
TABLE 839 DENMARK ONLINE IN POWER TOOLS MARKET, BY TYPE, 2018-2032 (USD THOUSAND)
TABLE 840 DENMARK OFFLINE IN POWER TOOLS MARKET, BY TYPE, 2018-2032 (USD THOUSAND)
TABLE 841 DENMARK NAILERS IN POWER TOOLS MARKET, BY SALES CHANNEL, 2018-2032 (USD THOUSAND)
TABLE 842 DENMARK ONLINE IN POWER TOOLS MARKET, BY TYPE, 2018-2032 (USD THOUSAND)
TABLE 843 DENMARK OFFLINE IN POWER TOOLS MARKET, BY TYPE, 2018-2032 (USD THOUSAND)
TABLE 844 DENMARK ROUTING TOOLS IN POWER TOOLS MARKET, BY TYPE, 2018-2032 (USD THOUSAND)
TABLE 845 DENMARK ROUTING TOOLS IN POWER TOOLS MARKET, BY SALES CHANNEL, 2018-2032 (USD THOUSAND)
TABLE 846 DENMARK ONLINE IN POWER TOOLS MARKET, BY TYPE, 2018-2032 (USD THOUSAND)
TABLE 847 DENMARK OFFLINE IN POWER TOOLS MARKET, BY TYPE, 2018-2032 (USD THOUSAND)
TABLE 848 DENMARK PORTABLE NIBBLERS IN POWER TOOLS MARKET, BY SALES CHANNEL, 2018-2032 (USD THOUSAND)
TABLE 849 DENMARK ONLINE IN POWER TOOLS MARKET, BY TYPE, 2018-2032 (USD THOUSAND)
TABLE 850 DENMARK OFFLINE IN POWER TOOLS MARKET, BY TYPE, 2018-2032 (USD THOUSAND)
TABLE 851 DENMARK AIR-POWERED TOOLS IN POWER TOOLS MARKET, BY TYPE, 2018-2032 (USD THOUSAND)
TABLE 852 DENMARK AIR-POWERED TOOLS IN POWER TOOLS MARKET, BY SALES CHANNEL, 2018-2032 (USD THOUSAND)
TABLE 853 DENMARK ONLINE IN POWER TOOLS MARKET, BY TYPE, 2018-2032 (USD THOUSAND)
TABLE 854 DENMARK OFFLINE IN POWER TOOLS MARKET, BY TYPE, 2018-2032 (USD THOUSAND)
TABLE 855 DENMARK MATERIAL REMOVAL TOOLS IN POWER TOOLS MARKET, BY TYPE, 2018-2032 (USD THOUSAND)
TABLE 856 DENMARK GRINDERS IN POWER TOOLS MARKET, BY TYPE, 2018-2032 (USD THOUSAND)
TABLE 857 DENMARK SANDERS IN POWER TOOLS MARKET, BY TYPE, 2018-2032 (USD THOUSAND)
TABLE 858 DENMARK MATERIAL REMOVAL TOOLS IN POWER TOOLS MARKET, BY SALES CHANNEL, 2018-2032 (USD THOUSAND)
TABLE 859 DENMARK ONLINE IN POWER TOOLS MARKET, BY TYPE, 2018-2032 (USD THOUSAND)
TABLE 860 DENMARK OFFLINE IN POWER TOOLS MARKET, BY TYPE, 2018-2032 (USD THOUSAND)
TABLE 861 DENMARK SCREWING (SCREWDRIVER BITS) IN POWER TOOLS MARKET, BY SALES CHANNEL, 2018-2032 (USD THOUSAND)
TABLE 862 DENMARK ONLINE IN POWER TOOLS MARKET, BY TYPE, 2018-2032 (USD THOUSAND)
TABLE 863 DENMARK OFFLINE IN POWER TOOLS MARKET, BY TYPE, 2018-2032 (USD THOUSAND)
TABLE 864 DENMARK CHISELS IN POWER TOOLS MARKET, BY SALES CHANNEL, 2018-2032 (USD THOUSAND)
TABLE 865 DENMARK ONLINE IN POWER TOOLS MARKET, BY TYPE, 2018-2032 (USD THOUSAND)
TABLE 866 DENMARK OFFLINE IN POWER TOOLS MARKET, BY TYPE, 2018-2032 (USD THOUSAND)
TABLE 867 DENMARK ACCESSORIES IN POWER TOOLS MARKET, BY SALES CHANNEL, 2018-2032 (USD THOUSAND)
TABLE 868 DENMARK ONLINE IN POWER TOOLS MARKET, BY TYPE, 2018-2032 (USD THOUSAND)
TABLE 869 DENMARK OFFLINE IN POWER TOOLS MARKET, BY TYPE, 2018-2032 (USD THOUSAND)
TABLE 870 DENMARK OTHERS IN POWER TOOLS MARKET, BY SALES CHANNEL, 2018-2032 (USD THOUSAND)
TABLE 871 DENMARK ONLINE IN POWER TOOLS MARKET, BY TYPE, 2018-2032 (USD THOUSAND)
TABLE 872 DENMARK OFFLINE IN POWER TOOLS MARKET, BY TYPE, 2018-2032 (USD THOUSAND)
TABLE 873 DENMARK POWER TOOLS MARKET, BY MODE OF OPERATION, 2018-2032 (USD THOUSAND)
TABLE 874 DENMARK ELECTRIC IN POWER TOOLS MARKET, BY TYPE, 2018-2032 (USD THOUSAND)
TABLE 875 DENMARK POWER TOOLS MARKET, BY APPLICATION, 2018-2032 (USD THOUSAND)
TABLE 876 DENMARK POWER TOOLS MARKET, BY END USER, 2018-2032 (USD THOUSAND)
TABLE 877 DENMARK INDUSTRIAL/PROFESSIONAL IN POWER TOOLS MARKET, BY INDUSTRIAL/PROFESSIONAL TYPE, 2018-2032 (USD THOUSAND)
TABLE 878 DENMARK INDUSTRIAL/PROFESSIONAL IN POWER TOOLS MARKET, BY TYPE, 2018-2032 (USD THOUSAND)
TABLE 879 DENMARK INDUSTRIAL/PROFESSIONAL IN POWER TOOLS MARKET, BY MODE OF OPERATION, 2018-2032 (USD THOUSAND)
TABLE 880 DENMARK RESIDENTIAL IN POWER TOOLS MARKET, BY RESIDENTIAL TYPE, 2018-2032 (USD THOUSAND)
TABLE 881 DENMARK RESIDENTIAL IN POWER TOOLS MARKET, BY TYPE, 2018-2032 (USD THOUSAND)
TABLE 882 DENMARK RESIDENTIAL IN POWER TOOLS MARKET, BY MODE OF OPERATION, 2018-2032 (USD THOUSAND)
TABLE 883 DENMARK POWER TOOLS MARKET, BY SALES CHANNEL, 2018-2032 (USD THOUSAND)
TABLE 884 DENMARK ONLINE IN POWER TOOLS MARKET, BY TYPE, 2018-2032 (USD THOUSAND)
TABLE 885 DENMARK OFFLINE IN POWER TOOLS MARKET, BY TYPE, 2018-2032 (USD THOUSAND)
TABLE 886 NORWAY POWER TOOLS MARKET, BY TYPE, 2018-2032 (USD THOUSAND)
TABLE 887 NORWAY DRILLING AND FASTENING TOOLS IN POWER TOOLS MARKET, BY TYPE, 2018-2032 (USD THOUSAND)
TABLE 888 NORWAY DRILLING AND FASTENING TOOLS IN POWER TOOLS MARKET, BY MATERIAL, 2018-2032 (USD THOUSAND)
TABLE 889 NORWAY DRILLING AND FASTENING TOOLS IN POWER TOOLS MARKET, BY SALES CHANNEL, 2018-2032 (USD THOUSAND)
TABLE 890 NORWAY ONLINE IN POWER TOOLS MARKET, BY TYPE, 2018-2032 (USD THOUSAND)
TABLE 891 NORWAY OFFLINE IN POWER TOOLS MARKET, BY TYPE, 2018-2032 (USD THOUSAND)
TABLE 892 NORWAY SAWING IN POWER TOOLS MARKET, BY TYPE, 2018-2032 (USD THOUSAND)
TABLE 893 NORWAY SAWING TOOLS IN POWER TOOLS MARKET, BY SALES CHANNEL, 2018-2032 (USD THOUSAND)
TABLE 894 NORWAY ONLINE IN POWER TOOLS MARKET, BY TYPE, 2018-2032 (USD THOUSAND)
TABLE 895 NORWAY OFFLINE IN POWER TOOLS MARKET, BY TYPE, 2018-2032 (USD THOUSAND)
TABLE 896 NORWAY CUTING IN POWER TOOLS MARKET, BY TYPE, 2018-2032 (USD THOUSAND)
TABLE 897 NORWAY CUTING IN POWER TOOLS MARKET, BY SALES CHANNEL, 2018-2032 (USD THOUSAND)
TABLE 898 NORWAY ONLINE IN POWER TOOLS MARKET, BY TYPE, 2018-2032 (USD THOUSAND)
TABLE 899 NORWAY OFFLINE IN POWER TOOLS MARKET, BY TYPE, 2018-2032 (USD THOUSAND)
TABLE 900 NORWAY DEMOLITION TOOLS IN POWER TOOLS MARKET, BY TYPE, 2018-2032 (USD THOUSAND)
TABLE 901 NORWAY DEMOLITION TOOLS IN POWER TOOLS MARKET, BY SALES CHANNEL, 2018-2032 (USD THOUSAND)
TABLE 902 NORWAY ONLINE IN POWER TOOLS MARKET, BY TYPE, 2018-2032 (USD THOUSAND)
TABLE 903 NORWAY OFFLINE IN POWER TOOLS MARKET, BY TYPE, 2018-2032 (USD THOUSAND)
TABLE 904 NORWAY NAILERS IN POWER TOOLS MARKET, BY SALES CHANNEL, 2018-2032 (USD THOUSAND)
TABLE 905 NORWAY ONLINE IN POWER TOOLS MARKET, BY TYPE, 2018-2032 (USD THOUSAND)
TABLE 906 NORWAY OFFLINE IN POWER TOOLS MARKET, BY TYPE, 2018-2032 (USD THOUSAND)
TABLE 907 NORWAY ROUTING TOOLS IN POWER TOOLS MARKET, BY TYPE, 2018-2032 (USD THOUSAND)
TABLE 908 NORWAY ROUTING TOOLS IN POWER TOOLS MARKET, BY SALES CHANNEL, 2018-2032 (USD THOUSAND)
TABLE 909 NORWAY ONLINE IN POWER TOOLS MARKET, BY TYPE, 2018-2032 (USD THOUSAND)
TABLE 910 NORWAY OFFLINE IN POWER TOOLS MARKET, BY TYPE, 2018-2032 (USD THOUSAND)
TABLE 911 NORWAY PORTABLE NIBBLERS IN POWER TOOLS MARKET, BY SALES CHANNEL, 2018-2032 (USD THOUSAND)
TABLE 912 NORWAY ONLINE IN POWER TOOLS MARKET, BY TYPE, 2018-2032 (USD THOUSAND)
TABLE 913 NORWAY OFFLINE IN POWER TOOLS MARKET, BY TYPE, 2018-2032 (USD THOUSAND)
TABLE 914 NORWAY AIR-POWERED TOOLS IN POWER TOOLS MARKET, BY TYPE, 2018-2032 (USD THOUSAND)
TABLE 915 NORWAY AIR-POWERED TOOLS IN POWER TOOLS MARKET, BY SALES CHANNEL, 2018-2032 (USD THOUSAND)
TABLE 916 NORWAY ONLINE IN POWER TOOLS MARKET, BY TYPE, 2018-2032 (USD THOUSAND)
TABLE 917 NORWAY OFFLINE IN POWER TOOLS MARKET, BY TYPE, 2018-2032 (USD THOUSAND)
TABLE 918 NORWAY MATERIAL REMOVAL TOOLS IN POWER TOOLS MARKET, BY TYPE, 2018-2032 (USD THOUSAND)
TABLE 919 NORWAY GRINDERS IN POWER TOOLS MARKET, BY TYPE, 2018-2032 (USD THOUSAND)
TABLE 920 NORWAY SANDERS IN POWER TOOLS MARKET, BY TYPE, 2018-2032 (USD THOUSAND)
TABLE 921 NORWAY MATERIAL REMOVAL TOOLS IN POWER TOOLS MARKET, BY SALES CHANNEL, 2018-2032 (USD THOUSAND)
TABLE 922 NORWAY ONLINE IN POWER TOOLS MARKET, BY TYPE, 2018-2032 (USD THOUSAND)
TABLE 923 NORWAY OFFLINE IN POWER TOOLS MARKET, BY TYPE, 2018-2032 (USD THOUSAND)
TABLE 924 NORWAY SCREWING (SCREWDRIVER BITS) IN POWER TOOLS MARKET, BY SALES CHANNEL, 2018-2032 (USD THOUSAND)
TABLE 925 NORWAY ONLINE IN POWER TOOLS MARKET, BY TYPE, 2018-2032 (USD THOUSAND)
TABLE 926 NORWAY OFFLINE IN POWER TOOLS MARKET, BY TYPE, 2018-2032 (USD THOUSAND)
TABLE 927 NORWAY CHISELS IN POWER TOOLS MARKET, BY SALES CHANNEL, 2018-2032 (USD THOUSAND)
TABLE 928 NORWAY ONLINE IN POWER TOOLS MARKET, BY TYPE, 2018-2032 (USD THOUSAND)
TABLE 929 NORWAY OFFLINE IN POWER TOOLS MARKET, BY TYPE, 2018-2032 (USD THOUSAND)
TABLE 930 NORWAY ACCESSORIES IN POWER TOOLS MARKET, BY SALES CHANNEL, 2018-2032 (USD THOUSAND)
TABLE 931 NORWAY ONLINE IN POWER TOOLS MARKET, BY TYPE, 2018-2032 (USD THOUSAND)
TABLE 932 NORWAY OFFLINE IN POWER TOOLS MARKET, BY TYPE, 2018-2032 (USD THOUSAND)
TABLE 933 NORWAY OTHERS IN POWER TOOLS MARKET, BY SALES CHANNEL, 2018-2032 (USD THOUSAND)
TABLE 934 NORWAY ONLINE IN POWER TOOLS MARKET, BY TYPE, 2018-2032 (USD THOUSAND)
TABLE 935 NORWAY OFFLINE IN POWER TOOLS MARKET, BY TYPE, 2018-2032 (USD THOUSAND)
TABLE 936 NORWAY POWER TOOLS MARKET, BY MODE OF OPERATION, 2018-2032 (USD THOUSAND)
TABLE 937 NORWAY ELECTRIC IN POWER TOOLS MARKET, BY TYPE, 2018-2032 (USD THOUSAND)
TABLE 938 NORWAY POWER TOOLS MARKET, BY APPLICATION, 2018-2032 (USD THOUSAND)
TABLE 939 NORWAY POWER TOOLS MARKET, BY END USER, 2018-2032 (USD THOUSAND)
TABLE 940 NORWAY INDUSTRIAL/PROFESSIONAL IN POWER TOOLS MARKET, BY INDUSTRIAL/PROFESSIONAL TYPE, 2018-2032 (USD THOUSAND)
TABLE 941 NORWAY INDUSTRIAL/PROFESSIONAL IN POWER TOOLS MARKET, BY TYPE, 2018-2032 (USD THOUSAND)
TABLE 942 NORWAY INDUSTRIAL/PROFESSIONAL IN POWER TOOLS MARKET, BY MODE OF OPERATION, 2018-2032 (USD THOUSAND)
TABLE 943 NORWAY RESIDENTIAL IN POWER TOOLS MARKET, BY RESIDENTIAL TYPE, 2018-2032 (USD THOUSAND)
TABLE 944 NORWAY RESIDENTIAL IN POWER TOOLS MARKET, BY TYPE, 2018-2032 (USD THOUSAND)
TABLE 945 NORWAY RESIDENTIAL IN POWER TOOLS MARKET, BY MODE OF OPERATION, 2018-2032 (USD THOUSAND)
TABLE 946 NORWAY POWER TOOLS MARKET, BY SALES CHANNEL, 2018-2032 (USD THOUSAND)
TABLE 947 NORWAY ONLINE IN POWER TOOLS MARKET, BY TYPE, 2018-2032 (USD THOUSAND)
TABLE 948 NORWAY OFFLINE IN POWER TOOLS MARKET, BY TYPE, 2018-2032 (USD THOUSAND)
TABLE 949 FINLAND POWER TOOLS MARKET, BY TYPE, 2018-2032 (USD THOUSAND)
TABLE 950 FINLAND DRILLING AND FASTENING TOOLS IN POWER TOOLS MARKET, BY TYPE, 2018-2032 (USD THOUSAND)
TABLE 951 FINLAND DRILLING AND FASTENING TOOLS IN POWER TOOLS MARKET, BY MATERIAL, 2018-2032 (USD THOUSAND)
TABLE 952 FINLAND DRILLING AND FASTENING TOOLS IN POWER TOOLS MARKET, BY SALES CHANNEL, 2018-2032 (USD THOUSAND)
TABLE 953 FINLAND ONLINE IN POWER TOOLS MARKET, BY TYPE, 2018-2032 (USD THOUSAND)
TABLE 954 FINLAND OFFLINE IN POWER TOOLS MARKET, BY TYPE, 2018-2032 (USD THOUSAND)
TABLE 955 FINLAND SAWING IN POWER TOOLS MARKET, BY TYPE, 2018-2032 (USD THOUSAND)
TABLE 956 FINLAND SAWING TOOLS IN POWER TOOLS MARKET, BY SALES CHANNEL, 2018-2032 (USD THOUSAND)
TABLE 957 FINLAND ONLINE IN POWER TOOLS MARKET, BY TYPE, 2018-2032 (USD THOUSAND)
TABLE 958 FINLAND OFFLINE IN POWER TOOLS MARKET, BY TYPE, 2018-2032 (USD THOUSAND)
TABLE 959 FINLAND CUTING IN POWER TOOLS MARKET, BY TYPE, 2018-2032 (USD THOUSAND)
TABLE 960 FINLAND CUTING IN POWER TOOLS MARKET, BY SALES CHANNEL, 2018-2032 (USD THOUSAND)
TABLE 961 FINLAND ONLINE IN POWER TOOLS MARKET, BY TYPE, 2018-2032 (USD THOUSAND)
TABLE 962 FINLAND OFFLINE IN POWER TOOLS MARKET, BY TYPE, 2018-2032 (USD THOUSAND)
TABLE 963 FINLAND DEMOLITION TOOLS IN POWER TOOLS MARKET, BY TYPE, 2018-2032 (USD THOUSAND)
TABLE 964 FINLAND DEMOLITION TOOLS IN POWER TOOLS MARKET, BY SALES CHANNEL, 2018-2032 (USD THOUSAND)
TABLE 965 FINLAND ONLINE IN POWER TOOLS MARKET, BY TYPE, 2018-2032 (USD THOUSAND)
TABLE 966 FINLAND OFFLINE IN POWER TOOLS MARKET, BY TYPE, 2018-2032 (USD THOUSAND)
TABLE 967 FINLAND NAILERS IN POWER TOOLS MARKET, BY SALES CHANNEL, 2018-2032 (USD THOUSAND)
TABLE 968 FINLAND ONLINE IN POWER TOOLS MARKET, BY TYPE, 2018-2032 (USD THOUSAND)
TABLE 969 FINLAND OFFLINE IN POWER TOOLS MARKET, BY TYPE, 2018-2032 (USD THOUSAND)
TABLE 970 FINLAND ROUTING TOOLS IN POWER TOOLS MARKET, BY TYPE, 2018-2032 (USD THOUSAND)
TABLE 971 FINLAND ROUTING TOOLS IN POWER TOOLS MARKET, BY SALES CHANNEL, 2018-2032 (USD THOUSAND)
TABLE 972 FINLAND ONLINE IN POWER TOOLS MARKET, BY TYPE, 2018-2032 (USD THOUSAND)
TABLE 973 FINLAND OFFLINE IN POWER TOOLS MARKET, BY TYPE, 2018-2032 (USD THOUSAND)
TABLE 974 FINLAND PORTABLE NIBBLERS IN POWER TOOLS MARKET, BY SALES CHANNEL, 2018-2032 (USD THOUSAND)
TABLE 975 FINLAND ONLINE IN POWER TOOLS MARKET, BY TYPE, 2018-2032 (USD THOUSAND)
TABLE 976 FINLAND OFFLINE IN POWER TOOLS MARKET, BY TYPE, 2018-2032 (USD THOUSAND)
TABLE 977 FINLAND AIR-POWERED TOOLS IN POWER TOOLS MARKET, BY TYPE, 2018-2032 (USD THOUSAND)
TABLE 978 FINLAND AIR-POWERED TOOLS IN POWER TOOLS MARKET, BY SALES CHANNEL, 2018-2032 (USD THOUSAND)
TABLE 979 FINLAND ONLINE IN POWER TOOLS MARKET, BY TYPE, 2018-2032 (USD THOUSAND)
TABLE 980 FINLAND OFFLINE IN POWER TOOLS MARKET, BY TYPE, 2018-2032 (USD THOUSAND)
TABLE 981 FINLAND MATERIAL REMOVAL TOOLS IN POWER TOOLS MARKET, BY TYPE, 2018-2032 (USD THOUSAND)
TABLE 982 FINLAND GRINDERS IN POWER TOOLS MARKET, BY TYPE, 2018-2032 (USD THOUSAND)
TABLE 983 FINLAND SANDERS IN POWER TOOLS MARKET, BY TYPE, 2018-2032 (USD THOUSAND)
TABLE 984 FINLAND MATERIAL REMOVAL TOOLS IN POWER TOOLS MARKET, BY SALES CHANNEL, 2018-2032 (USD THOUSAND)
TABLE 985 FINLAND ONLINE IN POWER TOOLS MARKET, BY TYPE, 2018-2032 (USD THOUSAND)
TABLE 986 FINLAND OFFLINE IN POWER TOOLS MARKET, BY TYPE, 2018-2032 (USD THOUSAND)
TABLE 987 FINLAND SCREWING (SCREWDRIVER BITS) IN POWER TOOLS MARKET, BY SALES CHANNEL, 2018-2032 (USD THOUSAND)
TABLE 988 FINLAND ONLINE IN POWER TOOLS MARKET, BY TYPE, 2018-2032 (USD THOUSAND)
TABLE 989 FINLAND OFFLINE IN POWER TOOLS MARKET, BY TYPE, 2018-2032 (USD THOUSAND)
TABLE 990 FINLAND CHISELS IN POWER TOOLS MARKET, BY SALES CHANNEL, 2018-2032 (USD THOUSAND)
TABLE 991 FINLAND ONLINE IN POWER TOOLS MARKET, BY TYPE, 2018-2032 (USD THOUSAND)
TABLE 992 FINLAND OFFLINE IN POWER TOOLS MARKET, BY TYPE, 2018-2032 (USD THOUSAND)
TABLE 993 FINLAND ACCESSORIES IN POWER TOOLS MARKET, BY SALES CHANNEL, 2018-2032 (USD THOUSAND)
TABLE 994 FINLAND ONLINE IN POWER TOOLS MARKET, BY TYPE, 2018-2032 (USD THOUSAND)
TABLE 995 FINLAND OFFLINE IN POWER TOOLS MARKET, BY TYPE, 2018-2032 (USD THOUSAND)
TABLE 996 FINLAND OTHERS IN POWER TOOLS MARKET, BY SALES CHANNEL, 2018-2032 (USD THOUSAND)
TABLE 997 FINLAND ONLINE IN POWER TOOLS MARKET, BY TYPE, 2018-2032 (USD THOUSAND)
TABLE 998 FINLAND OFFLINE IN POWER TOOLS MARKET, BY TYPE, 2018-2032 (USD THOUSAND)
TABLE 999 FINLAND POWER TOOLS MARKET, BY MODE OF OPERATION, 2018-2032 (USD THOUSAND)
TABLE 1000 FINLAND ELECTRIC IN POWER TOOLS MARKET, BY TYPE, 2018-2032 (USD THOUSAND)
TABLE 1001 FINLAND POWER TOOLS MARKET, BY APPLICATION, 2018-2032 (USD THOUSAND)
TABLE 1002 FINLAND POWER TOOLS MARKET, BY END USER, 2018-2032 (USD THOUSAND)
TABLE 1003 FINLAND INDUSTRIAL/PROFESSIONAL IN POWER TOOLS MARKET, BY INDUSTRIAL/PROFESSIONAL TYPE, 2018-2032 (USD THOUSAND)
TABLE 1004 FINLAND INDUSTRIAL/PROFESSIONAL IN POWER TOOLS MARKET, BY TYPE, 2018-2032 (USD THOUSAND)
TABLE 1005 FINLAND INDUSTRIAL/PROFESSIONAL IN POWER TOOLS MARKET, BY MODE OF OPERATION, 2018-2032 (USD THOUSAND)
TABLE 1006 FINLAND RESIDENTIAL IN POWER TOOLS MARKET, BY RESIDENTIAL TYPE, 2018-2032 (USD THOUSAND)
TABLE 1007 FINLAND RESIDENTIAL IN POWER TOOLS MARKET, BY TYPE, 2018-2032 (USD THOUSAND)
TABLE 1008 FINLAND RESIDENTIAL IN POWER TOOLS MARKET, BY MODE OF OPERATION, 2018-2032 (USD THOUSAND)
TABLE 1009 FINLAND POWER TOOLS MARKET, BY SALES CHANNEL, 2018-2032 (USD THOUSAND)
TABLE 1010 FINLAND ONLINE IN POWER TOOLS MARKET, BY TYPE, 2018-2032 (USD THOUSAND)
TABLE 1011 FINLAND OFFLINE IN POWER TOOLS MARKET, BY TYPE, 2018-2032 (USD THOUSAND)
TABLE 1012 REST OF EUROPE POWER TOOLS MARKET, BY TYPE, 2018-2032 (USD THOUSAND)
List of Figure
FIGURE 1 EUROPE POWER TOOLS MARKET: SEGMENTATION
FIGURE 2 EUROPE POWER TOOLS MARKET: DATA TRIANGULATION
FIGURE 3 EUROPE POWER TOOLS MARKET: DROC ANALYSIS
FIGURE 4 EUROPE POWER TOOLS MARKET: REGIONAL VS COUNTRY MARKET ANALYSIS
FIGURE 5 EUROPE POWER TOOLS MARKET: COMPANY RESEARCH ANALYSIS
FIGURE 6 EUROPE POWER TOOLS MARKET: INTERVIEW DEMOGRAPHICS
FIGURE 7 EUROPE POWER TOOLS MARKET: DBMR MARKET POSITION GRID
FIGURE 8 EUROPE POWER TOOLS MARKET: VENDOR SHARE ANALYSIS
FIGURE 9 EUROPE POWER TOOLS MARKET: MARKET APPLICATION COVERAGE GRID
FIGURE 10 EUROPE POWER TOOLS MARKET: SEGMENTATION
FIGURE 11 STRATEGIC DECISIONS
FIGURE 12 THIRTEEN SEGMENTS COMPRISE THE EUROPE POWER TOOLS MARKET, BY TYPE (2024)
FIGURE 13 EXECUTIVE SUMMARY
FIGURE 14 INCREASE IN THE GROWTH OF CORDLESS POWER TOOLS IS THE MAJOR FACTORS BOOSTING THE EUROPE POWER TOOLS MARKET IN THE FORECAST PERIOD OF 2025 TO 2032
FIGURE 15 DRILLING AND FASTENING TOOLS SEGMENT IS EXPECTED TO ACCOUNT FOR THE LARGEST SHARE OF EUROPE POWER TOOLS MARKET IN 2025 & 2032
FIGURE 16 PORTER’S FIVE FORCES ANALYSIS
FIGURE 17 DRIVERS, RESTRAINTS, OPPORTUNITIES AND CHALLENGES OF THE EUROPE POWER TOOLS MARKET
FIGURE 18 EUROPE POWER TOOLS MARKET, BY TYPE, 2024
FIGURE 19 EUROPE POWER TOOLS MARKET, BY MODE OF OPERATION, 2024
FIGURE 20 EUROPE POWER TOOLS MARKET, BY APPLICATION, 2024
FIGURE 21 EUROPE POWER TOOLS MARKET, BY END USER, 2024
FIGURE 22 EUROPE POWER TOOLS MARKET, BY SALES CHANNEL, 2024
FIGURE 23 EUROPE POWER TOOLS MARKET, SNAPSHOT (2024)
FIGURE 24 EUROPE POWER TOOLS MARKET: COMPANY SHARE 2024 (%)
Europe Power Tools Market, Supply Chain Analysis and Ecosystem Framework
To support market growth and help clients navigate the impact of geopolitical shifts, DBMR has integrated in-depth supply chain analysis into its Europe Power Tools Market research reports. This addition empowers clients to respond effectively to global changes affecting their industries. The supply chain analysis section includes detailed insights such as Europe Power Tools Market consumption and production by country, price trend analysis, the impact of tariffs and geopolitical developments, and import and export trends by country and HSN code. It also highlights major suppliers with data on production capacity and company profiles, as well as key importers and exporters. In addition to research, DBMR offers specialized supply chain consulting services backed by over a decade of experience, providing solutions like supplier discovery, supplier risk assessment, price trend analysis, impact evaluation of inflation and trade route changes, and comprehensive market trend analysis.
Data collection and base year analysis are done using data collection modules with large sample sizes. The stage includes obtaining market information or related data through various sources and strategies. It includes examining and planning all the data acquired from the past in advance. It likewise envelops the examination of information inconsistencies seen across different information sources. The market data is analysed and estimated using market statistical and coherent models. Also, market share analysis and key trend analysis are the major success factors in the market report. To know more, please request an analyst call or drop down your inquiry.
The key research methodology used by DBMR research team is data triangulation which involves data mining, analysis of the impact of data variables on the market and primary (industry expert) validation. Data models include Vendor Positioning Grid, Market Time Line Analysis, Market Overview and Guide, Company Positioning Grid, Patent Analysis, Pricing Analysis, Company Market Share Analysis, Standards of Measurement, Global versus Regional and Vendor Share Analysis. To know more about the research methodology, drop in an inquiry to speak to our industry experts.
Data Bridge Market Research is a leader in advanced formative research. We take pride in servicing our existing and new customers with data and analysis that match and suits their goal. The report can be customized to include price trend analysis of target brands understanding the market for additional countries (ask for the list of countries), clinical trial results data, literature review, refurbished market and product base analysis. Market analysis of target competitors can be analyzed from technology-based analysis to market portfolio strategies. We can add as many competitors that you require data about in the format and data style you are looking for. Our team of analysts can also provide you data in crude raw excel files pivot tables (Fact book) or can assist you in creating presentations from the data sets available in the report.


