
Europe Preclinical Imaging Market
Market Size in USD Million
 USD
483.94 Million
USD
765.53 Million
2024
2032
USD
483.94 Million
USD
765.53 Million
2024
2032
| 2025 - 2032 | |
| USD 483.94 Million | |
| USD 765.53 Million | |
| % | |
|
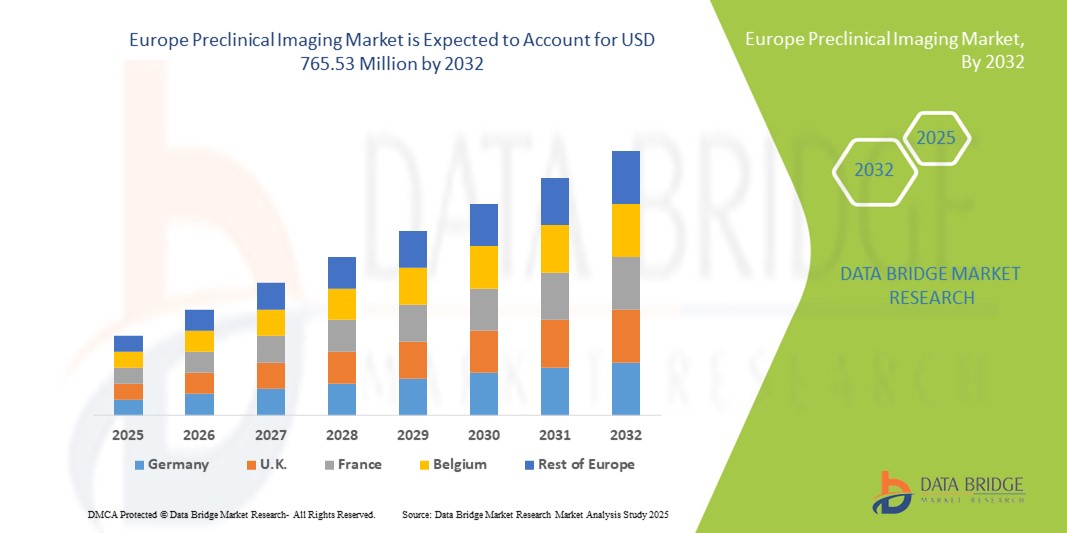
Europe Preclinical Imaging Market Size
- The Europe preclinical imaging market size was valued at USD 483.94 million in 2024 and is expected to reach USD 765.53 million by 2032, at a CAGR of 5.90% during the forecast period
- The market growth is largely fueled by the increasing adoption of advanced imaging technologies in drug discovery and development, supported by technological progress in modalities such as PET, MRI, and optical imaging, leading to greater digitalization and precision in preclinical research
- Furthermore, rising demand for accurate, non-invasive, and high-resolution imaging solutions among pharmaceutical and biotechnology companies is establishing preclinical imaging as a critical tool for evaluating drug efficacy and safety. These converging factors are accelerating the uptake of preclinical imaging solutions, thereby significantly boosting the industry's growth
Europe Preclinical Imaging Market Analysis
- Preclinical imaging, involving non-invasive visualization techniques such as PET, SPECT, MRI, CT, ultrasound, and optical imaging, is a cornerstone of biomedical research, enabling detailed study of disease models, drug development, and therapeutic evaluation across multiple applications
- The increasing demand for preclinical imaging is primarily driven by rising investments in pharmaceutical R&D, growing emphasis on translational research, and the need for advanced tools to evaluate drug safety and efficacy in animal models prior to human trials
- Germany dominated the Europe preclinical imaging market with the largest revenue share of 34.6% in 2024, supported by its advanced research infrastructure, high concentration of pharmaceutical and biotechnology companies, and government-backed funding for life sciences innovation. The country’s strong network of academic research institutions and collaborations with industry leaders further enhance adoption of advanced imaging technologies such as high-resolution MRI and hybrid PET/MRI systems
- France is expected to be the fastest growing country in the Europe preclinical imaging market during the forecast period, registering the highest CAGR of 9.8% from 2025 to 2032, driven by rising government investments in biomedical research, expanding CRO networks, and increasing adoption of multimodal imaging techniques for oncology and neurology research. The growing presence of specialized research centers and the adoption of AI-enabled imaging analysis further accelerate market growth in the country
- The systems segment dominated the market with the largest revenue share of 65.4% in 2024, primarily due to the widespread integration of advanced imaging modalities such as PET, MRI, CT, and optical imaging across research institutions and pharmaceutical companies
Report Scope and Preclinical Imaging Market Segmentation
|
Attributes |
Preclinical Imaging Key Market Insights |
|
Segments Covered |
|
|
Countries Covered |
Europe
|
|
Key Market Players |
|
|
Market Opportunities |
|
|
Value Added Data Infosets |
In addition to the insights on market scenarios such as market value, growth rate, segmentation, geographical coverage, and major players, the market reports curated by the Data Bridge Market Research also include in-depth expert analysis, pricing analysis, brand share analysis, consumer survey, demography analysis, supply chain analysis, value chain analysis, raw material/consumables overview, vendor selection criteria, PESTLE Analysis, Porter Analysis, and regulatory framework. |
Europe Preclinical Imaging Market Trends
Enhanced Advancements Through Multimodal Imaging Integration
- A significant and accelerating trend in the Europe preclinical imaging market is the growing adoption of multimodal imaging platforms, which combine modalities such as PET/MRI, PET/CT, and SPECT/CT to provide complementary structural, functional, and molecular insights within a single workflow. This integration enables more comprehensive and accurate preclinical studies
- For instance, PET/MRI systems allow researchers to capture high-resolution soft tissue images from MRI while simultaneously obtaining metabolic and functional data from PET, making them particularly valuable in oncology and neurology research
- Hybrid imaging platforms in preclinical research are increasingly being used for drug development and translational studies, as they help to correlate biological processes at the molecular level with anatomical details, improving the predictability of therapeutic outcomes
- Multimodal imaging integration also reduces the need for multiple imaging sessions and minimizes the stress on animal models, thereby enhancing ethical compliance and improving study efficiency
- The seamless combination of modalities allows researchers to investigate disease progression and drug efficacy from different perspectives, providing a more holistic understanding of underlying biological mechanisms
- This trend towards integrated multimodal systems is fundamentally reshaping research standards in preclinical imaging. Consequently, key companies such as Bruker, PerkinElmer, and MR Solutions are focusing on developing innovative hybrid platforms with improved sensitivity, resolution, and data analysis capabilities
- The demand for multimodal preclinical imaging solutions is growing rapidly across academic institutions, pharmaceutical companies, and CROs, as stakeholders increasingly prioritize accuracy, efficiency, and translational relevance in preclinical research
Europe Preclinical Imaging Market Dynamics
Driver
Growing Need Due to Rising Demand for Non-Invasive Imaging in Drug Development
- The increasing prevalence of chronic diseases and the rising pipeline of new drug candidates are major drivers fueling the demand for preclinical imaging technologies. Researchers and pharmaceutical companies are heavily relying on these systems to assess disease progression, therapeutic efficacy, and safety in animal models before moving to human trials
- For instance, in March 2023, Bruker launched an advanced preclinical PET/CT imaging solution designed to improve sensitivity and resolution for oncology and neurology research applications. Such innovations by key players are expected to drive the growth of the Preclinical Imaging industry during the forecast period
- As the pharmaceutical and biotechnology sectors expand, the need for accurate and reproducible imaging data in preclinical studies is becoming more critical. Preclinical imaging systems offer unique advantages such as longitudinal monitoring, reduced animal usage, and improved translational relevance compared to conventional techniques
- Furthermore, the growing focus on precision medicine and targeted therapies is increasing the adoption of high-resolution imaging tools like MRI, PET, and optical imaging. These technologies enable researchers to visualize cellular and molecular interactions, providing deeper insights into drug mechanisms
- The convenience of multimodal imaging platforms, which combine structural and functional insights in a single workflow, is propelling their adoption across academic research, CROs, and pharmaceutical companies. The shift towards advanced hybrid systems and the increasing availability of user-friendly preclinical imaging solutions are further contributing to overall market growth
Restraint/Challenge
High Equipment Costs and Limited Accessibility
- One of the major challenges restraining the preclinical imaging market is the high cost of advanced imaging equipment, including PET/MRI and high-field MRI systems. These devices require significant capital investment, along with specialized infrastructure and skilled personnel, which limits adoption among smaller research institutes and labs with budget constraints
- For instance, reports highlight that the cost of hybrid preclinical imaging systems can run into millions of dollars, creating financial barriers for widespread implementation, particularly in developing regions
- Addressing these cost-related challenges through modular system designs, equipment leasing models, and collaborative research initiatives is crucial to broaden accessibility. Companies like PerkinElmer and Bruker are actively working to introduce cost-effective systems while maintaining high accuracy and reproducibility
- In addition, the maintenance requirements and need for regular software and hardware upgrades add to the operational expenses, further discouraging adoption in resource-limited settings
- While industry players are introducing smaller, benchtop, and portable imaging solutions at relatively lower costs, the perception of preclinical imaging as a premium technology still hinders its widespread use. Overcoming these barriers through government funding, academic-industry collaborations, and the development of more affordable imaging systems will be essential for sustained market growth
Europe Preclinical Imaging Market Scope
The market is segmented on the basis of product, reagent, application, and end user.
- By Product
On the basis of product, the Europe preclinical imaging market is segmented into systems and services. The systems segment dominated the market with the largest revenue share of 65.4% in 2024, primarily due to the widespread integration of advanced imaging modalities such as PET, MRI, CT, and optical imaging across research institutions and pharmaceutical companies. These systems are essential for conducting non-invasive, longitudinal studies that allow researchers to monitor disease progression and treatment response over time. Their ability to deliver high-resolution images, combined with multimodal capabilities, makes them indispensable in oncology, neurology, and cardiovascular research. Pharmaceutical companies also depend on preclinical imaging systems for reducing failure rates in clinical trials by gaining deeper insights at the preclinical stage. The continuous technological advancements in hybrid imaging systems, coupled with Europe’s strong R&D ecosystem, further strengthen the dominance of this segment. In addition, significant investments in imaging infrastructure across Germany, France, and the U.K. reinforce its market leadership.
The services segment is expected to register the fastest CAGR of 8.9% from 2025 to 2032, driven by the growing demand for outsourcing complex imaging studies to specialized service providers and CROs. With rising costs and technical challenges associated with operating advanced imaging systems, many pharmaceutical and biotech firms prefer to collaborate with service providers to access cutting-edge technology without heavy capital investment. CROs and academic institutions in Europe are increasingly offering end-to-end preclinical imaging services, including study design, data analysis, and regulatory support. This trend is especially prevalent among small and mid-sized biotech companies that lack in-house infrastructure. The flexibility of tailored services and access to expert imaging professionals further make this segment attractive. Moreover, strategic partnerships between CROs and pharmaceutical companies are accelerating adoption, fueling strong growth potential for this segment in the coming years.
- By Reagent
On the basis of reagent, the Europe preclinical imaging market is segmented into preclinical optical imaging reagents, preclinical nuclear imaging reagents, preclinical MRI contrast agents, preclinical ultrasound contrast agents, and preclinical CT contrast agents. The preclinical optical imaging reagents segment dominated the market with a revenue share of 37.8% in 2024, owing to their widespread application in visualizing molecular and cellular processes with high sensitivity and specificity. Optical reagents, such as bioluminescent and fluorescent probes, are widely used in cancer biology, gene expression analysis, and drug efficacy studies. Their cost-effectiveness and ease of use compared to other imaging agents make them highly accessible for both academic and commercial research institutions. Furthermore, optical reagents enable real-time, non-invasive imaging of living organisms, which significantly enhances research accuracy and efficiency. The broad adoption of optical imaging reagents across Europe, particularly in academic and government-funded projects, solidifies their position as the dominant segment. Continuous innovation in probe development, such as targeted fluorescent markers, further supports their growing utility in preclinical research.
The preclinical nuclear imaging reagents segment is projected to witness the fastest CAGR of 9.7% from 2025 to 2032, supported by the increasing use of PET and SPECT technologies for advanced drug development applications. Nuclear reagents provide quantitative imaging capabilities and deep tissue penetration, making them particularly valuable in oncology, neurology, and metabolic research. The growing use of radiotracers for biodistribution and pharmacokinetics studies offers precise insights into drug performance at early stages. Europe’s strong radiopharmaceutical infrastructure, especially in countries like Germany and France, is accelerating the adoption of nuclear imaging reagents. Furthermore, collaborations between pharmaceutical companies and nuclear medicine research centers are expanding access to innovative radiotracers. The rising demand for personalized medicine and precision oncology research is also boosting the segment’s growth, making it one of the most dynamic areas within the European preclinical imaging market.
- By Application
On the basis of application, the Europe preclinical imaging market is segmented into research and development, drug discovery, bio-distribution, cancer cell detection, bio-markers, and others. The research and development segment held the largest market revenue share of 41.5% in 2024, primarily driven by substantial R&D investments from pharmaceutical, biotechnology, and academic institutions across Europe. Preclinical imaging plays a critical role in understanding disease mechanisms, validating therapeutic targets, and monitoring treatment outcomes at early stages of drug development. Its ability to deliver accurate, non-invasive data in real time makes it indispensable for translational research efforts. The growing focus on precision medicine, combined with Europe’s strong network of academic and government research programs, further strengthens the dominance of this segment. Research institutions in Germany, the U.K., and France are increasingly utilizing advanced imaging systems to improve research productivity and accelerate drug development timelines. The segment’s leadership is also reinforced by funding initiatives from both the EU and national governments that encourage imaging-based R&D.
The drug discovery segment is expected to record the fastest CAGR of 10.3% from 2025 to 2032, fueled by the rising emphasis on accelerating the development of novel therapeutics for cancer, neurological disorders, and rare diseases. Preclinical imaging technologies allow researchers to monitor drug-target interactions, biodistribution, and therapeutic efficacy in living models, significantly reducing the time and cost of drug discovery. The demand for high-throughput and high-resolution imaging solutions is increasing as pharmaceutical companies shift toward biologics and cell-based therapies. European biopharma companies are leveraging imaging to streamline decision-making processes in early-stage drug pipelines. In addition, advancements in multimodal imaging platforms that combine PET, MRI, and optical modalities provide enhanced insights, making them valuable tools for drug discovery. The strong collaboration between industry and academia further accelerates innovation, positioning this segment as the fastest-growing in the region.
- By End User
On the basis of end user, the Europe preclinical imaging market is segmented into contract research organizations (CROs), pharmaceutical & biotech companies, academic & government research institutes, diagnostics centers, and others. The pharmaceutical & biotech companies segment dominated the market with a 44.6% share in 2024, reflecting the sector’s reliance on preclinical imaging technologies to support drug development pipelines. These companies heavily invest in imaging systems to conduct preclinical trials that ensure efficacy, safety, and regulatory compliance. Imaging provides real-time visualization of drug effects, which is vital for developing complex biologics, gene therapies, and precision medicines. The presence of leading pharmaceutical hubs in Germany, Switzerland, and the U.K. further supports the segment’s strength. Moreover, the growing emphasis on plant-based and clean-label excipients in drug formulations is indirectly boosting imaging demand for quality assurance. Pharmaceutical companies are also expanding partnerships with imaging providers and CROs to strengthen R&D efficiency, consolidating their dominant market position.
The contract research organizations (CROs) segment is expected to post the fastest CAGR of 11.2% from 2025 to 2032, as pharmaceutical and biotech companies increasingly outsource preclinical imaging studies to optimize costs and access specialized expertise. CROs provide comprehensive imaging solutions, including study design, multimodal imaging, and advanced data analysis, which are often more cost-effective than building in-house capabilities. This trend is particularly strong among small and mid-sized biotech firms that lack the resources to establish dedicated imaging facilities. In Europe, CROs are expanding their service portfolios by integrating AI-based image analysis and cloud platforms, enhancing efficiency and scalability. Strategic partnerships between CROs and major pharmaceutical players are also creating new growth avenues. As regulatory requirements for preclinical validation grow more stringent, outsourcing imaging services to CROs ensures compliance while reducing timelines, making this segment the fastest-growing end-user category.
Europe Preclinical Imaging Market Regional Analysis
- The Europe preclinical imaging market is projected to expand at a substantial CAGR throughout the forecast period, primarily driven by the increasing demand for advanced imaging technologies in drug discovery and biomedical research
- Rising prevalence of chronic diseases, growth in biologics development, and the need for translational research tools are fostering the adoption of preclinical imaging systems across the region. Europe’s strong base of pharmaceutical companies, coupled with a robust academic and clinical research infrastructure, is supporting the development and use of modalities such as PET, MRI, CT, and optical imaging.
- Furthermore, government-backed funding and collaborative projects between industry and academia are accelerating the integration of high-resolution and multimodal imaging platforms. The region is experiencing strong growth across oncology, neurology, and cardiology research applications, with preclinical imaging being increasingly utilized to improve efficiency, accuracy, and predictability in drug development pipelines
Germany Preclinical Imaging Market Insight
The Germany preclinical imaging market dominated the Europe preclinical imaging market with the largest revenue share of 34.6% in 2024, supported by its advanced research infrastructure, high concentration of pharmaceutical and biotechnology companies, and government-backed funding for life sciences innovation. The country’s strong network of academic research institutions and collaborations with industry leaders further enhance adoption of advanced imaging technologies such as high-resolution MRI and hybrid PET/MRI systems. Demand is particularly strong in oncology and neurology research, where Germany is a leading hub for translational studies. In addition, the presence of Europe imaging equipment manufacturers and increasing investment in AI-driven imaging analytics contribute to its leadership position in the region.
France Preclinical Imaging Market Insight
The France preclinical imaging market is expected to be the fastest growing country in the Europe Preclinical Imaging market during the forecast period, registering the highest CAGR of 9.8% from 2025 to 2032, driven by rising government investments in biomedical research, expanding CRO networks, and increasing adoption of multimodal imaging techniques for oncology and neurology research. The country’s growing presence of specialized research centers, along with active public-private partnerships, is fueling demand for advanced preclinical imaging tools. Furthermore, the adoption of AI-enabled imaging analysis and innovative hybrid platforms is improving efficiency in preclinical studies. These factors, combined with France’s strong emphasis on cutting-edge biomedical innovation, position it as the fastest growing market in Europe.
Europe Preclinical Imaging Market Share
The preclinical imaging industry is primarily led by well-established companies, including:
- PerkinElmer (U.S.)
- FUJIFILM VisualSonics, Inc. (Canada)
- Bruker (U.S.)
- LI-COR, Inc. (U.S.)
- Aspect Imaging Ltd. (Israel)
- Berthold Technologies GmbH & Co. KG (Germany)
- MILabs B.V. (Netherlands)
- Trifoil Imaging LLC (U.S.)
- Mediso Ltd. (Hungary)
- IVIM Technology Inc. (South Korea)
- MR Solutions (U.K.)
- Photon etc. (Canada)
- Siemens Healthineers AG (Germany)
- GE Healthcare (U.K.)
- Koninklijke Philips N.V., (Netherlands)
- CANON MEDICAL SYSTEMS CORPORATION (Japan)
- NIKON CORPORATION (Japan)
- Olympus Corporation (Japan)
- Zeiss Group (Germany)
- Leica Microsystems (Germany)
- Thermo Fisher Scientific Inc. (U.S.)
- Agilent Technologies, Inc. (U.S.)
Latest Developments in Europe Preclinical Imaging Market
- In April 2025, Revvity, Inc. introduced the VivoJect Image-Guided Injection System at the American Association for Cancer Research (AACR) Annual Meeting in Chicago. This system, paired with the Vega automated preclinical ultrasound system, enhances real-time imaging and precise injections for high-throughput in vivo studies. It streamlines workflows in tumor model development, targeted drug delivery, gene therapy, stem cell research, and cardiac studies
- In May 2025, MR Solutions installed the world’s first high-field 7T SPECT/MR tri-modality system at Houston Methodist. This installation underscores ongoing innovation in preclinical imaging, enabling comprehensive imaging capabilities for advanced research applications
- In February 2024, Bruker Corporation acquired Spectral Instruments Imaging LLC, enhancing its product portfolio in the preclinical imaging sector. This acquisition expands Bruker's range of preclinical solutions, particularly in disease research, aligning with the growing demand for advanced imaging technologies
- In July 2024, MILabs upgraded their U-CT system for in vivo imaging of COVID-19 animal models. This upgrade provides ultra-high-resolution, non-invasive lung imaging, enabling precise localization of disease processes in small animals, thereby advancing research in infectious diseases
- In September 2023, Revvity, Inc. expanded its preclinical imaging portfolio by introducing advanced systems such as the IVIS SpectrumCT 2 imaging systems, the Quantum GX3 microCT imaging solution, and the Vega preclinical ultrasound system. These systems enable breakthrough discoveries in preclinical research, offering enhanced imaging capabilities for various applications
SKU-

- Interactive Data Analysis Dashboard
- Company Analysis Dashboard for high growth potential opportunities
- Research Analyst Access for customization & queries
- Competitor Analysis with Interactive dashboard
- Latest News, Updates & Trend analysis
- Harness the Power of Benchmark Analysis for Comprehensive Competitor Tracking
Data collection and base year analysis are done using data collection modules with large sample sizes. The stage includes obtaining market information or related data through various sources and strategies. It includes examining and planning all the data acquired from the past in advance. It likewise envelops the examination of information inconsistencies seen across different information sources. The market data is analysed and estimated using market statistical and coherent models. Also, market share analysis and key trend analysis are the major success factors in the market report. To know more, please request an analyst call or drop down your inquiry.
The key research methodology used by DBMR research team is data triangulation which involves data mining, analysis of the impact of data variables on the market and primary (industry expert) validation. Data models include Vendor Positioning Grid, Market Time Line Analysis, Market Overview and Guide, Company Positioning Grid, Patent Analysis, Pricing Analysis, Company Market Share Analysis, Standards of Measurement, Global versus Regional and Vendor Share Analysis. To know more about the research methodology, drop in an inquiry to speak to our industry experts.
Data Bridge Market Research is a leader in advanced formative research. We take pride in servicing our existing and new customers with data and analysis that match and suits their goal. The report can be customized to include price trend analysis of target brands understanding the market for additional countries (ask for the list of countries), clinical trial results data, literature review, refurbished market and product base analysis. Market analysis of target competitors can be analyzed from technology-based analysis to market portfolio strategies. We can add as many competitors that you require data about in the format and data style you are looking for. Our team of analysts can also provide you data in crude raw excel files pivot tables (Fact book) or can assist you in creating presentations from the data sets available in the report.


