
Europe Q Pcr Reagents Market
Market Size in USD Million
 USD
375.41 Million
USD
576.13 Million
2025
2033
USD
375.41 Million
USD
576.13 Million
2025
2033
| 2026 - 2033 | |
| USD 375.41 Million | |
| USD 576.13 Million | |
| % | |
|
Europe q-PCR Reagents Market Overview
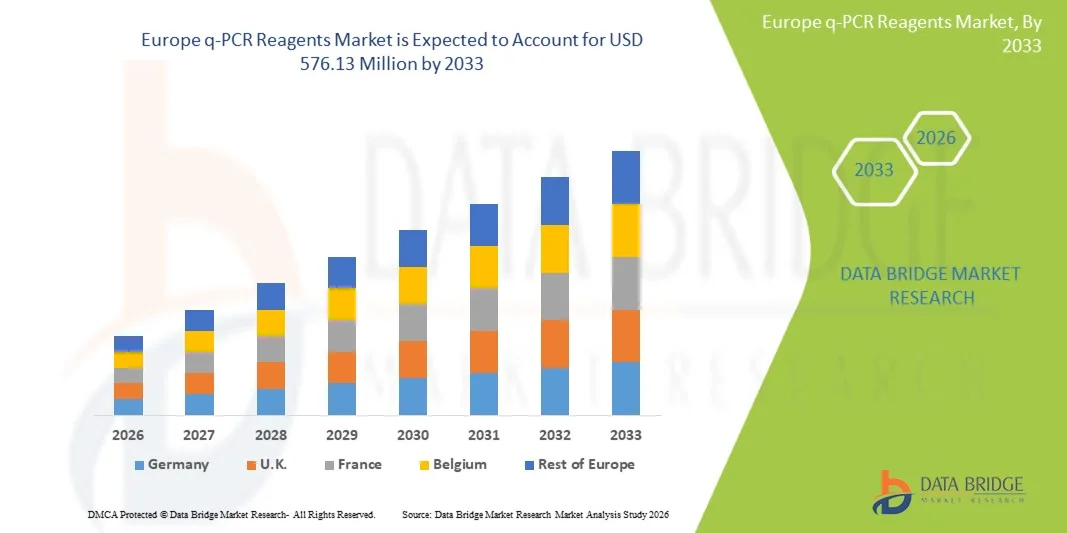
The Europe q-PCR reagents market was valued at USD 375.41 million in 2025 and is projected to reach USD 576.13 million by 2033, growing at a CAGR of 5.5% from 2026 to 2033. The market is witnessing steady expansion driven by increasing adoption of molecular diagnostics, rising prevalence of infectious and chronic diseases, and growing demand for rapid, highly sensitive, and accurate gene expression analysis across clinical and research laboratories.
The market growth is further supported by strong investments in life sciences research, expanding applications in oncology, infectious disease detection, and genetic testing, along with continuous advancements in real-time PCR technologies and reagent formulations. In addition, the increasing emphasis on early disease diagnosis, personalized medicine, and public health preparedness across European healthcare systems is accelerating the adoption of high-performance q-PCR reagents in diagnostic laboratories, academic institutes, and biotechnology companies.
Key Market Trends & Insights
- Germany dominated the Europe q-PCR Reagents market with the largest revenue share of 35.82% in 2025, supported by strong biotechnology and life sciences industry base, extensive network of clinical and diagnostic laboratories, high investment in molecular diagnostics R&D, and the presence of leading pharmaceutical and academic research institutions
- The Probe-Based Reagents segment led the market with a 55.58% share in 2025, driven by higher specificity, improved sensitivity, and strong adoption in clinical diagnostics and infectious disease testing.
- United Kingdom is expected to be the fastest-growing region at a CAGR of 7.3% from 2026 to 2033, fueled by increasing investment in molecular diagnostics, rapid expansion of genomic and precision medicine programs, strong adoption of RT-qPCR in clinical laboratories
- Dye-Based Reagents are the fastest-growing detection type, projected to register a CAGR of 5.4%, reflecting the surge in demand for adoption in cost-sensitive research laboratories and expanding use in preliminary gene expression studies.
- The Qpcr Singleplex Test segment dominated the assay type category with a 52.56% revenue share in 2025, led by high accuracy, simplicity of workflow, and strong adoption in routine diagnostic testing
- Master Mix accounted for 58.61% of the market, preferred by the ease of use, reduced pipetting steps, and high reproducibility in diagnostic workflows
- The miRNA Analysis segment is the fastest-growing technology category, with a CAGR of 7.6%, driven by increasing applications in oncology research, biomarker discovery, and precision medicine.
Market Size & Forecast
- Global Market Value (2025): USD 375.41 Million
- Expected Market Value (2033): USD 576.13 Million
- Forecast CAGR (2026–2033): 5.5%
- Leading Country in 2025: Germany
- Fastest Growing Country: United Kingdom
Report Scope and Europe q-PCR Reagents Market Segmentation
|
Attributes |
Europe q-PCR Reagents Key Market Insights |
|
Segments Covered |
|
|
Countries Covered |
Europe · Germany · France · U.K. · Netherlands · Switzerland · Belgium · Russia · Italy · Spain · Turkey · Rest of Europe |
|
Key Market Players |
· Thermo Fisher Scientific Inc. (U.S.) · Bio-Rad Laboratories, Inc. (U.S.) · QIAGEN (Netherlands) · Takara Bio Inc. (Japan) · Agilent Technologies, Inc. (U.S.) · F. Hoffmann-La Roche Ltd (Switzerland) · Merck KGaA (Germany) · Promega Corporation (U.S.) · Abbott (U.S.) · BD (U.S.) · Seegene Inc. (South Korea) · Bioneer Corporation (South Korea) · MiRXES Pte Ltd (Singapore) · BioMérieux (France) · New England Biolabs, Inc. (U.S.) · Enzo Biochem, Inc. (U.S.) · Sino Biological Inc. (China) · GeneDireX, Inc. (Taiwan) · Norgen Biotek Corp (Canada) · Takara Holdings Inc. (Japan) |
|
Market Opportunities |
· Expansion of precision oncology programs · Growing adoption of decentralized and point-of-care molecular testing · Increasing investment in veterinary and zoonotic disease surveillance |
|
Value Added Data Infosets |
In addition to the insights on market scenarios such as market value, growth rate, segmentation, geographical coverage, and major players, the market reports curated by the Data Bridge Market Research also include in-depth expert analysis, patient epidemiology, pipeline analysis, pricing analysis, and regulatory framework. |
Europe q-PCR Reagents Market Trends
Trend: Expansion of High-Throughput Molecular Diagnostics Adoption
Clinical laboratories across Europe are rapidly shifting toward high-throughput q-PCR reagent workflows to support large-scale infectious disease screening, oncology testing, and genetic disorder analysis with improved speed and accuracy. Automation-friendly reagent kits are being increasingly integrated into diagnostic platforms to reduce manual errors and enhance reproducibility across high-volume testing environments. Hospitals and reference laboratories are also adopting standardized RT-qPCR reagent panels to streamline workflow efficiency and improve turnaround time for critical diagnostic decisions, while digital PCR integration is improving sensitivity in low viral load detection scenarios. For instance, the widespread use of multiplex respiratory virus panels in European hospital networks highlights this transition toward scalable molecular diagnostics ecosystems.
Europe q-PCR Reagents Market Dynamics
Key Market Driver: Rising Demand for Infectious Disease and Oncology Testing
The increasing burden of infectious diseases and cancer cases across Europe is significantly driving the demand for q-PCR reagents used in early detection, monitoring, and treatment response assessment. Government-funded screening programs and expanding hospital laboratory infrastructure are further accelerating adoption of RT-qPCR-based diagnostic assays across both public and private healthcare systems. Pharmaceutical and biotech companies are also integrating q-PCR reagents into clinical trials and biomarker research, enhancing demand across translational research applications. For instance, large-scale COVID-19 surveillance programs across European healthcare systems demonstrated the critical role of q-PCR reagents in rapid and accurate population-level testing.
Key Restraint/Challenge: High Cost of Advanced q-PCR Reagent Workflows
A major restraint in the Europe q-PCR reagents market is the high cost associated with advanced reagent kits, enzyme systems, and automation-compatible consumables required for high-performance molecular diagnostics. Smaller diagnostic laboratories and research institutions often face budget constraints that limit their ability to adopt premium reagent systems and high-throughput platforms. In addition, dependence on cold-chain logistics and stringent storage requirements increases operational costs and complicates supply chain efficiency across multiple European countries. For instance, smaller regional laboratories in Eastern Europe often rely on centralized testing hubs due to the high cost of maintaining fully automated q-PCR reagent workflows.
Key Market Opportunity: Expansion of Digital and Multiplex PCR Technologies
The growing integration of digital PCR and multiplex q-PCR platforms presents a significant opportunity for reagent manufacturers to develop highly sensitive, multi-target detection solutions for complex disease profiling. Increasing adoption of personalized medicine and genomic research is driving demand for reagent kits capable of detecting multiple biomarkers simultaneously with high precision. Strategic collaborations between biotech companies and diagnostic laboratories are further accelerating innovation in reagent chemistry and assay design. For instance, the adoption of multiplex respiratory pathogen panels in national reference laboratories across Europe demonstrates the expanding scope of advanced q-PCR reagent applications.
Europe q-PCR Reagents Market Scope
The Europe q-PCR reagents market is segmented on the basis of detection type, assay type, plexity, packaging type, technology, application, end user, and distribution channel.
- By Detection Type
On the basis of detection type, the Europe q-PCR reagents market is segmented into dye-based reagents and probe-based reagents. The Probe-Based Reagents segment dominated the market with a 55.58% share in 2025, owing to higher specificity, improved sensitivity, and strong adoption in clinical diagnostics and infectious disease testing. These reagents are widely preferred in RT-qPCR workflows due to their ability to reduce non-specific amplification and deliver accurate quantification of target sequences. Increasing use in multiplex assays and regulatory-approved diagnostic kits is further strengthening segment dominance. Hospitals and reference laboratories across Europe rely heavily on probe-based systems for standardized testing protocols. Continuous advancements in fluorescent probe chemistry are improving assay reliability and throughput. However, higher cost compared to dye-based reagents remains a limiting factor for small laboratories. The Dye-Based Reagents segment is widely used in academic and research settings due to its cost-effectiveness and simplicity.
The Dye-Based Reagents segment is expected to witness the fastest growth at a CAGR of 5.4% from 2026 to 2033, driven by increasing adoption in cost-sensitive research laboratories and expanding use in preliminary gene expression studies. These reagents are gaining traction due to their ease of use, lower cost, and compatibility with a wide range of q-PCR instruments. Growing academic research funding across Europe is supporting broader adoption in genomics and molecular biology studies. Continuous improvements in dye chemistry are enhancing specificity and reducing signal variability. Expanding use in early-stage drug discovery and biomarker validation is further boosting demand. Increasing accessibility of q-PCR technologies in emerging European research centers is also contributing to segment growth.
- By Assay Type
On the basis of assay type, the Europe q-PCR reagents market is segmented into Qpcr Singleplex Test/Assay and Qpcr Multiplex Test/Assay. The Qpcr Singleplex Test/Assay segment dominated the market with a 52.56% share in 2025, driven by high accuracy, simplicity of workflow, and strong adoption in routine diagnostic testing. These assays are widely used in clinical laboratories for pathogen detection and gene expression analysis where single-target precision is critical. Regulatory-approved diagnostic protocols across Europe often favor singleplex formats for standardized reporting. Their lower optimization requirements make them suitable for high-throughput clinical environments. Continuous demand from infectious disease testing programs further supports segment dominance. However, limited efficiency in multi-target analysis restricts broader applications in complex diagnostics.
The Qpcr Multiplex Test/Assay segment is expected to register the fastest growth at a CAGR of 6.1% from 2026 to 2033, driven by increasing demand for multi-target detection in infectious diseases, oncology, and genetic disorder screening. These assays enable simultaneous detection of multiple biomarkers, reducing cost and turnaround time. Growing adoption in respiratory pathogen panels and cancer biomarker profiling is significantly accelerating uptake. Advances in reagent chemistry and fluorescence detection systems are improving assay accuracy and scalability. Increasing use in precision medicine and personalized diagnostics is further supporting growth. Rising demand for efficient laboratory workflows is pushing laboratories toward multiplex-based q-PCR solutions.
- By Plexity
On the basis of plexity, the Europe q-PCR reagents market is segmented into simplex and multiplex The Simplex Plexity segment dominated the market with a 54.57% share in 2025, driven by increasing demand for simultaneous detection of multiple genetic targets in clinical and research applications. Multiplexing significantly improves laboratory efficiency by reducing reagent consumption and turnaround time. It is widely used in infectious disease panels, oncology diagnostics, and genetic mutation screening. European diagnostic laboratories are increasingly adopting multiplex workflows to optimize operational costs and improve testing throughput. Continuous innovation in fluorophore chemistry and signal differentiation is enhancing assay performance. However, assay complexity and optimization challenges remain key limitations.
The Multiplex Plexity segment is expected to witness the fastest growth at a CAGR of 6.3% from 2026 to 2033, driven by expanding use in high-throughput diagnostics and personalized medicine applications. Rising demand for comprehensive pathogen detection panels is accelerating adoption across hospitals and reference laboratories. Advances in real-time PCR instrumentation are improving multiplex assay accuracy and scalability. Increasing focus on precision diagnostics in oncology and rare disease detection is further supporting growth. Growing R&D investments in biomarker discovery are also contributing to expansion. Expanding clinical utility across Europe is making multiplex plexity a key growth driver in molecular diagnostics.
- By Packaging Type
On the basis of packaging type, the Europe q-PCR reagents market is segmented into kits and master mixes. The Master Mix segment dominated the market with a 58.61% share in 2025, driven by ease of use, reduced pipetting steps, and high reproducibility in diagnostic workflows. Master mixes are widely preferred in clinical laboratories due to their ability to minimize contamination risk and standardize assay performance. They are extensively used in high-throughput testing environments such as hospital diagnostics and public health laboratories. Increasing automation in q-PCR workflows is further boosting demand for pre-formulated master mixes. Continuous improvements in enzyme stability and buffer systems are enhancing assay efficiency. However, limited customization options compared to full kits may restrict flexibility in research applications.
The Kits segment is expected to witness the fastest growth at a CAGR of 6.0% from 2026 to 2033, driven by rising demand in research applications requiring flexible assay design and customization. Kits offer greater control over reaction components, making them suitable for gene expression studies and experimental workflows. Increasing investment in academic and biotech research across Europe is supporting segment expansion. Growing use in biomarker validation and exploratory diagnostics is further accelerating demand. Continuous product innovation in kit formats is improving usability and performance. Expanding molecular biology research activities in universities and research institutes is contributing significantly to growth.
- By Technology
On the basis of technology, the Europe q-PCR reagents market is segmented into gene expression, gene typing, miRNA analysis, pre-amplification, and virus detection. The Virus Detection segment dominated the market with a 39.42% share in 2025, driven by high testing volumes for respiratory infections, emerging pathogens, and hospital-acquired infections across Europe. q-PCR reagents are widely used in RT-qPCR workflows for rapid and accurate viral load detection, making them a critical tool in clinical diagnostics and public health surveillance systems. Strong laboratory infrastructure and government-funded infectious disease monitoring programs further support dominance. Continuous demand from seasonal influenza, COVID-19 monitoring, and other viral outbreaks reinforces large-scale reagent consumption. Advancements in multiplex viral panels are improving detection efficiency and throughput. However, reliance on routine infectious disease cycles creates moderate demand fluctuations.
The miRNA Analysis segment is expected to witness the fastest growth at a CAGR of 7.6% from 2026 to 2033, driven by increasing applications in oncology research, biomarker discovery, and precision medicine. miRNA-based diagnostics are gaining traction due to their role in gene regulation and disease progression analysis. Growing investment in translational research and cancer genomics across Europe is accelerating adoption of specialized q-PCR reagents. Continuous advancements in sensitive amplification chemistries are improving detection accuracy for low-abundance targets. Expanding use in drug response prediction and personalized therapy development is further supporting growth. Increasing collaboration between biotech firms and academic institutes is also strengthening this segment.
- By Application
On the basis of application, the Europe q-PCR reagents market is segmented into diagnostics, research, and forensic applications. The Diagnostics segment dominated the market with a 61.64% share in 2025, driven by widespread use of q-PCR in infectious disease detection, oncology diagnostics, and genetic disorder screening. Hospital laboratories and diagnostic centers across Europe heavily rely on RT-qPCR reagents for fast, accurate, and high-throughput testing. Strong public healthcare systems and routine screening programs further reinforce dominance. Increasing prevalence of chronic and infectious diseases is boosting demand for molecular diagnostics. Continuous improvements in assay sensitivity and automation are enhancing clinical adoption. However, dependence on regulatory approvals can slow product adoption cycles.
The Research segment is expected to witness the fastest growth at a CAGR of 6.2% from 2026 to 2033, driven by rising investments in genomics, proteomics, and molecular biology studies. Academic and biotech research institutes are increasingly using q-PCR reagents for gene expression profiling and biomarker discovery. Expanding precision medicine initiatives across Europe are further accelerating demand. Continuous funding from government and private organizations is supporting innovation in life sciences research. Advancements in single-cell analysis and gene editing studies are increasing reagent usage. Growing collaboration between universities and pharmaceutical companies is also strengthening this segment.
- By End User
On the basis of end user, the Europe q-PCR reagents market is segmented into hospital & diagnostic centers, forensic laboratories, research & academic institutes, clinical research organizations, and others. The Hospital & Diagnostic Centers segment dominated the market with a 48.52% share in 2025, driven by high patient testing volumes and widespread adoption of RT-qPCR for infectious disease and oncology diagnostics. These facilities rely heavily on standardized reagent kits and master mixes for routine molecular testing workflows. Strong public healthcare infrastructure across Europe further supports segment dominance. Increasing demand for rapid diagnostic turnaround times is accelerating reagent consumption. Automation and high-throughput testing systems are further improving efficiency. However, budget constraints in some healthcare systems can limit adoption of premium reagent solutions.
The Clinical Research Organizations (CROs) segment is expected to witness the fastest growth at a CAGR of 6.5% from 2026 to 2033, driven by increasing outsourcing of clinical trials and biomarker validation studies. CROs extensively use q-PCR reagents for pharmacogenomics, drug development, and companion diagnostics research. Rising pharmaceutical R&D outsourcing in Europe is significantly boosting demand. Expanding precision medicine and oncology trial pipelines are further accelerating adoption. Continuous investment in decentralized clinical trials is increasing reagent usage across distributed laboratory networks. Strong demand for regulatory-compliant molecular testing is also supporting this segment’s growth.
- By Distribution Channel
On the basis of distribution channel, the Europe q-PCR reagents market is segmented into direct tender, third party distributors, and others. The Direct Tender segment dominated the market with a 56.60% share in 2025, driven by large-scale procurement by hospitals, government health agencies, and diagnostic laboratory networks. Bulk purchasing agreements ensure cost efficiency, consistent supply, and standardized reagent quality across testing facilities. Strong public healthcare procurement systems in Europe further reinforce dominance. Direct manufacturer relationships also enable better technical support and customization. Increasing demand for high-volume testing during disease outbreaks strengthens this channel. However, dependence on institutional procurement cycles may create periodic demand fluctuations.
The Third-Party Distributors segment is expected to witness the fastest growth at a CAGR of 6.1% from 2026 to 2033, driven by expanding access to q-PCR reagents in smaller laboratories and emerging research centers. Distributors play a key role in reaching fragmented healthcare and academic markets across different European countries. Growing demand for flexible procurement options is supporting channel expansion. Increasing number of private diagnostic labs is further boosting distributor-led sales. Improved logistics and cold-chain capabilities are enhancing product availability. Strategic partnerships between manufacturers and distributors are also strengthening market penetration.
Europe q-PCR Reagents Market Regional Analysis
Germany dominated the Europe q-PCR Reagents market with the largest revenue share of 35.82% in 2025, supported by strong biotechnology and life sciences industry base, extensive network of clinical and diagnostic laboratories, high investment in molecular diagnostics R&D, and the presence of leading pharmaceutical and academic research institutions. The country also benefits from significant government and private investments in molecular diagnostics, advanced genomics research infrastructure, and widespread adoption of RT-qPCR technologies in infectious disease and oncology testing. Increasing focus on precision medicine, robust academic–industry collaborations, and strong demand for high-throughput diagnostic solutions further strengthen Germany’s leadership position in the regional market.
The Germany q-PCR Reagents Market Insight
Germany dominates the Europe q-PCR reagents market due to its highly advanced biotechnology and pharmaceutical ecosystem, strong diagnostic laboratory network, and continuous investment in life sciences R&D. The country has a well-established base of hospitals, academic institutions, and commercial labs that extensively use RT-qPCR technologies for infectious disease detection, oncology diagnostics, and genetic research. Germany also benefits from strong public–private collaborations that accelerate innovation in molecular testing. Increasing adoption of high-throughput automated q-PCR systems and precision medicine initiatives further strengthens its leadership position in Europe.
United Kingdom q-PCR Reagents Market Insight
The United Kingdom is a major contributor, supported by its strong genomic research infrastructure, NHS-based diagnostic ecosystem, and leadership in precision medicine programs. The country has high adoption of RT-qPCR in clinical diagnostics, particularly for infectious disease surveillance and cancer screening. Strong government-backed research funding and a robust biotech startup environment are driving innovation in assay development. Increasing use of multiplex and digital PCR technologies in hospitals and research institutes is further boosting demand for advanced q-PCR reagents.
France q-PCR Reagents Market Insight
France holds a significant share due to its well-developed public healthcare system and strong government support for biomedical research. The country has a growing focus on infectious disease control, oncology diagnostics, and personalized medicine, all of which rely heavily on q-PCR technologies. Expanding clinical laboratory networks and increasing investment in genomics research are supporting reagent consumption. Collaboration between academic institutions and pharmaceutical companies is also strengthening innovation in molecular diagnostics.
Italy q-PCR Reagents Market Insight
Italy shows steady growth, supported by a robust hospital network and increasing adoption of molecular diagnostics in infectious disease and cancer screening. Government initiatives aimed at strengthening healthcare infrastructure are boosting q-PCR reagent usage. Academic and clinical research institutions are increasingly adopting RT-qPCR technologies for genomic studies. Rising awareness of early disease detection is further supporting market growth. Rising awareness of early disease detection and improving laboratory automation are further supporting market expansion.
Europe q-PCR Reagents Market Share
The Europe q-PCR Reagents industry is primarily led by well-established companies, including:
- Thermo Fisher Scientific Inc. (U.S.)
- Bio-Rad Laboratories, Inc. (U.S.)
- QIAGEN (Netherlands)
- Takara Bio Inc. (Japan)
- Agilent Technologies, Inc. (U.S.)
- Hoffmann-La Roche Ltd (Switzerland)
- Merck KGaA (Germany)
- Promega Corporation (U.S.)
- Abbott (U.S.)
- BD (U.S.)
- Seegene Inc. (South Korea)
- Bioneer Corporation (South Korea)
- MiRXES Pte Ltd (Singapore)
- BioMérieux (France)
- New England Biolabs, Inc. (U.S.)
- Enzo Biochem, Inc. (U.S.)
- Sino Biological Inc. (China)
- GeneDireX, Inc. (Taiwan)
- Norgen Biotek Corp (Canada)
- Takara Holdings Inc. (Japan)
Latest Developments in Europe q-PCR Reagents Market
- In March 2025, Roche announced the expansion of its molecular diagnostics portfolio in Europe, strengthening the availability of high-performance RT-qPCR reagent kits for infectious disease and oncology testing. The development focused on enhancing assay sensitivity and workflow automation across clinical laboratories. This expansion supports increasing demand for high-throughput molecular testing in European healthcare systems and reinforces Roche’s position in precision diagnostics. The upgraded reagent systems are designed to improve turnaround time and diagnostic accuracy in hospital laboratories
- In January 2025, Thermo Fisher Scientific expanded its qPCR reagent manufacturing and distribution capabilities across Europe to meet rising demand from clinical diagnostics and research laboratories. The initiative focused on improving supply chain efficiency for master mixes and probe-based reagent systems used in RT-qPCR workflows. This expansion supports growing applications in infectious disease surveillance and genetic research across European countries. The company also emphasized scalability for high-volume diagnostic testing environments
- In October 2024, QIAGEN announced advancements in its PCR and qPCR reagent portfolio with enhanced assay chemistry designed for faster and more sensitive pathogen detection. The development included improved reagent stability and optimized multiplex testing capabilities for European clinical laboratories. This innovation supports increasing demand for respiratory disease panels and oncology testing workflows. It also strengthens QIAGEN’s presence in molecular diagnostics across Europe
- In June 2023, Bio-Rad Laboratories expanded its real-time PCR reagent offerings in Europe, focusing on improved enzyme systems and master mix formulations for high-precision gene expression analysis. The development aimed to enhance reproducibility and reduce variability in clinical and research applications. This expansion supports growing adoption of qPCR technologies in academic research institutes and pharmaceutical laboratories across Europe. The new formulations also improve compatibility with automated laboratory systems
- In May 2021, the European Centre for Disease Prevention and Control (ECDC) highlighted increased adoption of RT-qPCR testing across European member states for infectious disease surveillance and outbreak management. The report emphasized large-scale deployment of qPCR reagents in national testing networks during post-pandemic monitoring efforts. This development strengthened molecular diagnostic infrastructure across Europe and increased reliance on standardized reagent kits for rapid pathogen detection. It also supported long-term integration of qPCR workflows in public health systems
SKU-

- Interactive Data Analysis Dashboard
- Company Analysis Dashboard for high growth potential opportunities
- Research Analyst Access for customization & queries
- Competitor Analysis with Interactive dashboard
- Latest News, Updates & Trend analysis
- Harness the Power of Benchmark Analysis for Comprehensive Competitor Tracking
Data collection and base year analysis are done using data collection modules with large sample sizes. The stage includes obtaining market information or related data through various sources and strategies. It includes examining and planning all the data acquired from the past in advance. It likewise envelops the examination of information inconsistencies seen across different information sources. The market data is analysed and estimated using market statistical and coherent models. Also, market share analysis and key trend analysis are the major success factors in the market report. To know more, please request an analyst call or drop down your inquiry.
The key research methodology used by DBMR research team is data triangulation which involves data mining, analysis of the impact of data variables on the market and primary (industry expert) validation. Data models include Vendor Positioning Grid, Market Time Line Analysis, Market Overview and Guide, Company Positioning Grid, Patent Analysis, Pricing Analysis, Company Market Share Analysis, Standards of Measurement, Global versus Regional and Vendor Share Analysis. To know more about the research methodology, drop in an inquiry to speak to our industry experts.
Data Bridge Market Research is a leader in advanced formative research. We take pride in servicing our existing and new customers with data and analysis that match and suits their goal. The report can be customized to include price trend analysis of target brands understanding the market for additional countries (ask for the list of countries), clinical trial results data, literature review, refurbished market and product base analysis. Market analysis of target competitors can be analyzed from technology-based analysis to market portfolio strategies. We can add as many competitors that you require data about in the format and data style you are looking for. Our team of analysts can also provide you data in crude raw excel files pivot tables (Fact book) or can assist you in creating presentations from the data sets available in the report.


