
Europe Reverse Logistics Market
Market Size in USD Billion
 USD
33.10 Billion
USD
50.77 Billion
2025
2033
USD
33.10 Billion
USD
50.77 Billion
2025
2033
| 2026 - 2033 | |
| USD 33.10 Billion | |
| USD 50.77 Billion | |
| % | |
|
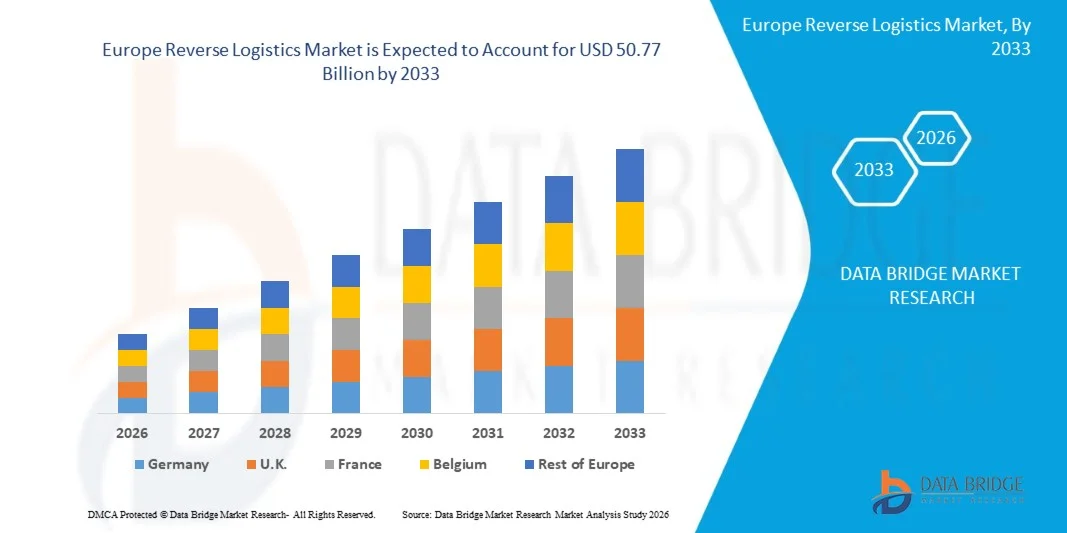
Europe Reverse Logistics Market Size
- The Europe Reverse Logistics Market was valued at USD 33.10 Billion in 2025 and is expected to reach approximately 50.77 Billion by 2033
- During the forecast period of 2025 to 2032, the market is anticipated to grow at a CAGR of 5.6%, primarily fueled by rising awareness of mental health, chronic disease prevention, and the increasing adoption of wellness solutions by employers.
- The Europe Reverse Logistics market focuses on providing end-to-end solutions that optimize the return, repair, remanufacturing, and recycling of products, enhancing supply chain efficiency and sustainability.
Europe Reverse Logistics Market Analysis
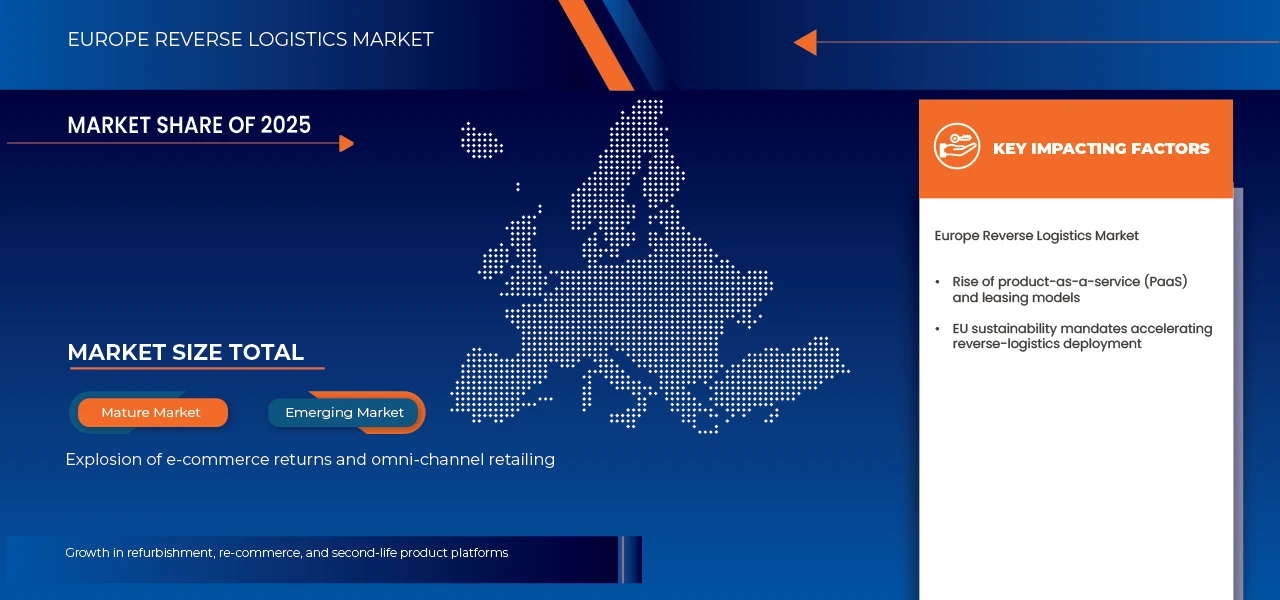
- The Europe reverse logistics market is expanding due to the region’s strong transition toward a circular economy, strict environmental regulations, and high consumer returns driven by e-commerce. Reverse logistics operations—product returns, refurbishment, recycling, and repair—are becoming central to supply-chain strategies as brands aim to reduce waste, recover asset value, and comply with EU sustainability directives.
- Market growth is strongly shaped by EU regulatory frameworks such as the Waste Electrical and Electronic Equipment (WEEE) Directive, Extended Producer Responsibility (EPR), and upcoming Circular Economy Action Plan (CEAP) revisions. These policies mandate manufacturers to manage end-of-life products, increasing demand for structured reverse logistics networks across electronics, automotive, packaging, and consumer goods sectors.
- In 2025, e-commerce returns account for the largest share of reverse logistics activity in Europe, driven by high return rates—often 25–40% in fashion and online retail—and the rapid expansion of cross-border online shopping. Retailers are investing in automated return centers, AI-driven inspection systems, and refurbishment facilities to reduce processing time and recover value from returned goods.
- Within the European reverse logistics ecosystem, recycling & material recovery dominates the market share (≈40%+ in most countries), supported by high demand for recycled materials, growing commitments to carbon neutrality, and rising raw-material costs. The automotive and electronics sectors lead this segment, supported by battery recycling initiatives, vehicle dismantling regulations, and closed-loop manufacturing models adopted by global OEMs.
Report Scope and Reverse Europe Logistics Market Segmentation
|
Attributes |
Europe Liquid Filling Machines Key Market Insights |
|
Segments Covered |
|
|
Countries Covered |
Europe
|
|
Key Market Players |
|
|
Market Opportunities |
|
|
Value Added Data Infosets |
In addition to the insights on market scenarios such as market value, growth rate, segmentation, geographical coverage, and major players, the market reports curated by the Data Bridge Market Research also include innovation tracker and strategic analysis, technological advancements, climate change scenario, supply chain analysis, value chain analysis, vendor selection criteria, PESTLE Analysis, Porter Analysis, patent analysis, industry eco-system analysis, raw material coverage, tariffs and their impact on market, regulation coverage, consumer buying behavior, brand outlook, cost analysis breakdown, and regulatory framework. |
Europe Reverse Logistics Market Trends
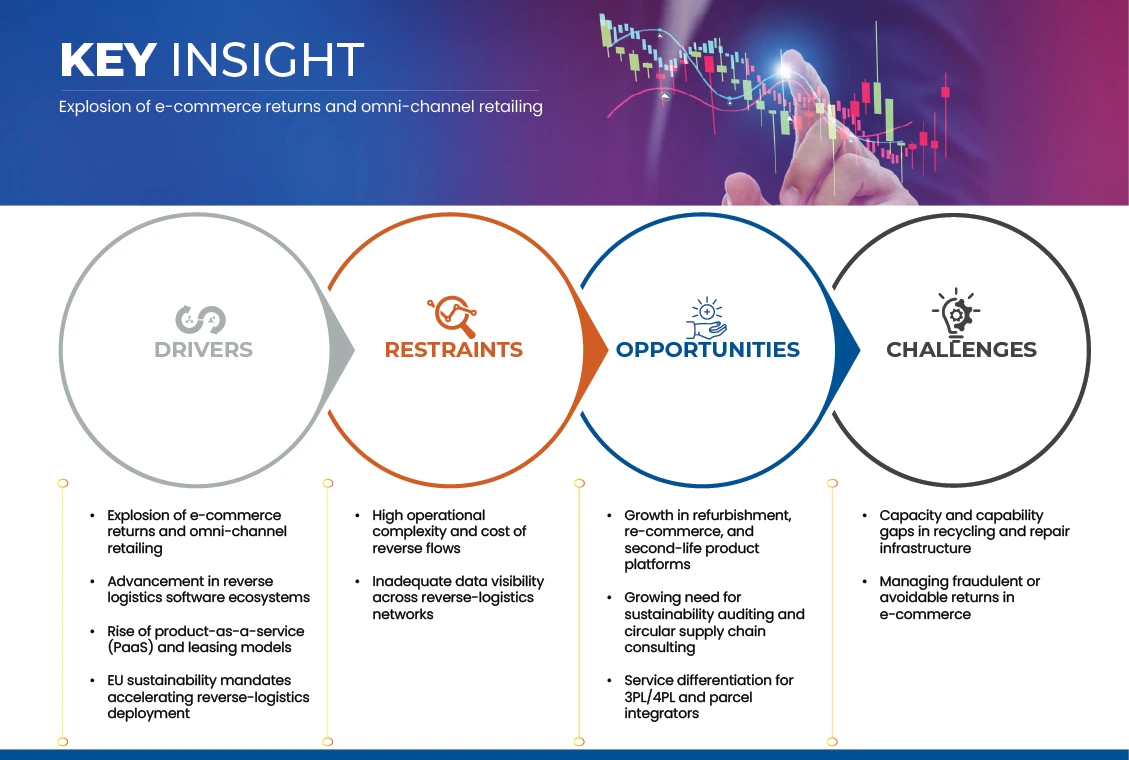
“Growing Need for Sustainability Auditing and Circular Supply Chain Consulting”
- Growing demand for sustainability auditing and circular-supply-chain consulting presents a substantive opportunity for the European reverse-logistics market. As companies are required to trace and report on environmental, social and governance (ESG) impacts across product lifecycles and value chains, they increasingly require third-party audit, advisory and systems-integration support.
- In April 2024, article published on Reutres stated that Corporate Sustainability Due Diligence Directive (CSDDD) was approved by the European Parliament, obliging large companies to audit their supply networks for environmental and human-rights impacts. This regulatory shift opens consulting and audit engagements around reverse-logistics flows, asset retrieval, take-back programmes and material-loop investigations.
- In May 2025, Intereconomics article on policy analysis on EU supply-chain regulation stated that companies will require “robust data-collection, transparency and assurance frameworks” across value chains — implying demand for consulting services that support traceability of returns, refurbishment chains and downstream reuse logistics.
- In August 2025, the public consultation for the upcoming Circular Economy Act was launched by the European Commission, emphasizing increased stakeholder engagement to identify circular-economy bottlenecks and opportunities. This initiative signals demand for expert advisory and software-enabled audit frameworks across reverse-logistics networks.
Europe Reverse Logistics Market Dynamics
Driver
“Explosion of e-commerce returns and omni-channel retailing”
- In October 2022, the Directorate-General for Taxation and Customs Union issued a “Non-paper on the customs formalities related to the return of goods in the context of e-commerce”, noting that, after the 2021 VAT e-commerce changes, administrative obligations for returned goods to non-EU countries had increased and customs and business were experiencing bottlenecks. The document lays out detailed procedures for export declarations, invalidation of import declarations and repayment of duties in the case of distance-sale returns, directly recognizing large-scale e-commerce returns as a distinct operational challenge for EU customs and logistics chains.
- In February 2025, the European Commission adopted and presented the Communication “A Comprehensive EU Toolbox for Safe and Sustainable E-commerce”, accompanied by the news article Tackling challenges with e-commerce imports. The Commission noted that in 2024 around 4.6 billion low-value consignments (worth EUR 150 or less) entered the EU, twice as many as in 2023 and three times as many as in 2022, and that about 70% of Europeans regularly shop online, including on non-EU platforms.
- In January 2022, the European Commission’s Digital Economy and Society Index (DESI) 2022 thematic analysis placed particular emphasis on e-commerce The report confirms that e-commerce adoption by European enterprises has become a core indicator of digital transformation, signaling structurally higher volumes of online orders and, consequently, greater requirements for organized return flows, reverse inventory management and data-driven reverse-logistics planning.
Restraint/Challenge
“High operational complexity and cost of reverse flows”
- In September 2025, an IFA commentary “Returns and Reverse Logistics in Europe – from Cost Burden to Competitive Speed” stated that return operations, strict consumer-rights frameworks and customs procedures “can either drain margin or unlock recovery value”. This highlights that without proper infrastructure, returns act as a cost-drain.
- In July 2025, Landmark Global logistics insight report “High Pressure on Reverse Logistics and Returns Surge in …” described how seasonal spikes in returns, especially in fashion and footwear segments, combine with rising operational costs to create “growing pressure on an already complex part of the supply-chain”.
- In January 2023, MDPI research paper titled “A Framework for Adopting a Sustainable Reverse Logistics …” concluded that many supply chains in developed countries (including Europe) have inadequate resources to implement reverse-logistics solutions and that cost and service-quality shortfalls hinder sustainable returns flows.
- In January 2025, the article “Reverse Logistics: Solving Europe’s Return Management Problem” noted that studies show approximately 30 % of online purchases in Europe are returned (versus much lower in physical stores) and that this high volume creates a “logistical nightmare” for companies managing reverse flows.
Opportunity
Growth in refurbishment, re-commerce, and second-life product platforms
The growing demand for automated and aseptic filling solutions in emerging markets represents a significant opportunity for the global liquid filling machines industry. Rising consumer awareness of hygiene and safety, coupled with increasing consumption of beverages, dairy products, and pharmaceuticals, is compelling manufacturers to adopt advanced filling technologies that ensure sterility and minimize contamination risks. Automated and aseptic systems enhance production efficiency, minimize human intervention, and facilitate compliance with stringent regulatory standards.
- In January 2023, the Dutch government published “Reverse logistics for reusable packaging” which explores how shifting from single-use to reusable systems (pooling, returnable crates) in the Netherlands necessitates reverse-logistics networks and aligns with broader second-life and reuse platforms.
- In November 2024, Vanderlande announced the reopening of its Reverse Logistics Centre in Veghel (The Netherlands) explicitly to “drive reuse, remanufacturing and recycling” of returned materials — signalling corporate investment in reverse-logistics infrastructure to support second-life platforms.
- In March 2023, the European Commission Impact Assessment supporting the new repair and reuse legislative framework noted that “reuse by refurbishment … its potential is not sufficiently exploited” and called for policy support of refurbishment and second-life market platforms to unlock value from returns.
Europe Reverse Logistics Market Scope
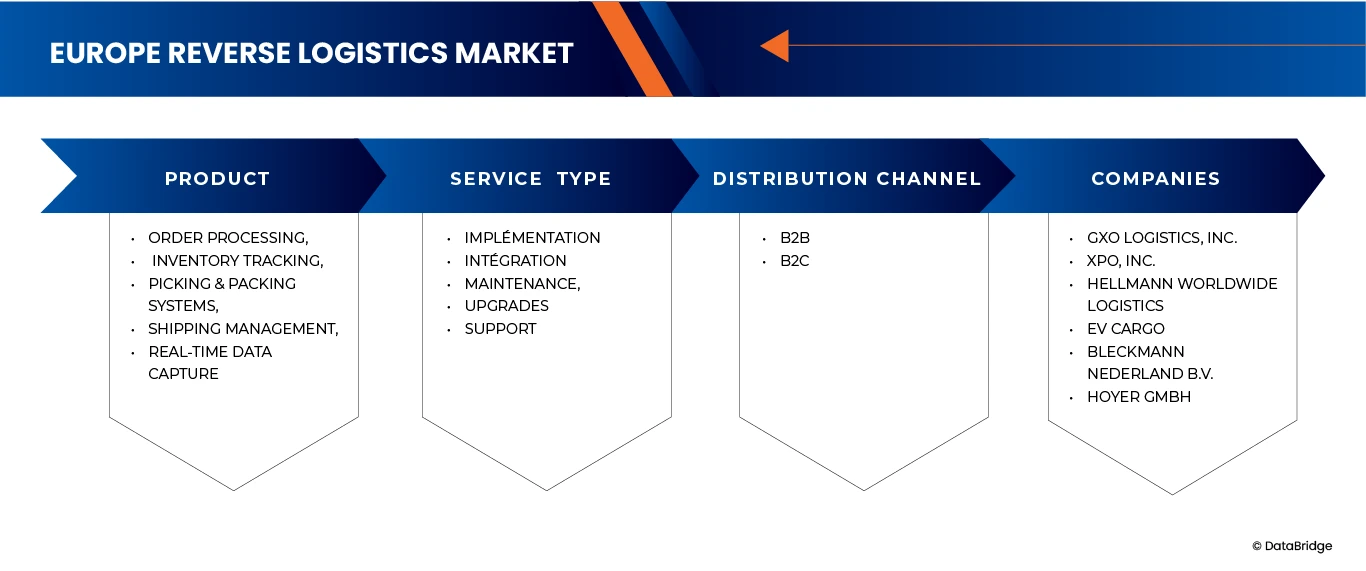
The Europe Reverse Logistics Market is segmented into three notable segments based on the product type, Service Type and Distribution Channel.
• By Product Type
On the basis of product type, Europe Reverse Logistics market has been segmented into Semiconductor & Electronics Equipment, Automotive Components & EV Charging Equipment, Medical & Healthcare Equipment, Industrial Power Supplies, Automation & Robotics Equipment. In 2026, Semiconductor & Electronics Equipment segment is expected to dominate the Europe Reverse Logistics market with 29.24%market share and is expected to reach USD 14,180,222.38 thousand by 2033, growing with the CAGR 4.9% due to the rising volume of electronic goods returns, rapid technology upgrades, and increasing regulatory pressure for responsible e-waste management. The segment benefits from high return cycles, component recovery opportunities, and strong demand for refurbishment and recycling of electronic devices across Europe.
• By Service Type
On the basis of Service Type, Europe Reverse Logistics market is segmented into Collection, Recycling, Refurbishment, Resale. In 2026, Collection segment is expected to dominate the Europe Reverse Logistics market with 35.85% market share and is expected to reach USD 17,402,815.14 thousand by 2033, growing with the CAGR of 4.9% due to the increasing need for efficient retrieval of returned, damaged, or end-of-life products. Expanding e-commerce activity, rising product recalls, and stricter EU waste-management regulations are driving investments in organized collection networks, enabling faster, cost-efficient reverse flows across industries.
- By Distribution Channel
On the basis of distribution channel, Europe Reverse Logistics market is segmented into B2B and B2C. In 2026, B2B segment is expected to dominate the Europe Reverse Logistics market with 81.73%market share and is expected to reach USD 41,359,939.65 thousand by 2033, growing with the CAGR of 5.5% due to due to the high volume of industrial returns, component recovery programs, and contractual reverse logistics services between manufacturers, distributors, and service providers. Businesses increasingly rely on structured return flows, refurbishment partnerships, and asset recovery systems to reduce waste, reclaim value, and meet sustainability targets across the supply chain.
Europe Reverse Logistics Market Regional Analysis
- Europe holds a significant position in the Europe Reverse Logistics Market, driven by its strong regulatory framework, mature recycling ecosystem, and high returns volume generated by sectors such as electronics, automotive, retail, and healthcare.
- The region benefits from well-established collection and processing infrastructure, rising investments in circular economy initiatives, and stringent EU directives that mandate responsible waste management, product take-back schemes, and sustainable end-of-life handling.
- Growing consumer awareness, rapid e-commerce expansion, and increasing product return rates in categories like apparel, electronics, and packaged goods are further accelerating market growth across Europe.
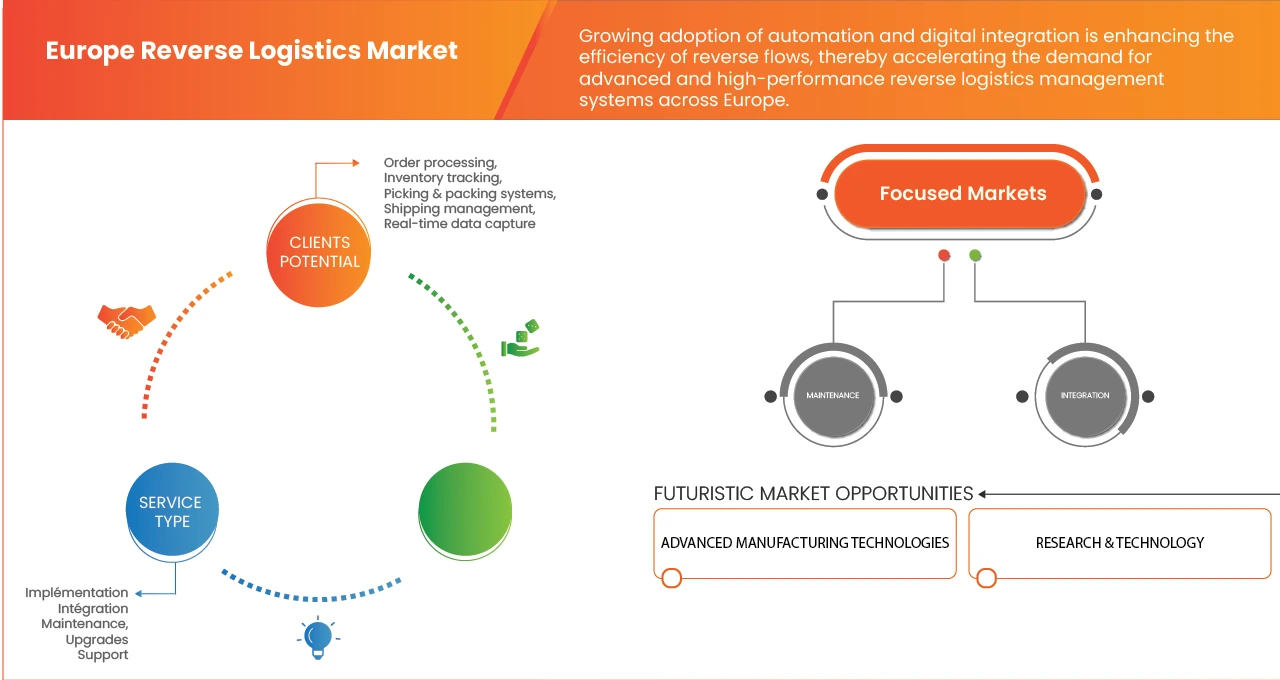
- European companies are increasingly adopting automated sorting systems, digital tracking platforms, and IoT-enabled reverse logistics solutions to improve traceability, enhance recovery value, and optimize reverse supply chain efficiency.
- Moreover, the strong focus on carbon reduction, resource optimization, and energy-efficient recycling operations aligns with Europe’s sustainability goals, encouraging manufacturers and logistics providers to implement greener, technology-driven reverse logistics practices.
Germany Reverse Logistics Market Insight
Germany has remained the largest market due to strong e-commerce penetration and strict recycling policies. High return rates in fashion and electronics have encouraged companies to invest in dedicated reverse logistics centres. For example, large online retailers have been operating automated return hubs in northern Germany where AI is used to categorize items for resale, refurbishment, or recycling.
German companies are heavily investing in automated sorting technologies, AI-enabled inspection systems, and digital track-and-trace platforms to enhance speed, accuracy, and transparency across reverse logistics processes.
The shift toward sustainable material recovery, strict compliance with EU directives such as WEEE, ELV, and packaging waste regulations, and continuous R&D in robotics and automation are further accelerating market sophistication. Major domestic and global players operating in Germany are actively expanding capabilities in component recovery, e-waste processing, and value-added refurbishment to support closed-loop supply chains and improve resource efficiency.
U.K Reverse Logistics Market Insight
The U.K. has experienced significant reverse logistics growth driven by high-volume online shopping and generous return policies. Apparel returns account for a large share of reverse flows, and multiple retailers have partnered with third-party operators to handle consolidation, grading, and refund processing. Logistics clusters in the Midlands have become key return-processing hubs.
Companies in the U.K. are prioritizing digitalization, automation, and flexible return-handling models to manage unpredictable return flows efficiently. The growing push for sustainability has accelerated investments in recycling infrastructure, warehouse automation, and eco-friendly product recovery practices.
Government-led initiatives promoting circular economy models and carbon-reduction commitments are encouraging enterprises to deploy advanced reverse logistics platforms, including smart monitoring tools, data-driven optimization systems, and predictive maintenance technologies. Leading industry participants in the U.K. are leveraging robotics, real-time analytics, and cloud-based return management systems to improve operational productivity and reduce handling costs.
Europe Reverse Logistics Market Share
The competitive landscape of the Europe Reverse Logistics Market provides detailed insights into key industry participants operating across the region. The information includes company overview, regional and global presence, financial performance, revenue contribution from reverse logistics operations, market potential, investments in recycling and refurbishment infrastructure, and new initiatives aimed at strengthening circular economy practices.
The Major Market Leaders Operating in the Market Are:
- DB Schenker (Germany)
- DHL Supply Chain / Deutsche Post DHL (Germany)
- Kuehne + Nagel (Switzerland)
- GEODIS (France
- Rhenus Logistics SE & Co. KG (Germany)
- LOGISTEED, Ltd. (Japan)
- XPO, Inc. (U.S.)
- GXO Logistics, Inc. (U.S.)
- United Parcel Service of America, Inc. (U.S.)
- Hellmann Worldwide Logistics (Germany)
- HOYER GmbH (Germany)
- Bleckmann Nederland B.V. (Netherlands)
- Asapreverse (Netherlands)
- Ambrogio Trasporti S.P.A. (Italy)
- Moduslink Corporation (U.S.)
- EV Cargo (U.K.)
- Reverse Logistics Group (RLG) (Germany)
- Nordlogway (Germany)
- Interzero (Germany)
- Taracell AG (Switzerland)
Latest Developments in Europe Reverse Logistics Market
- In October, UPS announced that it would acquire Happy Returns, a company known for its software-driven, hassle-free return system that lets customers make box-free, label-free returns at designated drop-off points. By bringing Happy Returns into its operations, UPS plans to significantly expand this convenient return network to over 12,000 locations, using both its own small-package logistics infrastructure and the extensive UPS Store network. The move strengthens UPS’s position in reverse logistics, making returns easier for consumers and more efficient for retailers.
- In January, Ambrogio Intermodal made a significant investment in its ordered 650 swap bodies and container chassis from Kässbohrer. It is depending heavily on a fleet that can handle diverse cargo types, including end-of-life materials and waste, in a cost-efficient and sustainable way. The lighter vehicles mean more cargo per trip, which reduces the number of trips required and thereby lowers emissions per unit transported.
- In October, Hellmann and SkyNet partnership covers returns management as part of their end‑to‑end cross‑border e‑commerce solution. Returns management is a core function of reverse logistics it involves handling goods coming back from customers, processing them (e.g., grading, repackaging, refunding duties), and integrating them back into the supply chain. Hellmann even provides a white‑label returns portal and supports duty refund (“Duty Drawback”) for returned items.
- November 2024, H&M selected Bleckmann to support the online launch of its Pre‑Loved Archive collection. Bleckmann carried out a renewal process grading, cleaning, invisible mending, inventory management, and product photography for used/pre‑loved garments at its Almelo DC. This restoration of second‑life items and preparing them for resale is a core reverse‑logistics activity. Bleckmann also used serialised SKUs to track each item’s repair history and status, giving transparency and control over the reverse-flowed inventory.
- In January, DHL Supply Chain acquired Inmar Supply Chain Solutions, adding 14 return centers and ~800 staff to become the largest provider of reverse logistics in North America.
SKU-

- Interactive Data Analysis Dashboard
- Company Analysis Dashboard for high growth potential opportunities
- Research Analyst Access for customization & queries
- Competitor Analysis with Interactive dashboard
- Latest News, Updates & Trend analysis
- Harness the Power of Benchmark Analysis for Comprehensive Competitor Tracking
Table of Content
1 INTRODUCTION
1.1 OBJECTIVES OF THE STUDY
1.2 MARKET DEFINITION
1.3 OVERVIEW
1.4 MARKETS COVERED
2 MARKET SEGMENTATION
2.1 MARKETS COVERED
2.2 GEOGRAPHICAL SCOPE
2.3 YEARS CONSIDERED FOR THE STUDY
2.4 CURRENCY AND PRICING
2.5 DBMR TRIPOD DATA VALIDATION MODEL
2.6 PRIMARY INTERVIEWS WITH KEY OPINION LEADERS
2.7 SECONDARY SOURCES
2.8 ASSUMPTIONS
3 EXECUTIVE SUMMARY
3.1 TREND ANALYSIS
3.1.1 BY PRODUCT
3.1.1.1 INDUSTRIAL POWER SUPPLIES
3.1.1.2 AUTOMATION & ROBOTICS EQUIPMENT
3.1.1.3 SEMICONDUCTOR & ELECTRONICS EQUIPMENT
3.1.1.4 MEDICAL & HEALTHCARE EQUIPMENT
3.1.1.5 AUTOMOTIVE COMPONENTS & EV CHARGING EQUIPMENT
3.1.2 BY SERVICE TYPE
3.1.2.1 COLLECTION
3.1.2.2 REFURBISHMENT
3.1.2.3 RECYCLING
3.1.2.4 RESALE
3.1.3 BY DISTRIBUTION CHANNEL
3.1.3.1 B2B
3.1.3.2 B2C
3.1.4 BY REGION
3.1.4.1 GERMANY
3.1.4.2 FRANCE
3.1.4.3 U.K.
3.1.4.4 POLAND
3.1.4.5 ITALY
3.1.4.6 SPAIN
3.1.4.7 RUSSIA
3.1.4.8 TURKEY
3.1.4.9 NETHERLANDS
3.1.4.10 SWITZERLAND
3.1.4.11 REST OF EUROPE
4 PREMIUM INSIGHTS
4.1 PORTER’S FIVE FORCES
4.2 LIST OF KEY CONSUMERS IN THE EUROPE REVERSE LOGISTICS MARKET
4.2.1 ANALYST RECOMMENDATION – EUROPE REVERSE LOGISTICS MARKET
4.2.2 TRANSFORM REVERSE LOGISTICS INTO A VALUE-CREATION FUNCTION
4.2.3 INVEST IN DIGITAL VISIBILITY AND DATA-DRIVEN RETURNS MANAGEMENT
4.2.4 REIMAGINE RETURN POLICIES FOR PROFITABILITY AND LOYALTY
4.2.5 ALIGN WITH EU CIRCULAR ECONOMY DIRECTIVES AND REGULATORY COMPLIANCE
4.2.6 ACCELERATE GREEN REVERSE LOGISTICS AND LOW-CARBON RETURN NETWORKS
4.2.7 FORGE STRATEGIC ALLIANCES FOR SCALE AND SPECIALIZATION
4.2.8 STRATEGIC OUTLOOK
4.3 GO-TO-MARKET (GTM) STRATEGY
4.3.1 GO-TO-MARKET (GTM) STRATEGY MODEL
4.3.2 PENETRATION (NEW PRODUCT → NEW CONSUMER)
4.3.3 EXPANSION (NEW PRODUCT → EXISTING CONSUMER)
4.3.4 INNOVATION (EXISTING PRODUCT → NEW CONSUMER)
4.3.5 AGGRESSION (NEW PRODUCT → NEW CONSUMER)
4.4 COMPANY EVALUATION QUADRANT
4.5 CUSTOMERS OF REFURBISHED GOODS
4.5.1 B2C CONSUMER SEGMENTS
4.5.1.1 ECO-DRIVEN MILLENNIALS AND GENERATION Z
4.5.2 PRICE-CONSCIOUS FAMILIES SEEKING AFFORDABLE OPTIONS
4.5.2.1 FASHION-CONSCIOUS BARGAIN HUNTERS AND LUXURY RESALE CONSUMERS
4.5.3 B2B CUSTOMER SEGMENTS
4.5.3.1 WHOLESALERS PURCHASING BULK LOTS
4.5.3.2 CORPORATE BUYERS SOURCING REFURBISHED IT EQUIPMENT
4.5.3.3 RETAILERS OFFERING PRE-OWNED PRODUCT CATEGORIES
4.5.4 EXPORT BUYERS FROM AFRICA, THE MIDDLE EAST, AND EASTERN EUROPE
4.6 DEMAND & SUPPLY DRIVERS
4.6.1 GERMANY
4.6.2 FRANCE
4.6.3 UNITED KINGDOM (UK)
4.6.4 OTHERS
4.6.5 END-TO-END RETURNS MANAGEMENT PROCESS
4.6.6 STEP 1: SOURCES OF RETURNED GOODS
4.6.7 STEP 2: COLLECTION AND AGGREGATION
4.6.8 STEP 3: INSPECTION & SORTING
4.6.9 STEP 4: REFURBISHMENT AND REPAIR
4.6.10 STEP 5: REDISTRIBUTION
4.6.11 STEP 6: END CONSUMER
4.6.12 CONCLUSION
4.7 GEOGRAPHICAL FOOTPRINT
4.7.1 DOMESTIC EUROPEAN MARKETS
4.7.2 INTERNATIONAL EXPORT ROUTES
4.7.3 ROLE OF ONLINE PLATFORM IN DISTRIBUTION
4.8 MARKET ENTRY STRATEGIES
4.8.1 PARTNERSHIP-LED ENTRY WITH RETAILERS, OEMS & 3PLS–
4.8.2 BUILD A CENTRALIZED REFURBISHMENT & VALUE-RECOVERY HUB –
4.8.3 TECHNOLOGY-LED DIFFERENTIATION (AI-BASED REVERSE LOGISTICS PLATFORM)–
4.8.4 REGULATORY-LED ENTRY (COMPLIANCE-AS-A-SERVICE)–
4.8.5 SECONDARY MARKETPLACE & VALUE-RECOVERY INTEGRATION–
4.8.6 CONCLUSION
4.9 EUROPE REVERSE LOGISTICS MARKET: INDUSTRY CONTEXT AND EVOLUTION
4.9.1 INTRODUCTION:
4.9.2 REGULATORY ALIGNMENT WITH THE CIRCULAR ECONOMY FRAMEWORK
4.9.3 GROWTH OF RECOMMERCE AND CHANGING CONSUMER PERCEPTIONS
4.9.4 KEY MARKET DRIVERS
4.9.4.1 RISING E-COMMERCE RETURN VOLUMES
4.9.4.2 SUSTAINABILITY AND CARBON-NEUTRAL COMMITMENTS
4.9.4.3 EVOLVING CONSUMER ACCEPTANCE OF PRE-OWNED AND REFURBISHED GOODS
4.9.4.4 STRENGTHENING REGULATORY AND COMPLIANCE REQUIREMENTS
4.9.4.5 ECONOMIC INCENTIVES AND COST RECOVERY OPPORTUNITIES
4.9.5 REGIONAL DYNAMICS AND MAJOR MARKETS
4.9.6 CONCLUSION
4.1 INDUSTRY DYNAMICS — EUROPE REVERSE LOGISTICS MARKET
4.10.1 OVERVIEW
4.10.2 REGULATORY LANDSCAPE
4.10.3 STRUCTURAL AND OPERATIONAL DYNAMICS
4.10.4 REVERSE FLOWS TYPICALLY INCLUDE:
4.10.5 TECHNOLOGY AND DIGITALIZATION
4.10.6 COUNTRY-LEVEL DYNAMICS
4.10.7 CONCLUSION
4.11 ROI
4.12 VALUE CHAIN ANALYSIS
4.12.1 END CONSUMER (RETURN INITIATION):
4.12.2 RETURN SHIPPING
4.12.3 RETURN PROCESSED
4.12.4 MOVEMENT TO DISPOSITION
4.12.5 RECYCLE / REFURB
4.12.6 RESALE
4.12.7 END CONSUMER
4.12.8 CONCLUSION
4.13 TECHNOLOGICAL TRENDS — EUROPE REVERSE LOGISTICS MARKET
5 REGULATORY STANDARDS AND FRAMEWORK
5.1 GERMANY
5.2 FRANCE
5.3 SPAIN
5.4 ITALY
5.5 UNITED KINGDOM (UK)
6 MARKET OVERVIEW
6.1 DRIVER
6.1.1 EXPLOSION OF E-COMMERCE RETURNS AND OMNI-CHANNEL RETAILING
6.1.2 ADVANCEMENT IN REVERSE LOGISTICS SOFTWARE ECOSYSTEMS
6.1.3 RISE OF PRODUCT-AS-A-SERVICE (PAAS) AND LEASING MODELS
6.1.4 EU SUSTAINABILITY MANDATES ACCELERATING REVERSE-LOGISTICS DEPLOYMENT
6.2 RESTRAINT
6.2.1 HIGH OPERATIONAL COMPLEXITY AND COST OF REVERSE FLOWS
6.2.2 INADEQUATE DATA VISIBILITY ACROSS REVERSE-LOGISTICS NETWORKS
6.3 OPPORTUNITIES
6.3.1 GROWTH IN REFURBISHMENT, RE-COMMERCE, AND SECOND-LIFE PRODUCT PLATFORMS
6.3.2 GROWING NEED FOR SUSTAINABILITY AUDITING AND CIRCULAR SUPPLY CHAIN CONSULTING
6.3.3 SERVICE DIFFERENTIATION FOR 3PL/4PL AND PARCEL INTEGRATORS
6.4 CHALLENGES
6.4.1 CAPACITY AND CAPABILITY GAPS IN RECYCLING AND REPAIR INFRASTRUCTURE
6.4.2 MANAGING FRAUDULENT OR AVOIDABLE RETURNS IN E-COMMERCE
7 EUROPE REVERSE LOGISTICS MARKET, BY PRODUCT TYPE
7.1 OVERVIEW
7.2 SEMICONDUCTOR & ELECTRONICS EQUIPMENT
7.3 AUTOMOTIVE COMPONENTS & EV CHARGING EQUIPMENT
7.4 MEDICAL & HEALTHCARE EQUIPMENT
7.5 INDUSTRIAL POWER SUPPLIES
7.6 AUTOMATION & ROBOTICS EQUIPMENT
8 EUROPE REVERSE LOGISTICS MARKET, BY SERVICE TYPE
8.1 OVERVIEW
8.2 COLLECTION
8.3 RECYCLING
8.4 REFURBISHMENT
8.5 RESALE
9 EUROPE REVERSE LOGISTICS MARKET, BY DISTRIBUTION CHANNEL
9.1 OVERVIEW
9.2 B2B
9.3 B2C
10 EUROPE REVERSE LOGISTICS MARKET, BY COUNTRY
10.1 OVERVIEW
10.2 EUROPE
10.2.1 GERMANY
10.2.2 U.K.
10.2.3 FRANCE
10.2.4 ITALY
10.2.5 SPAIN
10.2.6 RUSSIA
10.2.7 NETHERLANDS
10.2.8 POLAND
10.2.9 TURKEY
10.2.10 SWITZERLAND
10.2.11 REST OF EUROPE
11 EUROPE REVERSE LOGISTICS MARKET: COMPANY LANDSCAPE
11.1 COMPANY SHARE ANALYSIS: EUROPE
12 SWOT ANALYSIS
13 COMPANY PROFILES
13.1 ASAPREVERSE
13.1.1 COMPANY SNAPSHOT
13.1.2 PRODUCT PORTFOLIO
13.1.3 RECENT DEVELOPMENTS
13.2 AMBROGIO TRASPORTI S.P.A.
13.2.1 COMPANY SNAPSHOT
13.2.2 PRODUCT PORTFOLIO
13.2.3 RECENT DEVELOPMENT
13.3 BLECKMANN NEDERLAND BV
13.3.1 COMPANY SNAPSHOT
13.3.2 PRODUCT PORTFOLIO
13.3.3 RECENT DEVELOPMENT
13.4 DHL
13.4.1 COMPANY SNAPSHOT
13.4.2 REVENUE ANALYSIS
13.4.3 PRODUCT PORTFOLIO
13.4.4 RECENT DEVELOPMENT
13.5 DB SCHENKER
13.5.1 COMPANY SNAPSHOT
13.5.2 PRODUCT PORTFOLIO
13.5.3 RECENT DEVELOPMENT
13.6 EV CARGO
13.6.1 COMPANY SNAPSHOT
13.6.2 PRODUCT PORTFOLIO
13.6.3 RECENT DEVELOPMENT
13.7 GEODIS.
13.7.1 COMPANY SNAPSHOT
13.7.2 PRODUCT PORTFOLIO
13.7.3 RECENT DEVELOPMENT
13.8 GXO LOGISTICS, INC
13.8.1 COMPANY SNAPSHOT
13.8.2 REVENUE ANALYSIS
13.8.3 PRODUCT PORTFOLIO
13.8.4 RECENT DEVELOPMENT
13.9 HOYER GMBH
13.9.1 COMPANY SNAPSHOT
13.9.2 PRODUCT PORTFOLIO
13.9.3 RECENT DEVELOPMENT
13.1 HELLMANN WORLDWIDE LOGISTICS
13.10.1 COMPANY SNAPSHOT
13.10.2 PRODUCT PORTFOLIO
13.10.3 RECENT DEVELOPMENT
13.11 INTERZERO.
13.11.1 COMPANY SNAPSHOT
13.11.2 PRODUCT PORTFOLIO
13.11.3 RECENT DEVELOPMENT
13.12 KUEHNE+NAGEL
13.12.1 COMPANY SNAPSHOT
13.12.2 REVENUE ANALYSIS
13.12.3 PRODUCT PORTFOLIO
13.12.4 RECENT DEVELOPMENT
13.13 LOGISTEED, LTD
13.13.1 COMPANY SNAPSHOT
13.13.2 PRODUCT PORTFOLIO
13.13.3 RECENT DEVELOPMENT
13.14 MODUSLINK CORPORATION (SUBSIDIARY OF STEEL PARTNERS HOLDINGS L.P.)
13.14.1 COMPANY SNAPSHOT
13.14.2 PRODUCT PORTFOLIO
13.14.3 RECENT DEVELOPMENT
13.15 NORDLOGWAY, S.L
13.15.1 COMPANY SNAPSHOT
13.15.2 PRODUCT PORTFOLIO
13.15.3 RECENT DEVELOPMENT
13.16 RHENUS LOGISTICS SE & CO..
13.16.1 COMPANY SNAPSHOT
13.16.2 PRODUCT PORTFOLIO
13.16.3 RECENT DEVELOPMENT
13.17 RLG.
13.17.1 COMPANY SNAPSHOT
13.17.2 PRODUCT PORTFOLIO
13.17.3 RECENT DEVELOPMENT
13.18 TARACELL AG
13.18.1 COMPANY SNAPSHOT
13.18.2 PRODUCT PORTFOLIO
13.18.3 RECENT DEVELOPMENTS
13.19 UNITED PARCEL SERVICE OF AMERICA, INC.
13.19.1 COMPANY SNAPSHOT
13.19.2 REVENUE ANALYSIS
13.19.3 PRODUCT PORTFOLIO
13.19.4 RECENT DEVELOPMENT
13.2 XPO, INC.
13.20.1 COMPANY SNAPSHOT
13.20.2 REVENUE ANALYSIS
13.20.3 PRODUCT PORTFOLIO
13.20.4 RECENT DEVELOPMENT
14 RELATED REPORTS
List of Table
TABLE 1 INNOVATION TYPES
TABLE 2 EUROPE REVERSE LOGISTICS MARKET, BY PRODUCT TYPE, 2018-2033 (USD THOUSAND)
TABLE 3 EUROPE REVERSE LOGISTICS MARKET, BY PRODUCT TYPE, 2018-2033 (THOUSAND UNITS)
TABLE 4 EUROPE REVERSE LOGISTICS MARKET, BY SERVICE TYPE, 2018-2033 (USD THOUSAND)
TABLE 5 EUROPE REVERSE LOGISTICS MARKET, BY DISTRIBUTION CHANNEL, 2018-2033 (USD THOUSAND)
TABLE 6 EUROPE REVERSE LOGISTICS MARKET, BY COUNTRY, 2019-2033 (USD THOUSAND)
TABLE 7 EUROPE REVERSE LOGISTICS MARKET, BY COUNTRY, 2019-2033 (THOUSAND UNITS)
TABLE 8 EUROPE REVERSE LOGISTICS MARKET, BY COUNTRY, 2019-2033 (ASP/UNIT)
TABLE 9 EUROPE REVERSE LOGISTICS MARKET, BY PRODUCT, 2019-2033 (USD THOUSAND)
TABLE 10 EUROPE REVERSE LOGISTICS MARKET, BY PRODUCT, 2019-2033 (THOUSAND UNITS)
TABLE 11 EUROPE REVERSE LOGISTICS MARKET, BY PRODUCT, 2019-2033 (ASP/UNIT)
TABLE 12 EUROPE REVERSE LOGISTICS MARKET, BY SERVICE TYPE, 2019-2033 (USD THOUSAND)
TABLE 13 EUROPE REVERSE LOGISTICS MARKET, BY DISTRIBUTION CHANNEL, 2019-2033 (USD THOUSAND)
TABLE 14 GERMANY REVERSE LOGISTICS MARKET, BY PRODUCT, 2019-2033 (USD THOUSAND)
TABLE 15 GERMANY REVERSE LOGISTICS MARKET, BY PRODUCT, 2019-2033 (THOUSAND UNITS)
TABLE 16 GERMANY REVERSE LOGISTICS MARKET, BY PRODUCT, 2019-2033 (ASP/UNIT)
TABLE 17 GERMANY REVERSE LOGISTICS MARKET, BY SERVICE TYPE, 2019-2033 (USD THOUSAND)
TABLE 18 GERMANY REVERSE LOGISTICS MARKET, BY DISTRIBUTION CHANNEL, 2019-2033 (USD THOUSAND)
TABLE 19 U.K. REVERSE LOGISTICS MARKET, BY PRODUCT, 2019-2033 (USD THOUSAND)
TABLE 20 U.K. REVERSE LOGISTICS MARKET, BY PRODUCT, 2019-2033 (THOUSAND UNITS)
TABLE 21 U.K. REVERSE LOGISTICS MARKET, BY PRODUCT, 2019-2033 (ASP/UNIT)
TABLE 22 U.K. REVERSE LOGISTICS MARKET, BY SERVICE TYPE, 2019-2033 (USD THOUSAND)
TABLE 23 U.K. REVERSE LOGISTICS MARKET, BY DISTRIBUTION CHANNEL, 2019-2033 (USD THOUSAND)
TABLE 24 FRANCE REVERSE LOGISTICS MARKET, BY PRODUCT, 2019-2033 (USD THOUSAND)
TABLE 25 FRANCE REVERSE LOGISTICS MARKET, BY PRODUCT, 2019-2033 (THOUSAND UNITS)
TABLE 26 FRANCE REVERSE LOGISTICS MARKET, BY PRODUCT, 2019-2033 (ASP/UNIT)
TABLE 27 FRANCE REVERSE LOGISTICS MARKET, BY SERVICE TYPE, 2019-2033 (USD THOUSAND)
TABLE 28 FRANCE REVERSE LOGISTICS MARKET, BY DISTRIBUTION CHANNEL, 2019-2033 (USD THOUSAND)
TABLE 29 ITALY REVERSE LOGISTICS MARKET, BY PRODUCT, 2019-2033 (USD THOUSAND)
TABLE 30 ITALY REVERSE LOGISTICS MARKET, BY PRODUCT, 2019-2033 (THOUSAND UNITS)
TABLE 31 ITALY REVERSE LOGISTICS MARKET, BY PRODUCT, 2019-2033 (ASP/UNIT)
TABLE 32 ITALY REVERSE LOGISTICS MARKET, BY SERVICE TYPE, 2019-2033 (USD THOUSAND)
TABLE 33 ITALY REVERSE LOGISTICS MARKET, BY DISTRIBUTION CHANNEL, 2019-2033 (USD THOUSAND)
TABLE 34 SPAIN REVERSE LOGISTICS MARKET, BY PRODUCT, 2019-2033 (USD THOUSAND)
TABLE 35 SPAIN REVERSE LOGISTICS MARKET, BY PRODUCT, 2019-2033 (THOUSAND UNITS)
TABLE 36 SPAIN REVERSE LOGISTICS MARKET, BY PRODUCT, 2019-2033 (ASP/UNIT)
TABLE 37 SPAIN REVERSE LOGISTICS MARKET, BY SERVICE TYPE, 2019-2033 (USD THOUSAND)
TABLE 38 SPAIN REVERSE LOGISTICS MARKET, BY DISTRIBUTION CHANNEL, 2019-2033 (USD THOUSAND)
TABLE 39 RUSSIA REVERSE LOGISTICS MARKET, BY PRODUCT, 2019-2033 (USD THOUSAND)
TABLE 40 RUSSIA REVERSE LOGISTICS MARKET, BY PRODUCT, 2019-2033 (THOUSAND UNITS)
TABLE 41 RUSSIA REVERSE LOGISTICS MARKET, BY PRODUCT, 2019-2033 (ASP/UNIT)
TABLE 42 RUSSIA REVERSE LOGISTICS MARKET, BY SERVICE TYPE, 2019-2033 (USD THOUSAND)
TABLE 43 RUSSIA REVERSE LOGISTICS MARKET, BY DISTRIBUTION CHANNEL, 2019-2033 (USD THOUSAND)
TABLE 44 NETHERLANDS REVERSE LOGISTICS MARKET, BY PRODUCT, 2019-2033 (USD THOUSAND)
TABLE 45 NETHERLANDS REVERSE LOGISTICS MARKET, BY PRODUCT, 2019-2033 (THOUSAND UNITS)
TABLE 46 NETHERLANDS REVERSE LOGISTICS MARKET, BY PRODUCT, 2019-2033 (ASP/UNIT)
TABLE 47 NETHERLANDS REVERSE LOGISTICS MARKET, BY SERVICE TYPE, 2019-2033 (USD THOUSAND)
TABLE 48 NETHERLANDS REVERSE LOGISTICS MARKET, BY DISTRIBUTION CHANNEL, 2019-2033 (USD THOUSAND)
TABLE 49 POLAND REVERSE LOGISTICS MARKET, BY PRODUCT, 2019-2033 (USD THOUSAND)
TABLE 50 POLAND REVERSE LOGISTICS MARKET, BY PRODUCT, 2019-2033 (THOUSAND UNITS)
TABLE 51 POLAND REVERSE LOGISTICS MARKET, BY PRODUCT, 2019-2033 (ASP/UNIT)
TABLE 52 POLAND REVERSE LOGISTICS MARKET, BY SERVICE TYPE, 2019-2033 (USD THOUSAND)
TABLE 53 POLAND REVERSE LOGISTICS MARKET, BY DISTRIBUTION CHANNEL, 2019-2033 (USD THOUSAND)
TABLE 54 TURKEY REVERSE LOGISTICS MARKET, BY PRODUCT, 2019-2033 (USD THOUSAND)
TABLE 55 TURKEY REVERSE LOGISTICS MARKET, BY PRODUCT, 2019-2033 (THOUSAND UNITS)
TABLE 56 TURKEY REVERSE LOGISTICS MARKET, BY PRODUCT, 2019-2033 (ASP/UNIT)
TABLE 57 TURKEY REVERSE LOGISTICS MARKET, BY SERVICE TYPE, 2019-2033 (USD THOUSAND)
TABLE 58 TURKEY REVERSE LOGISTICS MARKET, BY DISTRIBUTION CHANNEL, 2019-2033 (USD THOUSAND)
TABLE 59 SWITZERLAND REVERSE LOGISTICS MARKET, BY PRODUCT, 2019-2033 (USD THOUSAND)
TABLE 60 SWITZERLAND REVERSE LOGISTICS MARKET, BY PRODUCT, 2019-2033 (THOUSAND UNITS)
TABLE 61 SWITZERLAND REVERSE LOGISTICS MARKET, BY PRODUCT, 2019-2033 (ASP/UNIT)
TABLE 62 SWITZERLAND REVERSE LOGISTICS MARKET, BY SERVICE TYPE, 2019-2033 (USD THOUSAND)
TABLE 63 SWITZERLAND REVERSE LOGISTICS MARKET, BY DISTRIBUTION CHANNEL, 2019-2033 (USD THOUSAND)
TABLE 64 REST OF EUROPE REVERSE LOGISTICS MARKET, BY PRODUCT, 2019-2033 (USD THOUSAND)
TABLE 65 REST OF EUROPE REVERSE LOGISTICS MARKET, BY PRODUCT, 2019-2033 (THOUSAND UNITS)
TABLE 66 REST OF EUROPE REVERSE LOGISTICS MARKET, BY PRODUCT, 2019-2033 (ASP/UNIT)
TABLE 67 REST OF EUROPE REVERSE LOGISTICS MARKET, BY SERVICE TYPE, 2019-2033 (USD THOUSAND)
TABLE 68 REST OF EUROPE REVERSE LOGISTICS MARKET, BY DISTRIBUTION CHANNEL, 2019-2033 (USD THOUSAND)
List of Figure
FIGURE 1 GLOBAL EUROPE REVERSE LOGISTICS MARKET
FIGURE 2 EUROPE REVERSE LOGISTICS MARKET: DATA TRIANGULATION
FIGURE 3 EUROPE REVERSE LOGISTICS MARKET: DROC ANALYSIS
FIGURE 4 EUROPE REVERSE LOGISTICS MARKET: REGIONAL MARKET ANALYSIS
FIGURE 5 EUROPE REVERSE LOGISTICS MARKET: COMPANY RESEARCH ANALYSIS
FIGURE 6 EUROPE REVERSE LOGISTICS MARKET: INTERVIEW DEMOGRAPHICS
FIGURE 7 GO-TO-MARKET (GTM) STRATEGY MODEL
FIGURE 8 GO TO MARKET STRATEGY GROWTH MATRIX
FIGURE 9 COMPANY EVALUATION QUADRANT
FIGURE 10 REGIONAL BREAKDOWN OF PRODUCT CATEGORIES
FIGURE 11 REVERSE LOGISTICS SUPPLY CHAIN
FIGURE 12 THE EEA VISION FOR A CIRCULAR ECONOMY IN EUROPE
FIGURE 13 TREND IN ESG RATINGS OF COMPANIES OF THE EU STOXX 50 FROM 2019 TO 2024
FIGURE 14 KEY MATERIAL FLOW INDICATORS IN THE EU-27
FIGURE 15 EUROPE REVERSE LOGISTICS MARKET: BY PRODUCT TYPE, 2025
FIGURE 16 EUROPE REVERSE LOGISTICS MARKET: BY SERVICE TYPE, 2025
FIGURE 17 EUROPE REVERSE LOGISTICS MARKET: BY DISTRIBUTION CHANNEL, 2025
FIGURE 18 EUROPE REVERSE LOGISTICS MARKET: SNAPSHOT, 2025
FIGURE 19 EUROPE REVERSE LOGISTICS MARKET: COMPANY SHARE 2025 (%)
Europe Reverse Logistics Market, Supply Chain Analysis and Ecosystem Framework
To support market growth and help clients navigate the impact of geopolitical shifts, DBMR has integrated in-depth supply chain analysis into its Europe Reverse Logistics Market research reports. This addition empowers clients to respond effectively to global changes affecting their industries. The supply chain analysis section includes detailed insights such as Europe Reverse Logistics Market consumption and production by country, price trend analysis, the impact of tariffs and geopolitical developments, and import and export trends by country and HSN code. It also highlights major suppliers with data on production capacity and company profiles, as well as key importers and exporters. In addition to research, DBMR offers specialized supply chain consulting services backed by over a decade of experience, providing solutions like supplier discovery, supplier risk assessment, price trend analysis, impact evaluation of inflation and trade route changes, and comprehensive market trend analysis.
Data collection and base year analysis are done using data collection modules with large sample sizes. The stage includes obtaining market information or related data through various sources and strategies. It includes examining and planning all the data acquired from the past in advance. It likewise envelops the examination of information inconsistencies seen across different information sources. The market data is analysed and estimated using market statistical and coherent models. Also, market share analysis and key trend analysis are the major success factors in the market report. To know more, please request an analyst call or drop down your inquiry.
The key research methodology used by DBMR research team is data triangulation which involves data mining, analysis of the impact of data variables on the market and primary (industry expert) validation. Data models include Vendor Positioning Grid, Market Time Line Analysis, Market Overview and Guide, Company Positioning Grid, Patent Analysis, Pricing Analysis, Company Market Share Analysis, Standards of Measurement, Global versus Regional and Vendor Share Analysis. To know more about the research methodology, drop in an inquiry to speak to our industry experts.
Data Bridge Market Research is a leader in advanced formative research. We take pride in servicing our existing and new customers with data and analysis that match and suits their goal. The report can be customized to include price trend analysis of target brands understanding the market for additional countries (ask for the list of countries), clinical trial results data, literature review, refurbished market and product base analysis. Market analysis of target competitors can be analyzed from technology-based analysis to market portfolio strategies. We can add as many competitors that you require data about in the format and data style you are looking for. Our team of analysts can also provide you data in crude raw excel files pivot tables (Fact book) or can assist you in creating presentations from the data sets available in the report.


