
Europe Sports Apparel Market
Market Size in USD Billion
 USD
73.80 Billion
USD
109.87 Billion
2025
2033
USD
73.80 Billion
USD
109.87 Billion
2025
2033
| 2026 - 2033 | |
| USD 73.80 Billion | |
| USD 109.87 Billion | |
| % | |
|
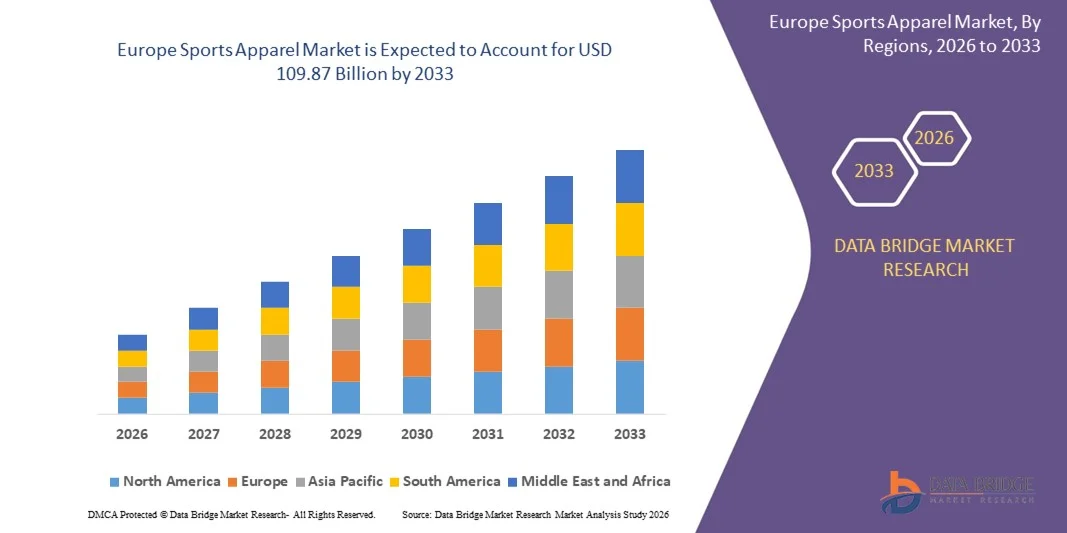
Europe Sports Apparel Market Size
- The Europe sports apparel market size was valued at USD 73.80 billion in 2025 and is expected to reach USD 109.87 billion by 2033, at a CAGR of 5.10% during the forecast period
- The market growth is largely fuelled by the rising health awareness among consumers, increased participation in fitness and recreational activities, and the growing influence of athleisure fashion across all age groups
- The surge in demand for comfortable, functional, and aesthetically appealing athletic wear is further supported by influencer marketing, celebrity endorsements, and fitness-oriented social media trends
Europe Sports Apparel Market Analysis
- The market is witnessing rapid transformation due to the merging of fashion and functionality, with consumers seeking performance-driven yet stylish clothing for both athletic and casual wear
- Increasing female participation in sports and fitness programs is creating new demand across product categories such as leggings, sports bras, and activewear sets
- Germany sports apparel market dominated the market in 2025, supported by a growing base of health-conscious consumers and a well-established sports culture. German consumers value innovation, technical quality, and durability in athletic wear, contributing to sustained demand for performance-oriented fabrics and ergonomic designs
- U.K. is expected to witness the highest compound annual growth rate (CAGR) in the Europe sports apparel market due to rising fitness awareness, increasing adoption of athleisure wear, and growing demand for sustainable and technologically advanced sports apparel across urban populations
- The soccer segment dominated the market with the largest revenue share in 2025, driven by the global popularity of the sport, increasing participation across all age groups, and the high demand for team jerseys, shorts, and training kits. Soccer apparel benefits from major international events such as the FIFA World Cup and regional leagues, which consistently drive brand visibility and consumer engagement. The segment also thrives due to strong endorsements from top athletes and clubs
Report Scope and Europe Sports Apparel Market Segmentation
|
Attributes |
Europe Sports Apparel Key Market Insights |
|
Segments Covered |
|
|
Countries Covered |
Europe
|
|
Key Market Players |
|
|
Market Opportunities |
|
|
Value Added Data Infosets |
In addition to the insights on market scenarios such as market value, growth rate, segmentation, geographical coverage, and major players, the market reports curated by the Data Bridge Market Research also include in-depth expert analysis, pricing analysis, brand share analysis, consumer survey, demography analysis, supply chain analysis, value chain analysis, raw material/consumables overview, vendor selection criteria, PESTLE Analysis, Porter Analysis, and regulatory framework. |
Europe Sports Apparel Market Trends
Rise of Performance-Enhancing and Sustainable Sports Apparel
- The growing shift toward performance-enhancing and sustainable sports apparel is transforming the European athletic wear landscape by enabling athletes and consumers to access high-quality, functional, and eco-friendly clothing. Advanced fabrics and moisture-wicking technologies allow immediate benefits in comfort, endurance, and athletic performance, especially in professional and amateur sports segments, improving overall participation and satisfaction. In addition, integration of smart fabrics and temperature-regulating textiles is enhancing user experience and differentiating premium products in the market
- The high demand for innovative sportswear in running, cycling, gym, and team sports is accelerating the adoption of technical fabrics, sustainable fibers, and ergonomic designs. These products are particularly effective in supporting enhanced mobility, breathability, and durability. Moreover, collaborations between brands and sports organizations are driving product visibility and trust, while eco-conscious consumer trends continue to push adoption of environmentally responsible products
- The affordability and increasing availability of mid-range sustainable sports apparel are making it attractive for a broad consumer base, including youth and fitness enthusiasts. Brands benefit from expanded market penetration, increased brand loyalty, and positive environmental impact, leading to steady growth in the sector. Seasonal collections, promotions, and influencer-led campaigns are further boosting visibility and driving consistent sales growth
- For instance, in 2023, several European sportswear brands launched recycled polyester running jackets and moisture-wicking training kits, improving consumer engagement, eco-conscious brand perception, and overall sales performance. These initiatives also reinforced brand positioning as innovators in sustainability while meeting regulatory and consumer expectations
- While performance and sustainability trends are gaining traction, continued growth depends on technological innovation, consumer education, and marketing strategies. Companies must focus on R&D, smart textiles, and eco-friendly supply chains to fully capitalize on market demand. In addition, expanding e-commerce and omnichannel distribution networks is critical for capturing emerging markets
Europe Sports Apparel Market Dynamics
Driver
Rising Health Consciousness and Growing Demand for Eco-Friendly Athletic Wear
- Increasing health awareness and fitness adoption across Europe are driving demand for high-performance sports apparel. Consumers are increasingly prioritizing clothing that enhances athletic performance and supports an active lifestyle. Alongside this, a rising number of corporate wellness programs and sports initiatives is further stimulating demand
- Sportswear brands are adopting sustainable and functional materials, including recycled fibers, organic cotton, and advanced moisture-wicking fabrics, to meet consumer expectations. This awareness has accelerated adoption across running, gym, yoga, and team sports segments. Investments in R&D for biodegradable and low-impact fabrics are also enabling brands to appeal to environmentally conscious consumers
- Government initiatives, health campaigns, and eco-labeling regulations promoting active and environmentally responsible living are further strengthening market demand. Policies encouraging sustainable manufacturing practices are motivating brands to innovate and expand product offerings. Incentives such as tax breaks and sustainability certifications provide additional support for manufacturers embracing eco-friendly practices
- For instance, in 2022, several EU countries introduced sustainability guidelines for textile and apparel manufacturing, driving sports brands to incorporate eco-friendly fibers and performance-enhancing fabrics. This led to accelerated adoption of certified eco-products in both professional and mass-market segments
- While awareness and policy support are driving growth, there remains a need for innovation, broader distribution, and technology integration to ensure long-term market adoption. Continuous consumer engagement through campaigns highlighting sustainability and performance benefits is critical for sustained growth
Restraint/Challenge
High Production Costs and Limited Raw Material Availability
- The high cost of advanced performance fabrics, including recycled polyester, organic cotton, and technical blends, makes them less accessible for price-sensitive brands and smaller manufacturers. Cost remains a major limiting factor for widespread adoption. In addition, fluctuating raw material prices and currency volatility can impact production margins and pricing strategies
- In many regions, supply chain constraints and limited availability of sustainable and functional textile materials restrict large-scale production. This can result in inconsistent supply and higher procurement costs, impacting market penetration. Furthermore, dependency on a few certified suppliers can lead to production bottlenecks during peak demand periods
- Market expansion is also constrained by competition from conventional sportswear and non-eco-friendly alternatives, which are sometimes preferred due to lower prices or established brand recognition. Consumer price sensitivity and limited awareness of sustainability benefits further challenge adoption of premium eco-friendly sports apparel
- For instance, in 2023, several European SMEs reported challenges in sourcing sufficient recycled or certified organic fabrics, delaying product launches and limiting growth opportunities. Logistics challenges, coupled with limited local manufacturing capacities, amplified these supply-side constraints
- While innovation in performance and sustainable fabrics continues, addressing cost, raw material supply, and manufacturing efficiency remains crucial. Stakeholders must focus on sustainable sourcing, R&D, and supply chain optimization to unlock long-term market potential. Enhanced collaborations with raw material suppliers and investment in local production facilities could mitigate supply risks and stabilize costs
Europe Sports Apparel Market Scope
The market is segmented on the basis of sport, material, type of print, distribution channel, and end user.
- By Sport
On the basis of sport, the Europe sports apparel market is segmented into soccer, basketball, baseball, and others. The soccer segment dominated the market with the largest revenue share in 2025, driven by the global popularity of the sport, increasing participation across all age groups, and the high demand for team jerseys, shorts, and training kits. Soccer apparel benefits from major international events such as the FIFA World Cup and regional leagues, which consistently drive brand visibility and consumer engagement. The segment also thrives due to strong endorsements from top athletes and clubs.
The basketball segment is expected to witness the fastest growth rate from 2026 to 2033, fuelled by its rising global influence and growing youth interest. Basketball-inspired fashion trends, combined with demand for breathable and stylish jerseys and shorts, are boosting segment growth. Collaborations between sportswear brands and basketball players also contribute to expanding consumer reach and brand loyalty.
- By Material
On the basis of material, the Europe sports apparel market is segmented into natural and synthetic. The synthetic segment held the largest market revenue share in 2025, supported by the widespread use of polyester and elastane fabrics that offer superior flexibility, moisture-wicking properties, and durability during athletic performance. The affordability and adaptability of synthetic materials for high-performance gear make them the preferred choice for both athletes and casual users.
The natural segment is expected to witness the fastest growth rate from 2026 to 2033, driven by increasing consumer preference for eco-friendly and sustainable products. Materials such as organic cotton and bamboo blends are gaining attention for their softness, breathability, and biodegradability, particularly among environmentally conscious consumers.
- By Type of Print
On the basis of type of print, the Europe sports apparel market is segmented into water based, silicone emboss, reflective transfer, pigment, high density, foil, glitter, cracking ink, discharge, all over print, photo print, and others. The pigment print segment held the largest revenue share in 2025 due to its versatility, affordability, and wide application across t-shirts, hoodies, and team apparel. It is widely preferred for creating bold and durable designs on both cotton and synthetic fabrics.
The reflective transfer segment is expected to witness the fastest growth rate from 2026 to 2033, owing to increasing consumer demand for safety and visibility in activewear, especially in outdoor or nighttime activities. Reflective prints are gaining popularity in running gear, cycling apparel, and gym wear, contributing to their rapid market adoption.
- By Distribution Channel
On the basis of distribution channel, the Europe sports apparel market is segmented into e-commerce, supermarket/hypermarket, brand outlets, discount stores, and others. The e-commerce segment captured the largest revenue share in 2025, supported by the convenience of online shopping, wide product availability, and rising mobile commerce. Consumers increasingly prefer digital platforms for accessing the latest collections, personalized deals, and hassle-free returns.
The brand outlets segment is expected to witness the fastest growth rate from 2026 to 2033, driven by the in-store experience, exclusive collections, and loyalty programs offered by global sportswear brands. These physical outlets allow customers to try products, receive expert assistance, and engage with the brand more deeply, enhancing consumer retention.
- By End User
On the basis of end user, the Europe sports apparel market is segmented into men, women, and children. The men segment dominated the market in 2025 with the highest revenue share, primarily due to strong demand for gym wear, running apparel, and sport-specific clothing. The category benefits from a broad product range and frequent new launches by key brands targeting male fitness enthusiasts and athletes.
The women segment is expected to witness the fastest growth rate from 2026 to 2033 driven by increasing female participation in sports and fitness activities such as yoga, pilates, and running. Stylish, high-performance apparel that caters to comfort and body movement is expanding the female consumer base, making this a dynamic growth area in the industry.
Europe Sports Apparel Market Regional Analysis
- Germany sports apparel market dominated the market in 2025, supported by a growing base of health-conscious consumers and a well-established sports culture. German consumers value innovation, technical quality, and durability in athletic wear, contributing to sustained demand for performance-oriented fabrics and ergonomic designs
- The country’s strong retail infrastructure and digital commerce landscape support both domestic and international brands in gaining market share
- In addition, the emphasis on eco-friendly and functional products aligns with evolving consumer preferences
U.K. Sports Apparel Market Insight
The U.K. sports apparel market is expected to witness the fastest growth rate from 2026 to 2033, fueled by the rising popularity of gym culture, fitness boot camps, and home workout programs. British consumers are embracing sports apparel as a part of their everyday wardrobe, with a strong preference for trend-driven, comfortable, and functional clothing. Sustainability and ethical sourcing are also gaining traction among U.K. buyers, prompting brands to adapt accordingly. The influence of fashion-forward athletes and fitness influencers further drives market expansion.
Europe Sports Apparel Market Share
The Europe sports apparel industry is primarily led by well-established companies, including:
- Adidas AG (Germany)
- Puma SE (Germany)
- Decathlon S.A. (France)
- ASICS Europe B.V. (Netherlands)
- Salomon Group (France)
- Kappa S.p.A. (Italy)
- Fila Europe Ltd. (Italy)
- Umbro Ltd. (U.K.)
- Lotto Sport Italia S.p.A. (Italy)
- Intersport International Corporation (Switzerland)
SKU-

- Interactive Data Analysis Dashboard
- Company Analysis Dashboard for high growth potential opportunities
- Research Analyst Access for customization & queries
- Competitor Analysis with Interactive dashboard
- Latest News, Updates & Trend analysis
- Harness the Power of Benchmark Analysis for Comprehensive Competitor Tracking
Data collection and base year analysis are done using data collection modules with large sample sizes. The stage includes obtaining market information or related data through various sources and strategies. It includes examining and planning all the data acquired from the past in advance. It likewise envelops the examination of information inconsistencies seen across different information sources. The market data is analysed and estimated using market statistical and coherent models. Also, market share analysis and key trend analysis are the major success factors in the market report. To know more, please request an analyst call or drop down your inquiry.
The key research methodology used by DBMR research team is data triangulation which involves data mining, analysis of the impact of data variables on the market and primary (industry expert) validation. Data models include Vendor Positioning Grid, Market Time Line Analysis, Market Overview and Guide, Company Positioning Grid, Patent Analysis, Pricing Analysis, Company Market Share Analysis, Standards of Measurement, Global versus Regional and Vendor Share Analysis. To know more about the research methodology, drop in an inquiry to speak to our industry experts.
Data Bridge Market Research is a leader in advanced formative research. We take pride in servicing our existing and new customers with data and analysis that match and suits their goal. The report can be customized to include price trend analysis of target brands understanding the market for additional countries (ask for the list of countries), clinical trial results data, literature review, refurbished market and product base analysis. Market analysis of target competitors can be analyzed from technology-based analysis to market portfolio strategies. We can add as many competitors that you require data about in the format and data style you are looking for. Our team of analysts can also provide you data in crude raw excel files pivot tables (Fact book) or can assist you in creating presentations from the data sets available in the report.


