
Europe Stroke Diagnostics Market
Market Size in USD Billion
 USD
1.15 Billion
USD
1.83 Billion
2025
2033
USD
1.15 Billion
USD
1.83 Billion
2025
2033
| 2026 - 2033 | |
| USD 1.15 Billion | |
| USD 1.83 Billion | |
| % | |
|
What is the Europe Stroke Diagnostics Market Size and Overview?
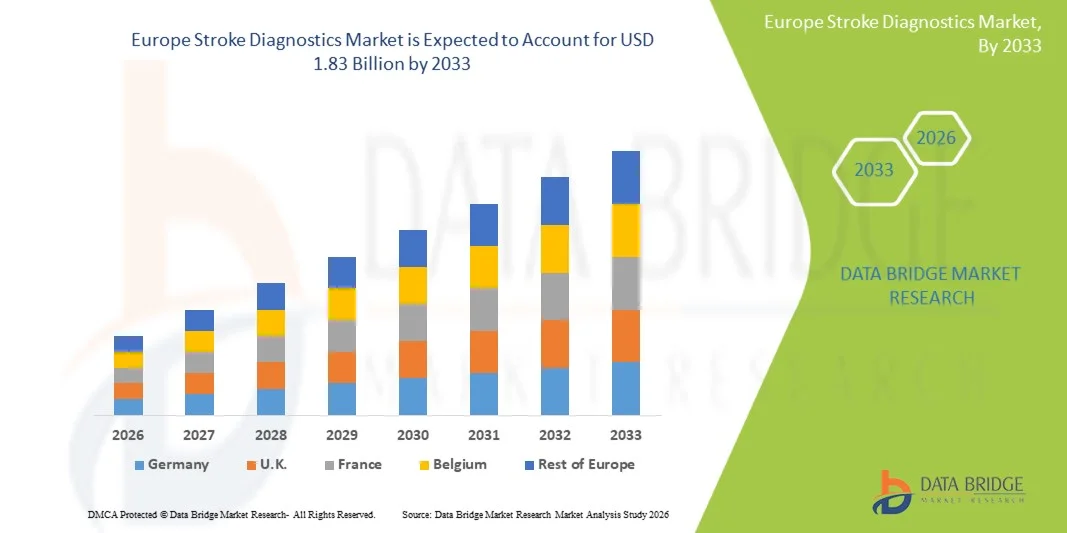
- The Europe stroke diagnostics market size was valued at USD 1.15 billion in 2025 and is expected to reach USD 1.83 billion by 2033, at a CAGR of 6.0% during the forecast period
- The market growth is largely fueled by increasing incidence and prevalence of stroke across European populations, aging demographics, and the rapid adoption of advanced diagnostic imaging technologies that enable early and accurate detection of cerebrovascular events
- Furthermore, rising healthcare investments, supportive government initiatives for early stroke interventions, and growing demand for timely, precise, and integrated diagnostic solutions in hospitals and imaging centers are positioning stroke diagnostics as a critical component of modern stroke care pathways. These converging factors are accelerating the uptake of innovative diagnostic tools, thereby significantly boosting the industry’s growth
Market Size & Forecast
- Europe Market Value (2025): USD 1.15 billion
- Expected Market Value (2033): USD 1.83 billion
- Forecast CAGR (2026–2033): 6.0%
Europe Stroke Diagnostics Market Analysis
- Stroke diagnostics, encompassing advanced imaging and biomarker-based tools for detecting cerebrovascular events, are increasingly vital in modern healthcare due to their role in enabling early intervention, reducing mortality, and improving patient outcomes across hospitals and diagnostic centers in Europe
- The escalating demand for stroke diagnostics is primarily fueled by the rising prevalence of stroke in aging populations, increasing awareness about timely diagnosis, and technological advancements in imaging modalities such as CT, MRI, and AI-assisted detection systems
- Germany dominated the stroke diagnostics market with the largest revenue share of 28.5% in 2025, driven by well-established healthcare infrastructure, government initiatives supporting early stroke detection, and high adoption of advanced imaging technologies
- Poland is expected to be the fastest growing country in the stroke diagnostics market during the forecast period due to improving healthcare infrastructure, increasing healthcare spending, and rising access to modern diagnostic tools
- Computed Tomography (CT Scan) segment dominated the stroke diagnostics market with a share of 60.4% in 2025, driven by its rapid imaging capability, high accuracy in detecting acute strokes, and widespread integration into hospital stroke care protocols
Report Scope and Europe Stroke Diagnostics Market Segmentation
|
Attributes |
Europe Stroke Diagnostics Key Market Insights |
|
Segments Covered |
|
|
Countries Covered |
Europe
|
|
Key Market Players |
|
|
Market Opportunities |
|
|
Value Added Data Infosets |
|
What is the Key Trend in the Europe Stroke Diagnostics Market?
“Advancements in AI-Assisted Imaging and Rapid Diagnostics”
- A significant and accelerating trend in the Europe stroke diagnostics market is the integration of artificial intelligence (AI) and machine learning algorithms with imaging technologies such as CT and MRI, enhancing diagnostic speed and accuracy for acute stroke cases
- For instance, AI-enabled CT systems can automatically detect ischemic regions, allowing radiologists to prioritize critical cases and reduce time-to-treatment in emergency settings
- AI-assisted imaging tools can identify subtle anomalies that may be missed during manual interpretation, while predictive algorithms provide risk assessments and suggest personalized intervention plans for patients
- The seamless combination of AI diagnostics with hospital information systems allows for centralized management of patient imaging data, facilitating efficient decision-making and treatment planning across stroke care teams
- Integration of telemedicine platforms with stroke diagnostics is enabling remote interpretation and expert consultation, particularly in underserved areas, accelerating timely intervention
- This trend towards faster, more precise, and data-driven stroke detection is reshaping clinical workflows, with companies such as Brainomix developing AI-powered stroke assessment tools integrated with standard CT imaging platforms
- The demand for AI-enhanced stroke diagnostics is growing rapidly across European hospitals and diagnostic centers, as clinicians seek to reduce treatment delays and improve patient outcomes
Europe Stroke Diagnostics Market Dynamics
Driver
“Rising Stroke Incidence and Growing Need for Early Detection”
- The increasing prevalence of stroke across aging populations and the heightened need for timely intervention are key drivers boosting demand for advanced stroke diagnostic tools in Europe
- For instance, in March 2025, Siemens Healthineers launched an AI-based CT solution to accelerate stroke detection in hospitals, aiming to improve early diagnosis and patient triage
- As awareness of the importance of rapid stroke diagnosis grows, healthcare providers are increasingly adopting imaging technologies that offer precise detection, improved workflow efficiency, and integrated patient management
- Furthermore, government initiatives and healthcare investments supporting early stroke intervention are encouraging hospitals to upgrade diagnostic infrastructure with advanced CT, MRI, and AI-assisted tools
- Expanding training programs and awareness campaigns for medical professionals on AI-assisted stroke detection are further driving adoption across hospitals and diagnostic centers
- Collaborations between imaging technology providers and healthcare systems to implement scalable stroke diagnostic solutions are facilitating wider market penetration and improving clinical workflow efficiency
- The ability to quickly identify stroke type and severity, combined with integration into hospital information systems and electronic health records, is propelling adoption across both public and private healthcare facilities
Restraint/Challenge
“High Equipment Cost and Regulatory Compliance Barriers”
- The high capital investment required for advanced imaging systems and AI-assisted diagnostic tools poses a significant challenge to market growth, particularly for smaller hospitals and clinics
- For instance, advanced CT scanners with AI capabilities can cost several hundred thousand euros, limiting adoption in budget-constrained healthcare facilities
- Additionally, navigating complex European medical device regulations, including CE marking and data privacy compliance for AI tools, can slow deployment and raise operational costs
- While initiatives are underway to streamline approvals and provide financial incentives, regulatory and budgetary hurdles continue to limit market penetration in some countries
- Lack of standardized protocols for AI-assisted diagnostics can result in variability of results and reduce clinician confidence, presenting an adoption barrier
- Maintenance costs and the need for regular software updates for AI-integrated systems add ongoing operational expenses, which can hinder adoption in cost-sensitive healthcare settings
- Addressing these challenges through cost-effective imaging solutions, scalable AI software, and regulatory support will be critical to sustaining growth in the European stroke diagnostics market
Europe Stroke Diagnostics Market Scope
The market is segmented on the basis of severity, type, application, end user, distribution channel, and stage.
- By Severity
On the basis of severity, the market is segmented into mild, moderate, and severe strokes. The severe stroke segment dominated the market with the largest revenue share of 48.6% in 2025, driven by the high demand for rapid, advanced diagnostic interventions to minimize mortality and long-term disability. Hospitals prioritize advanced imaging and AI-assisted diagnostics for severe cases due to their urgency and the need for immediate treatment decisions. The rising prevalence of severe strokes in aging populations across Europe, particularly in countries such as Germany and France, contributes to the segment’s dominance. Additionally, government initiatives and hospital protocols mandate comprehensive imaging for severe stroke cases, further propelling demand. Continuous technological advancements in CT, CTA, and MRI specifically for acute and severe stroke assessment also strengthen this segment’s market position. Clinicians rely on accurate severity assessment to optimize treatment pathways and patient monitoring, making this subsegment critical for market growth.
The mild stroke segment is expected to witness the fastest growth at a CAGR of 7.8% from 2026 to 2033, fueled by rising awareness and early detection programs. AI-assisted imaging and portable diagnostic tools are increasingly used to identify mild strokes that may have subtle presentations. Countries with well-developed primary healthcare systems, such as the U.K. and Sweden, are investing in routine screenings and mobile diagnostic units. Telemedicine and wearable monitoring devices further accelerate detection and reporting of mild stroke events. The adoption of early diagnostic technologies reduces long-term complications and healthcare costs, making mild stroke diagnostics a rapidly expanding segment. Preventive care programs promoting regular check-ups and early intervention are key drivers for growth in this segment.
- By Type
On the basis of type, the market is segmented into Computed Tomography (CT Scan), Computed Tomography Angiography (CTA), Magnetic Resonance Imaging (MRI), Magnetic Resonance Angiography (MRA), Transcranial Doppler Ultrasound, Video Head Impulse Test (VHIT), and others. The Computed Tomography (CT Scan) segment dominated the market with a revenue share of 60.4% in 2025, driven by its rapid imaging capability, high diagnostic accuracy, and widespread hospital adoption. CT scans are the first-line diagnostic tool for suspected stroke patients due to their speed and reliability in detecting ischemic and hemorrhagic events. The integration of AI with CT technology allows automated lesion detection and triage, reducing time-to-treatment. Hospitals in Germany, France, and Italy rely heavily on CT imaging for acute stroke management, contributing to its dominant share. Emergency departments prioritize CT scans because of their ability to quickly identify stroke type, guide thrombolytic therapy, and monitor treatment efficacy. Increasing availability of multi-slice CT scanners and continuous software upgrades further strengthen the segment’s market position.
The CTA segment is expected to witness the fastest growth at a CAGR of 8.5% from 2026 to 2033, driven by its ability to provide detailed vascular imaging for precise diagnosis and treatment planning. CTA enables visualization of cerebral arteries, helping clinicians identify occlusions and aneurysms accurately. AI integration in CTA systems allows automated vessel analysis and risk scoring, enhancing clinical decision-making. The growing prevalence of complex stroke cases and expanding hospital imaging infrastructure across Eastern Europe fuels CTA adoption. Additionally, collaborations between imaging solution providers and healthcare centers are facilitating more accessible CTA diagnostics. The segment’s growth is also supported by increasing demand for minimally invasive interventions guided by high-resolution vascular imaging.
- By Application
On the basis of application, the market is segmented into ischemic stroke, hemorrhagic stroke, and transient ischemic attacks (TIAs). The ischemic stroke segment dominated the market with a share of 55.4% in 2025, driven by its higher prevalence and the critical need for early and accurate diagnosis. Hospitals rely on advanced imaging modalities, such as CT and MRI, combined with AI-assisted analysis, to determine the location and extent of ischemic injury. Clinical guidelines emphasize rapid imaging and treatment to prevent long-term neurological deficits, supporting high demand for ischemic stroke diagnostics. Investments in stroke units and government-led awareness programs in Germany, France, and the U.K. accelerate the segment’s growth. AI-based predictive tools further aid in patient triage and risk assessment. The prevalence of lifestyle-related risk factors, such as hypertension and diabetes, also increases the need for timely ischemic stroke detection.
The TIA segment is expected to witness the fastest growth at a CAGR of 7.2% from 2026 to 2033, fueled by increasing awareness and preventive care initiatives. Early detection of TIAs can significantly reduce the risk of subsequent major strokes. Telemedicine and wearable monitoring systems help capture transient events, supporting growth in outpatient and home-based care. Countries like Sweden and the Netherlands are implementing TIA screening programs and mobile imaging units, further driving adoption. AI-assisted tools help clinicians predict potential recurrent events and optimize patient management. The rising focus on reducing healthcare burden through preventive diagnostics is a key factor supporting growth in this subsegment.
- By End User
On the basis of end user, the market is segmented into hospitals, clinics, ambulatory surgical centers, and home healthcare. The hospitals segment dominated the market with a share of 68.7% in 2025, due to the high adoption of advanced imaging technologies, AI-assisted diagnostics, and availability of specialized stroke units. Hospitals in Germany, France, and the U.K. offer integrated diagnostic and treatment pathways for stroke patients, driving demand for comprehensive stroke diagnostics. High patient volumes, regulatory mandates for rapid intervention, and well-equipped emergency departments strengthen the segment’s market position. AI-powered CT and MRI solutions are being implemented to enhance workflow efficiency and reduce treatment delays. Hospitals also invest in continuous staff training and software upgrades to maintain diagnostic accuracy. Collaborations with imaging technology providers further support hospital adoption of advanced stroke diagnostics.
The home healthcare segment is expected to witness the fastest growth at a CAGR of 8.0% from 2026 to 2033, fueled by rising demand for remote monitoring of high-risk patients. Portable imaging devices, telemedicine solutions, and wearable sensors allow early detection of stroke symptoms in home settings. Aging populations in countries like Italy, Spain, and Poland increase demand for home-based care. AI-driven predictive tools alert caregivers to potential events, supporting timely intervention. Government and insurance initiatives promoting remote care solutions further contribute to this segment’s rapid growth. Home healthcare integration improves patient convenience while reducing hospital readmissions and long-term costs.
- By Distribution Channel
On the basis of distribution channel, the market is segmented into direct tender, third-party distributors, and others. The direct tender segment dominated the market with a share of 54.3% in 2025, driven by hospital procurement policies that prioritize direct acquisition from manufacturers for better pricing, after-sales support, and guaranteed compliance with European medical standards. Large hospitals in Germany, France, and the U.K. prefer direct tenders for acquiring advanced CT, CTA, and MRI systems. Direct procurement ensures customization, timely delivery, and service agreements, enhancing operational efficiency. Manufacturers often provide on-site installation, training, and maintenance services through direct tenders. Long-term contracts and bulk orders for advanced diagnostic systems further strengthen this segment. Hospitals also rely on direct tenders to implement AI-integrated solutions tailored to clinical workflow requirements.
The third-party distributors segment is expected to witness the fastest growth at a CAGR of 7.5% from 2026 to 2033, fueled by the increasing presence of medical device distributors in emerging European markets. Smaller clinics and diagnostic centers rely on distributors for flexible purchasing and access to multiple brands. Distributors also provide installation, maintenance, and staff training services, making advanced diagnostics more accessible. Expanding distribution networks in countries such as Poland, Hungary, and Romania accelerate adoption of advanced stroke diagnostic tools. The flexibility and cost-effectiveness of third-party channels support rapid market penetration. Partnerships between distributors and manufacturers further enhance service and availability in remote locations.
- By Stage
On the basis of stage, the market is segmented into pre-operative, peri-operative, and post-operative. The pre-operative segment dominated the market with a share of 62.1% in 2025, as early diagnosis and assessment are critical for planning interventions such as thrombolysis or thrombectomy. Hospitals rely on advanced CT, CTA, and MRI imaging, combined with AI-assisted predictive analytics, to determine treatment strategy. Clinical guidelines mandate rapid pre-operative imaging to optimize outcomes in acute stroke cases. Countries like Germany, France, and the U.K. emphasize pre-operative imaging protocols in stroke care pathways. High adoption of AI-based tools for severity assessment further strengthens this segment. Pre-operative imaging also reduces treatment errors and improves patient triage efficiency.
The post-operative segment is expected to witness the fastest growth at a CAGR of 7.4% from 2026 to 2033, driven by increasing demand for follow-up imaging and monitoring of stroke patients. Post-operative diagnostics help detect complications, assess recovery, and guide rehabilitation. Integration of AI-assisted imaging allows continuous monitoring of cerebral changes and vascular status. Home-based imaging and telemedicine platforms support follow-up for patients in remote areas. Governments and insurance providers encourage post-operative monitoring to reduce readmissions. The focus on patient safety, recovery optimization, and long-term outcomes propels growth in post-operative stroke diagnostics.
Europe Stroke Diagnostics Market Regional Analysis
- Germany dominated the stroke diagnostics market with the largest revenue share of 28.5% in 2025, driven by well-established healthcare infrastructure, government initiatives supporting early stroke detection, and high adoption of advanced imaging technologies
- Hospitals and diagnostic centers in Germany prioritize rapid, accurate stroke detection, leveraging CT, CTA, and MRI systems integrated with AI to reduce time-to-treatment and improve patient outcomes
- This strong adoption is further supported by government initiatives promoting early stroke intervention, high healthcare expenditure, and well-established clinical guidelines, positioning Germany as a key market for advanced stroke diagnostics in Europe
The Germany Stroke Diagnostics Market Insight
The Germany stroke diagnostics market is expected to expand at a considerable CAGR during the forecast period, fueled by increasing awareness of early stroke detection and the demand for technologically advanced diagnostic solutions. Hospitals extensively deploy AI-assisted CT, CTA, and MRI systems for rapid, accurate diagnosis and treatment planning. Government support for stroke care programs, investment in stroke units, and integration of diagnostics into standard hospital protocols strengthen adoption. The focus on preventive care and telemedicine-supported imaging solutions further drives growth. Hospitals in major cities, including Berlin, Munich, and Frankfurt, are implementing advanced stroke diagnostics to reduce mortality and improve patient outcomes. Germany’s emphasis on innovation, high healthcare expenditure, and collaboration with diagnostic technology providers positions it as the leading country in Europe for stroke diagnostics.
U.K. Stroke Diagnostics Market Insight
The U.K. stroke diagnostics market is projected to grow at a substantial CAGR throughout the forecast period, fueled by rising stroke awareness and increasing investment in advanced imaging technologies. The widespread deployment of AI-enabled CT and MRI systems in hospitals allows for faster triage and improved patient outcomes. Public health programs emphasize rapid diagnosis and early intervention, encouraging adoption across both urban and semi-urban healthcare centers. Growing demand for integrated hospital workflows and telemedicine-supported diagnostics further strengthens market expansion. The U.K.’s robust healthcare infrastructure and trained workforce enhance the effective utilization of stroke diagnostics. Rising prevalence of lifestyle-related risk factors, such as hypertension and diabetes, also drives demand for timely stroke detection.
France Stroke Diagnostics Market Insight
The France stroke diagnostics market is expected to expand at a notable CAGR during the forecast period, primarily driven by increasing incidence of stroke and government-led preventive care initiatives. Hospitals are rapidly adopting AI-assisted imaging platforms to improve the accuracy and speed of stroke diagnosis. Public awareness campaigns on early stroke detection and rehabilitation further boost the demand for advanced diagnostic tools. The country is witnessing growth across both public and private healthcare facilities, with imaging solutions incorporated into standard hospital protocols. Expansion of stroke units in urban centers and improved access to CT and MRI systems are accelerating market penetration. Moreover, collaborations between technology providers and hospitals enhance availability of innovative diagnostic solutions.
Poland Stroke Diagnostics Market Insight
The Poland stroke diagnostics market is expected to witness the fastest CAGR during the forecast period, due to improving healthcare infrastructure, increasing access to modern imaging technologies, and rising government support for stroke prevention programs. Hospitals and clinics are upgrading to AI-integrated CT and CTA systems, improving early detection and patient triage. Public awareness campaigns and training for medical professionals on advanced stroke diagnostics accelerate adoption. Expansion of stroke care centers in smaller cities and rural areas further contributes to growth. The market is also supported by collaborations with international diagnostic solution providers. Increased healthcare spending and policy incentives for early intervention drive the rapid adoption of stroke diagnostics across Poland.
Which are the Top Companies in Europe Stroke Diagnostics Market?
The Europe Stroke Diagnostics industry is primarily led by well-established companies, including:
- Siemens Healthineers AG (Germany)
- Koninklijke Philips N.V. (Netherlands)
- GE HealthCare (U.S.)
- CANON MEDICAL SYSTEMS CORPORATION (Japan)
- Shenzhen Mindray Bio Medical Electronics Co., Ltd. (China)
- FUJIFILM Holdings Corporation (Japan)
- Analogic Corporation (U.S.)
- Aspect Imaging Ltd (Israel)
- Carestream Health (U.S.)
- Esaote S.p.A (Italy)
- Hologic, Inc. (U.S.)
- IMRIS Inc. (Canada)
- Fonar Corporation (U.S.)
- Medfield Diagnostics AB (Sweden)
- MEDTRON AG (Germany)
- SAMSUNG Medison (South Korea)
- Shenzhen Anke High Tech Co., Ltd. (China)
- Shimadzu Corporation (Japan)
- ALPINION MEDICAL SYSTEMS Co., Ltd. (South Korea)
- BPL Medical Technologies (India)
What are the Recent Developments in Europe Stroke Diagnostics Market?
- In September 2025, Brainomix’s Brainomix 360 Stroke AI imaging platform garnered attention after real‑world data demonstrated that its use significantly improved functional recovery rates and increased mechanical thrombectomy use, highlighting the growing impact of AI‑enabled diagnostics in stroke care
- In June 2025, Royal Philips announced the CE‑mark approval and Europe launch of its latest SmartCT image reconstruction solution, enabling intelligent 3D imaging in the angio suite to support faster stroke decision‑making and reduce delays during time‑critical procedures such as mechanical thrombectomy
- In March 2025, Europe‑wide discussions and pilot initiatives around faster prehospital diagnosis with innovations like mobile stroke units and rapid diagnostic techniques highlighted ongoing efforts to reduce time‑to‑diagnosis outside traditional hospital settings, indicating broader innovation momentum in stroke diagnostics
- In November 2024, Hyperfine, Inc. announced CE approval and European launch of its latest AI‑powered Swoop® portable MRI brain imaging software, enabling faster, high‑quality MR imaging across diverse healthcare settings, which supports critical diagnostic decisions in time‑sensitive conditions such as stroke by improving access to rapid MRI scans in emergency departments and expanding advanced brain imaging capabilities across Europe
- In October 2024, Siemens Healthineers co‑led the EU‑funded UMBRELLA project launch, a €26.9 million pan‑European initiative aimed at improving stroke care pathways through digitalization, AI‑supported algorithms, and real‑world data to enhance diagnosis, treatment, and outcomes across hospitals in multiple European countries
SKU-

- Interactive Data Analysis Dashboard
- Company Analysis Dashboard for high growth potential opportunities
- Research Analyst Access for customization & queries
- Competitor Analysis with Interactive dashboard
- Latest News, Updates & Trend analysis
- Harness the Power of Benchmark Analysis for Comprehensive Competitor Tracking
Data collection and base year analysis are done using data collection modules with large sample sizes. The stage includes obtaining market information or related data through various sources and strategies. It includes examining and planning all the data acquired from the past in advance. It likewise envelops the examination of information inconsistencies seen across different information sources. The market data is analysed and estimated using market statistical and coherent models. Also, market share analysis and key trend analysis are the major success factors in the market report. To know more, please request an analyst call or drop down your inquiry.
The key research methodology used by DBMR research team is data triangulation which involves data mining, analysis of the impact of data variables on the market and primary (industry expert) validation. Data models include Vendor Positioning Grid, Market Time Line Analysis, Market Overview and Guide, Company Positioning Grid, Patent Analysis, Pricing Analysis, Company Market Share Analysis, Standards of Measurement, Global versus Regional and Vendor Share Analysis. To know more about the research methodology, drop in an inquiry to speak to our industry experts.
Data Bridge Market Research is a leader in advanced formative research. We take pride in servicing our existing and new customers with data and analysis that match and suits their goal. The report can be customized to include price trend analysis of target brands understanding the market for additional countries (ask for the list of countries), clinical trial results data, literature review, refurbished market and product base analysis. Market analysis of target competitors can be analyzed from technology-based analysis to market portfolio strategies. We can add as many competitors that you require data about in the format and data style you are looking for. Our team of analysts can also provide you data in crude raw excel files pivot tables (Fact book) or can assist you in creating presentations from the data sets available in the report.


