
Europe Trash Bags Market
Market Size in USD Billion
 USD
3.23 Billion
USD
4.92 Billion
2024
2032
USD
3.23 Billion
USD
4.92 Billion
2024
2032
| 2025 - 2032 | |
| USD 3.23 Billion | |
| USD 4.92 Billion | |
| % | |
Trash Bags Market Analysis
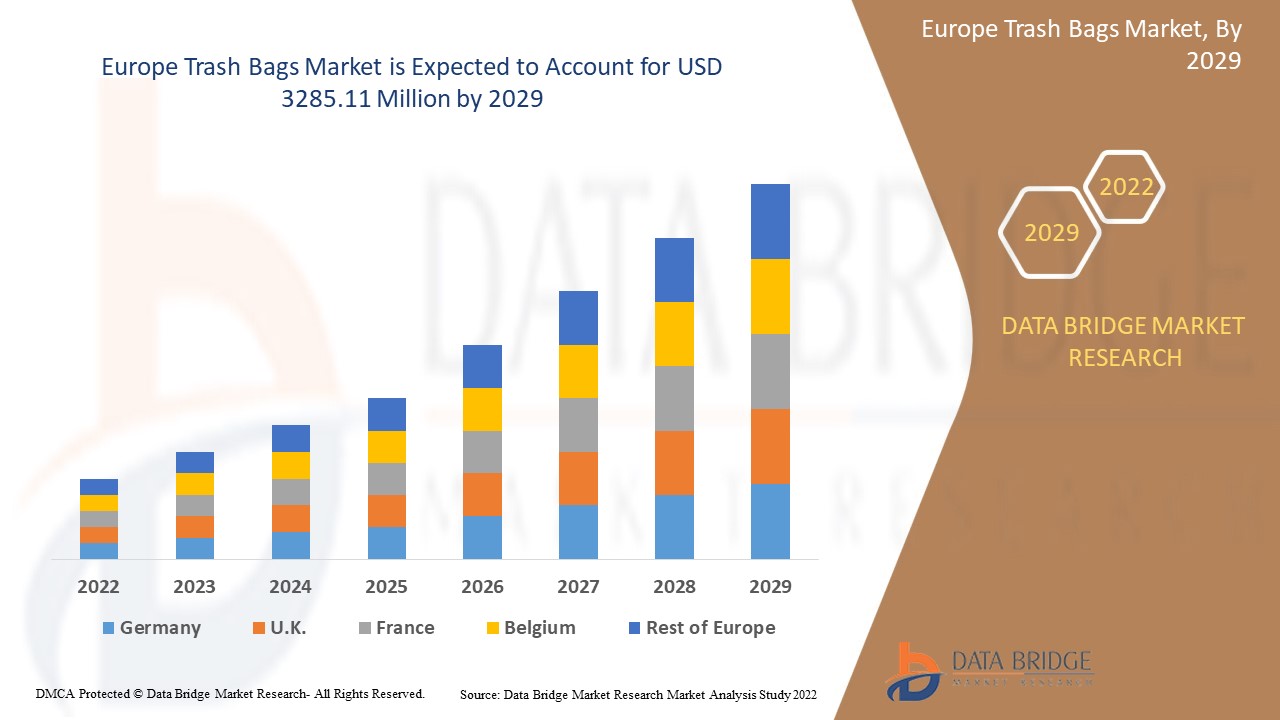
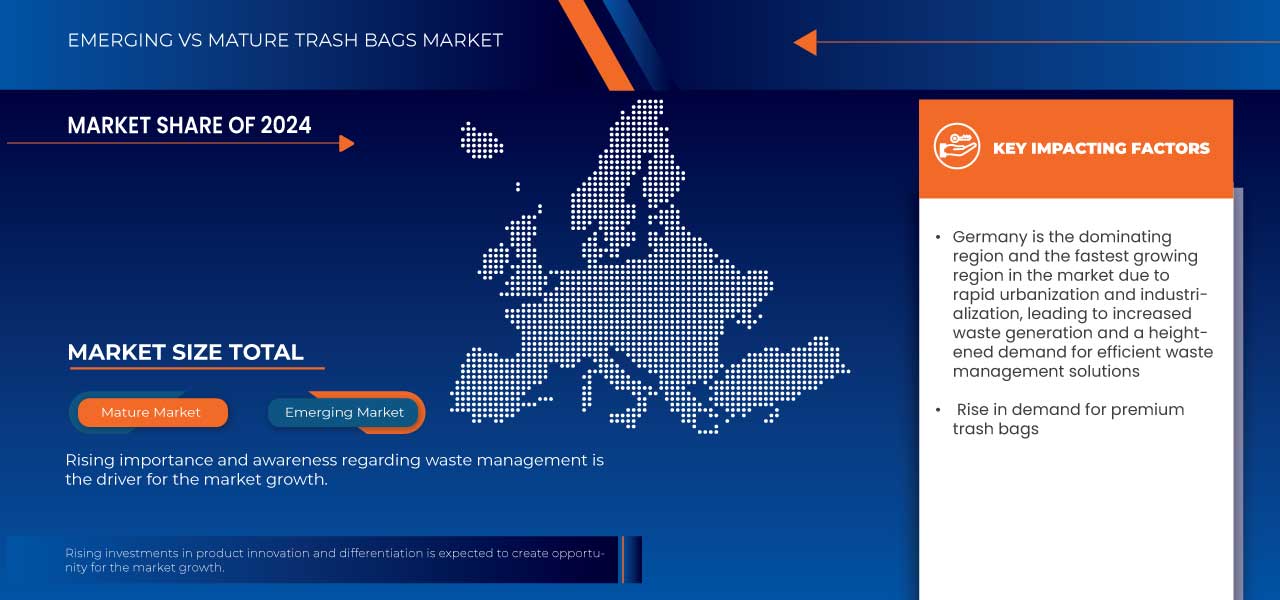
The Europe trash bags market is growing steadily, driven by increasing urbanization, rising waste generation, and heightened environmental awareness. Key segments include biodegradable and non-biodegradable bags, with demand for eco-friendly options surging due to stricter regulations and consumer preferences for sustainable products. Industries such as healthcare, hospitality, and retail contribute significantly to market growth. Europe dominate the eco-friendly segment. Key players focus on innovations, such as compostable materials and enhanced durability, to gain competitive edges. Challenges include fluctuating raw material costs and managing environmental impacts. The market outlook remains positive, bolstered by governmental initiatives and the adoption of circular economy practices.
Trash Bags Market Size
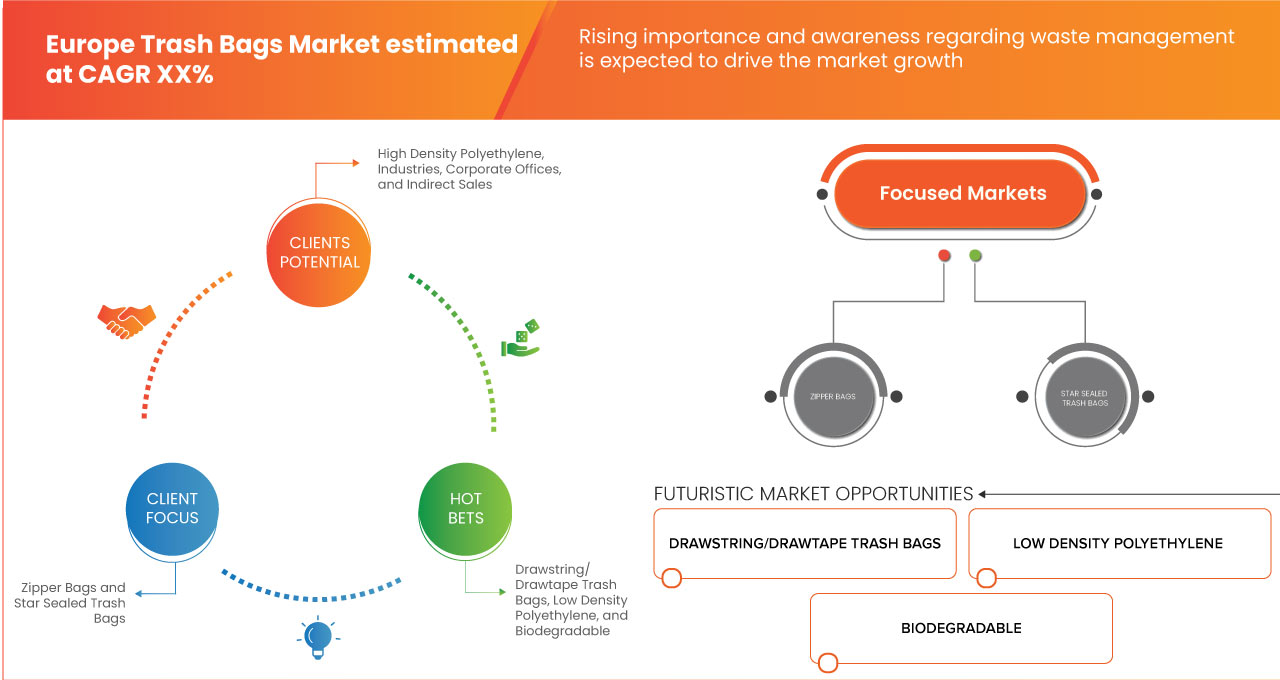
The Europe trash bags market is expected to reach USD 4.92 billion by 2032 from USD 3.23 billion in 2024, growing with a substantial CAGR of 5.46% in the forecast period of 2025 to 2032. In addition to the insights on market scenarios such as market value, growth rate, segmentation, geographical coverage, and major players, the market reports curated by the Data Bridge Market Research also include import export analysis, production capacity overview, production consumption analysis, price trend analysis, climate change scenario, supply chain analysis, value chain analysis, raw material/consumables overview, vendor selection criteria, PESTLE Analysis, Porter Analysis, and regulatory framework.
Trash Bags Market Trends
“Rise in Demand for Premium Trash Bags”
There is a noticeable trend towards premiumization in the trash bags market, driven by factors such as rising disposable incomes, urbanization, and consumer preferences for quality and convenience. Consumers are increasingly willing to pay a premium for trash bags with advanced features and superior performance. Premium trash bags often offer benefits such as extra strength, leak-proof seals, odor control, and attractive designs.
Consumers are becoming aware of the importance of odor-resistant, eco-friendly, and durable waste disposal solutions. This is leading to a shift from traditional options to premium-quality garbage bags. Moreover, premium trash bags are perceived as a symbol of quality and reliability, influencing purchasing decisions among discerning consumers. As a result, manufacturers are investing in product innovation and differentiation to cater to this growing demand for premium trash bags, offering a wide range of options to meet varying consumer needs and preferences.
Report Scope and Trash Bags Market Segmentation
|
Attributes |
Trash Bags Key Market Insights |
|
Segments Covered |
|
|
Countries Covered |
Germany, U.K., France, Italy, Russia, Spain, Belgium, Switzerland, Netherlands, Turkey, and rest of Europe |
|
Key Market Players |
Berry Global Inc. (U.S.), The Clorox Company (U.S.), Reynolds Consumer Products (U.S.), Novolex (U.S.), Cosmoplast UAE (U.A.E), Dumil (Netherlands), BioBag International AS. (Norway), NOVPLASTA CZ, s.r.o. (Czech republic), NaturTrust (Subsidiary of Holostik group) (U.S.), and TERDEX GmbH (Germany) |
|
Market Opportunities |
|
|
Value Added Data Infosets |
In addition to the insights on market scenarios such as market value, growth rate, segmentation, geographical coverage, and major players, the market reports curated by the Data Bridge Market Research also include import export analysis, production capacity overview, production consumption analysis, price trend analysis, climate change scenario, supply chain analysis, value chain analysis, raw material/consumables overview, vendor selection criteria, PESTLE Analysis, Porter Analysis, and regulatory framework. |
Trash Bags Market Definition
Trash bags, also known as garbage bags or refuse sacks, are large, flexible bags primarily used for containing and disposing of waste materials. Typically made from durable plastic materials such as polyethylene, these bags are designed to securely hold various types of trash, including household, industrial, or commercial waste. They come in various sizes, thicknesses, and colors to accommodate different types and volumes of garbage. Trash bags often feature drawstrings, tie flaps, or twist ties to facilitate easy closure and transportation. They are an essential tool for maintaining cleanliness and sanitation in homes, workplaces, and public areas by providing a convenient means of waste disposal.
Trash Bags Market Dynamics
Drivers
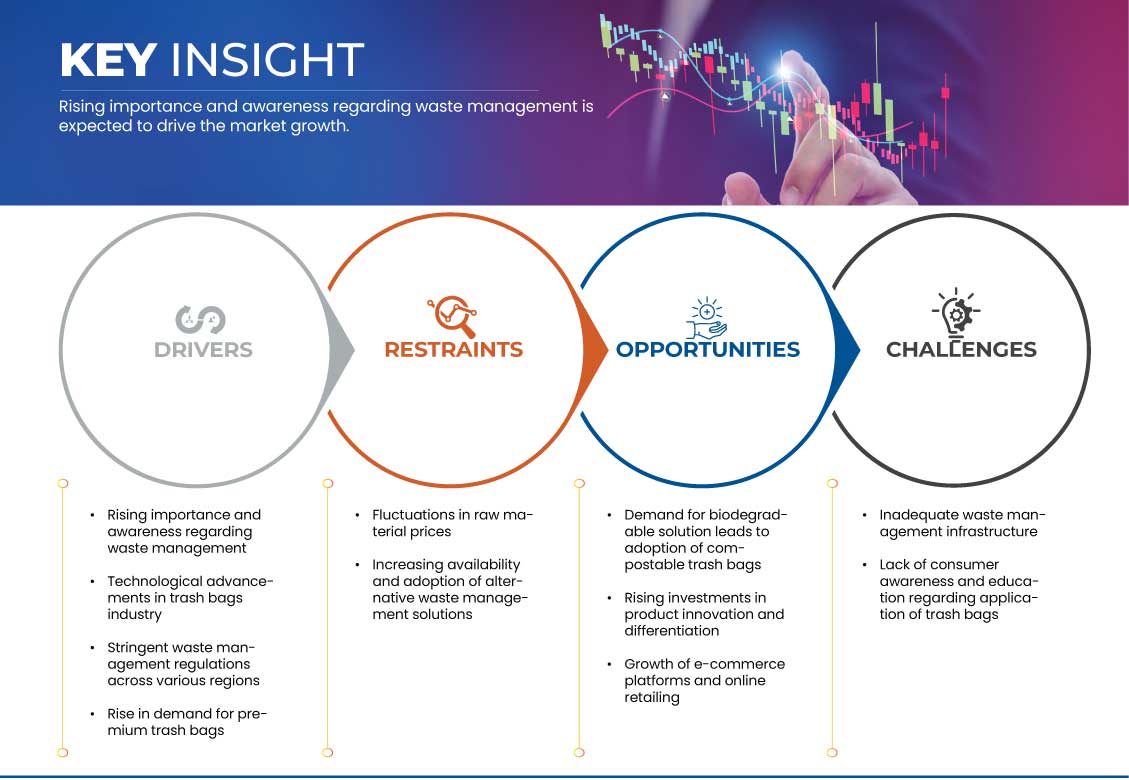
- Rising Importance and Awareness Regarding Waste Management
Global attention towards waste management has intensified significantly due to growing environmental concerns, particularly related to plastic pollution. Improper waste management has a significant impact on the environment and human health. Waste that is not disposed of properly can pollute the air, water, and soil, leading to severe environmental degradation. It can also harm wildlife and marine life, which can have a cascading impact on the food chain. The release of greenhouse gases from waste decomposition contributes to climate change, which is one of the biggest challenges. Improper waste management can also have a significant impact on human health. Exposure to hazardous waste can cause respiratory problems, skin irritation, and other health issues
For instance,
In June 2022, as per a study published by Elsevier B.V., the rate of generation of solid waste from the major cities of the globe to 1.3 thousand tons/year, and the figure is expected to reach 2.2 thousand tons/year by 2025. This is equivalent to an increase from 1.2 kg/capita/day to 1.42 kg/capita/day, assuming a global urban population of 4.3 thousand in 2025.
- Technological Advancements In Trash Bags Industry
Technological advancements have revolutionized the trash bags industry, enabling manufacturers to develop innovative products with enhanced properties and sustainability features. Advanced manufacturing techniques, such as blown film extrusion and multi-layer co-extrusion, allow for the production of trash bags with superior strength, puncture resistance, and tear resistance.
Furthermore, developments in polymer science have led to the creation of biodegradable and compostable plastics derived from renewable sources such as plant-based polymers and bio-based resins. Smart packaging solutions, incorporating technologies such as RFID tags and QR codes, enable real-time tracking of inventory, supply chain visibility, and product authentication.
For Instance,
In April 2023, Microban International and Berry Global announced a partnership to launch a line of Color Scents scented trash bags with antimicrobial technology. The partnership combines Microban’s market-leading expertise in antimicrobial technologies with Berry Global’s manufacturing capabilities. The new additions to the Color Scents family of products are available in three different sizes – catering for all household waste needs – and combine a choice of four subtle scents with Microban antimicrobial technology to protect against the growth of odor-causing bacteria.
Opportunities
- Demand for Biodegradable Solution Leads to Adoption of Compostable Trash Bags
The growing demand for biodegradable and environmentally friendly products presents significant opportunities for the adoption of compostable trash bags in the market. Consumers are increasingly seeking sustainable alternatives to traditional plastic bags, driven by environmental concerns and regulatory pressures. Compostable trash bags, made from renewable materials such as plant-based polymers, offer a viable solution to reduce plastic waste and promote circular economy principles. There is a growing consumer preference for compostable trash bags, particularly in North America and European regions, which have stringent waste management regulations and strong environmental awareness. Manufacturers can capitalize on this trend by expanding their product offerings to include compostable options, catering to the evolving needs and preferences of eco-conscious consumers.
For instance,
In August 2020, UNNI launched Compostable Trash Bags, which are 100% biodegradable trash bags made from plant starches that do not contain polyethylene. The product is certified by the Biodegradable Products Institute (BPI). This means that it can be disposed of in commercial compost sites.
- Rising Investments in Product Innovation and Differentiation
The trash bags market presents opportunities for manufacturers to differentiate their products through investments in product innovation and differentiation. With increasing competition and price pressures, innovation is key to gaining a competitive edge and sustaining growth in the market. Manufacturers are investing in research and development to develop new materials, formulations, and features that enhance the performance, durability, and sustainability of trash bags. This includes the development of advanced technologies such as biodegradable polymers, antimicrobial additives, and odor-control properties.
Trash bag manufacturers often engage in product innovation to differentiate themselves in the market. This may include the development of bags with specific features such as odor control, extra strength, drawstrings, recyclability, environmental sustainability, and ventilation holes. The market is heavily influenced by factors such as population growth, urbanization, waste management practices, and consumer preferences. Innovations like the Ventilated Trash Bag will inevitably enhance growth.
Restraints/Challenges
- Fluctuations in Raw Material Prices
Raw materials are considered one of the essential elements in the production process because the availability of raw materials at the appropriate cost and without price fluctuation makes the production process within the organization more flexible and more manageable. Raw materials prices can fluctuate greatly due to a variety of factors, including supply and demand, natural disasters, political instability, and currency fluctuations. The trash bags market is significantly influenced by fluctuations in raw material prices, primarily petroleum-based plastics such as Polyethylene (PE). The cost of polyethylene resin, which is a key raw material for trash bag manufacturing, is subject to volatility due to factors such as changes in crude oil prices, supply-demand imbalances, and geopolitical tensions.
For instance,
In January 2024, according to an article published by A-Pac Manufacturing Co., Inc., The U.S. government pushed consumers toward renewable resources, which limited supply and added costs to purchasing materials like polyethylene. This effort mostly caused polyethylene prices to rise, accommodating for added production costs.
- Inadequate Waste Management Infrastructure
Inadequate waste management infrastructure in certain regions is a major challenge for the trash bags market. Inadequate waste collection, segregation, and recycling facilities limit the effectiveness of waste management practices and impact the adoption of trash bags for proper waste disposal. Many developing countries lack sufficient infrastructure and resources for waste management, leading to issues such as littering, illegal dumping, and environmental pollution. In areas with poor waste management infrastructure, access to trash bags may be limited. Local stores may not stock a variety of options, and consumers may struggle to find suitable products. This scarcity can hinder the adoption of trash bags as consumers resort to alternative methods for waste containment.
Moreover, in regions where waste management infrastructure is lacking, the cost of trash bags may be higher due to supply chain challenges or the need for specialized distribution networks. Higher prices can discourage consumers from purchasing trash bags, leading them to opt for cheaper but less environmentally friendly alternatives or reuse existing bags, impacting adoption rates. Without adequate recycling facilities, consumers may be less inclined to use trash bags made from recyclable materials. Concerns about environmental impact and sustainability may lead consumers to avoid purchasing products that they cannot recycle or dispose of properly, further hindering adoption.
For instance,
In December 2020, according to a study published by Elsevier B.V., in India, approximately 143,449 MT of Municipal Solid Waste (MSW) was being generated daily, out of which only 111,000 Metric tonnes were collected, and about 35,602 Metric tonnes were treated.
This market report provides details of new recent developments, trade regulations, import-export analysis, production analysis, value chain optimization, market share, impact of domestic and localized market players, analyses opportunities in terms of emerging revenue pockets, changes in market regulations, strategic market growth analysis, market size, category market growths, application niches and dominance, product approvals, product launches, geographic expansions, technological innovations in the market. To gain more info on the market contact Data Bridge Market Research for an Analyst Brief, our team will help you take an informed market decision to achieve market growth.
Impact and Current Market Scenario of Raw Material Shortage and Shipping Delays
Data Bridge Market Research offers a high-level analysis of the market and delivers information by keeping in account the impact and current market environment of raw material shortage and shipping delays. This translates into assessing strategic possibilities, creating effective action plans, and assisting businesses in making important decisions.
Apart from the standard report, we also offer in-depth analysis of the procurement level from forecasted shipping delays, distributor mapping by region, commodity analysis, production analysis, price mapping trends, sourcing, category performance analysis, supply chain risk management solutions, advanced benchmarking, and other services for procurement and strategic support.
Expected Impact of Economic Slowdown on the Pricing and Availability of Products
When economic activity slows, industries begin to suffer. The forecasted effects of the economic downturn on the pricing and accessibility of the products are taken into account in the market insight reports and intelligence services provided by DBMR. With this, our clients can typically keep one step ahead of their competitors, project their sales and revenue, and estimate their profit and loss expenditures.
Trash Bags Market Scope
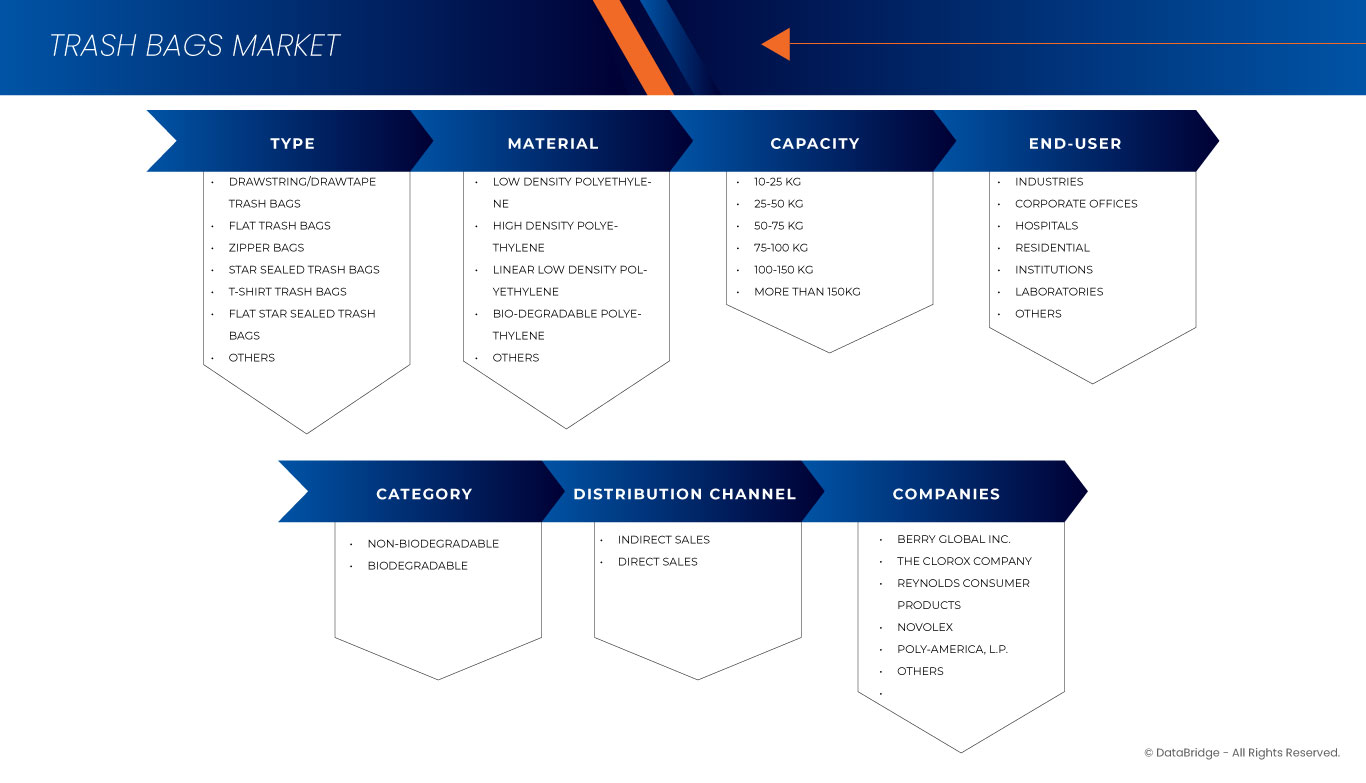
The market is segmented on the basis of type, material, capacity, end-user, category, and distribution channel. The growth amongst these segments will help you analyze meagre growth segments in the industries and provide the users with a valuable market overview and market insights to help them make strategic decisions for identifying core market applications.
Type
- Drawstring/Drawtape Trash Bags
- Flat Trash Bags
- Zipper Bags
- Star Sealed Trash Bags
- T-Shirt Trash Bags
- By Type
- Block T-Shirt Bags
- T-Shirt Knot Bags
- C-Fold T-Shirt Bags
- By Type
- Flat Star Sealed Trash Bags
- Others
Material
- Low Density Polyethylene
- High Density Polyethylene
- Linear Low Density Polyethylene
- Bio-Degradable Polyethylene
- Others
Capacity
- 10-25 Kg
- 25-50 Kg
- 50-75 Kg
- 75-100 Kg
- 100-150 Kg
- More Than 150kg
End-User
- Industries
- By Type
- Drawstring/Drawtape Trash Bags
- Flat Trash Bags
- Zipper Bags
- Star Sealed Trash Bags
- T-Shirt Trash Bags
- Flat Star Sealed Trash Bags
- Others
- By Type
- Corporate Offices
- By Type
- Drawstring/Drawtape Trash Bags
- Flat Trash Bags
- Zipper Bags
- Star Sealed Trash Bags
- T-Shirt Trash Bags
- Flat Star Sealed Trash Bags
- Others
- By Type
- Hospitals
- By Type
- Drawstring/Drawtape Trash Bags
- Flat Trash Bags
- Zipper Bags
- Star Sealed Trash Bags
- T-Shirt Trash Bags
- Flat Star Sealed Trash Bags
- Others
- By Type
- Residential
- By Type
- Drawstring/Drawtape Trash Bags
- Flat Trash Bags
- Zipper Bags
- Star Sealed Trash Bags
- T-Shirt Trash Bags
- Flat Star Sealed Trash Bags
- Others
- By Type
- Institutions
- By Type
- Drawstring/Drawtape Trash Bags
- Flat Trash Bags
- Zipper Bags
- Star Sealed Trash Bags
- T-Shirt Trash Bags
- Flat Star Sealed Trash Bags
- Others
- By Type
- Laboratories
- By Type
- Drawstring/Drawtape Trash Bags
- Flat Trash Bags
- Zipper Bags
- Star Sealed Trash Bags
- T-Shirt Trash Bags
- Flat Star Sealed Trash Bags
- Others
- By Type
- Others
- By Type
- Drawstring/Drawtape Trash Bags
- Flat Trash Bags
- Zipper Bags
- Star Sealed Trash Bags
- T-Shirt Trash Bags
- Flat Star Sealed Trash Bags
- Others
- By Type
Category
- Non-Biodegradable
- Biodegradable
Distribution Channel
- Indirect Sales
- Offline
- By Type
- Supermarkets / Hypermarkets
- Convenience Stores
- Specialty Stores
- Others
- By Type
- Online
- By Type
- E-Commerce
- Company Owned Websites
- Direct Sales
- By Type
- Offline
Trash Bags Market Regional Analysis
The market is analyzed and market size insights and trends are provided by country, type, material, capacity, end-user, category, and distribution channel as referenced above.
The countries covered in the market are Germany, U.K., France, Italy, Russia, Spain, Belgium, Switzerland, Netherlands, Turkey, and rest of Europe.
Germany is expected to dominate the market due to its rapid urbanization, population growth, industrialization, and rising environmental awareness.
The country section of the report also provides individual market impacting factors and changes in regulation in the market domestically that impacts the current and future trends of the market. Data points like down-stream and upstream value chain analysis, technical trends and porter's five forces analysis, case studies are some of the pointers used to forecast the market scenario for individual countries. Also, the presence and availability of Europe brands and their challenges faced due to large or scarce competition from local and domestic brands, impact of domestic tariffs and trade routes are considered while providing forecast analysis of the country data.
Trash Bags Market Share
The market competitive landscape provides details by competitors. Details included are company overview, company financials, revenue generated, market potential, investment in research and development, new market initiatives, Europe presence, production sites and facilities, production capacities, company strengths and weaknesses, product launch, product width and breadth, application dominance. The above data points provided are only related to the companies' focus related to market.
Trash Bags Market Leaders Operating in the Market Are:
- Berry Global Inc. (U.S.)
- The Clorox Company (U.S.)
- Reynolds Consumer Products (U.S.)
- Novolex (U.S.)
- Cosmoplast UAE (U.A.E)
- Dumil (Netherlands)
- BioBag International AS. (Norway)
- NOVPLASTA CZ, s.r.o. (Czech republic)
- NaturTrust (Subsidiary of Holostik group) (U.S.)
- TERDEX GmbH (Germany)
Latest Developments in Trash Bags Market
- In March 2024, Reynolds Consumer Products announced that Hefty Ultra Strong Fabuloso Scented tall kitchen trash bags have been recognized as one of the 2022 New Product Pacesetters of 2022. The 28th annual report, published by Circana, reveals the top new product launches across the food, beverage and non-food industries. It will attract customer base for the company and will eventually add in the revenue
- In March 2024, Inteplast Group received ISCC (International Sustainability & Carbon Certification) PLUS certification at the following facilities: Gray Court, SC; Lolita, TX; and Morristown, TN. Inteplast BOPP Films now will be able to produce and supply ISCC-certified materials that are attributed via a mass balance approach. This makes the company one of the first BOPP film manufacturers to hold the ISCC PLUS designation in North America
- In April 2023, Microban International and Berry Global partnered to launch Color Scents scented trash bags with antimicrobial technology. The collaboration combined Microban's expertise with Berry Global's manufacturing capabilities. The new bags, available in three sizes, featured four subtle scents and Microban antimicrobial technology to combat odor-causing bacteria
- In May 2022, Berry Global introduced a new range of high-strength refuse sacks made from recycled plastics. The sacks, produced from tough agricultural plastic waste, were manufactured at Berry Global's facility in Heanor, Derbyshire. Collected through the APE UK scheme, the aim was to increase recycling of non-packaging agricultural plastics to over 70% within five years. These RecyClass certified sacks, available in Tie Top and Tie Handle versions, are now sold in Sainsbury’s supermarkets
- In June 2020, Polykar, completed the expansion of its recycling department in June 2020. The upgrade increased recycling capacity to 10,000 tons annually, diverting more plastic waste from landfills. With state-of-the-art machines, Polykar can now recycle complex materials previously sent to landfills, contributing to its commitment to sustainability. This investment strengthens Polykar's position in the recycled garbage bag market, utilizing recycled resins across its product portfolio
SKU-

- Interactive Data Analysis Dashboard
- Company Analysis Dashboard for high growth potential opportunities
- Research Analyst Access for customization & queries
- Competitor Analysis with Interactive dashboard
- Latest News, Updates & Trend analysis
- Harness the Power of Benchmark Analysis for Comprehensive Competitor Tracking
Table of Content
1 INTRODUCTION
1.1 OBJECTIVES OF THE STUDY
1.2 MARKET DEFINITION
1.3 OVERVIEW
1.4 LIMITATIONS
1.5 MARKETS COVERED
2 MARKET SEGMENTATION
2.1 MARKETS COVERED
2.2 GEOGRAPHICAL SCOPE
2.3 YEARS CONSIDERED FOR THE STUDY
2.4 CURRENCY AND PRICING
2.5 DBMR TRIPOD DATA VALIDATION MODEL
2.6 MULTIVARIATE MODELING
2.7 PRIMARY INTERVIEWS WITH KEY OPINION LEADERS
2.8 DBMR MARKET POSITION GRID
2.9 MARKET END-USER COVERAGE GRID
2.1 SECONDARY SOURCES
2.11 ASSUMPTIONS
3 EXECUTIVE SUMMARY
4 PREMIUM INSIGHTS
4.1 PESTLE ANALYSIS
4.1.1 POLITICAL FACTORS
4.1.2 ECONOMIC FACTORS
4.1.3 SOCIAL FACTORS
4.1.4 TECHNOLOGICAL FACTORS
4.1.5 ENVIRONMENTAL FACTORS
4.1.6 LEGAL FACTORS
4.2 PORTER’S FIVE FORCES
4.2.1 THREAT OF NEW ENTRANTS
4.2.2 THREAT OF SUBSTITUTES
4.2.3 BARGAINING POWER OF BUYERS
4.2.4 BARGAINING POWER OF SUPPLIERS
4.2.5 COMPETITIVE RIVALRY
4.3 VENDOR SELECTION CRITERIA
4.3.1 MATERIAL SOURCING AND QUALITY
4.3.2 MANUFACTURING CAPABILITIES
4.3.3 SUSTAINABILITY PRACTICES
4.3.4 SUPPLY CHAIN RELIABILITY
4.3.5 COST COMPETITIVENESS
4.3.6 FLEXIBILITY AND COLLABORATION
4.3.7 ETHICAL AND SOCIAL RESPONSIBILITY
4.3.8 TRACK RECORD AND REPUTATION
4.4 SUPPLY CHAIN ANALYSIS
4.4.1 OVERVIEW
4.4.1.1 RAW MATERIAL PROCUREMENT
4.4.1.2 MANUFACTURING
4.4.1.3 DISTRIBUTION
4.4.1.4 RETAILING
4.4.2 LOGISTIC COST SCENARIO
4.4.3 IMPORTANCE OF LOGISTICS SERVICE PROVIDERS
4.5 CLIMATE CHANGE SCENARIO
4.5.1 ENVIRONMENTAL CONCERNS
4.5.1.1 RAW MATERIAL SOURCING AND SUSTAINABILITY
4.5.1.2 PRODUCT DESIGN AND ECO-FRIENDLY PACKAGING
4.5.1.3 MANUFACTURING PROCESSES AND ENERGY EFFICIENCY
4.5.1.4 RECYCLING AND CIRCULAR ECONOMY INITIATIVES
4.5.1.5 REGULATORY COMPLIANCE AND EMISSION REDUCTION TARGETS
4.5.2 INDUSTRY RESPONSE
4.5.3 GOVERNMENT’S ROLE
4.5.4 ANALYST RECOMMENDATION
4.6 RAW MATERIAL COVERAGE
4.6.1 POLYETHYLENE (PE)
4.6.2 RECYCLED PLASTICS
4.6.3 BIODEGRADABLE AND COMPOSTABLE MATERIALS
4.6.4 BIO-BASED PLASTICS
4.6.5 OTHER ADDITIVES AND FILLERS
4.7 TECHNOLOGICAL ADVANCEMENTS BY MANUFACTURERS
4.7.1 DEVELOPMENT OF SUSTAINABLE MATERIALS
4.7.2 IMPROVED MANUFACTURING PROCESSES
4.7.3 SMART PACKAGING SOLUTIONS
4.7.4 ANTIMICROBIAL AND ODOR-CONTROL TECHNOLOGIES
4.7.5 RECYCLING AND CIRCULAR ECONOMY INITIATIVES
4.7.6 BIODEGRADATION ENHANCEMENT
4.7.7 LIFE CYCLE ASSESSMENT (LCA) TOOLS
5 REGULATION COVERAGE
6 MARKET OVERVIEW
6.1 DRIVERS
6.1.1 RISING IMPORTANCE AND AWARENESS REGARDING WASTE MANAGEMENT
6.1.2 TECHNOLOGICAL ADVANCEMENTS IN TRASH BAGS INDUSTRY
6.1.3 STRINGENT WASTE MANAGEMENT REGULATIONS ACROSS VARIOUS REGIONS
6.1.4 RISE IN DEMAND FOR PREMIUM TRASH BAGS
6.2 RESTRAINTS
6.2.1 FLUCTUATIONS IN RAW MATERIAL PRICES
6.2.2 INCREASING AVAILABILITY AND ADOPTION OF ALTERNATIVE WASTE MANAGEMENT SOLUTIONS
6.3 OPPORTUNITIES
6.3.1 DEMAND FOR BIODEGRADABLE SOLUTION LEADS TO ADOPTION OF COMPOSTABLE TRASH BAGS
6.3.2 RISING INVESTMENTS IN PRODUCT INNOVATION AND DIFFERENTIATION
6.3.3 GROWTH OF E-COMMERCE PLATFORMS AND ONLINE RETAILING
6.4 CHALLENGES
6.4.1 INADEQUATE WASTE MANAGEMENT INFRASTRUCTURE
6.4.2 LACK OF CONSUMER AWARENESS AND EDUCATION REGARDING APPLICATION OF TRASH BAGS
7 EUROPE TRASH BAGS MARKET, BY TYPE
7.1 OVERVIEW
7.2 DRAWSTRING/DRAWTAPE TRASH BAGS
7.3 FLAT TRASH BAGS
7.4 ZIPPER BAGS
7.5 STAR SEALED TRASH BAGS
7.6 T-SHIRT TRASH BAGS
7.7 FLAT STAR SEALED TRASH BAGS
7.8 OTHERS
8 EUROPE TRASH BAGS MARKET, BY MATERIAL
8.1 OVERVIEW
8.2 LOW DENSITY POLYETHYLENE
8.3 HIGH DENSITY POLYETHYLENE
8.4 LINEAR LOW DENSITY POLYETHYLENE
8.5 BIO-DEGRADABLE POLYETHYLENE
8.6 OTHERS
9 EUROPE TRASH BAGS MARKET, BY CAPACITY
9.1 OVERVIEW
9.2 10-25 KG
9.3 25-50 KG
9.4 50-75 KG
9.5 75-100 KG
9.6 100-150 KG
9.7 MORE THAN 150KG
10 EUROPE TRASH BAGS MARKET, BY END-USER
10.1 OVERVIEW
10.2 INDUSTRIES
10.3 CORPORATE OFFICES
10.4 HOSPITALS
10.5 RESIDENTIAL
10.6 INSTITUTIONS
10.7 LABORATORIES
10.8 OTHERS
11 EUROPE TRASH BAGS MARKET, BY CATEGORY
11.1 OVERVIEW
11.2 NON-BIODEGRADABLE
11.3 BIODEGRADABLE
12 EUROPE TRASH BAGS MARKET, BY DISTRIBUTION CHANNEL
12.1 OVERVIEW
12.2 INDIRECT SALES
12.3 DIRECT SALES
13 EUROPE TRASH BAGS MARKET, BY COUNTRY
13.1 EUROPE
13.1.1 GERMANY
13.1.2 U.K
13.1.3 FRANCE
13.1.4 ITALY
13.1.5 RUSSIA
13.1.6 SPAIN
13.1.7 BELGIUM
13.1.8 SWITZERLAND
13.1.9 NETHERLANDS
13.1.10 TURKEY
13.1.11 REST OF EUROPE
14 EUROPE TRASH BAGS MARKET: COMPANY LANDSCAPE
14.1 COMPANY SHARE ANALYSIS: EUROPE
15 SWOT ANALYSIS
16 COMPANY PROFILE
16.1 BERRY EUROPE INC.
16.1.1 COMPANY SNAPSHOT
16.1.2 REVENUE ANALYSIS
16.1.3 COMPANY SHARE ANALYSIS
16.1.4 PRODUCT PORTFOLIO
16.1.5 RECENT DEVELOPMENTS
16.2 NOVOLEX
16.2.1 COMPANY SNAPSHOT
16.2.2 COMPANY SHARE ANALYSIS
16.2.3 PRODUCT PORTFOLIO
16.2.4 RECENT DEVELOPMENTS
16.3 THE CLOROX COMPANY
16.3.1 COMPANY SNAPSHOT
16.3.2 REVENUE ANALYSIS
16.3.3 COMPANY SHARE ANALYSIS
16.3.4 PRODUCT PORTFOLIO
16.3.5 RECENT DEVELOPMENTS
16.4 REYNOLDS CONSUMER PRODUCTS
16.4.1 COMPANY SNAPSHOT
16.4.2 REVENUE ANALYSIS
16.4.3 COMPANY SHARE ANALYSIS
16.4.4 PRODUCT PORTFOLIO
16.4.5 RECENT DEVELOPMENTS
16.5 BIOBAG INTERNATIONAL AS.
16.5.1 COMPANY SNAPSHOT
16.5.2 PRODUCT PORTFOLIO
16.5.3 RECENT DEVELOPMENTS
16.6 COSMOPLAST UAE
16.6.1 COMPANY SNAPSHOT
16.6.2 PRODUCT PORTFOLIO
16.6.3 RECENT DEVELOPMENT
16.7 DUMIL
16.7.1 COMPANY SNAPSHOT
16.7.2 PRODUCT PORTFOLIO
16.7.3 RECENT DEVELOPMENT
16.8 NOVPLASTA CZ, S.R.O.
16.8.1 COMPANY SNAPSHOT
16.8.2 PRODUCT PORTFOLIO
16.8.3 RECENT DEVELOPMENT
16.9 TERDEX GMBH
16.9.1 COMPANY SNAPSHOT
16.9.2 PRODUCT PORTFOLIO
16.9.3 RECENT DEVELOPMENT
17 QUESTIONNAIRE
18 RELATED REPORTS
List of Table
TABLE 1 EUROPE TRASH BAGS MARKET: BY TYPE, 2018-2032 (KILO TONS)
TABLE 2 EUROPE TRASH BAGS MARKET, BY TYPE, 2018-2032 (USD THOUSAND)
TABLE 3 EUROPE T-SHIRT TRASH BAGS IN TRASH BAG MARKET, BY T-SHIRT TRASH BAGS TYPE, 2018-2032 (USD THOUSAND)
TABLE 4 EUROPE TRASH BAG MARKET, BY MATERIAL, 2018-2032 (USD THOUSAND)
TABLE 5 EUROPE TRASH BAG MARKET, BY CAPACITY, 2018-2032 (USD THOUSAND)
TABLE 6 EUROPE TRASH BAG MARKET, BY END-USER, 2018-2032 (USD THOUSAND)
TABLE 7 EUROPE INDUSTRIES IN TRASH BAG MARKET, BY TYPE, 2018-2032 (USD THOUSAND)
TABLE 8 EUROPE CORPORATE OFFICES IN TRASH BAG MARKET, BY TYPE, 2018-2032 (USD THOUSAND)
TABLE 9 EUROPE HOSPITALS IN TRASH BAG MARKET, BY TYPE, 2018-2032 (USD THOUSAND)
TABLE 10 EUROPE RESIDENTIAL IN TRASH BAG MARKET, BY TYPE, 2018-2032 (USD THOUSAND)
TABLE 11 EUROPE INSTITUTIONS IN TRASH BAG MARKET, BY TYPE, 2018-2032 (USD THOUSAND)
TABLE 12 EUROPE LABORATORIES IN TRASH BAG MARKET, BY TYPE, 2018-2032 (USD THOUSAND)
TABLE 13 EUROPE OTHERS IN TRASH BAG MARKET, BY TYPE, 2018-2032 (USD THOUSAND)
TABLE 14 EUROPE TRASH BAG MARKET, BY CATEGORY, 2018-2032 (USD THOUSAND)
TABLE 15 EUROPE TRASH BAG MARKET, BY DISTRIBUTION CHANNEL, 2018-2032 (USD THOUSAND)
TABLE 16 EUROPE INDIRECT SALES IN TRASH BAG MARKET, BY DISTRIBUTION CHANNEL, 2018-2032 (USD THOUSAND)
TABLE 17 EUROPE OFFLINE IN TRASH BAG MARKET, BY TYPE, 2018-2032 (USD THOUSAND)
TABLE 18 EUROPE ONLINE IN TRASH BAG MARKET, BY TYPE, 2018-2032 (USD THOUSAND)
TABLE 19 EUROPE TRASH BAGS MARKET, BY COUNTRY, 2018-2032 (KILO TONS)
TABLE 20 EUROPE TRASH BAGS MARKET, BY COUNTRY, 2018-2032 (USD THOUSAND)
TABLE 21 EUROPE TRASH BAGS MARKET, BY TYPE, 2018-2032 (KILO TONS)
TABLE 22 GERMANY TRASH BAGS MARKET, BY TYPE, 2018-2032 (KILO TONS)
TABLE 23 GERMANY TRASH BAGS MARKET, BY TYPE, 2018-2032 (USD THOUSAND)
TABLE 24 GERMANY T-SHIRT TRASH BAGS IN TRASH BAGS MARKET, BY T-SHIRT TRASH BAGS TYPE, 2018-2032 (USD THOUSAND)
TABLE 25 GERMANY TRASH BAGS MARKET, BY MATERIAL, 2018-2032 (USD THOUSAND)
TABLE 26 GERMANY TRASH BAGS MARKET, BY CAPACITY, 2018-2032 (USD THOUSAND)
TABLE 27 GERMANY TRASH BAGS MARKET, BY END-USER, 2018-2032 (USD THOUSAND)
TABLE 28 GERMANY INDUSTRIES IN TRASH BAGS MARKET, BY TYPE, 2018-2032 (USD THOUSAND)
TABLE 29 GERMANY CORPORATE OFFICES IN TRASH BAGS MARKET, BY TYPE, 2018-2032 (USD THOUSAND)
TABLE 30 GERMANY HOSPITALS IN TRASH BAGS MARKET, BY TYPE, 2018-2032 (USD THOUSAND)
TABLE 31 GERMANY RESIDENTIAL IN TRASH BAGS MARKET, BY TYPE, 2018-2032 (USD THOUSAND)
TABLE 32 GERMANY INSTITUTIONS IN TRASH BAGS MARKET, BY TYPE, 2018-2032 (USD THOUSAND)
TABLE 33 GERMANY LABORATORIES IN TRASH BAGS MARKET, BY TYPE, 2018-2032 (USD THOUSAND)
TABLE 34 GERMANY OTHERS IN TRASH BAGS MARKET, BY TYPE, 2018-2032 (USD THOUSAND)
TABLE 35 GERMANY TRASH BAGS MARKET, BY CATEGORY, 2018-2032 (USD THOUSAND)
TABLE 36 GERMANY TRASH BAGS MARKET, BY DISTRIBUTION CHANNEL, 2018-2032 (USD THOUSAND)
TABLE 37 GERMANY INDIRECT SALES IN TRASH BAGS MARKET, BY DISTRIBUTION CHANNEL, 2018-2032 (USD THOUSAND)
TABLE 38 GERMANY OFFLINE IN TRASH BAGS MARKET, BY TYPE, 2018-2032 (USD THOUSAND)
TABLE 39 GERMANY ONLINE IN TRASH BAGS MARKET, BY TYPE, 2018-2032 (USD THOUSAND)
TABLE 40 U.K TRASH BAGS MARKET, BY TYPE, 2018-2032 (KILO TONS)
TABLE 41 U.K TRASH BAGS MARKET, BY TYPE, 2018-2032 (USD THOUSAND)
TABLE 42 U.K T-SHIRT TRASH BAGS IN TRASH BAGS MARKET, BY T-SHIRT TRASH BAGS TYPE, 2018-2032 (USD THOUSAND)
TABLE 43 U.K TRASH BAGS MARKET, BY MATERIAL, 2018-2032 (USD THOUSAND)
TABLE 44 U.K TRASH BAGS MARKET, BY CAPACITY, 2018-2032 (USD THOUSAND)
TABLE 45 U.K TRASH BAGS MARKET, BY END-USER, 2018-2032 (USD THOUSAND)
TABLE 46 U.K INDUSTRIES IN TRASH BAGS MARKET, BY TYPE, 2018-2032 (USD THOUSAND)
TABLE 47 U.K CORPORATE OFFICES IN TRASH BAGS MARKET, BY TYPE, 2018-2032 (USD THOUSAND)
TABLE 48 U.K HOSPITALS IN TRASH BAGS MARKET, BY TYPE, 2018-2032 (USD THOUSAND)
TABLE 49 U.K RESIDENTIAL IN TRASH BAGS MARKET, BY TYPE, 2018-2032 (USD THOUSAND)
TABLE 50 U.K INSTITUTIONS IN TRASH BAGS MARKET, BY TYPE, 2018-2032 (USD THOUSAND)
TABLE 51 U.K LABORATORIES IN TRASH BAGS MARKET, BY TYPE, 2018-2032 (USD THOUSAND)
TABLE 52 U.K OTHERS IN TRASH BAGS MARKET, BY TYPE, 2018-2032 (USD THOUSAND)
TABLE 53 U.K. TRASH BAGS MARKET, BY CATEGORY, 2018-2032 (USD THOUSAND)
TABLE 54 U.K. TRASH BAGS MARKET, BY DISTRIBUTION CHANNEL, 2018-2032 (USD THOUSAND)
TABLE 55 U.K. INDIRECT SALES IN TRASH BAGS MARKET, BY DISTRIBUTION CHANNEL, 2018-2032 (USD THOUSAND)
TABLE 56 U.K. OFFLINE IN TRASH BAGS MARKET, BY TYPE, 2018-2032 (USD THOUSAND)
TABLE 57 U.K. ONLINE IN TRASH BAGS MARKET, BY TYPE, 2018-2032 (USD THOUSAND)
TABLE 58 FRANCE TRASH BAGS MARKET, BY TYPE, 2018-2032 (KILO TONS)
TABLE 59 FRANCE TRASH BAGS MARKET, BY TYPE, 2018-2032 (USD THOUSAND)
TABLE 60 FRANCE T-SHIRT TRASH BAGS IN TRASH BAGS MARKET, BY T-SHIRT TRASH BAGS TYPE, 2018-2032 (USD THOUSAND)
TABLE 61 FRANCE TRASH BAGS MARKET, BY MATERIAL, 2018-2032 (USD THOUSAND)
TABLE 62 FRANCE TRASH BAGS MARKET, BY CAPACITY, 2018-2032 (USD THOUSAND)
TABLE 63 FRANCE TRASH BAGS MARKET, BY END-USER, 2018-2032 (USD THOUSAND)
TABLE 64 FRANCE INDUSTRIES IN TRASH BAGS MARKET, BY TYPE, 2018-2032 (USD THOUSAND)
TABLE 65 FRANCE CORPORATE OFFICES IN TRASH BAGS MARKET, BY TYPE, 2018-2032 (USD THOUSAND)
TABLE 66 FRANCE HOSPITALS IN TRASH BAGS MARKET, BY TYPE, 2018-2032 (USD THOUSAND)
TABLE 67 FRANCE RESIDENTIAL IN TRASH BAGS MARKET, BY TYPE, 2018-2032 (USD THOUSAND)
TABLE 68 FRANCE INSTITUTIONS IN TRASH BAGS MARKET, BY TYPE, 2018-2032 (USD THOUSAND)
TABLE 69 FRANCE LABORATORIES IN TRASH BAGS MARKET, BY TYPE, 2018-2032 (USD THOUSAND)
TABLE 70 FRANCE OTHERS IN TRASH BAGS MARKET, BY TYPE, 2018-2032 (USD THOUSAND)
TABLE 71 FRANCE TRASH BAGS MARKET, BY CATEGORY, 2018-2032 (USD THOUSAND)
TABLE 72 FRANCE TRASH BAGS MARKET, BY DISTRIBUTION CHANNEL, 2018-2032 (USD THOUSAND)
TABLE 73 FRANCE INDIRECT SALES IN TRASH BAGS MARKET, BY DISTRIBUTION CHANNEL, 2018-2032 (USD THOUSAND)
TABLE 74 FRANCE OFFLINE IN TRASH BAGS MARKET, BY TYPE, 2018-2032 (USD THOUSAND)
TABLE 75 FRANCE ONLINE IN TRASH BAGS MARKET, BY TYPE, 2018-2032 (USD THOUSAND)
TABLE 76 ITALY TRASH BAGS MARKET, BY TYPE, 2018-2032 (KILO TONS)
TABLE 77 ITALY TRASH BAGS MARKET, BY TYPE, 2018-2032 (USD THOUSAND)
TABLE 78 ITALY T-SHIRT TRASH BAGS IN TRASH BAGS MARKET, BY T-SHIRT TRASH BAGS TYPE, 2018-2032 (USD THOUSAND)
TABLE 79 ITALY TRASH BAGS MARKET, BY MATERIAL, 2018-2032 (USD THOUSAND)
TABLE 80 ITALY TRASH BAGS MARKET, BY CAPACITY, 2018-2032 (USD THOUSAND)
TABLE 81 ITALY TRASH BAGS MARKET, BY END-USER, 2018-2032 (USD THOUSAND)
TABLE 82 ITALY INDUSTRIES IN TRASH BAGS MARKET, BY TYPE, 2018-2032 (USD THOUSAND)
TABLE 83 ITALY CORPORATE OFFICES IN TRASH BAGS MARKET, BY TYPE, 2018-2032 (USD THOUSAND)
TABLE 84 ITALY HOSPITALS IN TRASH BAGS MARKET, BY TYPE, 2018-2032 (USD THOUSAND)
TABLE 85 ITALY RESIDENTIAL IN TRASH BAGS MARKET, BY TYPE, 2018-2032 (USD THOUSAND)
TABLE 86 ITALY INSTITUTIONS IN TRASH BAGS MARKET, BY TYPE, 2018-2032 (USD THOUSAND)
TABLE 87 ITALY LABORATORIES IN TRASH BAGS MARKET, BY TYPE, 2018-2032 (USD THOUSAND)
TABLE 88 ITALY OTHERS IN TRASH BAGS MARKET, BY TYPE, 2018-2032 (USD THOUSAND)
TABLE 89 ITALY TRASH BAGS MARKET, BY CATEGORY, 2018-2032 (USD THOUSAND)
TABLE 90 ITALY TRASH BAGS MARKET, BY DISTRIBUTION CHANNEL, 2018-2032 (USD THOUSAND)
TABLE 91 ITALY INDIRECT SALES IN TRASH BAGS MARKET, BY DISTRIBUTION CHANNEL, 2018-2032 (USD THOUSAND)
TABLE 92 ITALY OFFLINE IN TRASH BAGS MARKET, BY TYPE, 2018-2032 (USD THOUSAND)
TABLE 93 ITALY ONLINE IN TRASH BAGS MARKET, BY TYPE, 2018-2032 (USD THOUSAND)
TABLE 94 RUSSIA TRASH BAGS MARKET, BY TYPE, 2018-2032 (KILO TONS)
TABLE 95 RUSSIA TRASH BAGS MARKET, BY TYPE, 2018-2032 (USD THOUSAND)
TABLE 96 RUSSIA T-SHIRT TRASH BAGS IN TRASH BAGS MARKET, BY T-SHIRT TRASH BAGS TYPE, 2018-2032 (USD THOUSAND)
TABLE 97 RUSSIA TRASH BAGS MARKET, BY MATERIAL, 2018-2032 (USD THOUSAND)
TABLE 98 RUSSIA TRASH BAGS MARKET, BY CAPACITY, 2018-2032 (USD THOUSAND)
TABLE 99 RUSSIA TRASH BAGS MARKET, BY END-USER, 2018-2032 (USD THOUSAND)
TABLE 100 RUSSIA INDUSTRIES IN TRASH BAGS MARKET, BY TYPE, 2018-2032 (USD THOUSAND)
TABLE 101 RUSSIA CORPORATE OFFICES IN TRASH BAGS MARKET, BY TYPE, 2018-2032 (USD THOUSAND)
TABLE 102 RUSSIA HOSPITALS IN TRASH BAGS MARKET, BY TYPE, 2018-2032 (USD THOUSAND)
TABLE 103 RUSSIA RESIDENTIAL IN TRASH BAGS MARKET, BY TYPE, 2018-2032 (USD THOUSAND)
TABLE 104 RUSSIA INSTITUTIONS IN TRASH BAGS MARKET, BY TYPE, 2018-2032 (USD THOUSAND)
TABLE 105 RUSSIA LABORATORIES IN TRASH BAGS MARKET, BY TYPE, 2018-2032 (USD THOUSAND)
TABLE 106 RUSSIA OTHERS IN TRASH BAGS MARKET, BY TYPE, 2018-2032 (USD THOUSAND)
TABLE 107 RUSSIA TRASH BAGS MARKET, BY CATEGORY, 2018-2032 (USD THOUSAND)
TABLE 108 RUSSIA TRASH BAGS MARKET, BY DISTRIBUTION CHANNEL, 2018-2032 (USD THOUSAND)
TABLE 109 RUSSIA INDIRECT SALES IN TRASH BAGS MARKET, BY DISTRIBUTION CHANNEL, 2018-2032 (USD THOUSAND)
TABLE 110 RUSSIA OFFLINE IN TRASH BAGS MARKET, BY TYPE, 2018-2032 (USD THOUSAND)
TABLE 111 RUSSIA ONLINE IN TRASH BAGS MARKET, BY TYPE, 2018-2032 (USD THOUSAND)
TABLE 112 SPAIN TRASH BAGS MARKET, BY TYPE, 2018-2032 (KILO TONS)
TABLE 113 SPAIN TRASH BAGS MARKET, BY TYPE, 2018-2032 (USD THOUSAND)
TABLE 114 SPAIN T-SHIRT TRASH BAGS IN TRASH BAGS MARKET, BY T-SHIRT TRASH BAGS TYPE, 2018-2032 (USD THOUSAND)
TABLE 115 SPAIN TRASH BAGS MARKET, BY MATERIAL, 2018-2032 (USD THOUSAND)
TABLE 116 SPAIN TRASH BAGS MARKET, BY CAPACITY, 2018-2032 (USD THOUSAND)
TABLE 117 SPAIN TRASH BAGS MARKET, BY END-USER, 2018-2032 (USD THOUSAND)
TABLE 118 SPAIN INDUSTRIES IN TRASH BAGS MARKET, BY TYPE, 2018-2032 (USD THOUSAND)
TABLE 119 SPAIN CORPORATE OFFICES IN TRASH BAGS MARKET, BY TYPE, 2018-2032 (USD THOUSAND)
TABLE 120 SPAIN HOSPITALS IN TRASH BAGS MARKET, BY TYPE, 2018-2032 (USD THOUSAND)
TABLE 121 SPAIN RESIDENTIAL IN TRASH BAGS MARKET, BY TYPE, 2018-2032 (USD THOUSAND)
TABLE 122 SPAIN INSTITUTIONS IN TRASH BAGS MARKET, BY TYPE, 2018-2032 (USD THOUSAND)
TABLE 123 SPAIN LABORATORIES IN TRASH BAGS MARKET, BY TYPE, 2018-2032 (USD THOUSAND)
TABLE 124 SPAIN OTHERS IN TRASH BAGS MARKET, BY TYPE, 2018-2032 (USD THOUSAND)
TABLE 125 SPAIN TRASH BAGS MARKET, BY CATEGORY, 2018-2032 (USD THOUSAND)
TABLE 126 SPAIN TRASH BAGS MARKET, BY DISTRIBUTION CHANNEL, 2018-2032 (USD THOUSAND)
TABLE 127 SPAIN INDIRECT SALES IN TRASH BAGS MARKET, BY DISTRIBUTION CHANNEL, 2018-2032 (USD THOUSAND)
TABLE 128 SPAIN OFFLINE IN TRASH BAGS MARKET, BY TYPE, 2018-2032 (USD THOUSAND)
TABLE 129 SPAIN ONLINE IN TRASH BAGS MARKET, BY TYPE, 2018-2032 (USD THOUSAND)
TABLE 130 BELGIUM TRASH BAGS MARKET, BY TYPE, 2018-2032 (KILO TONS)
TABLE 131 BELGIUM TRASH BAGS MARKET, BY TYPE, 2018-2032 (USD THOUSAND)
TABLE 132 BELGIUM T-SHIRT TRASH BAGS IN TRASH BAGS MARKET, BY T-SHIRT TRASH BAGS TYPE, 2018-2032 (USD THOUSAND)
TABLE 133 BELGIUM TRASH BAGS MARKET, BY MATERIAL, 2018-2032 (USD THOUSAND)
TABLE 134 BELGIUM TRASH BAGS MARKET, BY CAPACITY, 2018-2032 (USD THOUSAND)
TABLE 135 BELGIUM TRASH BAGS MARKET, BY END-USER, 2018-2032 (USD THOUSAND)
TABLE 136 BELGIUM INDUSTRIES IN TRASH BAGS MARKET, BY TYPE, 2018-2032 (USD THOUSAND)
TABLE 137 BELGIUM CORPORATE OFFICES IN TRASH BAGS MARKET, BY TYPE, 2018-2032 (USD THOUSAND)
TABLE 138 BELGIUM HOSPITALS IN TRASH BAGS MARKET, BY TYPE, 2018-2032 (USD THOUSAND)
TABLE 139 BELGIUM RESIDENTIAL IN TRASH BAGS MARKET, BY TYPE, 2018-2032 (USD THOUSAND)
TABLE 140 BELGIUM INSTITUTIONS IN TRASH BAGS MARKET, BY TYPE, 2018-2032 (USD THOUSAND)
TABLE 141 BELGIUM LABORATORIES IN TRASH BAGS MARKET, BY TYPE, 2018-2032 (USD THOUSAND)
TABLE 142 BELGIUM OTHERS IN TRASH BAGS MARKET, BY TYPE, 2018-2032 (USD THOUSAND)
TABLE 143 BELGIUM TRASH BAGS MARKET, BY CATEGORY, 2018-2032 (USD THOUSAND)
TABLE 144 BELGIUM TRASH BAGS MARKET, BY DISTRIBUTION CHANNEL, 2018-2032 (USD THOUSAND)
TABLE 145 BELGIUM INDIRECT SALES IN TRASH BAGS MARKET, BY DISTRIBUTION CHANNEL, 2018-2032 (USD THOUSAND)
TABLE 146 BELGIUM OFFLINE IN TRASH BAGS MARKET, BY TYPE, 2018-2032 (USD THOUSAND)
TABLE 147 BELGIUM ONLINE IN TRASH BAGS MARKET, BY TYPE, 2018-2032 (USD THOUSAND)
TABLE 148 SWITZERLAND TRASH BAGS MARKET, BY TYPE, 2018-2032 (KILO TONS)
TABLE 149 SWITZERLAND TRASH BAGS MARKET, BY TYPE, 2018-2032 (USD THOUSAND)
TABLE 150 SWITZERLAND T-SHIRT TRASH BAGS IN TRASH BAGS MARKET, BY T-SHIRT TRASH BAGS TYPE, 2018-2032 (USD THOUSAND)
TABLE 151 SWITZERLAND TRASH BAGS MARKET, BY MATERIAL, 2018-2032 (USD THOUSAND)
TABLE 152 SWITZERLAND TRASH BAGS MARKET, BY CAPACITY, 2018-2032 (USD THOUSAND)
TABLE 153 SWITZERLAND TRASH BAGS MARKET, BY END-USER, 2018-2032 (USD THOUSAND)
TABLE 154 SWITZERLAND INDUSTRIES IN TRASH BAGS MARKET, BY TYPE, 2018-2032 (USD THOUSAND)
TABLE 155 SWITZERLAND CORPORATE OFFICES IN TRASH BAGS MARKET, BY TYPE, 2018-2032 (USD THOUSAND)
TABLE 156 SWITZERLAND HOSPITALS IN TRASH BAGS MARKET, BY TYPE, 2018-2032 (USD THOUSAND)
TABLE 157 SWITZERLAND RESIDENTIAL IN TRASH BAGS MARKET, BY TYPE, 2018-2032 (USD THOUSAND)
TABLE 158 SWITZERLAND INSTITUTIONS IN TRASH BAGS MARKET, BY TYPE, 2018-2032 (USD THOUSAND)
TABLE 159 SWITZERLAND LABORATORIES IN TRASH BAGS MARKET, BY TYPE, 2018-2032 (USD THOUSAND)
TABLE 160 SWITZERLAND OTHERS IN TRASH BAGS MARKET, BY TYPE, 2018-2032 (USD THOUSAND)
TABLE 161 SWITZERLAND TRASH BAGS MARKET, BY CATEGORY, 2018-2032 (USD THOUSAND)
TABLE 162 SWITZERLAND TRASH BAGS MARKET, BY DISTRIBUTION CHANNEL, 2018-2032 (USD THOUSAND)
TABLE 163 SWITZERLAND INDIRECT SALES IN TRASH BAGS MARKET, BY DISTRIBUTION CHANNEL, 2018-2032 (USD THOUSAND)
TABLE 164 SWITZERLAND OFFLINE IN TRASH BAGS MARKET, BY TYPE, 2018-2032 (USD THOUSAND)
TABLE 165 SWITZERLAND ONLINE IN TRASH BAGS MARKET, BY TYPE, 2018-2032 (USD THOUSAND)
TABLE 166 NETHERLANDS TRASH BAGS MARKET, BY TYPE, 2018-2032 (KILO TONS)
TABLE 167 NETHERLANDS TRASH BAGS MARKET, BY TYPE, 2018-2032 (USD THOUSAND)
TABLE 168 NETHERLANDS T-SHIRT TRASH BAGS IN TRASH BAGS MARKET, BY T-SHIRT TRASH BAGS TYPE, 2018-2032 (USD THOUSAND)
TABLE 169 NETHERLANDS TRASH BAGS MARKET, BY MATERIAL, 2018-2032 (USD THOUSAND)
TABLE 170 NETHERLANDS TRASH BAGS MARKET, BY CAPACITY, 2018-2032 (USD THOUSAND)
TABLE 171 NETHERLANDS TRASH BAGS MARKET, BY END-USER, 2018-2032 (USD THOUSAND)
TABLE 172 NETHERLANDS INDUSTRIES IN TRASH BAGS MARKET, BY TYPE, 2018-2032 (USD THOUSAND)
TABLE 173 NETHERLANDS CORPORATE OFFICES IN TRASH BAGS MARKET, BY TYPE, 2018-2032 (USD THOUSAND)
TABLE 174 NETHERLANDS HOSPITALS IN TRASH BAGS MARKET, BY TYPE, 2018-2032 (USD THOUSAND)
TABLE 175 NETHERLANDS RESIDENTIAL IN TRASH BAGS MARKET, BY TYPE, 2018-2032 (USD THOUSAND)
TABLE 176 NETHERLANDS INSTITUTIONS IN TRASH BAGS MARKET, BY TYPE, 2018-2032 (USD THOUSAND)
TABLE 177 NETHERLANDS LABORATORIES IN TRASH BAGS MARKET, BY TYPE, 2018-2032 (USD THOUSAND)
TABLE 178 NETHERLANDS OTHERS IN TRASH BAGS MARKET, BY TYPE, 2018-2032 (USD THOUSAND)
TABLE 179 NETHERLANDS TRASH BAGS MARKET, BY CATEGORY, 2018-2032 (USD THOUSAND)
TABLE 180 NETHERLANDS TRASH BAGS MARKET, BY DISTRIBUTION CHANNEL, 2018-2032 (USD THOUSAND)
TABLE 181 NETHERLANDS INDIRECT SALES IN TRASH BAGS MARKET, BY DISTRIBUTION CHANNEL, 2018-2032 (USD THOUSAND)
TABLE 182 NETHERLANDS OFFLINE IN TRASH BAGS MARKET, BY TYPE, 2018-2032 (USD THOUSAND)
TABLE 183 NETHERLANDS ONLINE IN TRASH BAGS MARKET, BY TYPE, 2018-2032 (USD THOUSAND)
TABLE 184 TURKEY TRASH BAGS MARKET, BY TYPE, 2018-2032 (KILO TONS)
TABLE 185 TURKEY TRASH BAGS MARKET, BY TYPE, 2018-2032 (USD THOUSAND)
TABLE 186 TURKEY T-SHIRT TRASH BAGS IN TRASH BAGS MARKET, BY T-SHIRT TRASH BAGS TYPE, 2018-2032 (USD THOUSAND)
TABLE 187 TURKEY TRASH BAGS MARKET, BY MATERIAL, 2018-2032 (USD THOUSAND)
TABLE 188 TURKEY TRASH BAGS MARKET, BY CAPACITY, 2018-2032 (USD THOUSAND)
TABLE 189 TURKEY TRASH BAGS MARKET, BY END-USER, 2018-2032 (USD THOUSAND)
TABLE 190 TURKEY INDUSTRIES IN TRASH BAGS MARKET, BY TYPE, 2018-2032 (USD THOUSAND)
TABLE 191 TURKEY CORPORATE OFFICES IN TRASH BAGS MARKET, BY TYPE, 2018-2032 (USD THOUSAND)
TABLE 192 TURKEY HOSPITALS IN TRASH BAGS MARKET, BY TYPE, 2018-2032 (USD THOUSAND)
TABLE 193 TURKEY RESIDENTIAL IN TRASH BAGS MARKET, BY TYPE, 2018-2032 (USD THOUSAND)
TABLE 194 TURKEY INSTITUTIONS IN TRASH BAGS MARKET, BY TYPE, 2018-2032 (USD THOUSAND)
TABLE 195 TURKEY LABORATORIES IN TRASH BAGS MARKET, BY TYPE, 2018-2032 (USD THOUSAND)
TABLE 196 TURKEY OTHERS IN TRASH BAGS MARKET, BY TYPE, 2018-2032 (USD THOUSAND)
TABLE 197 TURKEY TRASH BAGS MARKET, BY CATEGORY, 2018-2032 (USD THOUSAND)
TABLE 198 TURKEY TRASH BAGS MARKET, BY DISTRIBUTION CHANNEL, 2018-2032 (USD THOUSAND)
TABLE 199 TURKEY INDIRECT SALES IN TRASH BAGS MARKET, BY DISTRIBUTION CHANNEL, 2018-2032 (USD THOUSAND)
TABLE 200 TURKEY OFFLINE IN TRASH BAGS MARKET, BY TYPE, 2018-2032 (USD THOUSAND)
TABLE 201 TURKEY ONLINE IN TRASH BAGS MARKET, BY TYPE, 2018-2032 (USD THOUSAND)
TABLE 202 REST OF EUROPE TRASH BAGS MARKET, BY TYPE, 2018-2032 (KILO TONS)
TABLE 203 REST OF EUROPE TRASH BAGS MARKET, BY TYPE, 2018-2032 (USD THOUSAND)
List of Figure
FIGURE 1 EUROPE TRASH BAGS MARKET
FIGURE 2 EUROPE TRASH BAGS MARKET: DATA TRIANGULATION
FIGURE 3 EUROPE TRASH BAGS MARKET: DROC ANALYSIS
FIGURE 4 EUROPE TRASH BAGS MARKET: EUROPE VS REGIONS MARKET ANALYSIS
FIGURE 5 EUROPE TRASH BAGS MARKET: COMPANY RESEARCH ANALYSIS
FIGURE 6 EUROPE TRASH BAGS MARKET: MULTIVARIATE MODELLING
FIGURE 7 EUROPE TRASH BAGS MARKET: INTERVIEW DEMOGRAPHICS
FIGURE 8 EUROPE TRASH BAGS MARKET: DBMR MARKET POSITION GRID
FIGURE 9 EUROPE TRASH BAGS MARKET: MARKET END-USER COVERAGE GRID
FIGURE 10 EUROPE TRASH BAGS MARKET: SEGMENTATION
FIGURE 11 EXECUTIVE SUMMARY
FIGURE 12 STRATEGIC DECISIONS
FIGURE 13 SEVEN SEGMENTS COMPRISE THE EUROPE TRASH BAGS MARKET, BY TYPE
FIGURE 14 TECHNOLOGICAL ADVANCEMENTS IN TRASH BAGS INDUSTRY IS DRIVING THE GROWTH OF THE EUROPE TRASH BAGS MARKET IN THE FORECAST PERIOD 2025 TO 2032
FIGURE 15 THE DRAWSTRING/DRAW TAPE TRASH BAGS IS EXPECTED TO ACCOUNT FOR THE LARGEST SHARE OF THE EUROPEAN TRASH BAGS MARKET IN 2025 AND 2032
FIGURE 16 PORTER’S FIVE FORCES
FIGURE 17 VENDOR SELECTION CRITERIA
FIGURE 18 DRIVERS, RESTRAINTS, OPPORTUNITIES AND CHALLENGES OF EUROPE TRASH BAGS MARKET
FIGURE 19 EUROPE TRASH BAGS MARKET: BY TYPE, 2024
FIGURE 20 EUROPE TRASH BAGS MARKET: BY MATERIAL, 2024
FIGURE 21 EUROPE TRASH BAGS MARKET: BY CAPACITY, 2024
FIGURE 22 EUROPE TRASH BAGS MARKET: BY END-USER, 2024
FIGURE 23 EUROPE TRASH BAGS MARKET: BY CATEGORY, 2024
FIGURE 24 EUROPE TRASH BAGS MARKET: BY DISTRIBUTION CHANNEL, 2024
FIGURE 25 EUROPE TRASH BAGS MARKET: SNAPSHOT (2024)
FIGURE 26 EUROPE TRASH BAGS MARKET: COMPANY SHARE 2024 (%)
Europe Trash Bags Market, Supply Chain Analysis and Ecosystem Framework
To support market growth and help clients navigate the impact of geopolitical shifts, DBMR has integrated in-depth supply chain analysis into its Europe Trash Bags Market research reports. This addition empowers clients to respond effectively to global changes affecting their industries. The supply chain analysis section includes detailed insights such as Europe Trash Bags Market consumption and production by country, price trend analysis, the impact of tariffs and geopolitical developments, and import and export trends by country and HSN code. It also highlights major suppliers with data on production capacity and company profiles, as well as key importers and exporters. In addition to research, DBMR offers specialized supply chain consulting services backed by over a decade of experience, providing solutions like supplier discovery, supplier risk assessment, price trend analysis, impact evaluation of inflation and trade route changes, and comprehensive market trend analysis.
Data collection and base year analysis are done using data collection modules with large sample sizes. The stage includes obtaining market information or related data through various sources and strategies. It includes examining and planning all the data acquired from the past in advance. It likewise envelops the examination of information inconsistencies seen across different information sources. The market data is analysed and estimated using market statistical and coherent models. Also, market share analysis and key trend analysis are the major success factors in the market report. To know more, please request an analyst call or drop down your inquiry.
The key research methodology used by DBMR research team is data triangulation which involves data mining, analysis of the impact of data variables on the market and primary (industry expert) validation. Data models include Vendor Positioning Grid, Market Time Line Analysis, Market Overview and Guide, Company Positioning Grid, Patent Analysis, Pricing Analysis, Company Market Share Analysis, Standards of Measurement, Global versus Regional and Vendor Share Analysis. To know more about the research methodology, drop in an inquiry to speak to our industry experts.
Data Bridge Market Research is a leader in advanced formative research. We take pride in servicing our existing and new customers with data and analysis that match and suits their goal. The report can be customized to include price trend analysis of target brands understanding the market for additional countries (ask for the list of countries), clinical trial results data, literature review, refurbished market and product base analysis. Market analysis of target competitors can be analyzed from technology-based analysis to market portfolio strategies. We can add as many competitors that you require data about in the format and data style you are looking for. Our team of analysts can also provide you data in crude raw excel files pivot tables (Fact book) or can assist you in creating presentations from the data sets available in the report.


