
Europe Used Car Market
Market Size in USD Billion
 USD
221,079.31 Billion
USD
371,418.43 Billion
2022
2030
USD
221,079.31 Billion
USD
371,418.43 Billion
2022
2030
| 2023 - 2030 | |
| USD 221,079.31 Billion | |
| USD 371,418.43 Billion | |
| % | |
|
Europe Used Car Market Analysis and Size
The growing disposable income of the working people increasing the market growth because this enables individuals to buy vehicles within a limited budget. As per Statistics Canada, disposable incomes in low-class households were augmented by 3% and 3.3% in the initial phase of 2021, respectively. In contrast, incomes in high-class households were reduced by 6.4% and then augmented by 3.9% over the same timeframe. The market growth for used cars witnessed substantial growth in the last few years because of expense competitiveness among new market players along with the inability of major share of customers to buy a new car.
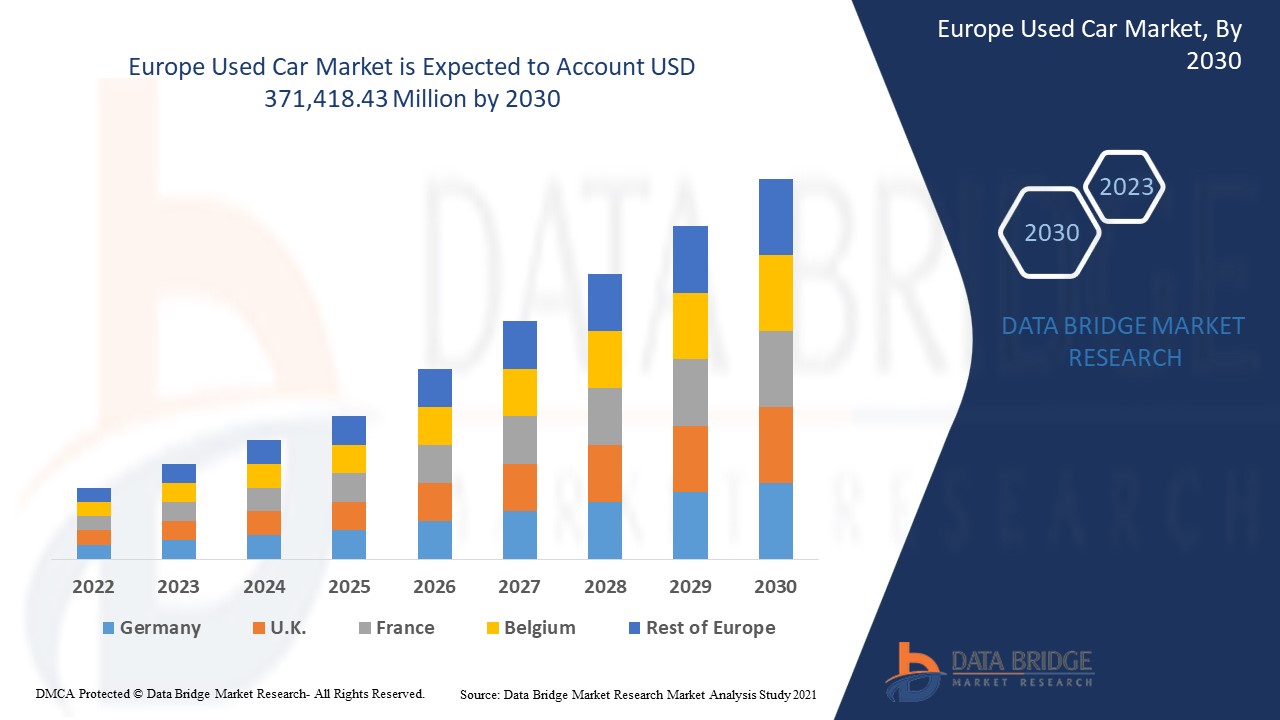
Data Bridge Market Research analyses that the used car market was valued at USD 221,079.31 million in 2022 and is expected to reach the value of USD 371,418.43 million by 2030, at a CAGR of 6.70% during the forecast period. In addition to the market insights such as market value, growth rate, market segments, geographical coverage, market players, and market scenario, The market report curated by the Data Bridge Market Research team includes in-depth expert analysis, import/export analysis, pricing analysis, production consumption analysis, and pestle analysis.
Europe Used Car Market Scope and Segmentation
|
Report Metric |
Details |
|
Forecast Period |
2023 to 2030 |
|
Base Year |
2022 |
|
Historic Years |
2021 (Customizable to 2015 - 2020) |
|
Quantitative Units |
Revenue in USD Million, Volumes in Units, Pricing in USD |
|
Segments Covered |
Vendor Type (Organized, Unorganized), Propulsion (Petrol, Diesel, CNG, LPG, Electric and Others), Engine Capacity (Full Size (Above 2500 CC), Mid-size (Between 1500-2499 CC), Small (Below 1499 CC)) Dealership (Franchised, Independent), Sales Channel (Online, Offline), Vehicle Type (Passenger Car, LCV, HCV & Electric Vehicle) |
|
Countries Covered |
Germany, France, U.K., Netherlands, Switzerland, Belgium, Russia, Italy, Spain, Turkey, Rest of Europe in Europe |
|
Market Players Covered |
Group1 Automotive, Inc. (U.S.), AutoNation (U.S.), HELLMAN & FRIEDMAN LLC (U.S.), PENDRAGON (U.K.), CarMax Business Services, LLC (U.S.), Manheim (U.S.), THE HERTZ CORPORATION (U.S.), Cox Automotive (U.S.), Sun Toyota (U.S.), eBay Inc. (U.S.), TrueCar, Inc. (U.S.), VROOM (U.S.), Asbury Automotive Group (U.S.), MARUTI SUZUKI INDIA LIMITED (India), Mahindra First Choice (India), Scout24 SE (Germany), LITHIA MOTORS, INC. (U.S.), Hendrick Automotive Group (U.S.) |
|
Market Opportunities |
|
Market Definition
A car that has one or more retail owners in the past is referred to as a used car, pre-owned car, or second hand car. Vehicle franchise and independent dealers, car rental agencies, and buy here pay here lots Used cars can be purchased from a variety of sources, including dealerships, leasing offices, auctions, and private party sales. Some auto dealers provide "no-haggle prices," "certified" pre-owned vehicles, and extended service agreements or warranties.
Used Car Market Dynamics
Drivers
- High cost of new car and affordability concern
The car sector has been observing augmented demand for advanced vehicle features such as power steering, climate control, and anti-lock brake systems. Now the cost of new cars more as a result of this. Furthermore, the affordability issues in the new market are indicated by the price increase in 2019, which was driven by mainstream passenger car segments. As a result, used car sales have surged in comparison to new car sales in the automotive industry. This is anticipated to increase demand for old cars.
- Increasing demand for versatile hatchback cars
The Europe used hatchbacks cars which is expected to expand at a growth rate of above 3.5% till 2028 driven by growing demand for hatchbacks that provide flexibility while driving in small spaces. The development of the used car market is aided by the significant presence of top automakers such as Audi AG, BMW AG, Mercedes-Benz, and Volkswagen because these manufacturers offer a large selection of hatchback car models. Players in the market offer hatchback car with a high roofline and a compact design.
Opportunities
- Increasing presence of several car manufacturers and used vehicle dealers
As a result of simple accessibility of finance for used car purchases, the Europe used cars market income exceeded USD 500 billion in 2021 and will continue to rise steadily. The manufacturing industry is the largest private investor in R&D in Europe, Europe is the world's leading manufacturer of automobiles. To increase regional automotive sector competitiveness and retain its technological hegemony globally, the European Commission promotes for global technology standardisation and R&D funding. Used vehicle dealerships in the area offer a range of tech-enabled options for tracking automotive performance, including smartphone applications and virtual internet outlets.
-
Growth of online technologies and e-commerce
Technological developments in the telecom sector, improved internet connectivity, and growing urbanization are some major factors due to which people can now access information much more effectively. These features help used-car owners quickly advertise their vehicles and share information about them. With the help of this online platform, more people can now sell and buy cars.
Restraints
- Issues associated with the expansion of used car market
Expansion of used car market will be hampered by the absence of stringent laws and regulations governing the purchasing of used cars. High used-car depreciation rates will make it harder for the market to grow. The coronavirus outbreak has negatively impacted the global demand for used vehicles by reducing demand for public transportation.
This used car market report provides details of new recent developments, trade regulations, import-export analysis, production analysis, value chain optimization, market share, impact of domestic and localized market players, analyses opportunities in terms of emerging revenue pockets, changes in market regulations, strategic market growth analysis, market size, category market growths, application niches and dominance, product approvals, product launches, geographic expansions, technological innovations in the market. To gain more info on the used car market contact Data Bridge Market Research for an Analyst Brief, our team will help you take an informed market decision to achieve market growth.
Covid-19 Impact on Used Car market
The COVID-19 pandemic, which compelled governments to enact stringent containment measures, regional lockdowns, social seclusion, and quarantine periods, negatively impacted market demand in 2020. As a result of lockdown relaxations and a shift in customer preference for personal mobility. This inspired business owners to use internet platforms for used cars market with flexible financing alternatives. As a result of the rising consumer desire for used cars in price-sensitive areas, the industry is anticipated to have considerable growth in the near future.
Recent Development
- In December 2019, HELLMAN & FRIEDMAN LLC entered into a contract to acquire the company from AutoScout24. With this acquisition, the company aims to provide value-added marketing solutions because it continues to digitalize its business models in the automobile industry.
- In December 2019, Group1 Automotive, Inc. announced its acquisition with two Lexus dealerships to grow its business presence in the New Mexico market. This aided the company in making a footprint in the fast-growing New Mexico market.
Europe Used Car Market Scope
The used car market is segmented based on vendor type, propulsion, engine capacity, dealership, sales channel and vehicle type. The growth amongst these segments will help you analyze meagre growth segments in the industries and provide the users with a valuable market overview and market insights to help them make strategic decisions for identifying core market applications.
Vendor Type
- Organized
- Unorganized
Propulsion
- Petrol
- Diesel
- CNG
- LPG
- Electric
- Others
Engine Capacity
- Full Size (Above 2500 CC)
- Mid-size (Between 1500-2499 CC)
- Small (Below 1499 CC)
Dealership
- Franchised
- Independent
Sales Channel
- Online
- Offline
Vehicle Type
- Passenger Car
- LCV
- HCV
- Electric Vehicle
Used Car Market Regional Analysis/Insights
The used car market is analyzed and market size insights and trends are provided by country, vendor type, propulsion, engine capacity, dealership, sales channel and vehicle type as referenced above.
The countries covered in the used car market report are report Germany, France, U.K., Netherlands, Switzerland, Belgium, Russia, Italy, Spain, Turkey, Rest of Europe in Europe.
Germany dominates the Europe used car market in terms of revenue growth. This is mainly due to the availability of abundant raw materials and cheap labour. Moreover, increasing internet usage, warranties offered on pre-owned vehicles, online tools for buying or researching used automobiles, and various purchase alternatives are some of the another major factors which will likely to boost the market growth.
The country section of the report also provides individual market impacting factors and changes in market regulation that impact the current and future trends of the market. Data points like down-stream and upstream value chain analysis, technical trends and porter's five forces analysis, case studies are some of the pointers used to forecast the market scenario for individual countries. Also, the presence and availability of Global brands and their challenges faced due to large or scarce competition from local and domestic brands, impact of domestic tariffs and trade routes are considered while providing forecast analysis of the country data.
Competitive Landscape and Used car Market Share Analysis
The used car market competitive landscape provides details by competitor. Details included are company overview, company financials, revenue generated, market potential, investment in research and development, new market initiatives, Global presence, production sites and facilities, production capacities, company strengths and weaknesses, product launch, product width and breadth, application dominance. The above data points provided are only related to the companies' focus related to used car market.
Some of the major players operating in the used car market are:
- Group1 Automotive, Inc. (U.S.)
- AutoNation (U.S.)
- HELLMAN & FRIEDMAN LLC (U.S.)
- PENDRAGON (U.K.)
- CarMax Business Services, LLC (U.S.)
- Manheim (U.S.)
- THE HERTZ CORPORATION (U.S.)
- Cox Automotive (U.S.)
- Sun Toyota (U.S.)
- eBay Inc. (U.S.)
- TrueCar, Inc. (U.S.)
- VROOM (U.S.)
- Asbury Automotive Group (U.S.)
- MARUTI SUZUKI INDIA LIMITED (India)
- Mahindra First Choice (India)
- Scout24 SE (Germany)
- LITHIA MOTORS, INC. (U.S.)
- Hendrick Automotive Group (U.S.)
SKU-

- Interactive Data Analysis Dashboard
- Company Analysis Dashboard for high growth potential opportunities
- Research Analyst Access for customization & queries
- Competitor Analysis with Interactive dashboard
- Latest News, Updates & Trend analysis
- Harness the Power of Benchmark Analysis for Comprehensive Competitor Tracking
Table of Content
- introduction
- OBJECTIVES OF THE STUDY
- MARKET DEFINITION
- OVERVIEW OF EUROPE USED CAR MARKET
- Currency and Pricing
- LIMITATIONS
- MARKETS COVERED
- MARKET SEGMENTATION
- MARKETS COVERED
- geographicAL scope
- years considered for the study
- DBMR TRIPOD DATA VALIDATION MODEL
- primary interviews with key opinion leaders
- DBMR MARKET POSITION GRID
- vendor share analysis
- Multivariate Modeling
- vendor type timeline curve
- secondary sourcEs
- assumptions
- EXECUTIVE SUMMARY
- premium insights
- market overview
- DRIVERS
- EMERGENCE OF DIFFERENT E-COMMERCE PLATFORM
- INCREASE IN TRANSPARENCY & SYMMETRY OF INFORMATION BETWEEN DEALERS AND CUSTOMERS
- RISE IN DEMAND FOR OFF-LEASE CARS & SUBSCRIPTION SERVICE BY THE FRANCHISE
- RISE IN DEMAND FOR THE PERSONAl TRANSPORT MOBILITY
- UPSURGE DEMAND FOR THE VEHICLE WITH GREATER VALUE AT LOWER COST
- RESTRAINTS
- EVER INCREASE IN COST OF OWNERSHIP
- STRINGENT GOVERNMENT REGULATIONS FOR CAR DEALERS
- HIGHER MAINTENANCE AND SERVICE COST
- OPPORTUNITIES
- RISE IN STRATEGIC PARTNERSHIP AND ACquisitions BETWEEN TWO COMPANIES
- Original equipment manufacturers (oems) INVOLVEMENT IN CERTIFICATION AND MARKETING PROGRAMS
- RISE IN THE INVESTMENT BY GOVERNMENT IN AUTOMOBILE SECTOR
- AVAILABILITY OF THE REIMBURSED POLICY FOR THE USED CAR
- CHALLENGES
- LACK OF POST-Sale SERVICES OF USED CAR
- INCLINATION OF OEMS (ORIGINAL EQUIPMENT MANUFACTURERS) IN SALE OF ONLY NEW CAR
- IMPACT OF COVID ON THE EUROPE USED CAR MARKET
- IMPACT ON SUPPLY CHAIN & DEMAND ON USED CAR MARKET
- STRATEGIC DECISIONS OF MANUFACTURERS AFTER COVID 19 TO GAIN COMPETITIVE MARKET SHARE
- CONCLUSION
- EUROPE used car MARKET, BY vendor TYPE
- overview
- ORGANIZED
- UNORGANIZED
- EUROPE used car MARKET, BY PROPULSION TYPE
- overview
- PETROL
- Diesel
- ELECTRIC
- LPG
- CNG
- others
- EUROPE used car MARKET, BY engine capacity
- overview
- SMALL (BELOW 1499 CC)
- MID-SIZE (BETWEEN 1500-2499 CC)
- FULL SIZE (ABOVE 2500 CC)
- EUROPE used car MARKET, BY dealership
- overview
- franchised
- independent
- EUROPE used car MARKET, BY sales channel
- overview
- offline
- online
- EUROPE used car MARKET, BY vehicle type
- overview
- passenger cars
- SUV
- SEDAN
- CROSSOVER
- Coupe
- HATCHBACK
- MPV
- CONVERTIBLE
- OTHERS
- lcv
- PICKUP TRUCKS
- VANS
- CARGO VANS
- PASSENGER VANS
- MINI BUS
- COACHES
- OTHERS
- ELECTRIC VEHICLE
- BATTERY OPERATED VEHICLES
- PLUGIN VEHICLES
- HYBRID VEHICLES
- HCV
- TRUCKS
- DUMP TRUCKS
- TOW TRUCKS
- CEMENT TRUCKS
- BUSES
- Europe Used Car Market, by REGION
- EUROPE
- GERMANY
- FRANCE
- U.K.
- ITALY
- SPAIN
- RUSSIA
- TURKEY
- BELGIUM
- NETHERLANDS
- SWITZERLAND
- REST OF EUROPE
- EUROPE Used car market: COMPANY landscape
- company share analysis: EUROPE
- swot
- company profile
- CARMAX BUSINESS SERVICES, LLC
- COMPANY SNAPSHOT
- REVENNUE ANALYSIS
- COMPANY SHARE ANALYSIS
- PRODUCT PORTFOLIO
- RECENT DEVELOPMENTS
- AUTONATION, INC.
- COMPANY SNAPSHOT
- REVENUE ANALYSIS
- company share analysis
- PRODUCT PORTFOLIO
- RECENT DEVELOPMENTS
- LITHIA MOTORS, INC.
- COMPANY SNAPSHOT
- REVENUE ANALYSIS
- company share analysis
- PRODUCT PORTFOLIO
- RECENT DEVELOPMENTS
- SONIC AUTOMOTIVE
- COMPANY SNAPSHOT
- REVENUE ANALYSIS
- company share analysis
- PRODUCT PORTFOLIO
- RECENT DEVELOPMENTS
- GROUP1 AUTOMOTIVE, INC.
- COMPANY SNAPSHOT
- REVENUE ANALYSIS
- company share analysis
- PRODUCT PORTTFOLIO
- RECENT DEVELOPMENTS
- ALIBABA GROUP HOLDING LIMITED
- COMPANY SNAPSHOT
- REVENUE ANALYSIS
- PRODUCT PORTFOLIO
- RECENT DEVELOPMENT
- ASBURY AUTOMOTIVE GROUP
- COMPANY SNAPSHOT
- REVENUE ANALYSIS
- PRODUCT PORTFOLIO
- RECENT DEVELOPMENTS
- BIG BOY TOYZ
- COMPANY SNAPSHOT
- PRODUCT PORTFOLIO
- RECENT DEVELOPMENTS
- CARS24
- COMPANY SNAPSHOT
- SERVICE PORTFOLIO
- RECENT DEVELOPMENTS
- CHEHAODUOJIAO MOTOR VEHICLE BROKER (BEIJING) CO., LTD.
- COMPANY SNAPSHOT
- SERVICE PORTFOLIO
- RECENT DEVELOPMENT
- HELLMAN & FRIEDMAN LLC
- COMPANY SNAPSHOT
- BRAND PORTFOLIO
- RECENT DEVELOPMENTS
- HENDRICK AUTOMOTIVE GROUP
- COMPANY SNAPSHOT
- PRODUCT PORTFOLIO
- RECENT DEVELOPMENTS
- KAIXIN AUTO HOLDINGS
- COMPANY SNAPSHOT
- REVENUE ANALYSIS
- PRODUCT PORTFOLIO
- RECENT DEVELOPMENT
- LEITHCARS
- COMPANY SNAPSHOT
- PRODUCT PORTFOLIO
- RECENT DEVELOPMENT
- MAHINDRA FIRST CHOICE
- COMPANY SNAPSHOT
- SERVICE PORTFOLIO
- RECENT DEVELOPMENTS
- MARUTI SUZUKI INDIA LIMITED
- COMPANY SNAPSHOT
- REVENUE ANALYSIS
- PRODUCT PORTFOLIO
- RECENT DEVELOPMENTS
- OLX GROUP
- COMPANY SNAPSHOT
- REVENUE ANALYSIS
- PRODUCT PORTFOLIO
- RECENT DEVELOPMENTS
- PENDRAGON
- COMPANY SNAPSHOT
- REVENUE ANALYSIS
- PRODUCT PORTFOLIO
- RECENT DEVELOPMENT
- TRUECAR, INC.
- COMPANY SNAPSHOT
- REVENUE ANALYSIS
- PRODUCT PORTFOLIO
- RECENT DEVELOPMENTS
- UXIN GROUP
- COMPANY SNAPSHOT
- REVENUE ANALYSIS
- SERVICE PORTFOLIO
- RECENT DEVELOPMENTS
- questionnaire
- related reports
List of Table
TABLE 1 Scale of Used Vehicle Exports in the Year 2017 (USD Million)
TABLE 2 Comparison of the Brand and Estimated Maintenance Cost over 10 Years (approx.)
TABLE 3 EUROPE USED CAR MARKET, BY VENDOR TYPE, 2019-2028 (USD MILLION)
TABLE 4 Europe organized in used car Market, By Region, 2019-2028 (USD MILLION)
TABLE 5 Europe UNORgANIZED in used car Market, By Region, 2019-2028 (USD MILLION)
TABLE 6 EUROPE USED CAR MARKET, BY propulsion TYPE, 2019-2028 (USD MILLION)
TABLE 7 Europe petrol in used car Market, By Region, 2019-2028 (USD MILLION)
TABLE 8 Europe diesel in used car Market, By Region, 2019-2028 (USD MILLION)
TABLE 9 Europe electric in used car Market, By Region, 2019-2028 (USD MILLION)
TABLE 10 Europe lpg in used car Market, By Region, 2019-2028 (USD MILLION)
TABLE 11 Europe cng in used car Market, By Region, 2019-2028 (USD MILLION)
TABLE 12 Europe others in used car Market, By Region, 2019-2028 (USD MILLION)
TABLE 13 EUROPE USED CAR MARKET, BY ENGINE CAPACITY, 2019-2028 (UsD MILLION)
TABLE 14 Europe small (below 1499 CC) engine capacity in used car Market, By Region, 2019-2028 (USD MILLION)
TABLE 15 Europe mid-size (between 1500-2499 cc) in used car Market, By Region, 2019-2028 (USD MILLION)
TABLE 16 Europe full size (above 2500 cc) in used car Market, By Region, 2019-2028 (USD MILLION)
TABLE 17 EUROPE USED CAR MARKET, BY dealership, 2019-2028 (USD MILLION)
TABLE 18 Europe franchised in used car Market, By Region, 2019-2028 (USD MILLION)
TABLE 19 Europe independent in used car Market, By Region, 2019-2028 (USD MILLION)
TABLE 20 EUROPE USED CAR MARKET, BY sales channel, 2019-2028 (USD MILLION)
TABLE 21 Europe offline sales channel in used car Market, By Region, 2019-2028 (USD MILLION)
TABLE 22 Europe online sales channel in used car Market, By Region, 2019-2028 (USD MILLION)
TABLE 23 EUROPE used car market, BY vehicle type, 2019-2028 (USD million)
TABLE 24 Europe passenger cars in used car Market, By Region, 2019-2028 (USD MILLION)
TABLE 25 Europe passenger cars in used car Market, By TYPE, 2019-2028 (USD MILLION)
TABLE 26 EUROPE lcv in used car Market, By Region, 2019-2028 (USD MILLION)
TABLE 27 Europe LCV in used car Market, By TYPE, 2019-2028 (USD MILLION)
TABLE 28 Europe Vans in used car Market, By TYPE, 2019-2028 (USD MILLION)
TABLE 29 Europe ELECTRIC VEHICLE IN used car Market, By Region, 2019-2028 (USD MILLION)
TABLE 30 Europe electric vehicle in used car Market, By TYPE, 2019-2028 (USD MILLION)
TABLE 31 Europe HCV IN used car Market, By Region, 2019-2028 (USD MILLION)
TABLE 32 Europe HCV in used car Market, By TYPE, 2019-2028 (USD MILLION)
TABLE 33 Europe Trucks in used car Market, By TYPE, 2019-2028 (USD MILLION)
TABLE 34 EUROPE Used Car Market, By Country, 2019-2028 (USD Million)
TABLE 35 EUROPE Used Car Market, By Vendor Type, 2019-2028 (USD Million)
TABLE 36 EUROPE Used Car Market, By Propulsion Type, 2019-2028 (USD Million)
TABLE 37 EUROPE Used Car market, By Engine Capacity, 2019-2028 (USD Million)
TABLE 38 EUROPE Used Car Market, By Dealership, 2019-2028 (USD Million)
TABLE 39 EUROPE Used Car Market, By Sales Channel, 2019-2028 (USD Million)
TABLE 40 EUROPE Used Car Market, By Vehicle Type, 2019-2028 (USD Million)
TABLE 41 EUROPE Passenger Cars in Used Car Market, By Type, 2019-2028 (USD Million)
TABLE 42 EUROPE LCV in Used Car Market, By Type, 2019-2028 (USD Million)
TABLE 43 EUROPE Vans in Used Car Market, By Type, 2019-2028 (USD Million)
TABLE 44 EUROPE HCV in Used Car Market, By Type, 2019-2028 (USD Million)
TABLE 45 EUROPE Trucks in Used Car Market, By Type, 2019-2028 (USD Million)
TABLE 46 EUROPE Electric Vehicle in Used Car Market, By Type, 2019-2028 (USD Million)
TABLE 47 GERMANY Used Car Market, By Vendor Type, 2019-2028 (USD Million)
TABLE 48 GERMANY Used Car Market, By Propulsion Type, 2019-2028 (USD Million)
TABLE 49 GERMANY Used Car market, By Engine Capacity, 2019-2028 (USD Million)
TABLE 50 GERMANY Used Car Market, By Dealership, 2019-2028 (USD Million)
TABLE 51 GERMANY Used Car Market, By Sales Channel, 2019-2028 (USD Million)
TABLE 52 GERMANY Used Car Market, By Vehicle Type, 2019-2028 (USD Million)
TABLE 53 GERMANY Passenger Cars in Used Car Market, By Type, 2019-2028 (USD Million)
TABLE 54 GERMANY LCV in Used Car Market, By Type, 2019-2028 (USD Million)
TABLE 55 GERMANY Vans in Used Car Market, By Type, 2019-2028 (USD Million)
TABLE 56 GERMANY HCV in Used Car Market, By Type, 2019-2028 (USD Million)
TABLE 57 GERMANY Trucks in Used Car Market, By Type, 2019-2028 (USD Million)
TABLE 58 GERMANY Electric Vehicle in Used Car Market, By Type, 2019-2028 (USD Million)
TABLE 59 FRANCE Used Car Market, By Vendor Type, 2019-2028 (USD Million)
TABLE 60 FRANCE Used Car Market, By Propulsion Type, 2019-2028 (USD Million)
TABLE 61 FRANCE Used Car market, By Engine Capacity, 2019-2028 (USD Million)
TABLE 62 FRANCE Used Car Market, By Dealership, 2019-2028 (USD Million)
TABLE 63 FRANCE Used Car Market, By Sales Channel, 2019-2028 (USD Million)
TABLE 64 FRANCE Used Car Market, By Vehicle Type, 2019-2028 (USD Million)
TABLE 65 FRANCE Passenger Cars in Used Car Market, By Type, 2019-2028 (USD Million)
TABLE 66 FRANCE LCV in Used Car Market, By Type, 2019-2028 (USD Million)
TABLE 67 FRANCE Vans in Used Car Market, By Type, 2019-2028 (USD Million)
TABLE 68 FRANCE HCV in Used Car Market, By Type, 2019-2028 (USD Million)
TABLE 69 FRANCE Trucks in Used Car Market, By Type, 2019-2028 (USD Million)
TABLE 70 FRANCE Electric Vehicle in Used Car Market, By Type, 2019-2028 (USD Million)
TABLE 71 U.K. Used Car Market, By Vendor Type, 2019-2028 (USD Million)
TABLE 72 U.K. Used Car Market, By Propulsion Type, 2019-2028 (USD Million)
TABLE 73 U.K. Used Car market, By Engine Capacity, 2019-2028 (USD Million)
TABLE 74 U.K. Used Car Market, By Dealership, 2019-2028 (USD Million)
TABLE 75 U.K. Used Car Market, By Sales Channel, 2019-2028 (USD Million)
TABLE 76 U.K. Used Car Market, By Vehicle Type, 2019-2028 (USD Million)
TABLE 77 U.K. Passenger Cars in Used Car Market, By Type, 2019-2028 (USD Million)
TABLE 78 U.K. LCV in Used Car Market, By Type, 2019-2028 (USD Million)
TABLE 79 U.K. Vans in Used Car Market, By Type, 2019-2028 (USD Million)
TABLE 80 U.K. HCV in Used Car Market, By Type, 2019-2028 (USD Million)
TABLE 81 U.K. Trucks in Used Car Market, By Type, 2019-2028 (USD Million)
TABLE 82 U.K. Electric Vehicle in Used Car Market, By Type, 2019-2028 (USD Million)
TABLE 83 ITALY Used Car Market, By Vendor Type, 2019-2028 (USD Million)
TABLE 84 ITALY Used Car Market, By Propulsion Type, 2019-2028 (USD Million)
TABLE 85 ITALY Used Car market, By Engine Capacity, 2019-2028 (USD Million)
TABLE 86 ITALY Used Car Market, By Dealership, 2019-2028 (USD Million)
TABLE 87 ITALY Used Car Market, By Sales Channel, 2019-2028 (USD Million)
TABLE 88 ITALY Used Car Market, By Vehicle Type, 2019-2028 (USD Million)
TABLE 89 ITALY Passenger Cars in Used Car Market, By Type, 2019-2028 (USD Million)
TABLE 90 ITALY LCV in Used Car Market, By Type, 2019-2028 (USD Million)
TABLE 91 ITALY Vans in Used Car Market, By Type, 2019-2028 (USD Million)
TABLE 92 ITALY HCV in Used Car Market, By Type, 2019-2028 (USD Million)
TABLE 93 ITALY Trucks in Used Car Market, By Type, 2019-2028 (USD Million)
TABLE 94 ITALY Electric Vehicle in Used Car Market, By Type, 2019-2028 (USD Million)
TABLE 95 SPAIN Used Car Market, By Vendor Type, 2019-2028 (USD Million)
TABLE 96 SPAIN Used Car Market, By Propulsion Type, 2019-2028 (USD Million)
TABLE 97 SPAIN Used Car market, By Engine Capacity, 2019-2028 (USD Million)
TABLE 98 SPAIN Used Car Market, By Dealership, 2019-2028 (USD Million)
TABLE 99 SPAIN Used Car Market, By Sales Channel, 2019-2028 (USD Million)
TABLE 100 SPAIN Used Car Market, By Vehicle Type, 2019-2028 (USD Million)
TABLE 101 SPAIN Passenger Cars in Used Car Market, By Type, 2019-2028 (USD Million)
TABLE 102 SPAIN LCV in Used Car Market, By Type, 2019-2028 (USD Million)
TABLE 103 SPAIN Vans in Used Car Market, By Type, 2019-2028 (USD Million)
TABLE 104 SPAIN HCV in Used Car Market, By Type, 2019-2028 (USD Million)
TABLE 105 SPAIN Trucks in Used Car Market, By Type, 2019-2028 (USD Million)
TABLE 106 SPAIN Electric Vehicle in Used Car Market, By Type, 2019-2028 (USD Million)
TABLE 107 RUSSIA Used Car Market, By Vendor Type, 2019-2028 (USD Million)
TABLE 108 RUSSIA Used Car Market, By Propulsion Type, 2019-2028 (USD Million)
TABLE 109 RUSSIA Used Car market, By Engine Capacity, 2019-2028 (USD Million)
TABLE 110 RUSSIA Used Car Market, By Dealership, 2019-2028 (USD Million)
TABLE 111 RUSSIA Used Car Market, By Sales Channel, 2019-2028 (USD Million)
TABLE 112 RUSSIA Used Car Market, By Vehicle Type, 2019-2028 (USD Million)
TABLE 113 RUSSIA Passenger Cars in Used Car Market, By Type, 2019-2028 (USD Million)
TABLE 114 RUSSIA LCV in Used Car Market, By Type, 2019-2028 (USD Million)
TABLE 115 RUSSIA Vans in Used Car Market, By Type, 2019-2028 (USD Million)
TABLE 116 RUSSIA HCV in Used Car Market, By Type, 2019-2028 (USD Million)
TABLE 117 RUSSIA Trucks in Used Car Market, By Type, 2019-2028 (USD Million)
TABLE 118 RUSSIA Electric Vehicle in Used Car Market, By Type, 2019-2028 (USD Million)
TABLE 119 TURKEY Used Car Market, By Vendor Type, 2019-2028 (USD Million)
TABLE 120 TURKEY Used Car Market, By Propulsion Type, 2019-2028 (USD Million)
TABLE 121 TURKEY Used Car market, By Engine Capacity, 2019-2028 (USD Million)
TABLE 122 TURKEY Used Car Market, By Dealership, 2019-2028 (USD Million)
TABLE 123 TURKEY Used Car Market, By Sales Channel, 2019-2028 (USD Million)
TABLE 124 TURKEY Used Car Market, By Vehicle Type, 2019-2028 (USD Million)
TABLE 125 TURKEY Passenger Cars in Used Car Market, By Type, 2019-2028 (USD Million)
TABLE 126 TURKEY LCV in Used Car Market, By Type, 2019-2028 (USD Million)
TABLE 127 TURKEY Vans in Used Car Market, By Type, 2019-2028 (USD Million)
TABLE 128 TURKEY HCV in Used Car Market, By Type, 2019-2028 (USD Million)
TABLE 129 TURKEY Trucks in Used Car Market, By Type, 2019-2028 (USD Million)
TABLE 130 TURKEY Electric Vehicle in Used Car Market, By Type, 2019-2028 (USD Million)
TABLE 131 BELGIUM Used Car Market, By Vendor Type, 2019-2028 (USD Million)
TABLE 132 BELGIUM Used Car Market, By Propulsion Type, 2019-2028 (USD Million)
TABLE 133 BELGIUM Used Car market, By Engine Capacity, 2019-2028 (USD Million)
TABLE 134 BELGIUM Used Car Market, By Dealership, 2019-2028 (USD Million)
TABLE 135 BELGIUM Used Car Market, By Sales Channel, 2019-2028 (USD Million)
TABLE 136 BELGIUM Used Car Market, By Vehicle Type, 2019-2028 (USD Million)
TABLE 137 BELGIUM Passenger Cars in Used Car Market, By Type, 2019-2028 (USD Million)
TABLE 138 BELGIUM LCV in Used Car Market, By Type, 2019-2028 (USD Million)
TABLE 139 BELGIUM Vans in Used Car Market, By Type, 2019-2028 (USD Million)
TABLE 140 BELGIUM HCV in Used Car Market, By Type, 2019-2028 (USD Million)
TABLE 141 BELGIUM Trucks in Used Car Market, By Type, 2019-2028 (USD Million)
TABLE 142 BELGIUM Electric Vehicle in Used Car Market, By Type, 2019-2028 (USD Million)
TABLE 143 NETHERLANDS Used Car Market, By Vendor Type, 2019-2028 (USD Million)
TABLE 144 NETHERLANDS Used Car Market, By Propulsion Type, 2019-2028 (USD Million)
TABLE 145 NETHERLANDS Used Car market, By Engine Capacity, 2019-2028 (USD Million)
TABLE 146 NETHERLANDS Used Car Market, By Dealership, 2019-2028 (USD Million)
TABLE 147 NETHERLANDS Used Car Market, By Sales Channel, 2019-2028 (USD Million)
TABLE 148 NETHERLANDS Used Car Market, By Vehicle Type, 2019-2028 (USD Million)
TABLE 149 NETHERLANDS Passenger Cars in Used Car Market, By Type, 2019-2028 (USD Million)
TABLE 150 NETHERLANDS LCV in Used Car Market, By Type, 2019-2028 (USD Million)
TABLE 151 NETHERLANDS Vans in Used Car Market, By Type, 2019-2028 (USD Million)
TABLE 152 NETHERLANDS HCV in Used Car Market, By Type, 2019-2028 (USD Million)
TABLE 153 NETHERLANDS Trucks in Used Car Market, By Type, 2019-2028 (USD Million)
TABLE 154 NETHERLANDS Electric Vehicle in Used Car Market, By Type, 2019-2028 (USD Million)
TABLE 155 SWITZERLAND Used Car Market, By Vendor Type, 2019-2028 (USD Million)
TABLE 156 SWITZERLAND Used Car Market, By Propulsion Type, 2019-2028 (USD Million)
TABLE 157 SWITZERLAND Used Car market, By Engine Capacity, 2019-2028 (USD Million)
TABLE 158 SWITZERLAND Used Car Market, By Dealership, 2019-2028 (USD Million)
TABLE 159 SWITZERLAND Used Car Market, By Sales Channel, 2019-2028 (USD Million)
TABLE 160 SWITZERLAND Used Car Market, By Vehicle Type, 2019-2028 (USD Million)
TABLE 161 SWITZERLAND Passenger Cars in Used Car Market, By Type, 2019-2028 (USD Million)
TABLE 162 SWITZERLAND LCV in Used Car Market, By Type, 2019-2028 (USD Million)
TABLE 163 SWITZERLAND Vans in Used Car Market, By Type, 2019-2028 (USD Million)
TABLE 164 SWITZERLAND HCV in Used Car Market, By Type, 2019-2028 (USD Million)
TABLE 165 SWITZERLAND Trucks in Used Car Market, By Type, 2019-2028 (USD Million)
TABLE 166 SWITZERLAND Electric Vehicle in Used Car Market, By Type, 2019-2028 (USD Million)
TABLE 167 Rest of EUROPE Used Car Market, By Vendor Type, 2019-2028 (USD Million)
List of Figure
FIGURE 1 EUROPE USED CAR MARKET segmentation
FIGURE 2 EUROPE used car MARKET: data triangulation
FIGURE 3 EUROPE used car MARKET: DROC ANALYSIS
FIGURE 4 EUROPE used car MARKET: EUROPE VS REGIONAL MARKET ANALYSIS
FIGURE 5 EUROPE used car MARKET: COMPANY RESEARCH ANALYSIS
FIGURE 6 EUROPE used car MARKET: INTERVIEW DEMOGRAPHICS
FIGURE 7 EUROPE used car MARKET: DBMR MARKET POSITION GRID
FIGURE 8 EUROPE used car MARKET: vendor share analysis
FIGURE 9 EUROPE used car market SEGMENTATION
FIGURE 10 THE Emergence of different ecommerce platformS is EXPECTED TO DRIVE THE EUROPE used car market THE FORECAST PERIOD OF 2021 TO 2028
FIGURE 11 ORGANIZED segment is expected to account for the largest share of THE Europe used car market IN 2021 & 2028
FIGURE 12 DRIVERS, RESTRAINTS, OPPORTUNITIES, AND CHALLENGES FOR EUROPE USED CAR MARKET
FIGURE 13 Monthly Passenger Car Sales in Europe between August 2020 and June 2021 (1,000 Units)
FIGURE 14 Vehicle share per month in the year 2019 (%)
FIGURE 15 Europe USEd CAR MARKET: BY VENDOR TYPE, 2020
FIGURE 16 Europe USED CAR MARKET: BY PROPULSION TYPE, 2020
FIGURE 17 Europe USEd CAR MARKET: BY ENGINE capacity, 2020
FIGURE 18 Europe USEd CAR MARKET: BY DEALERSHIP, 2020
FIGURE 19 Europe USEd CAR MARKET: BY sales channel, 2020
FIGURE 20 Europe used car MARKET: BY VEHICLE type, 2020
FIGURE 21 EUROPE USED CAR MARKET: SNAPSHOT (2020)
FIGURE 22 EUROPE USED CAR MARKET: by Country (2020)
FIGURE 23 EUROPE USED CAR MARKET: by Country (2021 & 2028)
FIGURE 24 EUROPE USED CAR MARKET: by Country (2020 & 2028)
FIGURE 25 EUROPE USED CAR MARKET: by Vendor Type (2021-2028)
FIGURE 26 Europe used car Market: company share 2020 (%)
Data collection and base year analysis are done using data collection modules with large sample sizes. The stage includes obtaining market information or related data through various sources and strategies. It includes examining and planning all the data acquired from the past in advance. It likewise envelops the examination of information inconsistencies seen across different information sources. The market data is analysed and estimated using market statistical and coherent models. Also, market share analysis and key trend analysis are the major success factors in the market report. To know more, please request an analyst call or drop down your inquiry.
The key research methodology used by DBMR research team is data triangulation which involves data mining, analysis of the impact of data variables on the market and primary (industry expert) validation. Data models include Vendor Positioning Grid, Market Time Line Analysis, Market Overview and Guide, Company Positioning Grid, Patent Analysis, Pricing Analysis, Company Market Share Analysis, Standards of Measurement, Global versus Regional and Vendor Share Analysis. To know more about the research methodology, drop in an inquiry to speak to our industry experts.
Data Bridge Market Research is a leader in advanced formative research. We take pride in servicing our existing and new customers with data and analysis that match and suits their goal. The report can be customized to include price trend analysis of target brands understanding the market for additional countries (ask for the list of countries), clinical trial results data, literature review, refurbished market and product base analysis. Market analysis of target competitors can be analyzed from technology-based analysis to market portfolio strategies. We can add as many competitors that you require data about in the format and data style you are looking for. Our team of analysts can also provide you data in crude raw excel files pivot tables (Fact book) or can assist you in creating presentations from the data sets available in the report.


