
GCC IT Services Market Analysis and Size
IT services are basically described as the combination of technical and business expertise in order to provide organizations with management, creation, and optimization of business processes. It helps in guiding the organizations for the overall IT strategy, which includes cloud, data center, and type of technology and functionality needed within the context of the enterprise's IT and business environments.
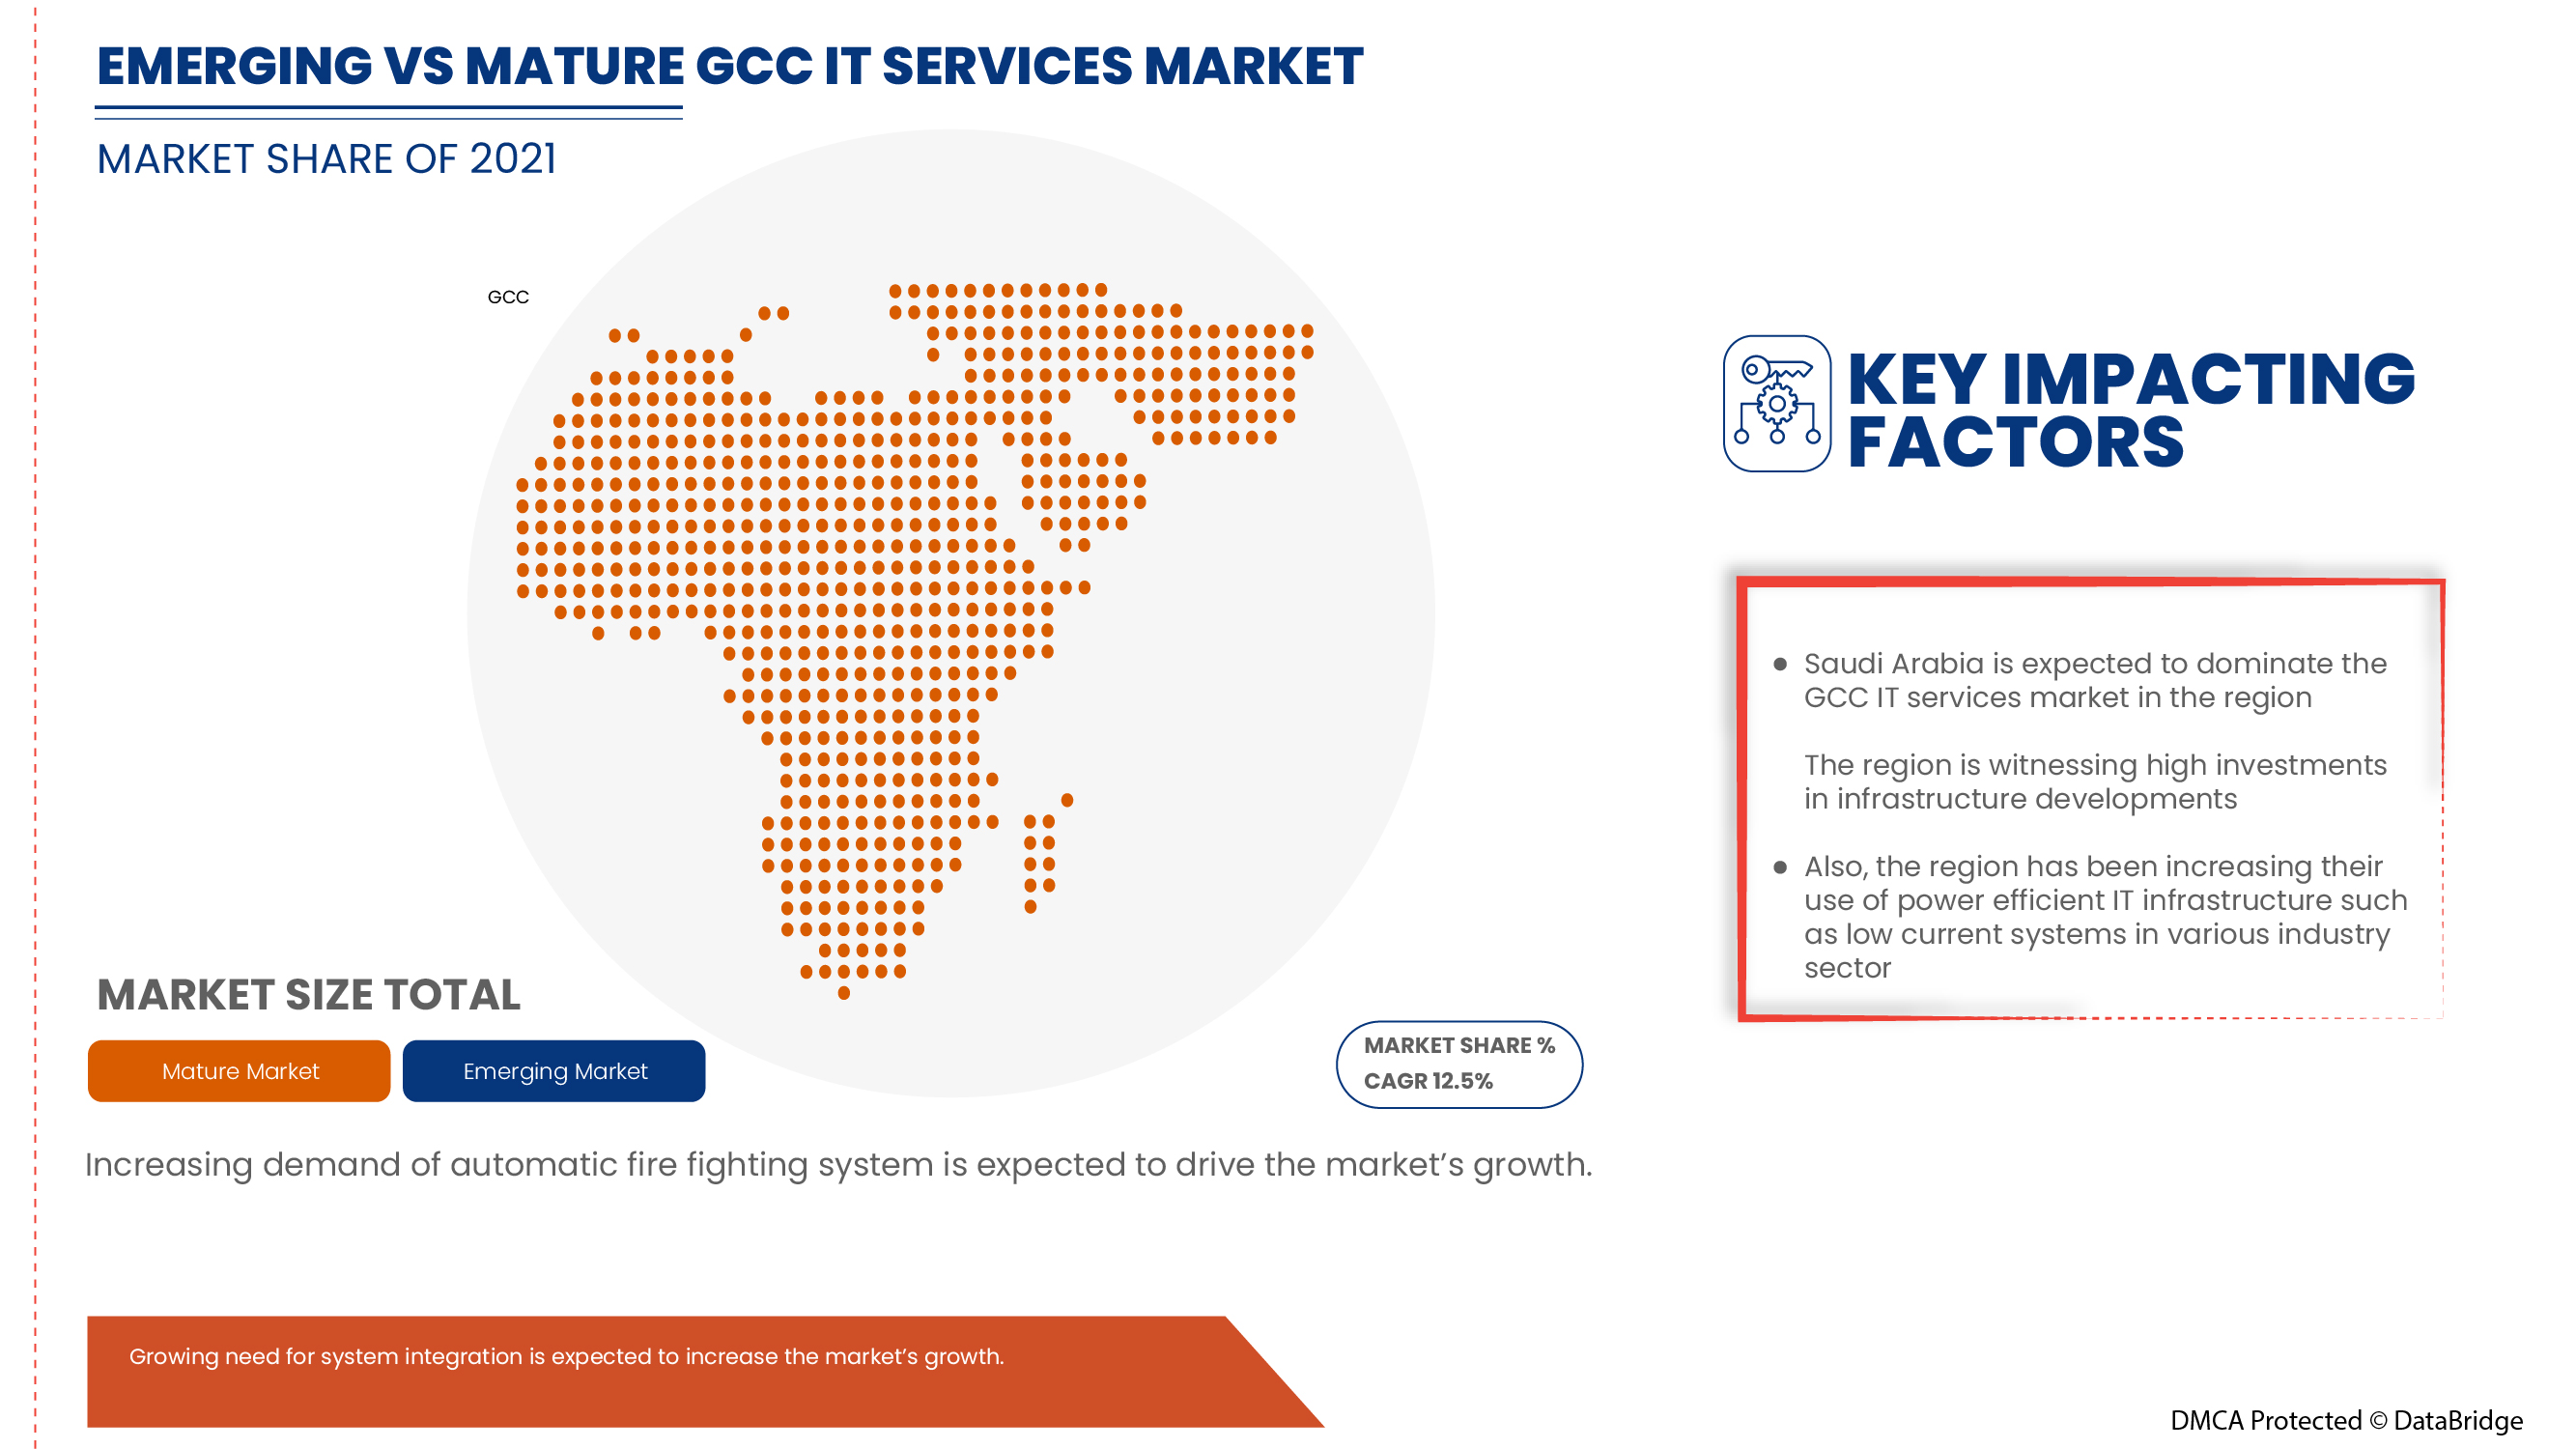
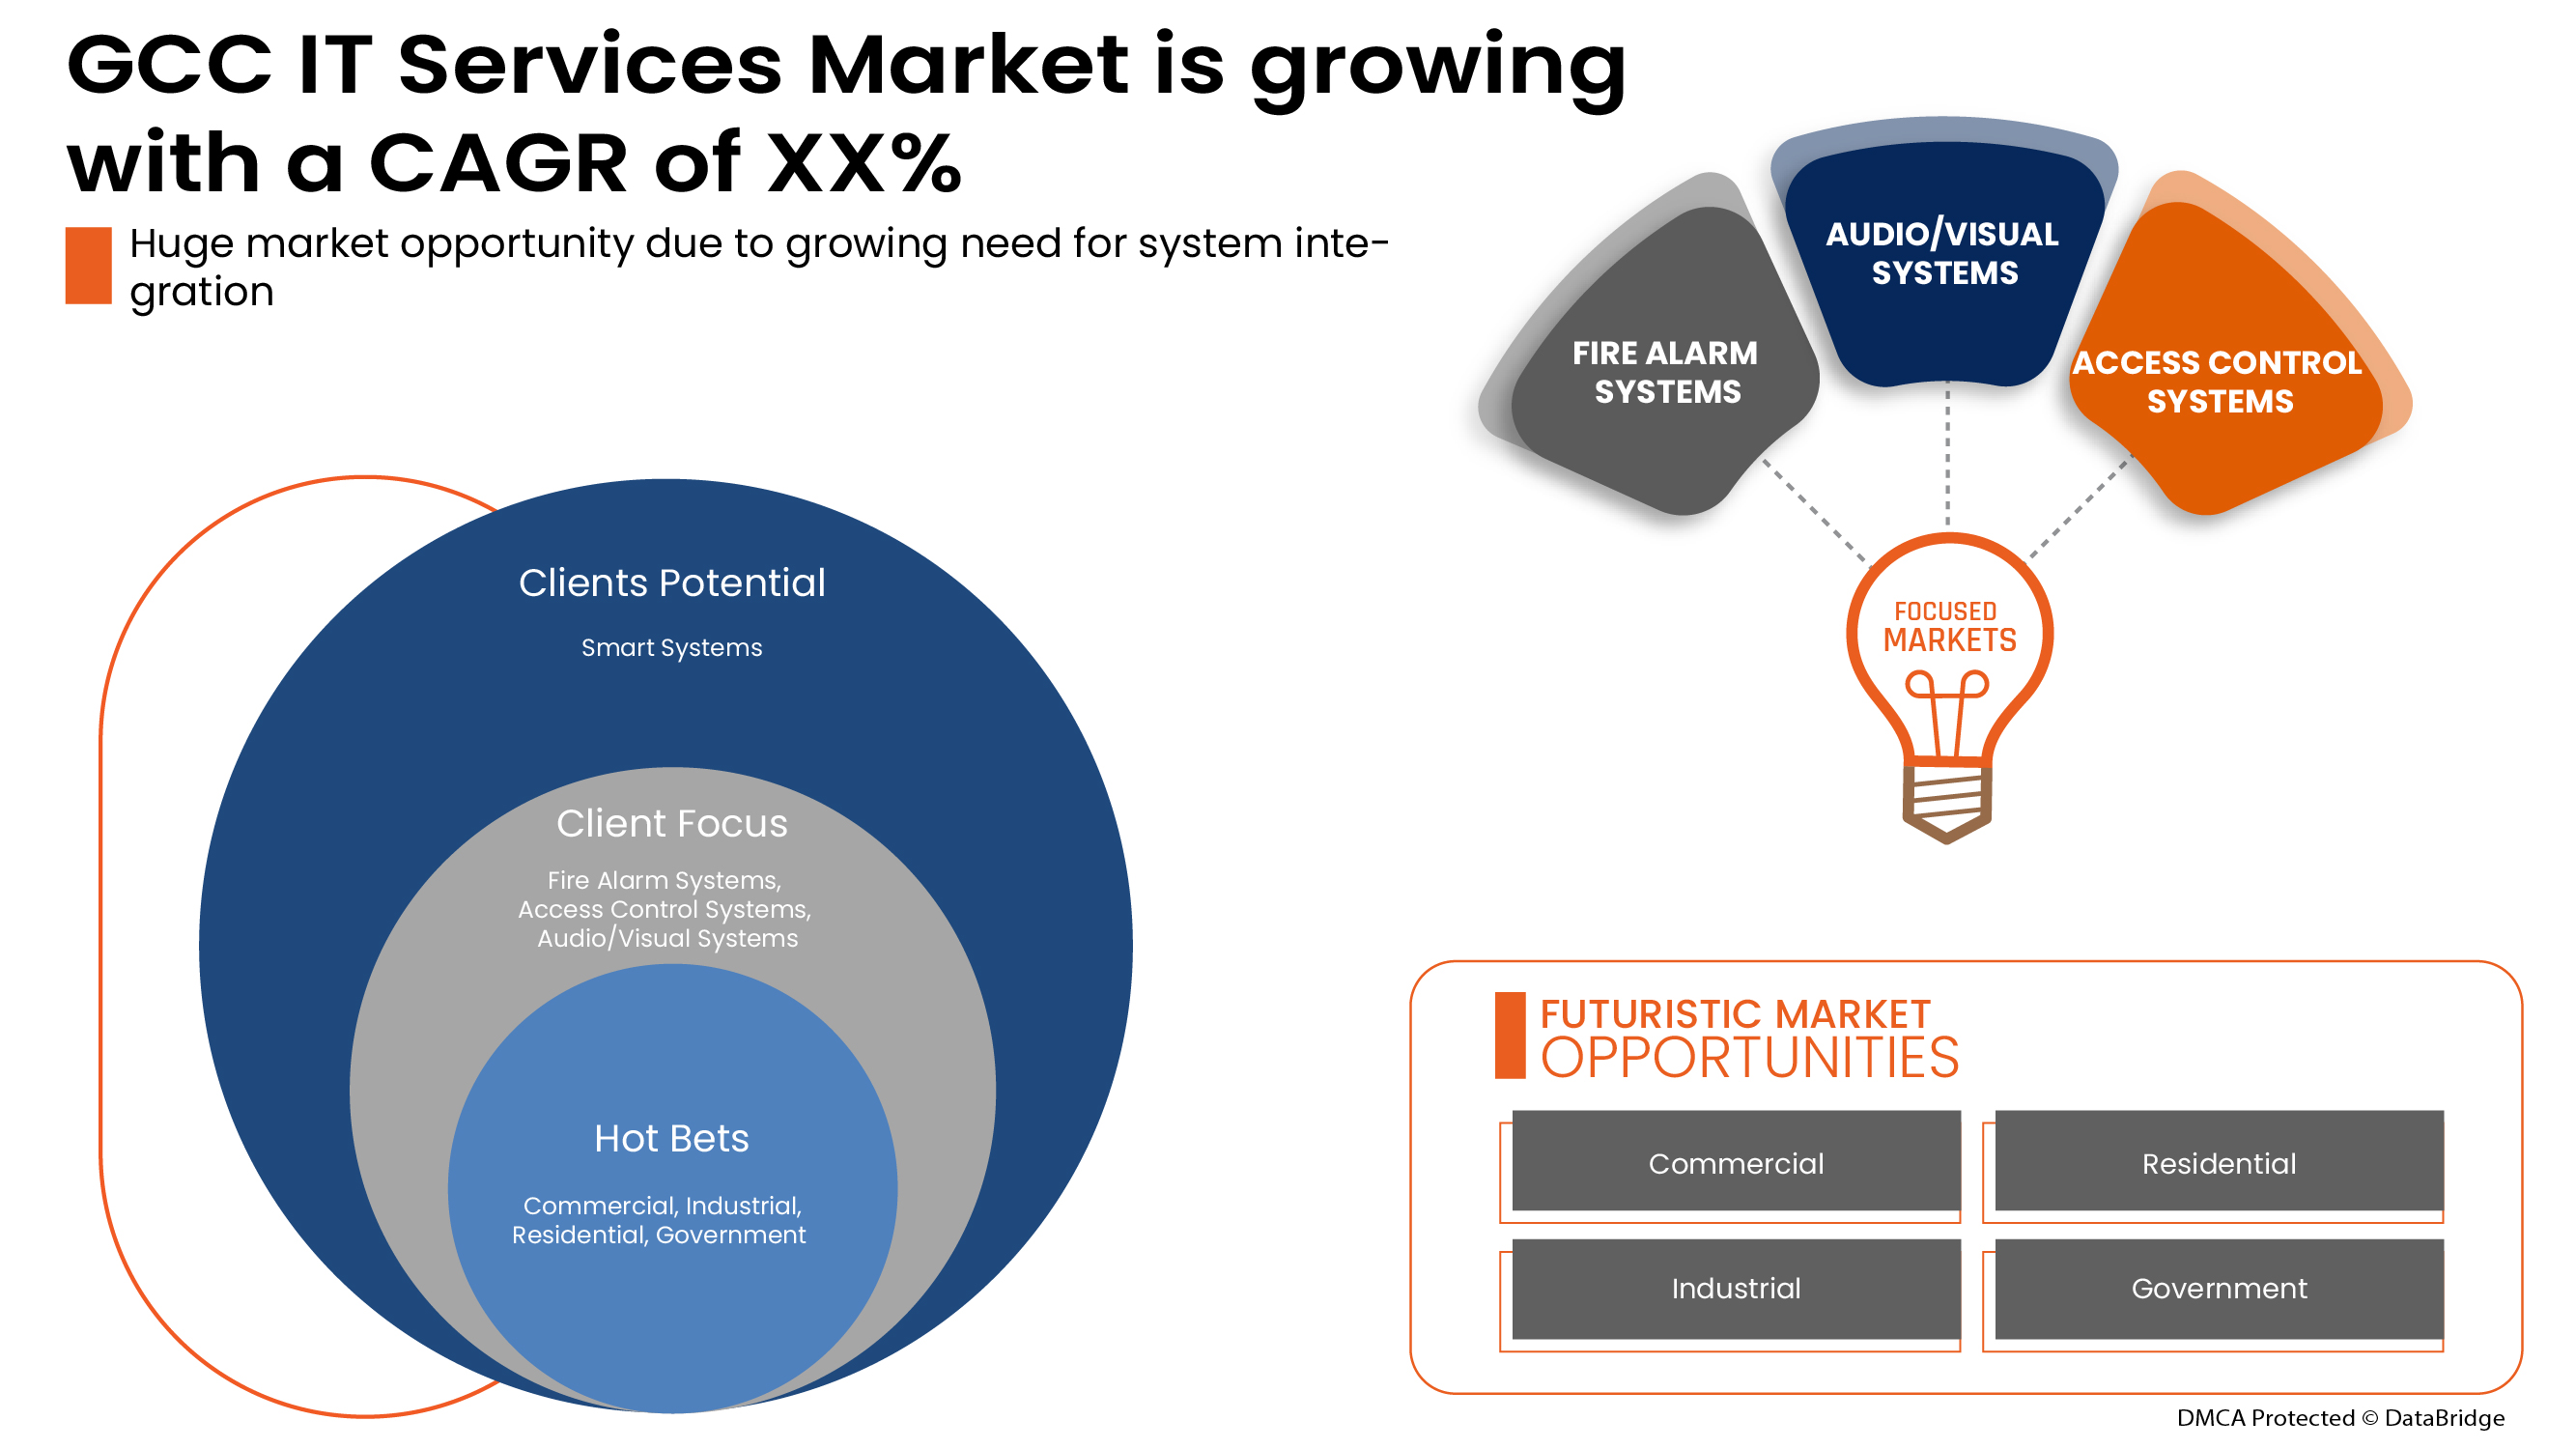
Data Bridge Market Research analyses that GCC IT services market is expected to reach the value of USD 809.11 million by 2029, at a CAGR of 12.5% during the forecast period. "Smart systems" accounts for the largest components segment in the IT services market and provides basic facilities and a wide range of features with different platforms.
|
Report Metric |
Details |
|
Forecast Period |
2022 to 2029 |
|
Base Year |
2021 |
|
Historic Years |
2020 (Customisable 2019-2014) |
|
Quantitative Units |
Revenue in USD Million, Pricing in USD |
|
Segments Covered |
By System (Smart System, Security System, and Control and Automation), Type (Professional Services, and Managed Services), Organization Size (Large Enterprises, and Small and Medium Enterprises), End User (Commercial, Industrial, Residential, Government, and Others) |
|
Countries Covered |
UAE, Saudi Arabia, Qatar, Oman, Kuwait, Bahrain |
|
Market Players Covered |
Intercom Enterprises, TECO Middle. East, Advanced Micro Technologies Co., Emirates Dawn., AL Sadara UAE, Energy Pillars, Mobi EGYPT, Industrial Dimensions Contracting Co., EMergy Consultancy, BITS secure IT infrastructure., Guqa IT Team, Zegtech Inc., BTC NETWORKS, Skies ltd., ADS, among others |
Market Definition
IT services is a cutting-edge facility that manages IT-related computer systems and equipment. IT services connect infrastructure standards to the operational environment requirements of various end user industries. The IT services are outsourced from many companies across the globe that provides the facility based on the end user and customer requirement. The advancement in IT operations in the cloud-based platform has made the IT services to be more data-driven and work in real-time. This creates a greater value for the business and, increases the business opportunity discovery, operational efficiency, and provides remote access optimization.
IT services can be categorized into two types, managed services, and professional services. Managed services are continuous support to its customers, and usage of these services is frequent as operations such as bug fixing and server maintenance occur on a regular basis. Professional services are occasional IT services with offerings such as infrastructure integration, consulting, and training. In this, services are limited for a particular period of time, depending upon the type of project.
GCC IT Services Market Dynamics
This section deals with understanding the market drivers, advantages, opportunities, restraints, and challenges. All of this is discussed in detail as below:
Drivers
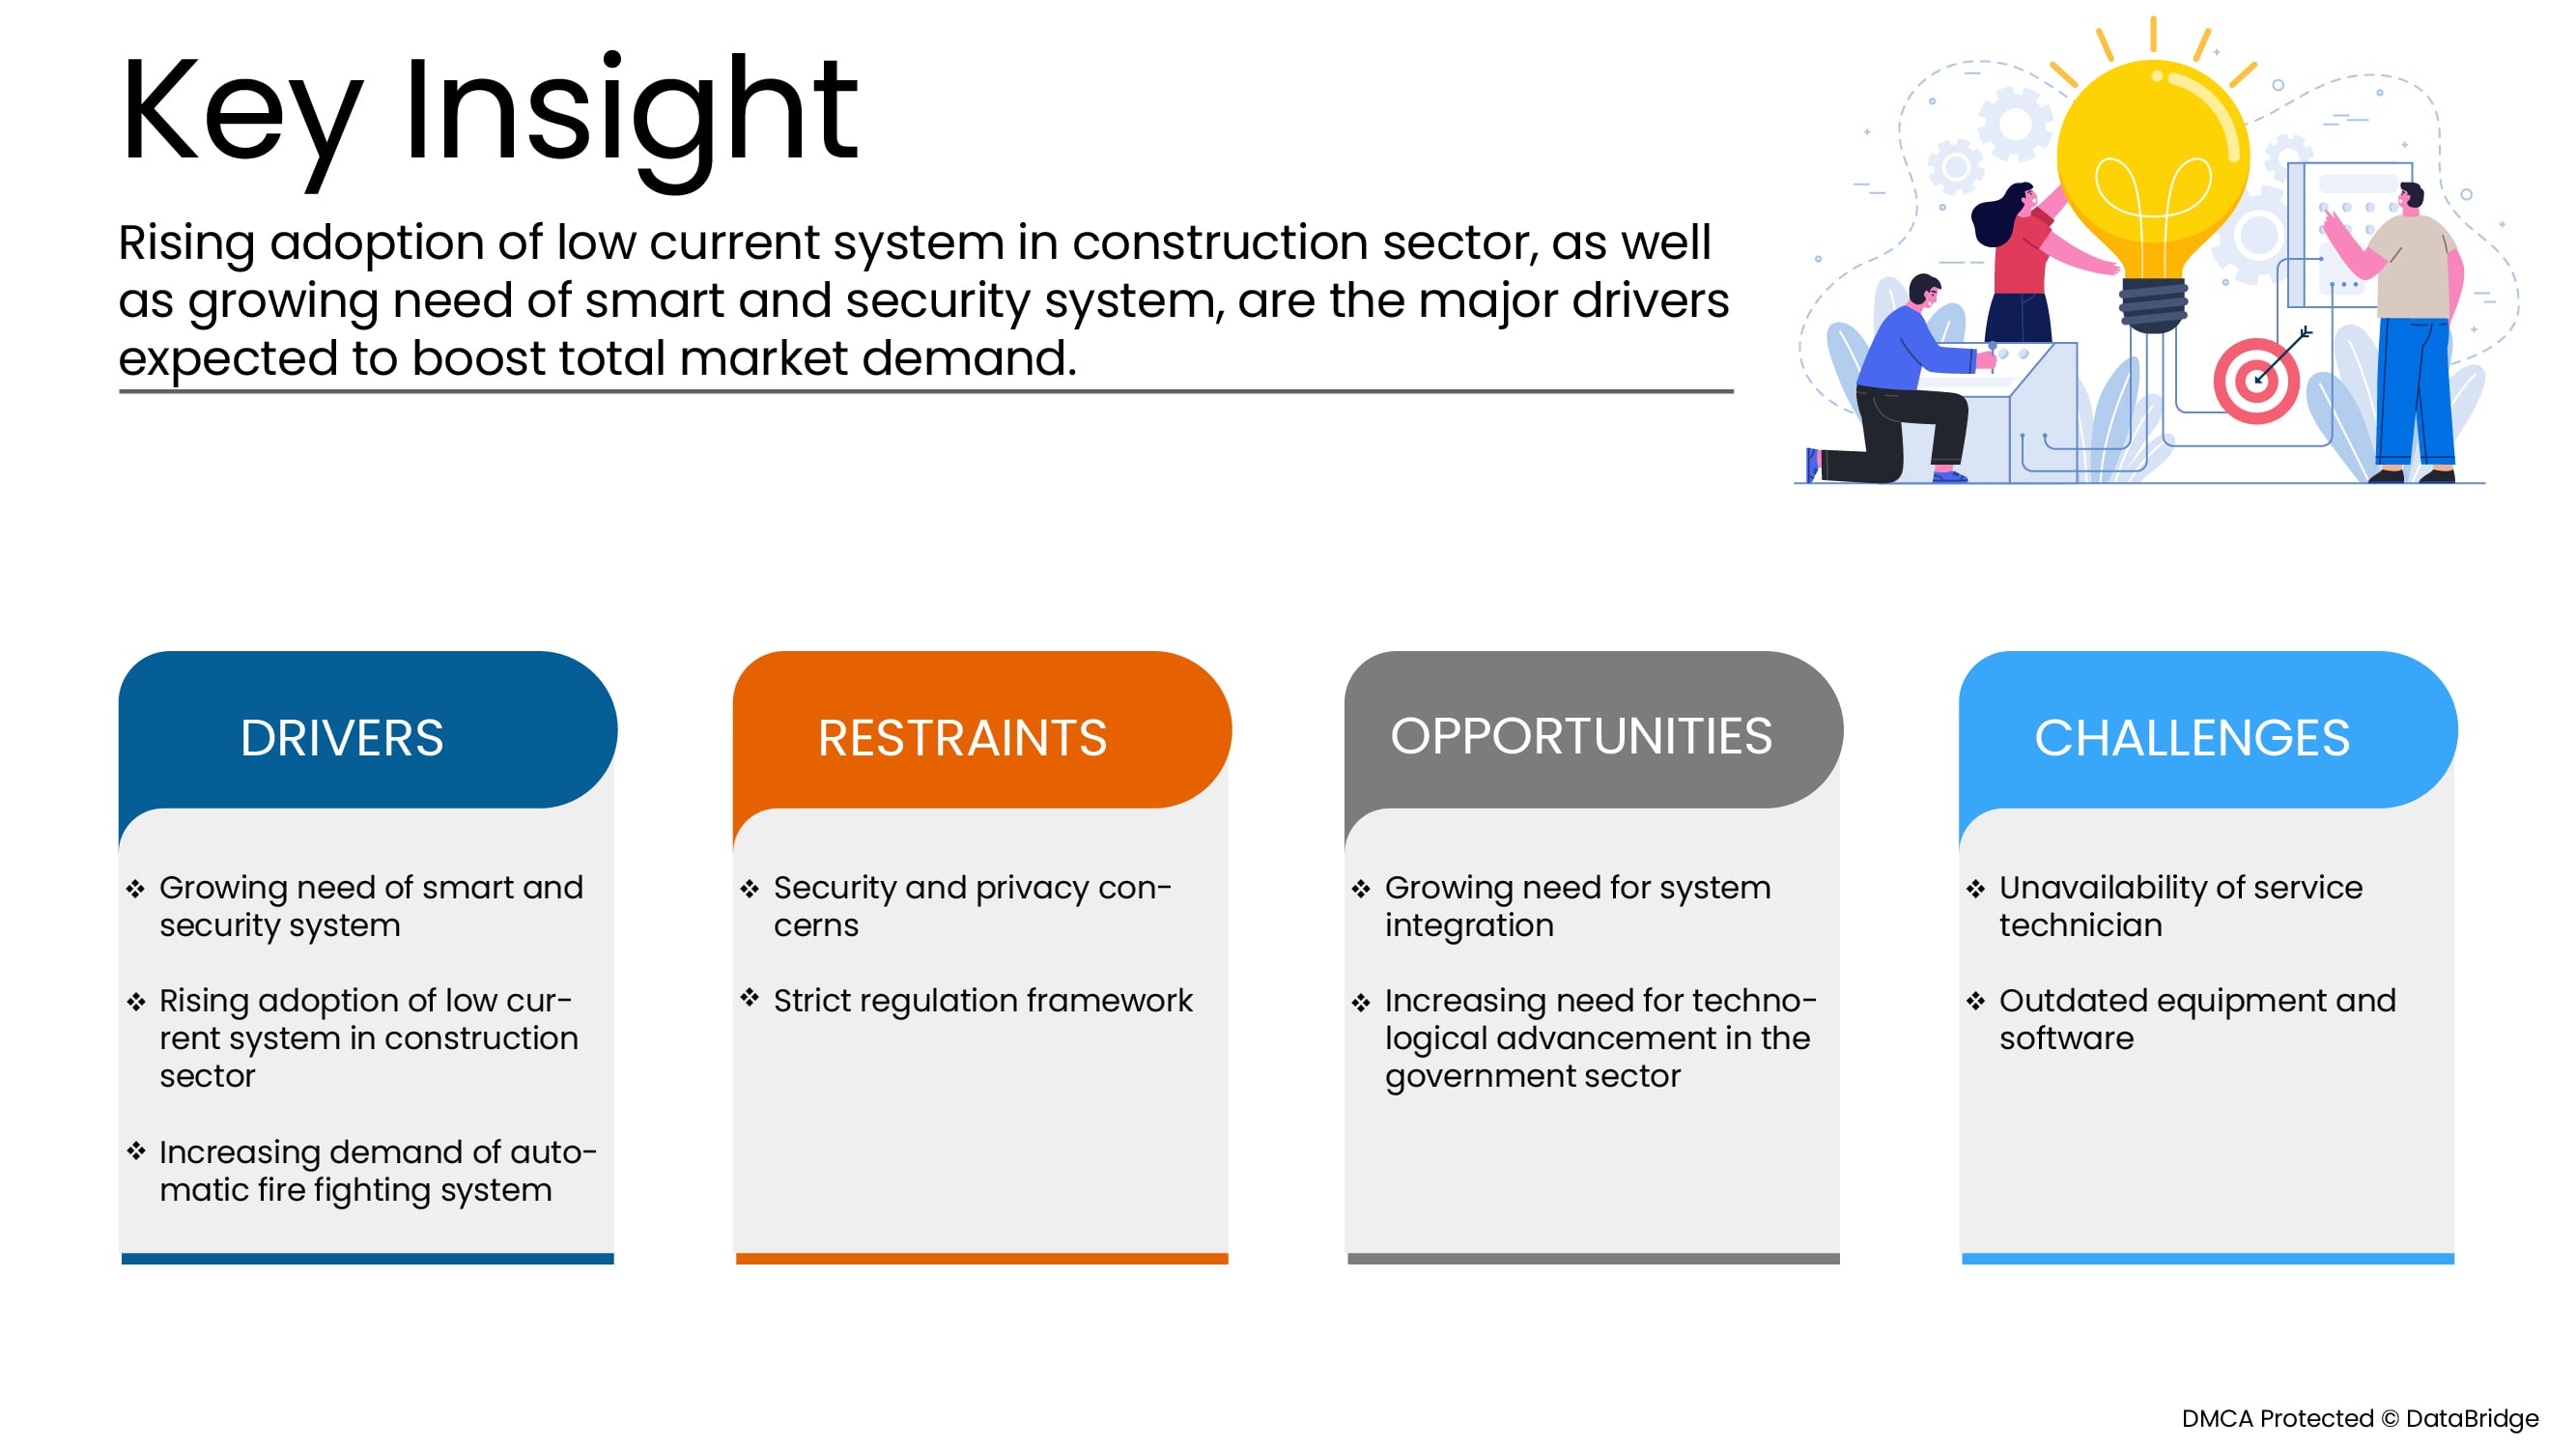
- Growing need for smart and security systems
Smart and security systems nowadays operate on low current signals with extra low voltage. Low current system infrastructure is the central part of any new building construction from residential, hotel, commercial, complexes, or smart university campuses.
A number of security systems include CCTV systems, home automation systems, lighting control, intruder alarm systems, master clock systems, smart TV and IPTV, audio-visual systems, public address system, nurse call system, network, and IP telephony are controlled by low current components.
- Rising adoption of the low current system in the construction sector
Small and medium enterprises are moving towards digitalization and building IT enabled infrastructure. This is being made possible by the low-current services offered by service providers. It has become more convenient for companies in UAE to opt for low current services by outsourcing the services to a third party without expanding the infrastructure, thus reducing the overall cost. SMEs in UAE are opting for low current services to optimize and transform their businesses, which is expected to act as a major driving factor for the market.
- Increasing demand for automatic fire fighting system
Firefighting systems are exceptionally used to avoid fire-related hazards. A distinction is made between systems that are actuated automatically and system which an operator actuates. The demand for automatic fire fighting systems is increasing because the automatic system includes sensors capable of detecting combustion, alarm signaling devices, fire-extinguishing equipment, starting and stopping devices, and feeders for the fire-extinguishing substances.
- Rising demand for remote working and learning facilities
The pandemic has disturbed schooling in more than 150 nations and impacted 1.6 billion understudies. Accordingly, numerous nations carried out some type of remote learning. The education response during the beginning stage of COVID-19 focused on executing remote learning modalities as a crisis reaction. However were not effective all the time but as the pandemic has developed, so too have education responses.
Restraints/Challenges
- Security and privacy concerns
The low current services and solutions such as structural cabling, CCTV solutions, advanced access control solutions, networking solutions, IP telephony systems & PABX solutions, PA system & VA system, master clock, and wireless solutions have complex structures. The security risk related to low current devices is that a fault in one component can destroy the whole system. The data stored in CCTV systems can get corrupted. Thus, these security concerns may act as a restraint for market growth.
- Unavailability of service technicians
Businesses can encounter downtime if technicians are not available to address the issues immediately. Retaining experienced and skilled staff can be challenging due to the decline in the availability of field service technicians. Maintenance and repair service is a collective affair, and the field service operations are heavily interconnected with several consecutive tasks involving multiple stakeholders that must be managed in a particular manner. The technicians are a crucial point of contact between the office and the field.
Post COVID-19 Impact on GCC IT Services Market
COVID-19 created a major impact on the IT services market as almost every country opted for the shutdown of every production facility except the ones dealing in producing the essential goods. The government has taken some strict actions such as the shutdown of production and sale of non-essential goods, blocked international trade, and many more to prevent the spread of COVID-19. The only business which was dealing in this pandemic situation were the essential services that were allowed to open and run the processes.
COVID-19 has impacted the IT services market. The limited investment costs and lack of employees hampered the sales and production of IT services. However, government and market key players adopted new safety measures for developing the practices. The advancements in technology escalated the growth rate of the IT services market as it targeted the right audience. The IT services construction market is expected to regain its pace during the post-pandemic scenario due to the easing of the restrictions.
Recent Developments
- In March 2019, TECO Middle. East launched a solution for company applications in android and apple systems. The application helps their customers to keep track of their upcoming and ongoing projects and be quick in decision-making. This application has helped the company to streamline its whole process
- In June 2022, Energy Pillars completed project ITT No. 2107-717 electrical upgradation works for facilities at Mina Zayed port. This completed project will help the company to attract new customers and will improve the brand value in the market
GCC IT Services Market Scope
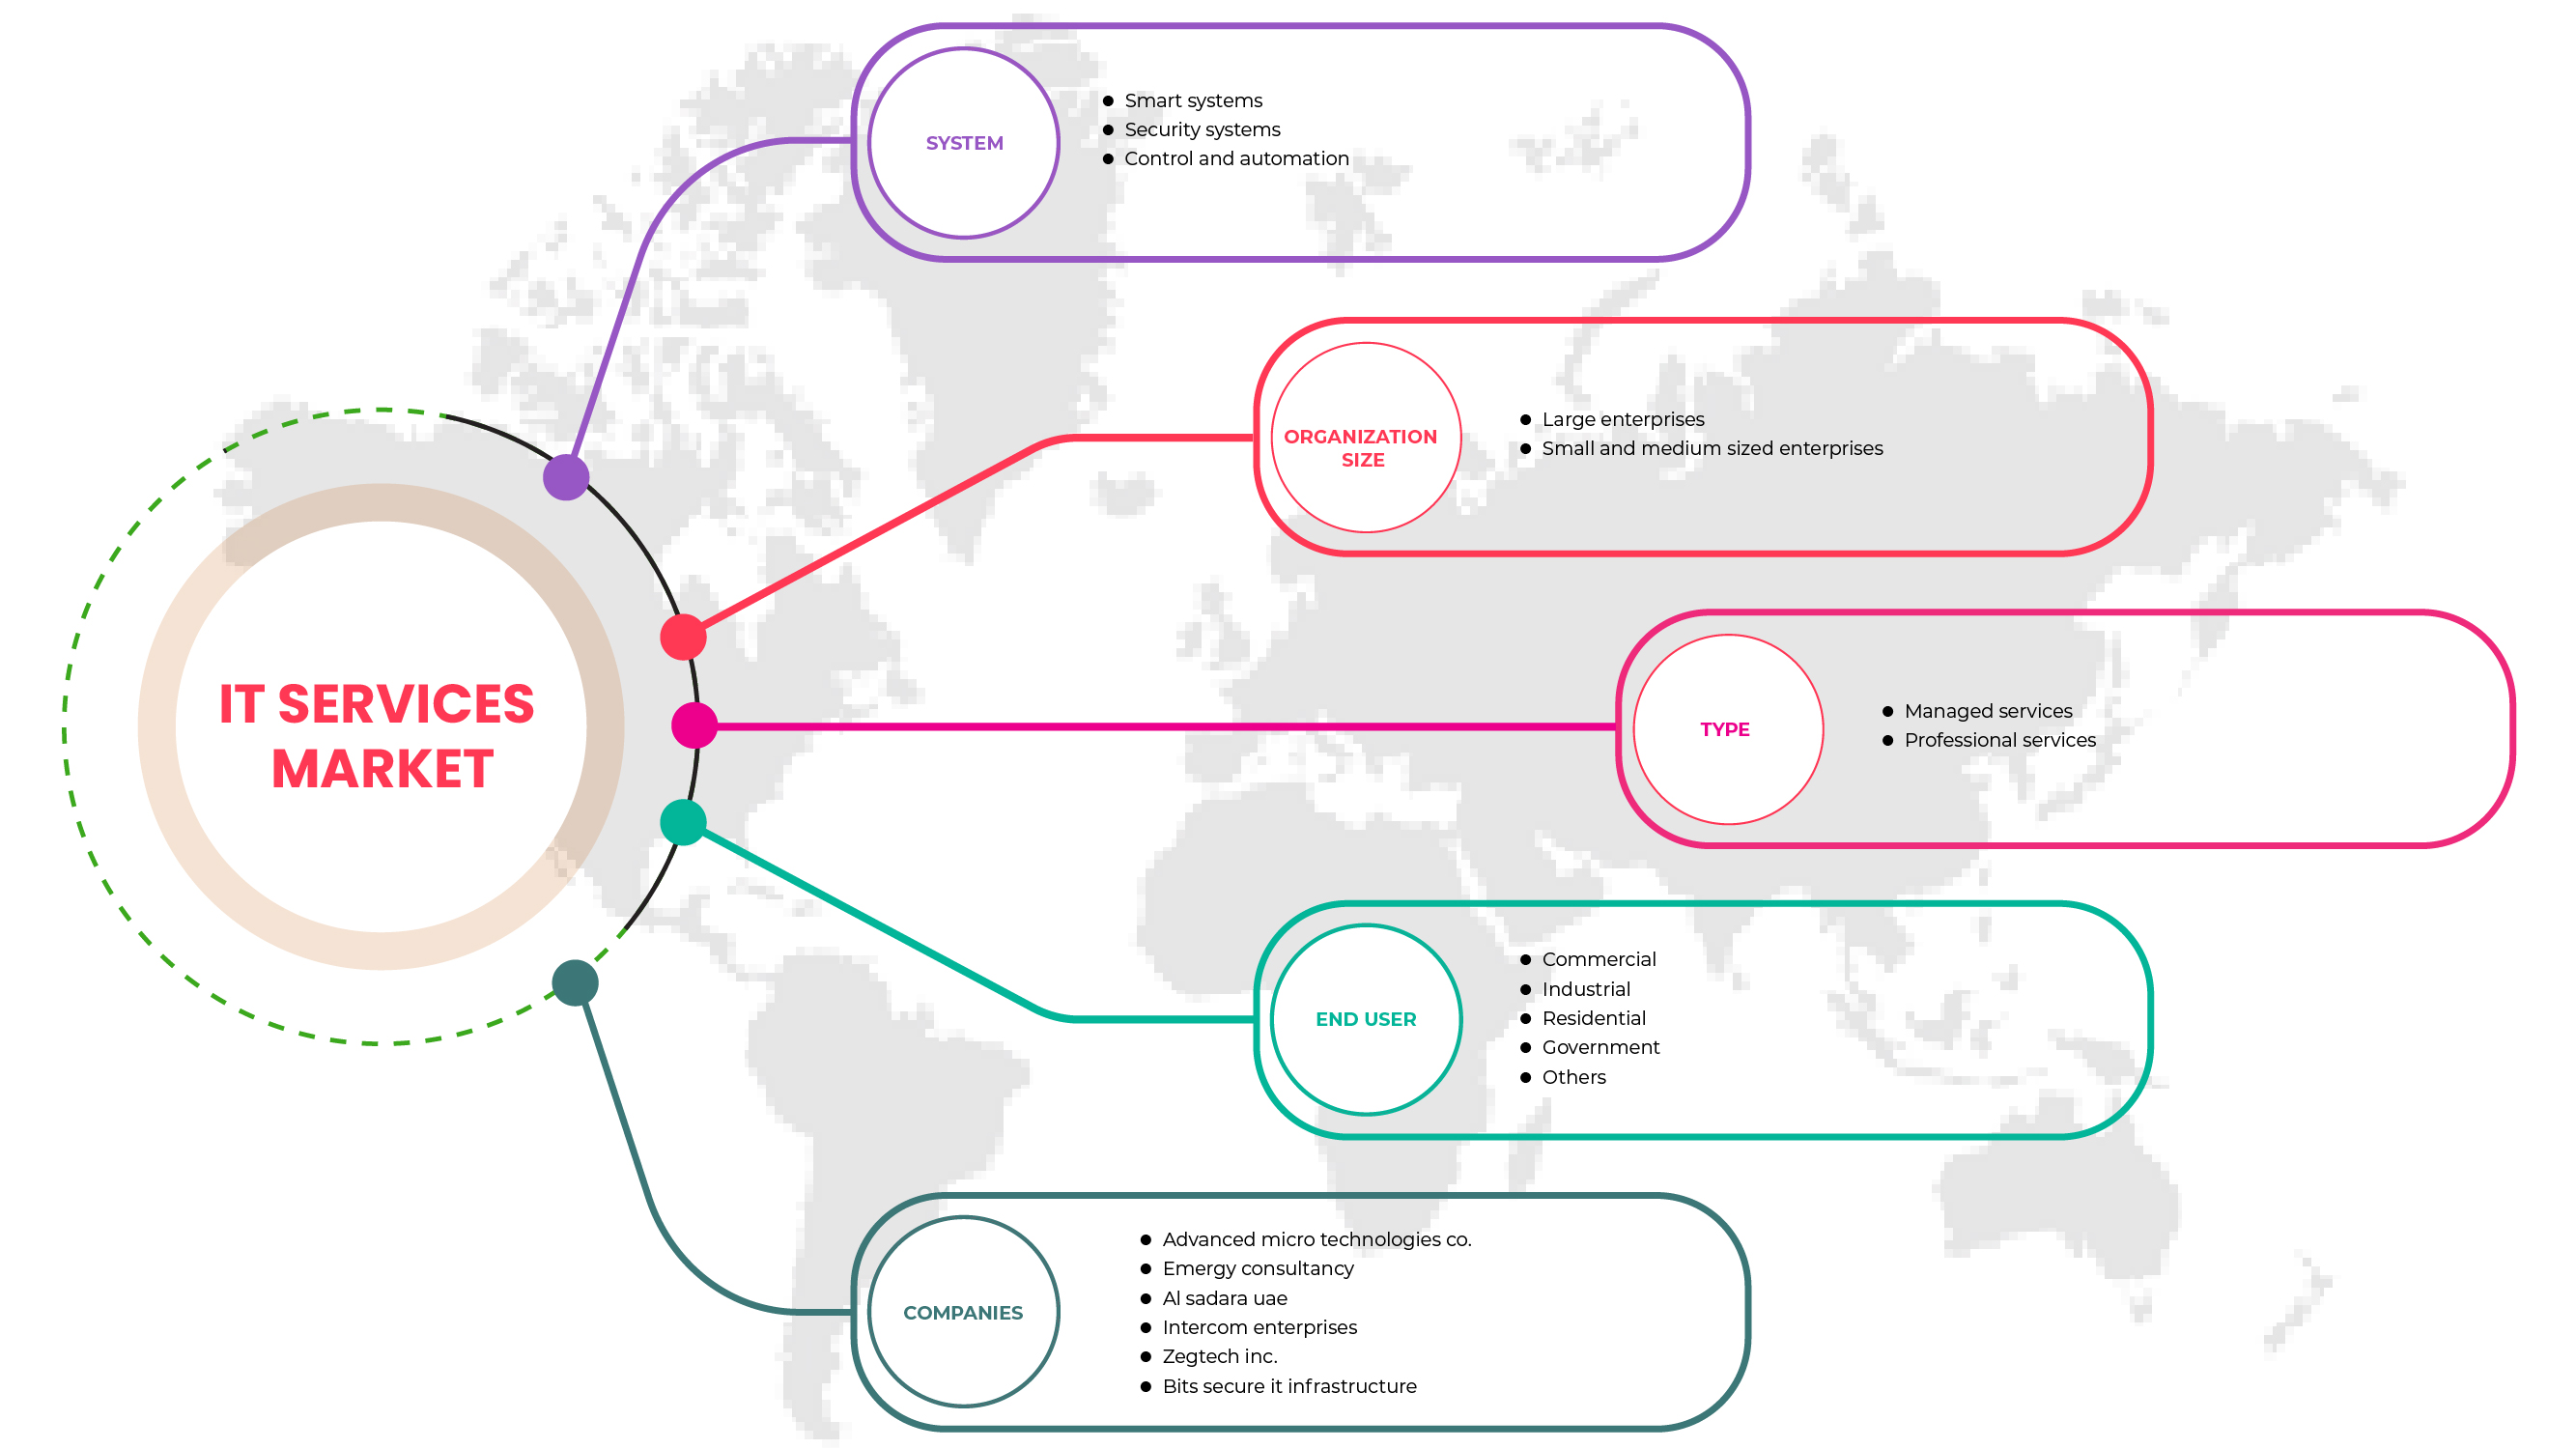
The GCC IT services market is segmented on the basis of type, organization size, system, and end-user. The growth amongst these segments will help you analyse meagre growth segments in the industries and provide the users with a valuable market overview and market insights to help them make strategic decisions for identifying core market applications.
System
- Smart system
- Security system
- Control and automation
On the basis of system, GCC IT services market is segmented into smart system, security system, and control and automation.
Type
- Professional services
- Managed services
On the basis of type, GCC IT services market is segmented into professional services and managed services.
Organization Size
- Large enterprises
- Small and medium enterprises
On the basis of tier organization size, GCC IT services market is segmented into large enterprises, and small and medium enterprises.
End User
- Commercial
- Industrial
- Residential
- Government
- Others
On the basis of end user, the GCC IT services market is segmented into commercial, industrial, residential, government, and others.
GCC IT services Market Regional Analysis/Insights
The GCC IT services market is analyzed, and market size insights and trends are provided by country, type, type, organization size, and end user, as referenced above.
The countries covered in the IT services market report UAE, Saudi Arabia, Qatar, Oman, Kuwait and Bahrain.
Saudi Arabia is expected to dominate the GCC IT services market due to the presence of large enterprises and a large volume of data flow across the region.
The country section of the report also provides individual market impacting factors and changes in market regulation that impact the current and future trends of the market. Data points such as downstream and upstream value chain analysis, technical trends, porter's five forces analysis, and case studies are some of the pointers used to forecast the market scenario for individual countries. Also, the presence and availability of Middle East brands and their challenges faced due to large or scarce competition from local and domestic brands, the impact of domestic tariffs and trade routes are considered while providing forecast analysis of the country data.
Competitive Landscape and GCC IT services Market Share Analysis
The IT services market competitive landscape provides details by a competitor. Details included are company overview, company financials, revenue generated, market potential, investment in research and development, new market initiatives, region presence, production sites and facilities, production capacities, company strengths and weaknesses, product launch, product width and breadth, application dominance. The above data points provided are only related to the companies' focus related to IT services market.
Some of the major players operating in the GCC IT services market are Intercom Enterprises, TECO Middle. East, Advanced Micro Technologies Co., Emirates Dawn., AL Sadara UAE, Energy Pillars, Mobi EGYPT, Industrial Dimensions Contracting Co., EMergy Consultancy, BITS secure IT infrastructure., Guqa IT Team, Zegtech Inc., BTC NETWORKS, Skies ltd., ADS, among others.
SKU-

- Interactive Data Analysis Dashboard
- Company Analysis Dashboard for high growth potential opportunities
- Research Analyst Access for customization & queries
- Competitor Analysis with Interactive dashboard
- Latest News, Updates & Trend analysis
- Harness the Power of Benchmark Analysis for Comprehensive Competitor Tracking
Table of Content
1 INTRODUCTION
1.1 OBJECTIVES OF THE STUDY
1.2 MARKET DEFINITION
1.3 OVERVIEW OF GCC IT SERVICES MARKET
1.4 CURRENCY AND PRICING
1.5 LIMITATIONS
1.6 MARKETS COVERED
2 MARKET SEGMENTATION
2.1 MARKETS COVERED
2.2 YEARS CONSIDERED FOR THE STUDY
2.3 GEOGRAPHIC SCOPE
2.4 DBMR TRIPOD DATA VALIDATION MODEL
2.5 PRIMARY INTERVIEWS WITH KEY OPINION LEADERS
2.6 DBMR MARKET POSITION GRID
2.7 VENDOR SHARE ANALYSIS
2.8 MARKET END-USER COVERAGE GRID
2.9 MULTIVARIATE MODELLING
2.1 SYSTEM CURVE
2.11 SECONDARY SOURCES
2.12 ASSUMPTIONS
3 EXECUTIVE SUMMARY
4 PREMIUM INSIGHTS
4.1 PORTERS FIVE FORCES
4.2 PESTEL ANALYSIS
4.2.1 POLITICAL FACTORS
4.2.2 ECONOMIC FACTORS
4.2.3 SOCIAL FACTORS
4.2.4 LEGAL FACTORS
4.2.5 TECHNOLOGICAL FACTORS
4.2.6 ENVIRONMENTAL FACTORS
4.3 BRAND COMPARATIVE ANALYSIS
4.4 REGULATORY STANDARD:
5 REGIONAL SUMMARY
6 MARKET OVERVIEW
6.1 DRIVER
6.1.1 GROWING NEED OF SMART AND SECURITY SYSTEMS
6.1.2 INCREASING DEMAND FOR AUTOMATIC FIRE FIGHTING SYSTEM
6.2 RESTRAINTS
6.2.1 RISING SECURITY AND PRIVACY CONCERNS
6.2.2 STRICT REGULATORY FRAMEWORK
6.3 OPPORTUNITIES
6.3.1 GROWING NEED FOR SYSTEM INTEGRATION
6.3.2 INCREASING NEED FOR TECHNOLOGICAL ADVANCEMENT IN LOW CURRENT DEVICES
6.3.3 RISING STRATEGIC PARTNERSHIP AND ACQUISITION AMONG ORGANIZATIONS FOR PHYSICAL AND CYBER SECURITY SYSTEM
6.4 CHALLENGES
6.4.1 UNAVAILABILITY OF SERVICE TECHNICIANS
6.4.2 OUTDATED EQUIPMENT AND SOFTWARE
7 GCC IT SERVICES MARKET, BY SYSTEM
7.1 OVERVIEW
7.2 SMART SYSTEM
7.2.1 FIRE ALARM SYSTEMS
7.2.2 PUBLIC ADDRESS SYSTEMS
7.2.3 AUDIO/VISUAL SYSTEMS
7.2.4 MASTER CLOCK SYSTEMS
7.2.5 SMATV & IPTV, OTT SYSTEMS
7.2.6 LIGHTING CONTROL
7.2.7 NETWORK AND IP TELEPHONY
7.2.8 HOME AUTOMATION SYSTEMS
7.2.9 INTRUDER ALARM SYSTEMS
7.2.10 NURSE CALL SYSTEM
7.2.11 OTHERS
7.3 SECURITY SYSTEM
7.3.1 CCTV, SECURITY AND SURVEILLANCE SYSTEMS
7.3.2 ACCESS CONTROL SYSTEMS
7.3.2.1 ACCESS DEVICES
7.3.2.1.1 BIOMETRIC AUTHENTICATION
7.3.2.1.2 SMART CARD AND MOBILE ID AUTHENTICATION
7.3.2.2 READERS
7.3.2.3 MAGNETIC AND ELECTRIC LOCKS
7.3.3 INTRUSION DETECTION SYSTEMS
7.3.4 GATES & BARRIERS
7.3.5 OTHERS
7.4 CONTROL AND AUTOMATION
7.4.1 BUILDING MANAGEMENT SYSTEMS (BMS)
7.4.2 FIBER OPTICS CABLE INSTALLATION AND TESTING
7.4.3 SCADA AND AUTOMATION
7.4.4 ACTIVE COMPONENTS
7.4.5 INSTRUMENT EQUIPMENT AND CONTROL
7.4.6 OTHERS
8 GCC IT SERVICES MARKET, BY TYPE
8.1 OVERVIEW
8.2 PROFESSIONAL SERVICES
8.2.1 INSTALLATION AND IMPLEMENTATION
8.2.2 DESIGNING
8.2.3 SUPPORT AND MAINTENANCE
8.2.4 UPGRADATION
8.3 MANAGES SERVICES
9 TURKEY IT SERVICES MARKET, BY ORGANIZATION SIZE
9.1 OVERVIEW
9.2 LARGE ENTERPRISES
9.3 SMALL AND MEDIUM ENTERPRISES
10 GCC IT SERVICES MARKET, BY END USER
10.1 OVERVIEW
10.2 COMMERCIAL
10.2.1 BY APPLICATION
10.2.1.1 AIRPORTS
10.2.1.2 RETAIL AND MALLS
10.2.1.3 HOSPITALITY
10.2.1.4 HEALTHCARE
10.2.1.5 BANKING AND FINANCIAL INSTITUTIONS
10.2.1.6 OTHERS
10.2.2 BY SYSTEM
10.2.2.1 SMART SYSTEM
10.2.2.2 SECURITY SYSTEM
10.2.2.3 CONTROL AND AUTOMATION
10.2.3 BY TYPE
10.2.3.1 PROFESSIONAL SERVICES
10.2.3.1.1 INSTALLATION AND IMPLEMENTATION
10.2.3.1.2 DESIGNING
10.2.3.1.3 SUPPORT AND MAINTENANCE
10.2.3.1.4 UPGRADATION
10.2.3.2 MANAGES SERVICES
10.3 INDUSTRIAL
10.3.1 BY APPLICATION
10.3.1.1 OIL & GAS
10.3.1.2 SECURITY
10.3.1.3 TELECOMMUNICATION
10.3.1.4 DATA CENTER
10.3.1.5 MANUFACTURING
10.3.1.6 OTHERS
10.3.2 BY SYSTEM
10.3.2.1 SMART SYSTEM
10.3.2.2 SECURITY SYSTEM
10.3.2.3 CONTROL AND AUTOMATION
10.3.3 BY SYSTEM
10.3.3.1 PROFESSIONAL SERVICES
10.3.3.1.1 INSTALLATION AND IMPLEMENTATION
10.3.3.1.2 DESIGNING
10.3.3.1.3 SUPPORT AND MAINTENANCE
10.3.3.1.4 UPGRADATION
10.3.3.2 MANAGES SERVICES
10.4 RESIDENTIAL
10.4.1 BY APPLICATION
10.4.1.1 MULTI FAMILY HOME
10.4.1.2 SINGLE FAMILY HOME
10.4.1.3 APARTMENTS
10.4.1.4 OTHERS
10.4.2 BY SYSTEM
10.4.2.1 SMART SYSTEM
10.4.2.2 SECURITY SYSTEM
10.4.2.3 CONTROL AND AUTOMATION
10.4.3 BY TYPE
10.4.3.1 PROFESSIONAL SERVICES
10.4.3.1.1 INSTALLATION AND IMPLEMENTATION
10.4.3.1.2 DESIGNING
10.4.3.1.3 SUPPORT AND MAINTENANCE
10.4.3.1.4 UPGRADATION
10.4.3.2 MANAGES SERVICES
10.5 GOVERNMENT
10.5.1 BY SYSTEM
10.5.1.1 SECURITY SYSTEM
10.5.1.2 SMART SYSTEM
10.5.1.3 CONTROL AND AUTOMATION
10.5.2 BY TYPE
10.5.2.1 PROFESSIONAL SERVICES
10.5.2.1.1 INSTALLATION AND IMPLEMENTATION
10.5.2.1.2 DESIGNING
10.5.2.1.3 SUPPORT AND MAINTENANCE
10.5.2.1.4 UPGRADATION
10.5.2.2 MANAGES SERVICES
10.6 OTHERS
11 GCC IT SERVICES MARKET, BY COUNTRY
11.1 SAUDI ARABIA
11.2 U.A.E.
11.3 QATAR
11.4 KUWAIT
11.5 OMAN
11.6 BAHRAIN
12 GCC IT SERVICES MARKET: COMPANY LANDSCAPE
12.1 COMPANY SHARE ANALYSIS: GCC
13 SWOT ANALYSIS
14 COMPANY PROFILE
14.1 MOBI EGYPT
14.1.1 COMPANY PROFILE
14.1.2 PRODUCT PORTFOLIO
14.1.3 RECENT DEVELOPMENT
14.2 INTERCOM ENTERPRISES
14.2.1 COMPANY PROFILE
14.2.2 SOLUTION PORTFOLIO
14.2.3 RECENT DEVELOPMENT
14.3 ADVANCED MICRO TECHNOLOGIES CO.
14.3.1 COMPANY PROFILE
14.3.2 SOLUTION PORTFOLIO
14.3.3 RECENT DEVELOPMENT
14.4 EMERGY CONSULTANCY
14.4.1 COMPANY SNAPSHOT
14.4.2 PRODUCT PORTFOLIO
14.4.3 RECENT DEVELOPMENTS
14.5 BITS SECURE IT INFRASTRUCTURE
14.5.1 COMPANY SNAPSHOT
14.5.2 PRODUCT PORTFOLIO
14.5.3 RECENT DEVELOPMENTS
14.6 ADS
14.6.1 COMPANY SNAPSHOT
14.6.2 PRODUCT PORTFOLIO
14.6.3 RECENT DEVELOPMENTS
14.7 AL SADARA UAE
14.7.1 COMPANY PROFILE
14.7.2 SERVICES PORTFOLIO
14.7.3 RECENT DEVELOPMENT
14.8 BTC NETWORKS
14.8.1 COMPANY SNAPSHOT
14.8.2 PRODUCT PORTFOLIO
14.8.3 RECENT DEVELOPMENTS
14.9 EMIRATES DAWN
14.9.1 COMPANY PROFILE
14.9.2 SERVICES PORTFOLIO
14.9.3 RECENT DEVELOPMENT
14.1 ENERGY PILLARS
14.10.1 COMPANY PROFILE
14.10.2 SERVICES PORTFOLIO
14.10.3 RECENT DEVELOPMENT
14.11 GUQA IT TEAM
14.11.1 COMPANY SNAPSHOT
14.11.2 PRODUCT PORTFOLIO
14.11.3 RECENT DEVELOPMENT
14.12 INDUSTRIAL DIMENSIONS CONTRACTING CO.
14.12.1 COMPANY SNAPSHOT
14.12.2 PRODUCT PORTFOLIO
14.12.3 RECENT DEVELOPMENTS
14.13 SKIES LTD.
14.13.1 COMPANY SNAPSHOT
14.13.2 PRODUCT PORTFOLIO
14.13.3 RECENT DEVELOPMENTS
14.14 TECO MIDDLE. EAST
14.14.1 COMPANY PROFILE
14.14.2 SERVICE PORTFOLIO
14.14.3 RECENT DEVELOPMENT
14.15 ZEGTECH INC.
14.15.1 COMPANY SNAPSHOT
14.15.2 PRODUCT PORTFOLIO
14.15.3 RECENT DEVELOPMENTS
15 QUESTIONNAIRE
16 RELATED REPORTS
List of Table
TABLE 1 GCC IT SERVICES MARKET, BY SYSTEM, 2020-2029 (USD MILLION)
TABLE 2 GCC SMART SYSTEM IN IT SERVICES MARKET, BY TYPE, 2020-2029 (USD MILLION)
TABLE 3 GCC SECURITY SYSTEM IN IT SERVICES MARKET, BY TYPE, 2020-2029 (USD MILLION)
TABLE 4 GCC ACCESS CONTROL SYSTEMS IN IT SERVICES MARKET, BY TYPE, 2020-2029 (USD MILLION)
TABLE 5 GCC ACCESS DEVICE IN IT SERVICES MARKET, BY TYPE, 2020-2029 (USD MILLION)
TABLE 6 GCC CONTROL AND AUTOMATION IN IT SERVICES MARKET, BY TYPE, 2020-2029 (USD MILLION)
TABLE 7 GCC IT SERVICES MARKET, BY TYPE, 2020-2029 (USD MILLION)
TABLE 8 GCC PROFESSIONAL SERVICES IN IT SERVICES MARKET, BY TYPE, 2020-2029 (USD MILLION)
TABLE 9 GCC IT SERVICES MARKET, BY ORGANIZATION SIZE, 2020-2029 (USD MILLION)
TABLE 10 GCC IT SERVICES MARKET, BY END USER, 2020-2029 (USD MILLION)
TABLE 11 GCC COMMERCIAL IN IT SERVICES MARKET, BY APPLICATION, 2020-2029 (USD MILLION)
TABLE 12 GCC COMMERCIAL IN IT SERVICES MARKET, BY SYSTEM, 2020-2029 (USD MILLION)
TABLE 13 GCC COMMERCIAL IN IT SERVICES MARKET, BY TYPE, 2020-2029 (USD MILLION)
TABLE 14 GCC PROFESSIONAL SERVICES IN IT SERVICES MARKET, BY TYPE, 2020-2029 (USD MILLION)
TABLE 15 GCC INDUSTRIAL IN IT SERVICES MARKET, BY APPLICATION, 2020-2029 (USD MILLION)
TABLE 16 GCC INDUSTRIAL IN IT SERVICES MARKET, BY SYSTEM, 2020-2029 (USD MILLION)
TABLE 17 GCC INDUSTRIAL IN IT SERVICES MARKET, BY TYPE, 2020-2029 (USD MILLION)
TABLE 18 GCC PROFESSIONAL SERVICES IN IT SERVICES MARKET, BY TYPE, 2020-2029 (USD MILLION)
TABLE 19 GCC RESIDENTIAL IN IT SERVICES MARKET, BY APPLICATION, 2020-2029 (USD MILLION)
TABLE 20 GCC RESIDENTIAL IN IT SERVICES MARKET, BY SYSTEM, 2020-2029 (USD MILLION)
TABLE 21 GCC RESIDENTIAL IN IT SERVICES MARKET, BY TYPE, 2020-2029 (USD MILLION)
TABLE 22 GCC PROFESSIONAL SERVICES IN IT SERVICES MARKET, BY TYPE, 2020-2029 (USD MILLION)
TABLE 23 GCC GOVERNMENT IN IT SERVICES MARKET, BY SYSTEM, 2020-2029 (USD MILLION)
TABLE 24 GCC GOVERNMENT IN IT SERVICES MARKET, BY TYPE, 2020-2029 (USD MILLION)
TABLE 25 GCC PROFESSIONAL SERVICES IN IT SERVICES MARKET, BY TYPE, 2020-2029 (USD MILLION)
TABLE 26 GCC IT SERVICES MARKET, BY COUNTRY, 2020-2029 (USD MILLION)
TABLE 27 SAUDI ARABIA IT SERVICES MARKET, BY SYSTEM, 2020-2029 (USD MILLION)
TABLE 28 SAUDI ARABIA SMART SYSTEM IN IT SERVICES MARKET, BY TYPE, 2020-2029 (USD MILLION)
TABLE 29 SAUDI ARABIA SECURITY SYSTEM IN IT SERVICES MARKET, BY TYPE, 2020-2029 (USD MILLION)
TABLE 30 SAUDI ARABIA ACCESS CONTROL SYSTEMS IN IT SERVICES MARKET, BY TYPE, 2020-2029 (USD MILLION)
TABLE 31 SAUDI ARABIA ACCESS DEVICE IN IT SERVICES MARKET, BY TYPE, 2020-2029 (USD MILLION)
TABLE 32 SAUDI ARABIA CONTROL AND AUTOMATION IN IT SERVICES MARKET, BY TYPE, 2020-2029 (USD MILLION)
TABLE 33 SAUDI ARABIA IT SERVICES MARKET, BY TYPE, 2020-2029 (USD MILLION)
TABLE 34 SAUDI ARABIA PROFESSIONAL SERVICES IN IT SERVICES MARKET, BY TYPE, 2020-2029 (USD MILLION)
TABLE 35 SAUDI ARABIA IT SERVICES MARKET, BY ORGANIZATION SIZE, 2020-2029 (USD MILLION)
TABLE 36 SAUDI ARABIA IT SERVICES MARKET, BY END USER, 2020-2029 (USD MILLION)
TABLE 37 SAUDI ARABIA COMMERCIAL IN IT SERVICES MARKET, BY APPLICATION, 2020-2029 (USD MILLION)
TABLE 38 SAUDI ARABIA COMMERCIAL IN IT SERVICES MARKET, BY SYSTEM, 2020-2029 (USD MILLION)
TABLE 39 SAUDI ARABIA COMMERCIAL IN IT SERVICES MARKET, BY TYPE, 2020-2029 (USD MILLION)
TABLE 40 SAUDI ARABIA PROFESSIONAL SERVICES IN IT SERVICES MARKET, BY TYPE, 2020-2029 (USD MILLION)
TABLE 41 SAUDI ARABIA INDUSTRIAL IN IT SERVICES MARKET, BY APPLICATION, 2020-2029 (USD MILLION)
TABLE 42 SAUDI ARABIA INDUSTRIAL IN IT SERVICES MARKET, BY SYSTEM, 2020-2029 (USD MILLION)
TABLE 43 SAUDI ARABIA INDUSTRIAL IN IT SERVICES MARKET, BY TYPE, 2020-2029 (USD MILLION)
TABLE 44 SAUDI ARABIA PROFESSIONAL SERVICES IN IT SERVICES MARKET, BY TYPE, 2020-2029 (USD MILLION)
TABLE 45 SAUDI ARABIA RESIDENTIAL IN IT SERVICES MARKET, BY APPLICATION, 2020-2029 (USD MILLION)
TABLE 46 SAUDI ARABIA RESIDENTIAL IN IT SERVICES MARKET, BY SYSTEM, 2020-2029 (USD MILLION)
TABLE 47 SAUDI ARABIA RESIDENTIAL IN IT SERVICES MARKET, BY TYPE, 2020-2029 (USD MILLION)
TABLE 48 SAUDI ARABIA PROFESSIONAL SERVICES IN IT SERVICES MARKET, BY TYPE, 2020-2029 (USD MILLION)
TABLE 49 SAUDI ARABIA GOVERNMENT IN IT SERVICES MARKET, BY SYSTEM, 2020-2029 (USD MILLION)
TABLE 50 SAUDI ARABIA GOVERNMENT IN IT SERVICES MARKET, BY TYPE, 2020-2029 (USD MILLION)
TABLE 51 SAUDI ARABIA PROFESSIONAL SERVICES IN IT SERVICES MARKET, BY TYPE, 2020-2029 (USD MILLION)
TABLE 52 U.A.E. IT SERVICES MARKET, BY SYSTEM, 2020-2029 (USD MILLION)
TABLE 53 U.A.E. SMART SYSTEM IN IT SERVICES MARKET, BY TYPE, 2020-2029 (USD MILLION)
TABLE 54 U.A.E. SECURITY SYSTEM IN IT SERVICES MARKET, BY TYPE, 2020-2029 (USD MILLION)
TABLE 55 U.A.E. ACCESS CONTROL SYSTEMS IN IT SERVICES MARKET, BY TYPE, 2020-2029 (USD MILLION)
TABLE 56 U.A.E. ACCESS DEVICE IN IT SERVICES MARKET, BY TYPE, 2020-2029 (USD MILLION)
TABLE 57 U.A.E. CONTROL AND AUTOMATION IN IT SERVICES MARKET, BY TYPE, 2020-2029 (USD MILLION)
TABLE 58 U.A.E. IT SERVICES MARKET, BY TYPE, 2020-2029 (USD MILLION)
TABLE 59 U.A.E. PROFESSIONAL SERVICES IN IT SERVICES MARKET, BY TYPE, 2020-2029 (USD MILLION)
TABLE 60 U.A.E. IT SERVICES MARKET, BY ORGANIZATION SIZE, 2020-2029 (USD MILLION)
TABLE 61 U.A.E. IT SERVICES MARKET, BY END USER, 2020-2029 (USD MILLION)
TABLE 62 U.A.E. COMMERCIAL IN IT SERVICES MARKET, BY APPLICATION, 2020-2029 (USD MILLION)
TABLE 63 U.A.E. COMMERCIAL IN IT SERVICES MARKET, BY SYSTEM, 2020-2029 (USD MILLION)
TABLE 64 U.A.E. COMMERCIAL IN IT SERVICES MARKET, BY TYPE, 2020-2029 (USD MILLION)
TABLE 65 U.A.E. PROFESSIONAL SERVICES IN IT SERVICES MARKET, BY TYPE, 2020-2029 (USD MILLION)
TABLE 66 U.A.E. INDUSTRIAL IN IT SERVICES MARKET, BY APPLICATION, 2020-2029 (USD MILLION)
TABLE 67 U.A.E. INDUSTRIAL IN IT SERVICES MARKET, BY SYSTEM, 2020-2029 (USD MILLION)
TABLE 68 U.A.E. INDUSTRIAL IN IT SERVICES MARKET, BY TYPE, 2020-2029 (USD MILLION)
TABLE 69 U.A.E. PROFESSIONAL SERVICES IN IT SERVICES MARKET, BY TYPE, 2020-2029 (USD MILLION)
TABLE 70 U.A.E. RESIDENTIAL IN IT SERVICES MARKET, BY APPLICATION, 2020-2029 (USD MILLION)
TABLE 71 U.A.E. RESIDENTIAL IN IT SERVICES MARKET, BY SYSTEM, 2020-2029 (USD MILLION)
TABLE 72 U.A.E. RESIDENTIAL IN IT SERVICES MARKET, BY TYPE, 2020-2029 (USD MILLION)
TABLE 73 U.A.E. PROFESSIONAL SERVICES IN IT SERVICES MARKET, BY TYPE, 2020-2029 (USD MILLION)
TABLE 74 U.A.E. GOVERNMENT IN IT SERVICES MARKET, BY SYSTEM, 2020-2029 (USD MILLION)
TABLE 75 U.A.E. GOVERNMENT IN IT SERVICES MARKET, BY TYPE, 2020-2029 (USD MILLION)
TABLE 76 U.A.E. PROFESSIONAL SERVICES IN IT SERVICES MARKET, BY TYPE, 2020-2029 (USD MILLION)
TABLE 77 QATAR IT SERVICES MARKET, BY SYSTEM, 2020-2029 (USD MILLION)
TABLE 78 QATAR SMART SYSTEM IN IT SERVICES MARKET, BY TYPE, 2020-2029 (USD MILLION)
TABLE 79 QATAR SECURITY SYSTEM IN IT SERVICES MARKET, BY TYPE, 2020-2029 (USD MILLION)
TABLE 80 QATAR ACCESS CONTROL SYSTEMS IN IT SERVICES MARKET, BY TYPE, 2020-2029 (USD MILLION)
TABLE 81 QATAR ACCESS DEVICE IN IT SERVICES MARKET, BY TYPE, 2020-2029 (USD MILLION)
TABLE 82 QATAR CONTROL AND AUTOMATION IN IT SERVICES MARKET, BY TYPE, 2020-2029 (USD MILLION)
TABLE 83 QATAR IT SERVICES MARKET, BY TYPE, 2020-2029 (USD MILLION)
TABLE 84 QATAR PROFESSIONAL SERVICES IN IT SERVICES MARKET, BY TYPE, 2020-2029 (USD MILLION)
TABLE 85 QATAR IT SERVICES MARKET, BY ORGANIZATION SIZE, 2020-2029 (USD MILLION)
TABLE 86 QATAR IT SERVICES MARKET, BY END USER, 2020-2029 (USD MILLION)
TABLE 87 QATAR COMMERCIAL IN IT SERVICES MARKET, BY APPLICATION, 2020-2029 (USD MILLION)
TABLE 88 QATAR COMMERCIAL IN IT SERVICES MARKET, BY SYSTEM, 2020-2029 (USD MILLION)
TABLE 89 QATAR COMMERCIAL IN IT SERVICES MARKET, BY TYPE, 2020-2029 (USD MILLION)
TABLE 90 QATAR PROFESSIONAL SERVICES IN IT SERVICES MARKET, BY TYPE, 2020-2029 (USD MILLION)
TABLE 91 QATAR INDUSTRIAL IN IT SERVICES MARKET, BY APPLICATION, 2020-2029 (USD MILLION)
TABLE 92 QATAR INDUSTRIAL IN IT SERVICES MARKET, BY SYSTEM, 2020-2029 (USD MILLION)
TABLE 93 QATAR INDUSTRIAL IN IT SERVICES MARKET, BY TYPE, 2020-2029 (USD MILLION)
TABLE 94 QATAR PROFESSIONAL SERVICES IN IT SERVICES MARKET, BY TYPE, 2020-2029 (USD MILLION)
TABLE 95 QATAR RESIDENTIAL IN IT SERVICES MARKET, BY APPLICATION, 2020-2029 (USD MILLION)
TABLE 96 QATAR RESIDENTIAL IN IT SERVICES MARKET, BY SYSTEM, 2020-2029 (USD MILLION)
TABLE 97 QATAR RESIDENTIAL IN IT SERVICES MARKET, BY TYPE, 2020-2029 (USD MILLION)
TABLE 98 QATAR PROFESSIONAL SERVICES IN IT SERVICES MARKET, BY TYPE, 2020-2029 (USD MILLION)
TABLE 99 QATAR GOVERNMENT IN IT SERVICES MARKET, BY SYSTEM, 2020-2029 (USD MILLION)
TABLE 100 QATAR GOVERNMENT IN IT SERVICES MARKET, BY TYPE, 2020-2029 (USD MILLION)
TABLE 101 QATAR PROFESSIONAL SERVICES IN IT SERVICES MARKET, BY TYPE, 2020-2029 (USD MILLION)
TABLE 102 KUWAIT IT SERVICES MARKET, BY SYSTEM, 2020-2029 (USD MILLION)
TABLE 103 KUWAIT SMART SYSTEM IN IT SERVICES MARKET, BY TYPE, 2020-2029 (USD MILLION)
TABLE 104 KUWAIT SECURITY SYSTEM IN IT SERVICES MARKET, BY TYPE, 2020-2029 (USD MILLION)
TABLE 105 KUWAIT ACCESS CONTROL SYSTEMS IN IT SERVICES MARKET, BY TYPE, 2020-2029 (USD MILLION)
TABLE 106 KUWAIT ACCESS DEVICE IN IT SERVICES MARKET, BY TYPE, 2020-2029 (USD MILLION)
TABLE 107 KUWAIT CONTROL AND AUTOMATION IN IT SERVICES MARKET, BY TYPE, 2020-2029 (USD MILLION)
TABLE 108 KUWAIT IT SERVICES MARKET, BY TYPE, 2020-2029 (USD MILLION)
TABLE 109 KUWAIT PROFESSIONAL SERVICES IN IT SERVICES MARKET, BY TYPE, 2020-2029 (USD MILLION)
TABLE 110 KUWAIT IT SERVICES MARKET, BY ORGANIZATION SIZE, 2020-2029 (USD MILLION)
TABLE 111 KUWAIT IT SERVICES MARKET, BY END USER, 2020-2029 (USD MILLION)
TABLE 112 KUWAIT COMMERCIAL IN IT SERVICES MARKET, BY APPLICATION, 2020-2029 (USD MILLION)
TABLE 113 KUWAIT COMMERCIAL IN IT SERVICES MARKET, BY SYSTEM, 2020-2029 (USD MILLION)
TABLE 114 KUWAIT COMMERCIAL IN IT SERVICES MARKET, BY TYPE, 2020-2029 (USD MILLION)
TABLE 115 KUWAIT PROFESSIONAL SERVICES IN IT SERVICES MARKET, BY TYPE, 2020-2029 (USD MILLION)
TABLE 116 KUWAIT INDUSTRIAL IN IT SERVICES MARKET, BY APPLICATION, 2020-2029 (USD MILLION)
TABLE 117 KUWAIT INDUSTRIAL IN IT SERVICES MARKET, BY SYSTEM, 2020-2029 (USD MILLION)
TABLE 118 KUWAIT INDUSTRIAL IN IT SERVICES MARKET, BY TYPE, 2020-2029 (USD MILLION)
TABLE 119 KUWAIT PROFESSIONAL SERVICES IN IT SERVICES MARKET, BY TYPE, 2020-2029 (USD MILLION)
TABLE 120 KUWAIT RESIDENTIAL IN IT SERVICES MARKET, BY APPLICATION, 2020-2029 (USD MILLION)
TABLE 121 KUWAIT RESIDENTIAL IN IT SERVICES MARKET, BY SYSTEM, 2020-2029 (USD MILLION)
TABLE 122 KUWAIT RESIDENTIAL IN IT SERVICES MARKET, BY TYPE, 2020-2029 (USD MILLION)
TABLE 123 KUWAIT PROFESSIONAL SERVICES IN IT SERVICES MARKET, BY TYPE, 2020-2029 (USD MILLION)
TABLE 124 KUWAIT GOVERNMENT IN IT SERVICES MARKET, BY SYSTEM, 2020-2029 (USD MILLION)
TABLE 125 KUWAIT GOVERNMENT IN IT SERVICES MARKET, BY TYPE, 2020-2029 (USD MILLION)
TABLE 126 KUWAIT PROFESSIONAL SERVICES IN IT SERVICES MARKET, BY TYPE, 2020-2029 (USD MILLION)
TABLE 127 OMAN IT SERVICES MARKET, BY SYSTEM, 2020-2029 (USD MILLION)
TABLE 128 OMAN SMART SYSTEM IN IT SERVICES MARKET, BY TYPE, 2020-2029 (USD MILLION)
TABLE 129 OMAN SECURITY SYSTEM IN IT SERVICES MARKET, BY TYPE, 2020-2029 (USD MILLION)
TABLE 130 OMAN ACCESS CONTROL SYSTEMS IN IT SERVICES MARKET, BY TYPE, 2020-2029 (USD MILLION)
TABLE 131 OMAN ACCESS DEVICE IN IT SERVICES MARKET, BY TYPE, 2020-2029 (USD MILLION)
TABLE 132 OMAN CONTROL AND AUTOMATION IN IT SERVICES MARKET, BY TYPE, 2020-2029 (USD MILLION)
TABLE 133 OMAN IT SERVICES MARKET, BY TYPE, 2020-2029 (USD MILLION)
TABLE 134 OMAN PROFESSIONAL SERVICES IN IT SERVICES MARKET, BY TYPE, 2020-2029 (USD MILLION)
TABLE 135 OMAN IT SERVICES MARKET, BY ORGANIZATION SIZE, 2020-2029 (USD MILLION)
TABLE 136 OMAN IT SERVICES MARKET, BY END USER, 2020-2029 (USD MILLION)
TABLE 137 OMAN COMMERCIAL IN IT SERVICES MARKET, BY APPLICATION, 2020-2029 (USD MILLION)
TABLE 138 OMAN COMMERCIAL IN IT SERVICES MARKET, BY SYSTEM, 2020-2029 (USD MILLION)
TABLE 139 OMAN COMMERCIAL IN IT SERVICES MARKET, BY TYPE, 2020-2029 (USD MILLION)
TABLE 140 OMAN PROFESSIONAL SERVICES IN IT SERVICES MARKET, BY TYPE, 2020-2029 (USD MILLION)
TABLE 141 OMAN INDUSTRIAL IN IT SERVICES MARKET, BY APPLICATION, 2020-2029 (USD MILLION)
TABLE 142 OMAN INDUSTRIAL IN IT SERVICES MARKET, BY SYSTEM, 2020-2029 (USD MILLION)
TABLE 143 OMAN INDUSTRIAL IN IT SERVICES MARKET, BY TYPE, 2020-2029 (USD MILLION)
TABLE 144 OMAN PROFESSIONAL SERVICES IN IT SERVICES MARKET, BY TYPE, 2020-2029 (USD MILLION)
TABLE 145 OMAN RESIDENTIAL IN IT SERVICES MARKET, BY APPLICATION, 2020-2029 (USD MILLION)
TABLE 146 OMAN RESIDENTIAL IN IT SERVICES MARKET, BY SYSTEM, 2020-2029 (USD MILLION)
TABLE 147 OMAN RESIDENTIAL IN IT SERVICES MARKET, BY TYPE, 2020-2029 (USD MILLION)
TABLE 148 OMAN PROFESSIONAL SERVICES IN IT SERVICES MARKET, BY TYPE, 2020-2029 (USD MILLION)
TABLE 149 OMAN GOVERNMENT IN IT SERVICES MARKET, BY SYSTEM, 2020-2029 (USD MILLION)
TABLE 150 OMAN GOVERNMENT IN IT SERVICES MARKET, BY TYPE, 2020-2029 (USD MILLION)
TABLE 151 OMAN PROFESSIONAL SERVICES IN IT SERVICES MARKET, BY TYPE, 2020-2029 (USD MILLION)
TABLE 152 BAHRAIN IT SERVICES MARKET, BY SYSTEM, 2020-2029 (USD MILLION)
TABLE 153 BAHRAIN SMART SYSTEM IN IT SERVICES MARKET, BY TYPE, 2020-2029 (USD MILLION)
TABLE 154 BAHRAIN SECURITY SYSTEM IN IT SERVICES MARKET, BY TYPE, 2020-2029 (USD MILLION)
TABLE 155 BAHRAIN ACCESS CONTROL SYSTEMS IN IT SERVICES MARKET, BY TYPE, 2020-2029 (USD MILLION)
TABLE 156 BAHRAIN ACCESS DEVICE IN IT SERVICES MARKET, BY TYPE, 2020-2029 (USD MILLION)
TABLE 157 BAHRAIN CONTROL AND AUTOMATION IN IT SERVICES MARKET, BY TYPE, 2020-2029 (USD MILLION)
TABLE 158 BAHRAIN IT SERVICES MARKET, BY TYPE, 2020-2029 (USD MILLION)
TABLE 159 BAHRAIN PROFESSIONAL SERVICES IN IT SERVICES MARKET, BY TYPE, 2020-2029 (USD MILLION)
TABLE 160 BAHRAIN IT SERVICES MARKET, BY ORGANIZATION SIZE, 2020-2029 (USD MILLION)
TABLE 161 BAHRAIN IT SERVICES MARKET, BY END USER, 2020-2029 (USD MILLION)
TABLE 162 BAHRAIN COMMERCIAL IN IT SERVICES MARKET, BY APPLICATION, 2020-2029 (USD MILLION)
TABLE 163 BAHRAIN COMMERCIAL IN IT SERVICES MARKET, BY SYSTEM, 2020-2029 (USD MILLION)
TABLE 164 BAHRAIN COMMERCIAL IN IT SERVICES MARKET, BY TYPE, 2020-2029 (USD MILLION)
TABLE 165 BAHRAIN PROFESSIONAL SERVICES IN IT SERVICES MARKET, BY TYPE, 2020-2029 (USD MILLION)
TABLE 166 BAHRAIN INDUSTRIAL IN IT SERVICES MARKET, BY APPLICATION, 2020-2029 (USD MILLION)
TABLE 167 BAHRAIN INDUSTRIAL IN IT SERVICES MARKET, BY SYSTEM, 2020-2029 (USD MILLION)
TABLE 168 BAHRAIN INDUSTRIAL IN IT SERVICES MARKET, BY TYPE, 2020-2029 (USD MILLION)
TABLE 169 BAHRAIN PROFESSIONAL SERVICES IN IT SERVICES MARKET, BY TYPE, 2020-2029 (USD MILLION)
TABLE 170 BAHRAIN RESIDENTIAL IN IT SERVICES MARKET, BY APPLICATION, 2020-2029 (USD MILLION)
TABLE 171 BAHRAIN RESIDENTIAL IN IT SERVICES MARKET, BY SYSTEM, 2020-2029 (USD MILLION)
TABLE 172 BAHRAIN RESIDENTIAL IN IT SERVICES MARKET, BY TYPE, 2020-2029 (USD MILLION)
TABLE 173 BAHRAIN PROFESSIONAL SERVICES IN IT SERVICES MARKET, BY TYPE, 2020-2029 (USD MILLION)
TABLE 174 BAHRAIN GOVERNMENT IN IT SERVICES MARKET, BY SYSTEM, 2020-2029 (USD MILLION)
TABLE 175 BAHRAIN GOVERNMENT IN IT SERVICES MARKET, BY TYPE, 2020-2029 (USD MILLION)
TABLE 176 BAHRAIN PROFESSIONAL SERVICES IN IT SERVICES MARKET, BY TYPE, 2020-2029 (USD MILLION)
List of Figure
FIGURE 1 GCC IT SERVICES MARKET: SEGMENTATION
FIGURE 2 GCC IT SERVICES MARKET : DATA TRIANGULATION
FIGURE 3 GCC IT SERVICES MARKET: DROC ANALYSIS
FIGURE 4 GCC IT SERVICES MARKET: COUNTRY MARKET ANALYSIS
FIGURE 5 GCC IT SERVICES MARKET: COMPANY RESEARCH ANALYSIS
FIGURE 6 GCC IT SERVICES MARKET: INTERVIEW DEMOGRAPHICS
FIGURE 7 GCC IT SERVICES MARKET: DBMR MARKET POSITION GRID
FIGURE 8 GCC IT SERVICES MARKET: VENDOR SHARE ANALYSIS
FIGURE 9 GCC IT SERVICES MARKET: MARKET END-USER COVERAGE GRID
FIGURE 10 GCC IT SERVICES MARKET: SEGMENTATION
FIGURE 11 GROWING NEED OF SMART AND SECURITY SYSTEM IS EXPECTED TO BE A KEY DRIVER FOR THE GCC IT SERVICES MARKET GROWTH IN THE FORECAST PERIOD OF 2022 TO 2029
FIGURE 12 SMART SYSTEM SEGMENT IS EXPECTED TO ACCOUNT FOR THE LARGEST SHARE OF THE GCC, IT SERVICES MARKET IN 2022 & 2029
FIGURE 13 DRIVER, RESTRAINTS, OPPORTUNITIES, AND CHALLENGES OF GCC IT SERVICES MARKET
FIGURE 14 GCC IT SERVICES MARKET: BY SYSTEM, 2021
FIGURE 15 GCC IT SERVICES MARKET: BY TYPE, 2021
FIGURE 16 GCC IT SERVICES MARKET: BY ORGANIZATION SIZE, 2021
FIGURE 17 GCC IT SERVICES MARKET: BY END USER, 2021
FIGURE 18 GCC IT SERVICES MARKET: SNAPSHOT (2021)
FIGURE 19 GCC IT SERVICES MARKET: BY COUNTRY (2021)
FIGURE 20 GCC IT SERVICES MARKET: BY COUNTRY (2022 & 2029)
FIGURE 21 GCC IT SERVICES MARKET : BY COUNTRY (2021 & 2029)
FIGURE 22 GCC IT SERVICES MARKET : BY SYSTEM (2022-2029)
FIGURE 23 GCC IT SERVICES MARKET: COMPANY SHARE 2021 (%)
Data collection and base year analysis are done using data collection modules with large sample sizes. The stage includes obtaining market information or related data through various sources and strategies. It includes examining and planning all the data acquired from the past in advance. It likewise envelops the examination of information inconsistencies seen across different information sources. The market data is analysed and estimated using market statistical and coherent models. Also, market share analysis and key trend analysis are the major success factors in the market report. To know more, please request an analyst call or drop down your inquiry.
The key research methodology used by DBMR research team is data triangulation which involves data mining, analysis of the impact of data variables on the market and primary (industry expert) validation. Data models include Vendor Positioning Grid, Market Time Line Analysis, Market Overview and Guide, Company Positioning Grid, Patent Analysis, Pricing Analysis, Company Market Share Analysis, Standards of Measurement, Global versus Regional and Vendor Share Analysis. To know more about the research methodology, drop in an inquiry to speak to our industry experts.
Data Bridge Market Research is a leader in advanced formative research. We take pride in servicing our existing and new customers with data and analysis that match and suits their goal. The report can be customized to include price trend analysis of target brands understanding the market for additional countries (ask for the list of countries), clinical trial results data, literature review, refurbished market and product base analysis. Market analysis of target competitors can be analyzed from technology-based analysis to market portfolio strategies. We can add as many competitors that you require data about in the format and data style you are looking for. Our team of analysts can also provide you data in crude raw excel files pivot tables (Fact book) or can assist you in creating presentations from the data sets available in the report.


