
Global Agricultural Micronutrients Market
Market Size in USD Billion
 USD
6.39 Billion
USD
13.03 Billion
2024
2032
USD
6.39 Billion
USD
13.03 Billion
2024
2032
| 2025 - 2032 | |
| USD 6.39 Billion | |
| USD 13.03 Billion | |
| % | |
|
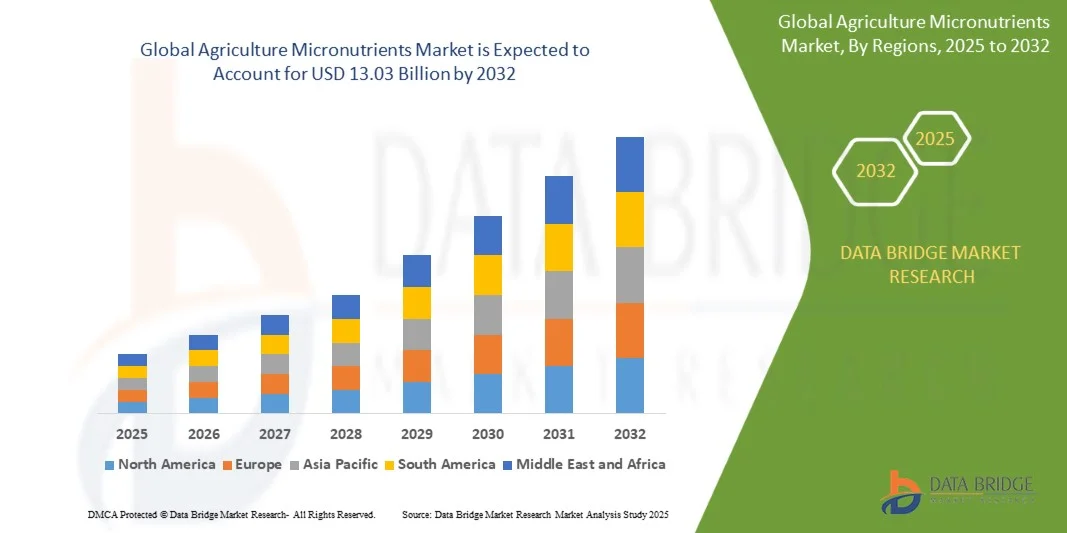
Agriculture Micronutrients Market Size
- The global agriculture micronutrients market was valued at USD 6.39 billion in 2024 and is expected to reach USD 13.03 billion by 2032
- During the forecast period of 2025 to 2032 the market is likely to grow at a CAGR of 9.30%, primarily driven by escalating global demand for increased and higher-quality food production
- This growth is driven by growing population and shifting dietary habits
Agriculture Micronutrients Market Analysis
- Agriculture micronutrients have gained widespread popularity due to the rising need for high crop yields, growing soil nutrient deficiencies, and an increasing focus on sustainable farming. These essential elements play a crucial role in improving plant growth, enhancing soil fertility, and boosting crop productivity
- The market is primarily driven by the expansion of precision agriculture, growing awareness among farmers, and advancements in micronutrient formulations. In addition, government initiatives promoting the adoption of fortified fertilizers are further accelerating market growth
- Asia-Pacific dominates the agriculture micronutrients market due to its large agricultural sector, high population-dependent farming, and increasing adoption of advanced fertilizers to combat soil nutrient deficiencies
- For instance, in India and China, farmers are increasingly using micronutrient-enriched fertilizers to enhance crop productivity and counteract soil depletion, contributing to sustained market expansion
- Globally, agriculture micronutrients remain essential in modern farming, with key innovations such as slow-release formulations, nano-based fertilizers, and customized nutrient blends driving industry transformation and supporting the shift toward sustainable agriculture
Report Scope and Agriculture Micronutrients Market Segmentation
|
Attributes |
Agriculture Micronutrients Key Market Insights |
|
Segments Covered |
|
|
Countries Covered |
North America
Europe
Asia-Pacific
Middle East and Africa
South America
|
|
Key Market Players |
|
|
Market Opportunities |
|
|
Value Added Data Infosets |
In addition to the insights on market scenarios such as market value, growth rate, segmentation, geographical coverage, and major players, the market reports curated by the Data Bridge Market Research also include in-depth expert analysis, pricing analysis, brand share analysis, consumer survey, demography analysis, supply chain analysis, value chain analysis, raw material/consumables overview, vendor selection criteria, PESTLE Analysis, Porter Analysis, and regulatory framework |
Agriculture Micronutrients Market Trends
“Rising Adoption of Chelated Micronutrients in Precision Farming”
- The increasing integration of precision farming techniques is driving demand for chelated micronutrients, which offer higher nutrient absorption and efficient crop uptake
- Farmers are shifting towards chelated formulations due to their enhanced solubility, ability to prevent nutrient leaching, and improved plant bioavailability
- The growing need for high-yield crop production and sustainable agriculture practices is further accelerating the adoption of chelated micronutrients worldwide
For instance
- In September 2023, the European Commission introduced incentives for farmers adopting chelated micronutrients, promoting sustainable farming and higher crop efficiency
- In June 2023, Yara International launched a new line of chelated micronutrient fertilizers, designed to optimize nutrient uptake in diverse soil conditions
- In April 2022, the China Agricultural Ministry reported a 15% increase in the use of chelated micronutrients, particularly in high-value crops such as fruits and vegetables
- As precision agriculture continues to expand, the demand for chelated micronutrients will rise, ensuring better crop productivity, efficient nutrient utilization, and sustainable soil management
Agriculture Micronutrients Market Dynamics
Driver
“Growing Soil Nutrient Deficiency Driving Demand for Agriculture Micronutrients”
- The increasing depletion of essential soil nutrients due to intensive farming practices is a major driver of the agriculture micronutrients market
- Farmers are adopting micronutrient-enriched fertilizers to replenish deficient soils, improve crop yields, and maintain soil health for sustainable agriculture
- Governments and agricultural organizations are promoting the use of micronutrients to combat soil degradation and enhance food security
For instance
- In July 2023, the Food and Agriculture Organization (FAO) reported that over 30% of global agricultural soils suffer from micronutrient deficiencies, urging increased use of fortified fertilizers
- In March 2023, the Indian Ministry of Agriculture launched a subsidy program to promote the use of micronutrient-based fertilizers, addressing soil deficiencies in key agricultural regions
- In October 2022, the U.S. Department of Agriculture (USDA) introduced grants for farmers adopting micronutrient-enriched soil management practices to improve productivity
- As soil depletion continues to impact global agricultural output, the demand for agriculture micronutrients is expected to grow significantly, ensuring higher crop yields and long-term soil sustainability
Opportunity
“Expanding Use of Micronutrients in Organic and Sustainable Farming”
- The growing shift toward organic farming is creating significant demand for micronutrient-based fertilizers, as farmers seek natural soil enrichment solutions
- Governments worldwide are promoting sustainable agriculture through subsidies and incentives, encouraging the use of micronutrient-enriched bio fertilizers
- The rising consumer preference for chemical-free, organic produce is further driving the adoption of micronutrient-based fertilizers in certified organic farming
For instance,
- In October 2023, the U.S. Department of Agriculture (USDA) announced a USD 500 million investment to support organic farming practices, including micronutrient-based soil enrichment programs
- In August 2023, India's Ministry of Agriculture launched an initiative to expand organic farming zones, promoting the use of bio-based micronutrients to enhance soil fertility and crop yield
- In March 2022, European Union policymakers introduced regulations supporting the adoption of micronutrient-fortified bio fertilizers, aiming to reduce chemical fertilizer dependency by 2030
- With the global push for sustainable agriculture, micronutrient-based fertilizers will witness increasing adoption, ensuring enhanced soil health, higher crop productivity, and long-term agricultural sustainability
Restraint/Challenge
“Fluctuating Raw Material Prices and Supply Chain Disruptions”
- The agriculture micronutrients market is facing challenges due to fluctuating raw material prices, affecting the cost-effectiveness of micronutrient fertilizers
- Supply chain disruptions, caused by geopolitical tensions and trade restrictions, have led to inconsistent availability of key micronutrients such as zinc, boron, and iron
- Farmers in developing regions struggle with high costs and limited access to quality micronutrient fertilizers, impacting crop yield and soil health
For instance,
- In January 2024, the World Bank reported a 15% surge in zinc and boron prices, driven by global mining restrictions and increased demand from the agriculture and industrial sectors
- In November 2023, China, a major producer of agricultural micronutrients, restricted exports of key fertilizers, causing global supply shortages and price hikes
- In May 2022, the Russia-Ukraine conflict disrupted fertilizer trade routes, leading to higher transportation costs and reduced availability of micronutrient fertilizers in Europe and Asia
- Unless alternative sourcing strategies and local production initiatives are strengthened, the agriculture micronutrients Market may continue to face price volatility, supply chain uncertainties, and accessibility challenges
Agriculture Micronutrients Market Scope
The market is segmented on the basis of type, crop type, form, and mode of application.
|
Segmentation |
Sub-Segmentation |
|
By Type |
|
|
By Crop Type |
|
|
By Form |
|
|
By Mode of Application |
|
Agriculture Micronutrients Market Regional Analysis
“Asia-Pacific is the Dominant Region in the Agriculture Micronutrients Market”
- Asia-Pacific holds the largest market share in the global agriculture micronutrients market, driven by expanding agricultural activities, increasing soil deficiencies, and the rising adoption of high-yield farming techniques
- China, India, and Japan lead the region due to their growing demand for food production, government initiatives for soil health improvement, and expanding use of micronutrient-enriched fertilizers
- The availability of advanced soil testing technologies and a growing focus on sustainable farming practices have further fueled market expansion
- In addition, the rising need for high-quality crops, increasing awareness among farmers, and expanding agrochemical distribution networks contribute to the growth of agriculture micronutrients across Asia-Pacific
“North America is projected to register the Highest Growth Rate”
- North America is expected to witness the highest growth rate in the agriculture micronutrients market, driven by rising adoption of precision farming, growing awareness of soil nutrient deficiencies, and increasing demand for high-yield crops
- The U.S. and Canada are emerging as key markets due to technological advancements in fertilizer application, strong government support for sustainable agriculture, and the expanding presence of agrochemical companies
- The U.S. leads the region in micronutrient adoption, with a growing emphasis on soil testing and customized nutrient management solutions to enhance crop productivity
- Canada is experiencing strong market growth due to expanding organic farming practices, rising demand for fortified fertilizers, and supportive agricultural policies promoting sustainable farming
- The rising use of chelated micronutrients, investments in research for advanced formulations, and expanding distribution networks further contribute to the strong market expansion across North America
The market competitive landscape provides details by competitor. Details included are company overview, company financials, revenue generated, market potential, investment in research and development, new market initiatives, global presence, production sites and facilities, production capacities, company strengths and weaknesses, product launch, product width and breadth, application dominance. The above data points provided are only related to the companies' focus related to market.
The Major Market Leaders Operating in the Market Are:
- CHR. Hansen A/S (Denmark)
- Lallemand Inc. (Canada)
- Novus International Inc. (U.S.)
- DSM (Netherlands)
- BASF (Germany)
- Alltech (U.S.)
- ADM (U.S.)
- Charoen Pokphand Foods PCL (Thailand)
- Associated British Foods plc (U.K.)
- Cargill Incorporated (U.S.)
- UPSIDE Foods (U.S.)
- MosaMeat (Netherlands)
- Integriculture Inc. (Japan)
- Aleph Farms (Israel)
- Finless Foods Inc. (U.S.)
- AVANTMEATS (China)
- Balletic Inc. (U.S.)
Latest Developments in Global Agriculture Micronutrients Market
- In October 2021, Grupa Azoty introduced its 2021-2030 strategy, with Green Azoty as the flagship initiative. This project aimed at decarbonization and lowering carbon emissions by implementing R&D projects aligned with the European Green Deal. The company's research and development efforts would focus on climate neutrality goals and new formulations enriched with micronutrients derived from waste streams
- In April 2021, Compass Minerals announced a definitive agreement with Koch Agronomic Service (LLP) Koch, a subsidiary of Koch Industries, to sell its North American micronutrient assets for approximately USD 60.25 million
- In March 2021, The Mosaic Company and Sound Agriculture revealed their strategic collaboration to introduce innovative nutrient-efficient fertilizer products. These products were designed to enhance crop yields and improve soil health using a unique combination of bio-inspired chemistry and essential micronutrients
- In March 2021, Coromandel International Limited launched GroShakti Plus, a new fertilizer formulated for cereals, pulses, oilseeds, and various fruits and vegetables. The fertilizer was developed to enhance root development through phosphorus and improve plant resistance with zinc
- In January 2021, Commoditag expanded its plant nutrition segment by introducing products from its new supplier, DeltaAg. The newly added products featured a variety of stage-specific formulas and micronutrient solutions
SKU-

- Interactive Data Analysis Dashboard
- Company Analysis Dashboard for high growth potential opportunities
- Research Analyst Access for customization & queries
- Competitor Analysis with Interactive dashboard
- Latest News, Updates & Trend analysis
- Harness the Power of Benchmark Analysis for Comprehensive Competitor Tracking
Table of Content
1 INTRODUCTION
1.1 OBJECTIVES OF THE STUDY
1.2 MARKET DEFINITION
1.3 OVERVIEW OF GLOBAL AGRICULTURE MICRONUTRIENTS MARKET
1.4 CURRENCY AND PRICING
1.5 LIMITATION
1.6 MARKETS COVERED
2 MARKET SEGMENTATION
2.1 KEY TAKEAWAYS
2.2 ARRIVING AT THE GLOBAL AGRICULTURE MICRONUTRIENTS MARKETSIZE
2.2.1 VENDOR POSITIONING GRID
2.2.2 TECHNOLOGY LIFE LINE CURVE
2.2.3 MARKET GUIDE
2.2.4 COMPANY POSITIONING GRID
2.2.5 COMAPANY MARKET SHARE ANALYSIS
2.2.6 MULTIVARIATE MODELLING
2.2.7 DEMAND AND SUPPLY-SIDE VARIABLES
2.2.8 TOP TO BOTTOM ANALYSIS
2.2.9 STANDARDS OF MEASUREMENT
2.2.10 VENDOR SHARE ANALYSIS
2.2.11 DATA POINTS FROM KEY PRIMARY INTERVIEWS
2.2.12 DATA POINTS FROM KEY SECONDARY DATABASES
2.3 GLOBAL AGRICULTURE MICRONUTRIENTS MARKET: RESEARCH SNAPSHOT
2.4 ASSUMPTIONS
3 MARKET OVERVIEW
3.1 DRIVERS
3.2 RESTRAINTS
3.3 OPPORTUNITIES
3.4 CHALLENGES
4 EXECUTIVE SUMMARY
5 PREMIUM INSIGHTS
5.1 VALUE CHAIN ANALYSIS
5.2 SUPPLY CHAIN ANALYSIS
5.3 IMPORT-EXPORT ANALYSIS
5.4 PORTER’S FIVE FORCES ANALYSIS
5.4.1 BARGAINING POWER OF SUPPLIERS
5.4.2 BARGAINING POWER OF BUYERS/CONSUMERS
5.4.3 THREAT OF NEW ENTRANTS
5.4.4 THREAT OF SUBSTITUTE PRODUCTS
5.4.5 INTENSITY OF COMPETITIVE RIVALRY
5.5 RAW MATERIAL SOURCING ANALYSIS
5.6 OVERVIEW OF TECHNOLOGICAL INNOVATIONS
5.7 INDUSTRY TRENDS AND FUTURE PERSPECTIVE
5.8 GROWTH STRATEGIES ADOPTED BY KEY MARKET PLAYERS
5.9 FACTORS INFLUENCING PURCHASING DECISION OF END-USERS
5.1 SHOPPING BEHAVIOUR AND DYNAMICS
5.10.1 RECOMMENDATION FROM FAMILY & FRIENDS
5.10.2 RESEARCH
5.10.3 IMPULSIVE
5.10.4 ADVERTISEMENT
5.11 PROMOTIONAL ACTIVITIES
5.12 CONSUMER DISPOSABLE INCOME DYNAMICS/SPEND DYNAMICS
5.13 NEW PRODUCT LAUNCH STRATEGY
5.13.1 NUMBER OF NEW PRODUCT LAUNCH
5.13.1.1. LLINE EXTENSTION
5.13.1.2. NNEW PACKAGING
5.13.1.3. RRE-LAUNCHED
5.13.1.4. NNEW FORMULATION
5.14 CONSUMER LEVEL TRENDS
5.15 MEETING CONSUMER REQUIREMENT
6 IMPACT OF ECONOMIC SLOW DOWN ON MARKET
6.1 IMPACT ON PRICE
6.2 IMPACT ON SUPPLY CHAIN
6.3 IMPACT ON SHIPMENT
6.4 IMPACT ON COMPANY’S STRATEGIC DECISIONS
7 REGULATORY FRAMEWORK AND GUIDELINES
8 PRICING INDEX (PRICE AT B2B END & PRICES AT FOB)
9 PRODUCTION CAPACITY OF KEY MANUFACTURERES
10 BRAND OUTLOOK
10.1 COMPARATIVE BRAND ANALYSIS
10.2 PRODUCT VS BRAND OVERVIEW
11 GLOBAL AGRICULTURE MICRONUTRIENTS MARKET, BY MICRONUTRIENT TYPE
11.1 OVERVIEW
11.2 ZINC
11.3 COPPER
11.4 MANGANESE
11.5 CHLORINE
11.6 MOLYBDENUM
11.7 BORON
11.8 IRON
11.9 OTHERS
12 GLOBAL AGRICULTURE MICRONUTRIENTS MARKET, BY MODE OF APPLICATION
12.1 OVERVIEW
12.2 SOIL
12.3 FOLIAR
12.4 FERTIGATION
12.5 OTHERS (IF ANY)
13 GLOBAL AGRICULTURE MICRONUTRIENTS MARKET, BY CATEGORY
13.1 OVERVIEW
13.2 CHELATED
13.3 NON-CHELATED
14 GLOBAL AGRICULTURE MICRONUTRIENTS MARKET, BY CROP TYPE
14.1 OVERVIEW
14.2 OIL SEEDS
14.2.1 OIL SEEDS, BY TYPE
14.2.1.1. SOYBEAN
14.2.1.2. SUNFLOWER
14.2.1.3. CORN
14.2.1.4. PEANUT
14.2.1.5. COTTONSEED
14.2.1.6. FLAXSEED
14.2.1.7. OTHERS
14.2.2 OIL SEEDS, BY MICRONUTRIENT TYPE
14.2.2.1. ZINC
14.2.2.2. COPPER
14.2.2.3. MANGANESE
14.2.2.4. CHLORINE
14.2.2.5. MOLYBDENUM
14.2.2.6. BORON
14.2.2.7. IRON
14.2.2.8. OTHERS
14.3 PULSES
14.3.1 PULSES, BY TYPE
14.3.1.1. BLACK BEANS
14.3.1.2. PEAS
14.3.1.3. CHICKPEAS
14.3.1.4. OTHERS
14.3.2 PULSES, BY MICRONUTRIENT TYPE
14.3.2.1. ZINC
14.3.2.2. COPPER
14.3.2.3. MANGANESE
14.3.2.4. CHLORINE
14.3.2.5. MOLYBDENUM
14.3.2.6. BORON
14.3.2.7. IRON
14.3.2.8. OTHERS
14.4 CEREALS & GRAINS
14.4.1 CERELAS & GRAINS, BY TYPE
14.4.1.1. RICE
14.4.1.2. WHEAT
14.4.1.3. BARLEY
14.4.1.4. MILLET
14.4.1.5. OAT
14.4.1.6. SORGHUM
14.4.1.7. RYE
14.4.1.8. OTHERS
14.4.2 OCEREALS & GRAINS, BY MICRONUTRIENT TYPE
14.4.2.1. ZINC
14.4.2.2. COPPER
14.4.2.3. MANGANESE
14.4.2.4. CHLORINE
14.4.2.5. MOLYBDENUM
14.4.2.6. BORON
14.4.2.7. IRON
14.4.2.8. OTHERS
14.5 FRUITS
14.5.1 FRUITS, BY TYPE
14.5.1.1. APPLE & PEARS
14.5.1.2. CITRUS FRUITS
14.5.1.3. TROPICAL FRUITS
14.5.1.4. BERRIES
14.5.1.5. MELONS
14.5.1.6. OTHERS
14.5.2 FRUITS, BY MICRONUTRIENT TYPE
14.5.2.1. ZINC
14.5.2.2. COPPER
14.5.2.3. MANGANESE
14.5.2.4. CHLORINE
14.5.2.5. MOLYBDENUM
14.5.2.6. BORON
14.5.2.7. IRON
14.5.2.8. OTHERS
14.6 VEGETABLES
14.6.1 VEGETABLES, BY TYPE
14.6.1.1. LEAFY GREENS
14.6.1.2. CRUCIFEROUS VEGETABLES
14.6.1.3. MARROW VEGATBALES
14.6.1.4. ROOT VEGETABLES
14.6.1.5. ONION
14.6.1.6. GRALIC
14.6.1.7. OTHERS
14.6.2 VEGETABLES, BY MICRONUTRIENT TYPE
14.6.2.1. ZINC
14.6.2.2. COPPER
14.6.2.3. MANGANESE
14.6.2.4. CHLORINE
14.6.2.5. MOLYBDENUM
14.6.2.6. BORON
14.6.2.7. IRON
14.6.2.8. OTHERS
14.7 HORTICULTURE
14.7.1 HORTICULTURE, BY MICRONUTRIENT TYPE
14.7.1.1. ZINC
14.7.1.2. COPPER
14.7.1.3. MANGANESE
14.7.1.4. CHLORINE
14.7.1.5. MOLYBDENUM
14.7.1.6. BORON
14.7.1.7. IRON
14.7.1.8. OTHERS
14.8 TURN & ORNAMENTS
14.8.1 TURF & ORNAMENTS, BY MICRONUTRIENT TYPE
14.8.1.1. ZINC
14.8.1.2. COPPER
14.8.1.3. MANGANESE
14.8.1.4. CHLORINE
14.8.1.5. MOLYBDENUM
14.8.1.6. BORON
14.8.1.7. IRON
14.8.1.8. OTHERS
15 GLOBAL AGRICULTURE MICRONUTRIENTS MARKET, COMPANY LANDSCAPE
15.1 COMPANY SHARE ANALYSIS: GLOBAL
15.2 COMPANY SHARE ANALYSIS: NORTH AMERICA
15.3 COMPANY SHARE ANALYSIS: EUROPE
15.4 COMPANY SHARE ANALYSIS: ASIA-PACIFIC
15.5 MERGERS & ACQUISITIONS
15.6 NEW PRODUCT DEVELOPMENT & APPROVALS
15.7 EXPANSIONS & PARTNERSHIP
15.8 REGULATORY CHANGES
16 GLOBAL AGRICULTURE MICRONUTRIENTS MARKET, BY GEOGRAPHY
16.1 OVERVIEW (ALL SEGMENTATION PROVIDED ABOVE IS REPRESNTED IN THIS CHAPTER BY COUNTRY)
16.2 NORTH AMERICA
16.2.1 U.S.
16.2.2 CANADA
16.2.3 MEXICO
16.3 EUROPE
16.3.1 GERMANY
16.3.2 U.K.
16.3.3 ITALY
16.3.4 FRANCE
16.3.5 SPAIN
16.3.6 SWITZERLAND
16.3.7 NETHERLANDS
16.3.8 BELGIUM
16.3.9 RUSSIA
16.3.10 TURKEY
16.3.11 REST OF EUROPE
16.4 ASIA-PACIFIC
16.4.1 JAPAN
16.4.2 CHINA
16.4.3 SOUTH KOREA
16.4.4 INDIA
16.4.5 AUSTRALIA
16.4.6 SINGAPORE
16.4.7 THAILAND
16.4.8 INDONESIA
16.4.9 MALAYSIA
16.4.10 PHILIPPINES
16.4.11 REST OF ASIA-PACIFIC
16.5 SOUTH AMERICA
16.5.1 BRAZIL
16.5.2 ARGENTINA
16.5.3 REST OF SOUTH AMERICA
16.6 MIDDLE EAST AND AFRICA
16.6.1 SOUTH AFRICA
16.6.2 UAE
16.6.3 SAUDI ARABIA
16.6.4 KUWAIT
16.6.5 REST OF MIDDLE EAST AND AFRICA
17 GLOBAL AGRICULTURE MICRONUTRIENTS MARKET, SWOT & DBMR ANALYSIS
18 GLOBAL AGRICULTURE MICRONUTRIENTS MARKET, COMPANY PROFILE
18.1 BASF SE
18.1.1 COMPANY OVERVIEW
18.1.2 REVENUE ANALYSIS
18.1.3 GEOGRAPHICAL PRESENCE
18.1.4 PRODUCT PORTFOLIO
18.1.5 RECENT DEVELOPMENTS
19 AKZONOBEL (NOURYON)
19.1.1 COMPANY OVERVIEW
19.1.2 REVENUE ANALYSIS
19.1.3 GEOGRAPHICAL PRESENCE
19.1.4 PRODUCT PORTFOLIO
19.1.5 RECENT DEVELOPMENTS
19.2 NUTRIEN LTD.
19.2.1 COMPANY OVERVIEW
19.2.2 REVENUE ANALYSIS
19.2.3 GEOGRAPHICAL PRESENCE
19.2.4 PRODUCT PORTFOLIO
19.2.5 RECENT DEVELOPMENTS
19.3 NUFARM
19.3.1 COMPANY OVERVIEW
19.3.2 REVENUE ANALYSIS
19.3.3 GEOGRAPHICAL PRESENCE
19.3.4 PRODUCT PORTFOLIO
19.3.5 RECENT DEVELOPMENTS
19.4 YARA INTERNATIONAL ASA
19.4.1 COMPANY OVERVIEW
19.4.2 REVENUE ANALYSIS
19.4.3 GEOGRAPHICAL PRESENCE
19.4.4 PRODUCT PORTFOLIO
19.4.5 RECENT DEVELOPMENTS
19.5 COROMANDEL INTERNATIONAL LTD
19.5.1 COMPANY OVERVIEW
19.5.2 REVENUE ANALYSIS
19.5.3 GEOGRAPHICAL PRESENCE
19.5.4 PRODUCT PORTFOLIO
19.5.5 RECENT DEVELOPMENTS
19.6 LAND O LAKES
19.6.1 COMPANY OVERVIEW
19.6.2 REVENUE ANALYSIS
19.6.3 GEOGRAPHICAL PRESENCE
19.6.4 PRODUCT PORTFOLIO
19.6.5 RECENT DEVELOPMENTS
19.7 HELENA CHEMICAL COMPANY
19.7.1 COMPANY OVERVIEW
19.7.2 REVENUE ANALYSIS
19.7.3 GEOGRAPHICAL PRESENCE
19.7.4 PRODUCT PORTFOLIO
19.7.5 RECENT DEVELOPMENTS
19.8 THE MOSAIC COMPANY
19.8.1 COMPANY OVERVIEW
19.8.2 REVENUE ANALYSIS
19.8.3 GEOGRAPHICAL PRESENCE
19.8.4 PRODUCT PORTFOLIO
19.8.5 RECENT DEVELOPMENTS
19.9 HAIFA GROUP
19.9.1 COMPANY OVERVIEW
19.9.2 REVENUE ANALYSIS
19.9.3 GEOGRAPHICAL PRESENCE
19.9.4 PRODUCT PORTFOLIO
19.9.5 RECENT DEVELOPMENTS
19.1 SAPEC S.A.
19.10.1 COMPANY OVERVIEW
19.10.2 REVENUE ANALYSIS
19.10.3 GEOGRAPHICAL PRESENCE
19.10.4 PRODUCT PORTFOLIO
19.10.5 RECENT DEVELOPMENTS
19.11 COMPASS MINERALS INTERNATIONAL
19.11.1 COMPANY OVERVIEW
19.11.2 REVENUE ANALYSIS
19.11.3 GEOGRAPHICAL PRESENCE
19.11.4 PRODUCT PORTFOLIO
19.11.5 RECENT DEVELOPMENTS
19.12 VALAGRO
19.12.1 COMPANY OVERVIEW
19.12.2 REVENUE ANALYSIS
19.12.3 GEOGRAPHICAL PRESENCE
19.12.4 PRODUCT PORTFOLIO
19.12.5 RECENT DEVELOPMENTS
19.13 ZUARI AGROCHEMICALS LTD
19.13.1 COMPANY OVERVIEW
19.13.2 REVENUE ANALYSIS
19.13.3 GEOGRAPHICAL PRESENCE
19.13.4 PRODUCT PORTFOLIO
19.13.5 RECENT DEVELOPMENTS
19.14 STOLLER ENTERPRISES INC
19.14.1 COMPANY OVERVIEW
19.14.2 REVENUE ANALYSIS
19.14.3 GEOGRAPHICAL PRESENCE
19.14.4 PRODUCT PORTFOLIO
19.14.5 RECENT DEVELOPMENTS
19.15 BALCHEM
19.15.1 COMPANY OVERVIEW
19.15.2 REVENUE ANALYSIS
19.15.3 GEOGRAPHICAL PRESENCE
19.15.4 PRODUCT PORTFOLIO
19.15.5 RECENT DEVELOPMENTS
19.16 ATP NUTRITION
19.16.1 COMPANY OVERVIEW
19.16.2 REVENUE ANALYSIS
19.16.3 GEOGRAPHICAL PRESENCE
19.16.4 PRODUCT PORTFOLIO
19.16.5 RECENT DEVELOPMENTS
19.17 BAICOR LC
19.17.1 COMPANY OVERVIEW
19.17.2 REVENUE ANALYSIS
19.17.3 GEOGRAPHICAL PRESENCE
19.17.4 PRODUCT PORTFOLIO
19.17.5 RECENT DEVELOPMENTS
19.18 CORTEVA INC
19.18.1 COMPANY OVERVIEW
19.18.2 REVENUE ANALYSIS
19.18.3 GEOGRAPHICAL PRESENCE
19.18.4 PRODUCT PORTFOLIO
19.18.5 RECENT DEVELOPMENTS
19.19 BMS MICRO-NUTRIENTS NV
19.19.1 COMPANY OVERVIEW
19.19.2 REVENUE ANALYSIS
19.19.3 GEOGRAPHICAL PRESENCE
19.19.4 PRODUCT PORTFOLIO
19.19.5 RECENT DEVELOPMENTS
*NOTE: THE COMPANIES PROFILED IS NOT EXHAUSTIVE LIST AND IS AS PER OUR PREVIOUS CLIENT REQUIREMENT. WE PROFILE MORE THAN 100 COMPANIES IN OUR STUDY AND HENCE THE LIST OF COMPANIES CAN BE MODIFIED OR REPLACED ON REQUEST
20 RELATED REPORTS
21 CONCLUSION
22 QUESTIONNAIRE
23 ABOUT DATA BRIDGE MARKET RESEARCH
Global Agricultural Micronutrients Market, Supply Chain Analysis and Ecosystem Framework
To support market growth and help clients navigate the impact of geopolitical shifts, DBMR has integrated in-depth supply chain analysis into its Global Agricultural Micronutrients Market research reports. This addition empowers clients to respond effectively to global changes affecting their industries. The supply chain analysis section includes detailed insights such as Global Agricultural Micronutrients Market consumption and production by country, price trend analysis, the impact of tariffs and geopolitical developments, and import and export trends by country and HSN code. It also highlights major suppliers with data on production capacity and company profiles, as well as key importers and exporters. In addition to research, DBMR offers specialized supply chain consulting services backed by over a decade of experience, providing solutions like supplier discovery, supplier risk assessment, price trend analysis, impact evaluation of inflation and trade route changes, and comprehensive market trend analysis.
Data collection and base year analysis are done using data collection modules with large sample sizes. The stage includes obtaining market information or related data through various sources and strategies. It includes examining and planning all the data acquired from the past in advance. It likewise envelops the examination of information inconsistencies seen across different information sources. The market data is analysed and estimated using market statistical and coherent models. Also, market share analysis and key trend analysis are the major success factors in the market report. To know more, please request an analyst call or drop down your inquiry.
The key research methodology used by DBMR research team is data triangulation which involves data mining, analysis of the impact of data variables on the market and primary (industry expert) validation. Data models include Vendor Positioning Grid, Market Time Line Analysis, Market Overview and Guide, Company Positioning Grid, Patent Analysis, Pricing Analysis, Company Market Share Analysis, Standards of Measurement, Global versus Regional and Vendor Share Analysis. To know more about the research methodology, drop in an inquiry to speak to our industry experts.
Data Bridge Market Research is a leader in advanced formative research. We take pride in servicing our existing and new customers with data and analysis that match and suits their goal. The report can be customized to include price trend analysis of target brands understanding the market for additional countries (ask for the list of countries), clinical trial results data, literature review, refurbished market and product base analysis. Market analysis of target competitors can be analyzed from technology-based analysis to market portfolio strategies. We can add as many competitors that you require data about in the format and data style you are looking for. Our team of analysts can also provide you data in crude raw excel files pivot tables (Fact book) or can assist you in creating presentations from the data sets available in the report.


