
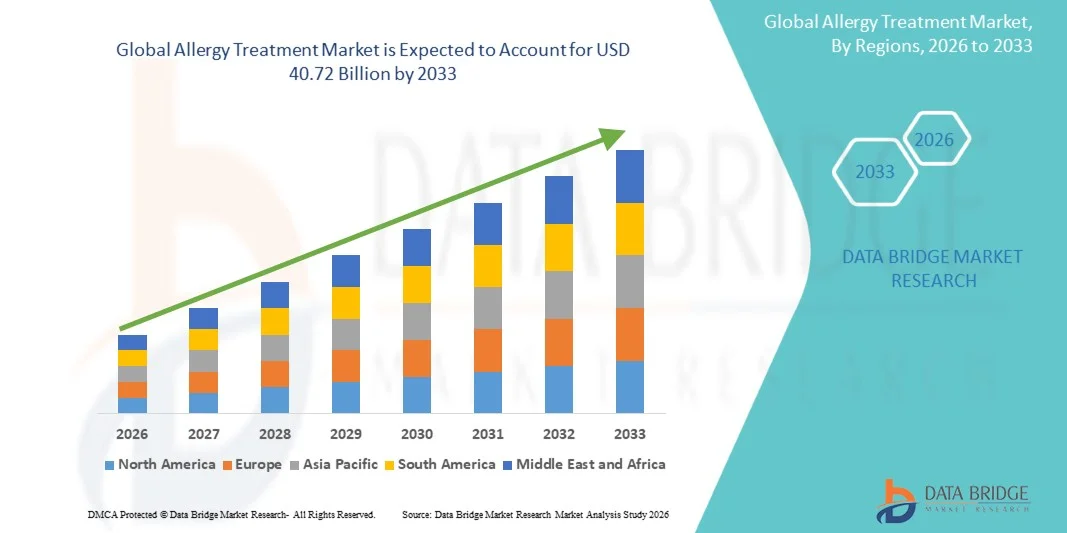
Global Allergy Treatment Market
Market Size in USD Billion
 USD
24.55 Billion
USD
40.72 Billion
2025
2033
USD
24.55 Billion
USD
40.72 Billion
2025
2033
| 2026 - 2033 | |
| USD 24.55 Billion | |
| USD 40.72 Billion | |
| % | |
|
Allergy Treatment Market Size
- The global allergy treatment market size was valued at USD 24.55 billion in 2025and is expected to reach USD 40.72 billion by 2033, at a CAGR of 6.53% during the forecast period
- The market growth is largely driven by the rising prevalence of allergic conditions such as allergic rhinitis, asthma, dermatitis, and food allergies, alongside increasing environmental pollution and changing lifestyle patterns that are intensifying allergen exposure across both developed and emerging economies
- Furthermore, growing awareness regarding early diagnosis and long-term allergy management, coupled with continuous advancements in immunotherapies, biologics, and targeted treatment options, is significantly improving patient outcomes and supporting the widespread adoption of advanced allergy treatment solutions, thereby driving industry expansion
Allergy Treatment Market Analysis
- Allergy treatment products, including antihistamines, corticosteroids, immunotherapy, and biologics, play a crucial role in managing a wide range of allergic conditions such as allergic rhinitis, asthma, dermatitis, and food-induced reactions, owing to their effectiveness in controlling symptoms and improving long-term patient quality of life across both acute and chronic cases
- The escalating demand for allergy treatment is primarily driven by the rising global prevalence of allergic disorders, increasing environmental pollution, rapid urbanization, changing dietary patterns, and growing awareness regarding early diagnosis and effective long-term disease management
- North America dominated the allergy treatment market with the largest revenue share of 42.7% in 2025, supported by high disease awareness, advanced healthcare infrastructure, strong reimbursement frameworks, and the presence of leading pharmaceutical and biotechnology companies focusing on advanced biologics and immunotherapy solutions
- Asia-Pacific is expected to be the fastest growing region in the allergy treatment market during the forecast period, owing to increasing healthcare access, rising pollution levels, expanding patient population, and growing adoption of modern allergy diagnostics and treatment options in emerging economies
- Anti-allergy drugs segment dominated the allergy treatment market with a significant market share of 60.4% in 2025, driven by strong utilization of antihistamines and corticosteroids as first-line therapies, wide availability across prescription and OTC channels, and their rapid efficacy in managing mild to moderate allergic symptoms
Report Scope and Allergy Treatment Market Segmentation
|
Attributes |
Allergy Treatment Key Market Insights |
|
Segments Covered |
|
|
Countries Covered |
North America · U.S. · Canada · Mexico Europe · Germany · France · U.K. · Netherlands · Switzerland · Belgium · Russia · Italy · Spain · Turkey · Rest of Europe Asia-Pacific · China · Japan · India · South Korea · Singapore · Malaysia · Australia · Thailand · Indonesia · Philippines · Rest of Asia-Pacific Middle East and Africa · Saudi Arabia · U.A.E. · South Africa · Egypt · Israel · Rest of Middle East and Africa South America · Brazil · Argentina · Rest of South America |
|
Key Market Players |
|
|
Market Opportunities |
· Expanding adoption of biologics and monoclonal antibody therapies · Increasing penetration of digital allergy diagnostics and telehealth-based allergy care platforms |
|
Value Added Data Infosets |
In addition to the insights on market scenarios such as market value, growth rate, segmentation, geographical coverage, and major players, the market reports curated by the Data Bridge Market Research also include in-depth expert analysis, patient epidemiology, pipeline analysis, pricing analysis, and regulatory framework |
Allergy Treatment Market Trends
“Rising Shift Toward Biologics and Precision Immunotherapy”
- A significant and accelerating trend in the global allergy treatment market is the growing shift toward biologics and targeted immunotherapy, transforming how moderate to severe allergic conditions are managed with more precise and long-lasting treatment outcomes
- For instance, biologic therapies such as omalizumab are increasingly being used for severe asthma and chronic urticaria, offering improved symptom control compared to conventional antihistamines and corticosteroids
- The expansion of precision medicine is enabling the development of patient-specific allergy vaccines and desensitization therapies that target underlying immune responses rather than only managing symptoms
- The integration of advanced diagnostic tools such as component-resolved diagnostics and molecular allergy testing is supporting more accurate identification of allergens and improving treatment personalization across patient groups
- The rising adoption of digital health platforms and tele-allergy consultations is improving access to specialist care and enabling continuous monitoring of chronic allergic conditions, especially in remote regions
- Voice-assisted technologies, integrated with platforms such as Amazon Alexa and Google Assistant, are further enhancing user convenience by allowing patients to set reminders, log symptoms, or access treatment information using hands-free voice commands. This is especially helpful for individuals managing chronic allergic conditions on a daily basis
- Growing pharmaceutical R&D investment in next-generation biologics and combination therapies is accelerating the development of more effective and longer-acting allergy treatment solutions across global markets
Allergy Treatment Market Dynamics
Driver
“Rising Prevalence of Allergic Diseases and Environmental Triggers”
- The increasing global burden of allergic disorders, coupled with worsening air pollution and changing environmental conditions, is a major driver accelerating demand for effective allergy treatment solutions across all age groups
- For instance, increasing urban air pollution levels and rising exposure to allergens such as pollen and dust mites are contributing to higher incidence of asthma, allergic rhinitis, and skin allergies worldwide
- Growing awareness among patients and healthcare providers regarding early diagnosis and long-term management of allergic conditions is leading to higher treatment uptake across hospitals and specialty clinics
- Expanding healthcare access and improved diagnostic capabilities in emerging economies are enabling earlier identification and treatment of allergy-related diseases, supporting market growth
- Changing environmental conditions, increased pollution levels, and rising exposure to allergens due to urbanization are contributing to the surge in allergic disorders globally. This has led to a significant uptick in medical consultations and prescriptions for antihistamines, corticosteroids, decongestants, and allergen-specific immunotherapy
- In addition, public and private health organizations are conducting large-scale campaigns to educate people about allergy management and prevention strategies. These efforts are improving diagnosis rates and treatment adherence, further contributing to market expansion
- The rising preference for effective symptom management and preventive care approaches is further driving the adoption of both pharmacological and immunotherapy-based allergy treatments
- Increasing healthcare expenditure and stronger government initiatives for respiratory and allergy disease management are further supporting wider access to advanced treatment options in both developed and developing regions
Restraint/Challenge
“High Treatment Costs and Adverse Drug Reactions Concerns”
- Concerns related to high treatment costs, especially for biologics and long-term immunotherapy, along with potential side effects of allergy medications, present significant challenges to broader market penetration
- For instance, biologic therapies used for severe asthma and chronic allergies often require long-term administration, making them less accessible in price-sensitive and low-income regions
- The risk of adverse reactions such as drowsiness from antihistamines or systemic effects from corticosteroids may limit patient compliance and long-term adherence to treatment regimens
- Further complicating access is the shortage of trained allergy specialists in several regions, particularly in rural and underserved areas. This hampers early diagnosis and appropriate treatment, resulting in under-treatment or mismanagement of allergic conditions
- Another key restraint is patient hesitancy toward long-term immunotherapy due to the need for repeated administration, potential side effects, and the extended duration of treatment. This lack of immediate relief compared to symptomatic treatments such as antihistamines can deter patient adherence
- Limited reimbursement coverage for advanced allergy therapies in several developing countries further restricts patient access to innovative treatment options
- Lack of standardized allergy diagnosis and treatment protocols across regions leads to inconsistent treatment outcomes and delays in appropriate therapy initiation
- Addressing these challenges through improved affordability, wider insurance coverage, standardized care guidelines, and safer next-generation therapies will be critical for sustaining long-term market growth
Allergy Treatment Market Scope
The market is segmented on the basis of type, treatment, route of administration, end-users, and distribution channel.
- By Type
On the basis of type, the allergy treatment market is segmented into eye allergy, food allergy, skin allergy, asthma, rhinitis, and others. The rhinitis segment dominated the market with the largest revenue share of 38% in 2025, driven by its high global prevalence and strong association with environmental triggers such as pollen, dust, and pollution. Allergic rhinitis is one of the most commonly diagnosed allergic conditions across both adults and children, leading to high consumption of antihistamines and nasal corticosteroids. The segment also benefits from strong OTC availability of symptom-relief drugs and increasing awareness regarding early treatment to prevent progression into asthma. Seasonal variations and rising urbanization further contribute to recurring patient visits, sustaining long-term demand. In addition, well-established clinical guidelines and easy diagnosis support higher treatment uptake across hospitals and primary care settings.
The asthma segment is expected to witness the fastest growth rate of 14% from 2026 to 2033, fueled by the rising global burden of chronic respiratory diseases and increasing exposure to air pollution and occupational allergens. Asthma cases are growing rapidly in urban populations due to deteriorating air quality and lifestyle changes. The segment is also benefiting from strong innovation in biologics and inhaled therapies that provide better long-term disease control. Increasing use of combination inhalers and preventive maintenance therapies is improving patient adherence and outcomes. Furthermore, rising healthcare awareness and government-led respiratory disease programs are accelerating early diagnosis and treatment adoption, particularly in emerging economies.
- By Treatment
On the basis of treatment, the market is segmented into anti-allergy drugs and immunotherapy. The anti-allergy drugs segment dominated the market with the largest revenue share of 60.4% in 2025, driven by widespread use of antihistamines, corticosteroids, and decongestants as first-line therapy for multiple allergic conditions. These drugs are highly accessible through both prescription and over-the-counter channels, making them the most commonly used treatment option globally. Their fast symptom relief and affordability further support strong adoption across all patient groups. The segment also benefits from continuous product availability in retail pharmacies and increasing self-medication trends for mild allergic conditions. In addition, strong physician preference for immediate symptom control sustains high prescription volumes across hospitals and clinics.
The immunotherapy segment is expected to witness the fastest growth rate of 13% from 2026 to 2033, driven by increasing demand for long-term and disease-modifying treatment options. Immunotherapy, including allergy shots and sublingual tablets, is gaining traction due to its ability to reduce sensitivity to allergens over time. Growing adoption of personalized medicine approaches is further enhancing its clinical relevance. Rising awareness among patients about long-term cost savings compared to continuous drug use is also supporting demand. In addition, expanding availability of standardized allergen extracts and improved clinical guidelines are accelerating adoption in both developed and emerging healthcare systems.
- By Route of Administration
On the basis of route of administration, the market is segmented into oral, inhalation, intranasal, and others. The oral segment dominated the market with the largest revenue share of 52% in 2025, driven by the widespread use of oral antihistamines and corticosteroids for managing multiple allergic conditions. Oral medications are preferred due to their ease of administration, high patient compliance, and availability in both prescription and OTC formats. They are widely used for mild to moderate allergic symptoms such as rhinitis, urticaria, and food allergies. The segment also benefits from strong retail pharmacy distribution and increasing self-care trends among patients. In addition, continuous development of non-drowsy formulations is enhancing their long-term usability and adoption.
The inhalation segment is expected to witness the fastest growth rate of 14% from 2026 to 2033, driven by the rising prevalence of asthma and chronic respiratory allergies. Inhaled therapies offer direct drug delivery to the lungs, ensuring faster and more effective symptom control. The increasing adoption of combination inhalers and biologic inhalation therapies is improving disease management outcomes. Growing environmental pollution and rising respiratory sensitivity in urban populations are further boosting demand. Moreover, technological advancements in inhaler devices, including smart inhalers with digital monitoring, are enhancing treatment adherence and driving segment growth.
- By End-Users
On the basis of end-users, the market is segmented into hospitals, specialty clinics, homecare, and others. The hospitals segment dominated the market with the largest revenue share of 45.5% in 2025, driven by high patient inflow for severe allergic conditions such as asthma attacks, anaphylaxis, and chronic dermatitis cases requiring specialist care. Hospitals provide advanced diagnostic facilities, emergency care, and access to prescription biologics, making them the primary treatment setting for moderate to severe allergies. The presence of trained healthcare professionals ensures accurate diagnosis and treatment planning. In addition, strong reimbursement support in developed regions further increases hospital-based treatment adoption. Hospitals also act as key centers for initiating immunotherapy and biologic treatments under medical supervision.
The homecare segment is expected to witness the fastest growth rate of 15% from 2026 to 2033, driven by the increasing preference for self-administration of allergy medications and rising adoption of long-term management therapies at home. Patients are increasingly using portable inhalers, oral antihistamines, and sublingual immunotherapy under remote medical guidance. Growth in telemedicine and digital health platforms is further supporting home-based allergy management. The convenience of reduced hospital visits and lower treatment costs is also encouraging adoption. In addition, advancements in smart monitoring devices and wearable health technologies are enabling better disease tracking in homecare settings.
- By Distribution Channel
On the basis of distribution channel, the market is segmented into hospital pharmacy, retail pharmacy, online pharmacy, and others. The retail pharmacy segment dominated the market with the largest revenue share of 45.6% in 2025, driven by easy accessibility of OTC antihistamines and allergy relief medications. Retail pharmacies serve as the primary point of purchase for mild allergy treatments, especially for seasonal allergic conditions. Strong presence of established pharmacy chains and widespread distribution networks enhance product availability. The segment also benefits from high consumer trust and immediate product availability without prescription delays. In addition, increasing self-medication trends and seasonal allergy outbreaks further strengthen retail pharmacy demand.
The online pharmacy segment is expected to witness the fastest growth rate of 17% from 2026 to 2033, driven by increasing digital adoption, convenience of doorstep delivery, and rising penetration of e-commerce healthcare platforms. Online pharmacies offer easy access to a wide range of allergy medications, including prescription and OTC products. Growing smartphone usage and digital health awareness are further accelerating adoption. Competitive pricing, subscription-based refill services, and teleconsultation integration are enhancing customer retention. Moreover, the expansion of regulated online pharmacy platforms in emerging markets is significantly boosting segment growth.
Allergy Treatment Market Regional Analysis
- North America dominated the allergy treatment market with the largest revenue share of 42.7% in 2025, supported by high disease awareness, advanced healthcare infrastructure, strong reimbursement frameworks, and the presence of leading pharmaceutical and biotechnology companies focusing on advanced biologics and immunotherapy solutions
- Patients in the region benefit from widespread availability of advanced treatment options, including biologics, immunotherapy, and prescription-based anti-allergy drugs, supported by well-established reimbursement systems and clinical guidelines
- This strong adoption is further supported by high healthcare spending, robust pharmaceutical innovation, and the presence of leading biotech and drug manufacturers focusing on next-generation allergy therapies, making the region a key hub for advanced treatment adoption
U.S. Allergy Treatment Market Insight
The U.S. allergy treatment market captured the largest revenue share of 82% in 2025 within North America, driven by a high prevalence of allergic conditions, strong healthcare spending, and advanced diagnostic and treatment infrastructure. Patients in the country are increasingly prioritizing early diagnosis and long-term management of allergies through prescription drugs, biologics, and immunotherapy solutions. The growing adoption of advanced treatment options, combined with strong awareness of seasonal and chronic allergies, further supports market expansion. Moreover, the presence of leading pharmaceutical and biotechnology companies, along with strong insurance coverage and widespread access to specialist care, is significantly contributing to the market’s growth.
Europe Allergy Treatment Market Insight
The Europe allergy treatment market is projected to expand at a steady CAGR throughout the forecast period, primarily driven by rising pollution levels, increasing prevalence of respiratory allergies, and strong healthcare systems across major economies. The region benefits from well-established treatment protocols and growing use of immunotherapy for long-term allergy management. European patients are increasingly adopting both prescription and OTC allergy medications due to improved awareness and accessibility. In addition, supportive regulatory frameworks and growing investments in biologics and advanced therapies are fostering market expansion across hospital and outpatient settings.
U.K. Allergy Treatment Market Insight
The U.K. allergy treatment market is anticipated to grow at a notable CAGR during the forecast period, driven by rising cases of asthma, allergic rhinitis, and skin allergies, along with increasing awareness of early diagnosis. The demand for both OTC antihistamines and advanced prescription therapies is increasing due to the convenience of treatment access through pharmacies and digital healthcare platforms. Concerns regarding air pollution and seasonal allergies are also encouraging consistent treatment adoption. Furthermore, strong healthcare infrastructure and expanding telemedicine services are supporting improved patient management and driving market growth.
Germany Allergy Treatment Market Insight
The Germany allergy treatment market is expected to expand at a considerable CAGR during the forecast period, fueled by high environmental sensitivity, strong healthcare standards, and increasing adoption of advanced immunotherapy solutions. Germany’s focus on precision medicine and structured allergy diagnostics supports early detection and effective treatment planning. Patients are increasingly opting for long-term disease-modifying therapies to manage chronic allergic conditions. Moreover, the country’s strong pharmaceutical manufacturing base and emphasis on innovative biologics are enhancing treatment availability and supporting sustained market growth.
Asia-Pacific Allergy Treatment Market Insight
The Asia-Pacific allergy treatment market is poised to grow at the fastest CAGR of 13–15% during the forecast period of 2026 to 2033, driven by rising urbanization, worsening air pollution, and increasing prevalence of allergic diseases across densely populated countries. The region is witnessing growing adoption of modern allergy treatments supported by improving healthcare infrastructure and rising awareness. Governments are also focusing on expanding access to respiratory and allergy care services, further supporting market growth. In addition, the increasing availability of affordable generic drugs and expanding pharmaceutical distribution networks are making treatments more accessible to a wider population base.
Japan Allergy Treatment Market Insight
The Japan allergy treatment market is gaining momentum due to high rates of seasonal pollen allergies, advanced healthcare systems, and strong emphasis on preventive care. Patients are increasingly adopting antihistamines, nasal sprays, and immunotherapy solutions for long-term allergy management. The country’s aging population is also contributing to higher demand for easy-to-administer and well-tolerated treatment options. Furthermore, integration of advanced diagnostics and personalized treatment approaches is enhancing clinical outcomes and supporting steady market growth.
India Allergy Treatment Market Insight
The India allergy treatment market accounted for the largest market revenue share in Asia-Pacific in 2025, attributed to rapid urbanization, rising pollution levels, and a growing middle-class population with increasing healthcare awareness. The demand for affordable OTC antihistamines and prescription allergy medications is expanding significantly across urban and semi-urban areas. Government initiatives aimed at improving respiratory health and expanding healthcare access are further supporting market growth. In addition, increasing penetration of pharmacies, e-commerce platforms, and telemedicine services is making allergy treatments more accessible across the country.
Allergy Treatment Market Share
The Allergy Treatment industry is primarily led by well-established companies, including:
- ALK-Abelló A/S (Denmark)
- Stallergenes Greer plc (Switzerland)
- Allergy Therapeutics plc (U.K.)
- HAL Allergy Group (Netherlands)
- DBV Technologies S.A. (France)
- LETI Pharma S.L.U. (Spain)
- Aimmune Therapeutics, Inc. (U.S.)
- Regeneron Pharmaceuticals, Inc. (U.S.)
- Sanofi (France)
- AbbVie Inc. (U.S.)
- Pfizer Inc. (U.S.)
- GSK plc (U.K.)
- Novartis AG (Switzerland)
- Merck & Co., Inc. (U.S.)
- Bayer AG (Germany)
- Teva Pharmaceutical Industries Ltd. (Israel)
- AstraZeneca (U.K.)
- Circassia Pharmaceuticals plc (U.K.)
- HollisterStier Allergy (U.S.)
What are the Recent Developments in Global Allergy Treatment Market?
- In February 2026, the U.S. FDA approved Dupixent (dupilumab) for allergic fungal rhinosinusitis (AFRS), expanding its use in chronic allergic inflammatory diseases. The approval extends its application beyond asthma and atopic dermatitis into rare ENT-related allergic conditions, strengthening the role of IL-4/IL-13 pathway inhibition in precision allergy treatment. This milestone highlights growing regulatory confidence in biologics for complex allergic disorders
- In June 2025, clinical trial results from the EVEREST Phase 4 study demonstrated that Dupixent showed superior efficacy compared to Xolair in chronic rhinosinusitis with nasal polyps (CRSwNP). The study highlighted improved outcomes in symptom control and respiratory function, reinforcing dupilumab’s leadership in type 2 inflammatory allergic diseases. The findings are expected to influence future treatment guidelines and prescribing trends globally
- In April 2025, the U.S. FDA approved Dupixent for the treatment of chronic spontaneous urticaria (CSU) in patients with inadequate response to antihistamines. This expanded its use into a major allergic skin condition, improving therapeutic options for patients with persistent hives and immune-related skin inflammation. The approval further strengthened biologics adoption in dermatological allergy treatment
- In March 2025, an omalizumab biosimilar (CT-P39) received regulatory approval, marking a significant step toward improving affordability and access to IgE-targeted biologic therapies. The biosimilar launch is expected to increase adoption of biologics in severe asthma and chronic urticaria by reducing treatment costs. This development supports wider penetration of advanced immunotherapy in allergy management
- In September 2024, the FDA approved lebrikizumab for the treatment of moderate-to-severe atopic dermatitis in patients aged 12 years and older. The IL-13 inhibitor expands biologic options for allergic skin diseases, improving long-term disease control and reducing reliance on systemic corticosteroids. This approval reflects the rapid advancement of targeted immunology therapies in allergy treatment
SKU-

- Interactive Data Analysis Dashboard
- Company Analysis Dashboard for high growth potential opportunities
- Research Analyst Access for customization & queries
- Competitor Analysis with Interactive dashboard
- Latest News, Updates & Trend analysis
- Harness the Power of Benchmark Analysis for Comprehensive Competitor Tracking
Data collection and base year analysis are done using data collection modules with large sample sizes. The stage includes obtaining market information or related data through various sources and strategies. It includes examining and planning all the data acquired from the past in advance. It likewise envelops the examination of information inconsistencies seen across different information sources. The market data is analysed and estimated using market statistical and coherent models. Also, market share analysis and key trend analysis are the major success factors in the market report. To know more, please request an analyst call or drop down your inquiry.
The key research methodology used by DBMR research team is data triangulation which involves data mining, analysis of the impact of data variables on the market and primary (industry expert) validation. Data models include Vendor Positioning Grid, Market Time Line Analysis, Market Overview and Guide, Company Positioning Grid, Patent Analysis, Pricing Analysis, Company Market Share Analysis, Standards of Measurement, Global versus Regional and Vendor Share Analysis. To know more about the research methodology, drop in an inquiry to speak to our industry experts.
Data Bridge Market Research is a leader in advanced formative research. We take pride in servicing our existing and new customers with data and analysis that match and suits their goal. The report can be customized to include price trend analysis of target brands understanding the market for additional countries (ask for the list of countries), clinical trial results data, literature review, refurbished market and product base analysis. Market analysis of target competitors can be analyzed from technology-based analysis to market portfolio strategies. We can add as many competitors that you require data about in the format and data style you are looking for. Our team of analysts can also provide you data in crude raw excel files pivot tables (Fact book) or can assist you in creating presentations from the data sets available in the report.


