
Global Ambulatory X Ray Devices Market
Market Size in USD Billion
CAGR :
% 
 USD
2.17 Billion
USD
4.02 Billion
2024
2032
USD
2.17 Billion
USD
4.02 Billion
2024
2032
| 2025 –2032 | |
| USD 2.17 Billion | |
| USD 4.02 Billion | |
| % | |
|
Ambulatory X-Ray Devices Market Size
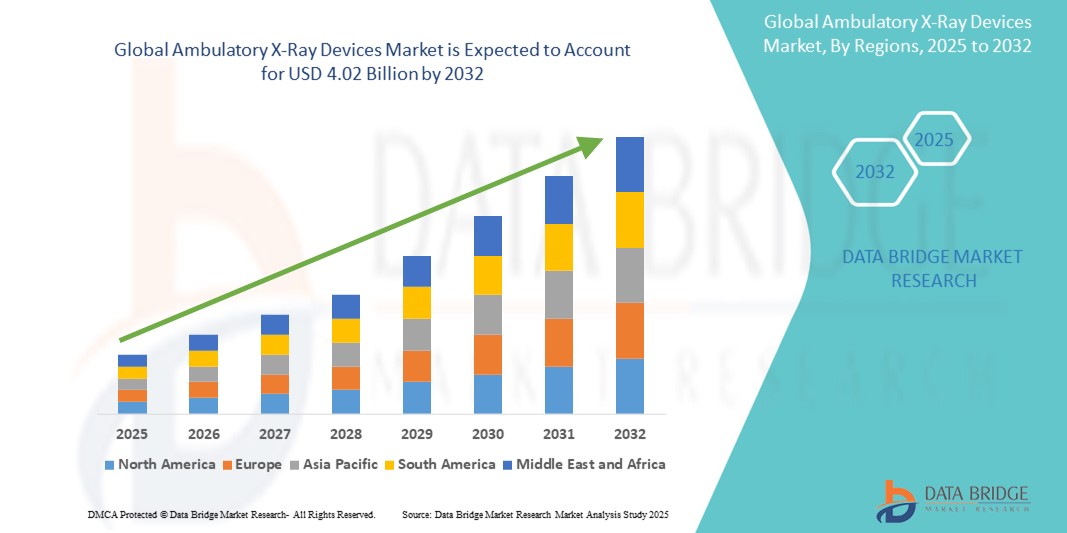
- The global ambulatory x-ray devices market size was valued at USD 2.17 billion in 2024 and is expected to reach USD 4.02 billion by 2032, at a CAGR of 8.01% during the forecast period
- This growth is driven by factors such as the increasing demand for portable and cost-effective diagnostic solutions, along with advancements in X-ray technology that enhance mobility and imaging quality for healthcare providers
Ambulatory X-Ray Devices Market Analysis
- Ambulatory X-ray devices are portable imaging tools used for diagnostic purposes in a variety of healthcare settings, offering mobility and ease of use for patients and healthcare providers. These devices are crucial for diagnosing bone fractures, joint issues, and other conditions requiring X-ray imaging
- The demand for ambulatory X-ray devices is driven by factors such as the increasing need for point-of-care diagnostics, the growing elderly population, and advancements in portable imaging technology
- North America is expected to dominate the ambulatory X-ray devices market with a market share of 40.5%, due to the presence of advanced healthcare infrastructure, widespread adoption of mobile imaging solutions, and strong reimbursement frameworks
- Asia-Pacific is expected to be the fastest growing region in the ambulatory x-ray devices market with a market share of 23.1%, during the forecast period due to expanding healthcare access, rising healthcare expenditures, and growing awareness of early diagnostic imaging
- Mobile X-Ray devices segment is expected to dominate the market with a market share of 72.5% due to high portability, ease of use, and ability to provide diagnostic imaging at the point of care. These devices are particularly valuable in emergency situations, home care settings, and rural or remote areas, where access to stationary equipment may be limited
Report Scope and Ambulatory X-Ray Devices Market Segmentation
|
Attributes |
Ambulatory X-Ray Devices Key Market Insights |
|
Segments Covered |
|
|
Countries Covered |
North America
Europe
Asia-Pacific
Middle East and Africa
South America
|
|
Key Market Players |
|
|
Market Opportunities |
|
|
Value Added Data Infosets |
In addition to the insights on market scenarios such as market value, growth rate, segmentation, geographical coverage, and major players, the market reports curated by the Data Bridge Market Research also include import export analysis, production capacity overview, production consumption analysis, price trend analysis, climate change scenario, supply chain analysis, value chain analysis, raw material/consumables overview, vendor selection criteria, PESTLE Analysis, Porter Analysis, and regulatory framework. |
Ambulatory X-Ray Devices Market Trends
“Advancements in Portable X-Ray Systems & Mobile Imaging Technology”
- One prominent trend in the development of ambulatory X-ray devices is the increasing integration of mobile and wireless imaging systems, providing healthcare professionals with real-time, high-quality diagnostic imaging at the point of care
- These innovations enhance the efficiency of diagnosis by offering rapid imaging capabilities, allowing for quicker decision-making in emergency situations, and improving the accessibility of X-ray services in remote and underserved areas
- For instance, modern portable X-ray systems with wireless technology enable seamless transmission of images to cloud-based systems, which can be accessed by medical professionals instantly, facilitating faster consultations and diagnoses
- These advancements are revolutionizing point-of-care diagnostics, improving patient outcomes, and fueling the demand for next-generation ambulatory X-ray devices with enhanced mobility, portability, and advanced imaging features
Ambulatory X-Ray Devices Market Dynamics
Driver
“Rising Demand Due to Increasing Prevalence of Chronic Diseases”
- The growing prevalence of chronic diseases such as orthopedic conditions, cancer, and cardiovascular diseases is significantly driving the demand for ambulatory X-ray devices
- As the global population ages, the incidence of musculoskeletal disorders, fractures, and other conditions requiring imaging for diagnosis and treatment increases, thereby expanding the need for mobile and portable X-ray systems
- In addition, the increasing adoption of preventive healthcare and early diagnosis strategies is further accelerating the demand for X-ray devices, as they are essential tools for quick and effective imaging at point-of-care settings
For instance,
- In 2022, the World Health Organization (WHO) reported a rise in the global burden of chronic diseases, with conditions such as osteoarthritis, osteoporosis, and cancer showing an upward trend, especially among older adults. The demand for quick, portable diagnostic solutions such as ambulatory X-ray devices is thus expected to rise in response to this growing healthcare need
- The increasing prevalence of these chronic conditions is significantly propelling the adoption of ambulatory X-ray devices, ensuring faster diagnostics and improving patient outcomes in various healthcare settings
Opportunity
“Leveraging Artificial Intelligence for Enhanced Imaging and Diagnostics”
- The integration of artificial intelligence (AI) into ambulatory X-ray devices presents a significant opportunity to improve diagnostic accuracy and enhance the overall effectiveness of portable imaging systems
- AI algorithms can assist in real-time image analysis, helping healthcare providers identify abnormalities such as fractures, tumors, and other medical conditions more efficiently, allowing for quicker decision-making in urgent care settings
- In addition, AI-powered X-ray devices can automate image processing, eliminating human error, and enhancing the clarity of images, even in low-resource environments where manual expertise might be limited
For instance,
- In 2023, the Journal of Radiology reported that AI algorithms are being increasingly used to detect fractures, pulmonary nodules, and even signs of COVID-19 in X-ray images, offering greater precision in diagnosis and facilitating timely interventions. The ability of AI to analyze vast amounts of X-ray data with high accuracy has revolutionized diagnostic workflows in ambulatory settings
- The incorporation of AI in ambulatory X-ray devices not only improves diagnostic outcomes but also increases operational efficiency, reduces the time patients spend waiting for results, and supports healthcare providers in delivering better care
Restraint/Challenge
“High Equipment Costs Hindering Market Adoption”
- The high cost of ambulatory X-ray devices is a significant challenge, particularly in low- and middle-income regions, where healthcare facilities may struggle to afford these advanced, portable imaging systems
- These devices, crucial for providing diagnostic imaging in mobile settings or underserved areas, can be priced anywhere from tens of thousands to over a hundred thousand dollars, depending on the technology and features
- This substantial financial barrier can prevent smaller clinics, rural healthcare facilities, and ambulatory centers from investing in or upgrading their equipment, leaving them reliant on outdated technologies
For instance,
- In December 2023, according to an article published by Medical Device Network, the cost of high-quality mobile X-ray systems remains a major factor limiting their adoption in emerging economies, where healthcare budgets are tight, and medical equipment investments are often deprioritized. The inability to afford cutting-edge portable X-ray systems can lead to delays in diagnosis and treatment, which ultimately affects patient care
- Consequently, the high upfront cost of ambulatory X-ray devices may impede their widespread adoption and limit the growth potential of the market, particularly in regions where access to advanced medical technology is restricted
Ambulatory X-Ray Devices Market Scope
The market is segmented on the basis of product type, application, accessories, technology, end user and distribution channel
|
Segmentation |
Sub-Segmentation |
|
By Product Type |
|
|
By Application |
|
|
By Accessories |
|
|
By Technology |
|
|
By End User |
|
|
By Distribution Channel |
|
In 2025, the mobile X-Ray devices is projected to dominate the market with a largest share in product type segment
The mobile X-Ray devices segment is expected to dominate the ambulatory X-ray devices market with the largest share of 72.5% in 2025 due to its high portability, ease of use, and ability to provide diagnostic imaging at the point of care. These devices are particularly valuable in emergency situations, home care settings, and rural or remote areas, where access to stationary equipment may be limited
The digital radiography X-Ray (Dr), is expected to account for the largest share during the forecast period in technology market
In 2025, the digital radiography X-Ray (Dr), segment is expected to dominate the market with the largest market share of 71.3% due to its superior image quality, faster processing times, and reduced need for film, making it more efficient and cost-effective. DR systems offer real-time imaging with high resolution, improving diagnostic accuracy and patient care
Ambulatory X-Ray Devices Market Regional Analysis
“North America Holds the Largest Share in the Ambulatory X-Ray Devices Market”
- North America dominates the ambulatory x-ray devices market with a market share of estimated 40.5%, driven, by the presence of advanced healthcare infrastructure, widespread adoption of mobile imaging solutions, and strong reimbursement frameworks
- U.S. holds a market share of 45.5%, due to high demand for point-of-care diagnostics, increased incidence of chronic diseases, and a well-established network of ambulatory care facilities
- The region also benefits from the strong presence of leading medical device manufacturers, ongoing R&D investments, and rapid adoption of digital and wireless imaging technologies
- In addition, the growing need for rapid, on-site diagnostics in outpatient settings, nursing homes, and emergency services is contributing to the expanding use of ambulatory X-ray systems across the region
“Asia-Pacific is Projected to Register the Highest CAGR in the Ambulatory X-Ray Devices Market”
- Asia-Pacific is expected to witness the highest growth rate in the ambulatory X-ray devices market with a market share of 23.1%, driven by rapid expansion in healthcare infrastructure, increasing awareness about eye health, and rising surgical volumes
- Countries such as China, India, and Japan are leading the regional market due to their large patient populations, increasing burden of chronic diseases, and rising demand for mobile diagnostic solutions in rural and underserved areas
- Japan, known for its advanced healthcare technology, continues to adopt portable imaging systems to support its aging population and enhance diagnostic efficiency in outpatient care
- India is projected to register the highest CAGR in the ambulatory X-ray devices market, driven by expanding ambulatory care services, increasing adoption of digital radiography, and government efforts to strengthen diagnostic infrastructure in both urban and rural settings
Ambulatory X-Ray Devices Market Share
The market competitive landscape provides details by competitor. Details included are company overview, company financials, revenue generated, market potential, investment in research and development, new market initiatives, global presence, production sites and facilities, production capacities, company strengths and weaknesses, product launch, product width and breadth, application dominance. The above data points provided are only related to the companies' focus related to market.
The Major Market Leaders Operating in the Market Are:
- Siemens Healthineers AG (Germany)
- General Electric Company (U.S.)
- TOSHIBA CORPORATION (Japan)
- Shimadzu Corporation (Japan)
- Hitachi, Ltd. (Japan)
- Carestream Health (U.S.)
- AmRad Medical Equipments (U.S.)
- Canon U.S.A., Inc. (U.S.)
- Cuattro (U.S.)
- Konica Minolta, Inc. (Japan)
- MinXray, Inc. (U.S.)
- Agfa-Gevaert Group (Belgium)
- FUJIFILM Holdings Corporation (Japan)
- Koninklijke Philips N.V. (Netherlands)
- PerkinElmer (U.S.)
- Varian (U.S.)
- Source-Ray, Inc (U.S.)
- SAMSUNG (South Korea)
- Bennett Village (U.S.)
- Allengers (India)
Latest Developments in Global Ambulatory X-Ray Devices Market
- In December 2024, Micro-X was awarded an USD 8.2 million contract by the U.S. Advanced Research Projects Agency for Health (ARPA-H) to develop a portable full-body CT scanner. This project aims to create a lightweight, mobile imaging solution suitable for various settings, including military and emergency response. An additional USD 8.2 million option is available for continued development leading to FDA submission. This contract underscores the growing demand for mobile diagnostic imaging technologies
- In July 2024, Australian company Micro-X announced the development of a lightweight mobile CT scanner designed for ambulance use. This innovative device can scan a patient's brain in just eight seconds, enabling rapid stroke diagnosis and immediate image transmission to specialists. The scanner, weighing under 70 kg, utilizes Micro-X's Nano Electronic X-ray (NEX) technology, offering significantly lower radiation doses compared to conventional scanners
- In May 2023, Carestream Health introduced the DRX-Rise Mobile X-ray System, designed to enhance image quality and maneuverability. This system features AI-powered image processing software that improves image quality and dosage efficiency, catering to the growing demand for advanced mobile imaging solutions in various healthcare settings
- In July 2022, Shimadzu Corporation launched an updated version of its digital mobile X-ray system, the MobileDaRt Evolution MX8 Version v type, targeted at international markets outside Japan. This advanced system delivers improved mobility and imaging performance, enabling rapid and efficient diagnostic imaging across diverse healthcare environments. The release highlights ongoing advancements in ambulatory X-ray technology
- In June 2021, Oehm und Rehbein GmbH introduced the Amadeo R motorized system, expanding its product offerings for inpatient medical care. This digital X-ray system is equipped with an auto-tracking feature and supports various patient positions—including seated, supine, and upright—making it highly versatile for a broad range of diagnostic imaging procedures with enhanced precision and ease of use
SKU-
Get online access to the report on the World's First Market Intelligence Cloud

- Interactive Data Analysis Dashboard
- Company Analysis Dashboard for high growth potential opportunities
- Research Analyst Access for customization & queries
- Competitor Analysis with Interactive dashboard
- Latest News, Updates & Trend analysis
- Harness the Power of Benchmark Analysis for Comprehensive Competitor Tracking
Research Methodology
Data collection and base year analysis are done using data collection modules with large sample sizes. The stage includes obtaining market information or related data through various sources and strategies. It includes examining and planning all the data acquired from the past in advance. It likewise envelops the examination of information inconsistencies seen across different information sources. The market data is analysed and estimated using market statistical and coherent models. Also, market share analysis and key trend analysis are the major success factors in the market report. To know more, please request an analyst call or drop down your inquiry.
The key research methodology used by DBMR research team is data triangulation which involves data mining, analysis of the impact of data variables on the market and primary (industry expert) validation. Data models include Vendor Positioning Grid, Market Time Line Analysis, Market Overview and Guide, Company Positioning Grid, Patent Analysis, Pricing Analysis, Company Market Share Analysis, Standards of Measurement, Global versus Regional and Vendor Share Analysis. To know more about the research methodology, drop in an inquiry to speak to our industry experts.
Customization Available
Data Bridge Market Research is a leader in advanced formative research. We take pride in servicing our existing and new customers with data and analysis that match and suits their goal. The report can be customized to include price trend analysis of target brands understanding the market for additional countries (ask for the list of countries), clinical trial results data, literature review, refurbished market and product base analysis. Market analysis of target competitors can be analyzed from technology-based analysis to market portfolio strategies. We can add as many competitors that you require data about in the format and data style you are looking for. Our team of analysts can also provide you data in crude raw excel files pivot tables (Fact book) or can assist you in creating presentations from the data sets available in the report.

