
Global And Us Algae Based Aquafeed Market
Market Size in USD Million
 USD
29.48 Million
USD
52.57 Million
2024
2032
USD
29.48 Million
USD
52.57 Million
2024
2032
| 2025 - 2032 | |
| USD 29.48 Million | |
| USD 52.57 Million | |
| % | |
|
Algae Based Aquafeed Market Size
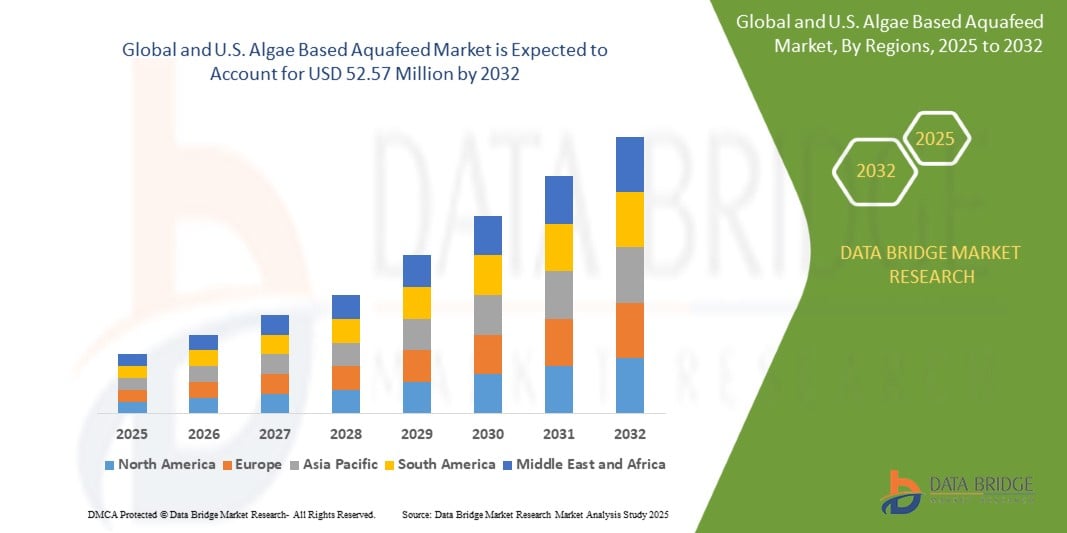
- The Global and U.S. algae based aquafeed market was valued at USD 29.48 million in 2024 and is expected to reach USD 52.57 million by 2032, at a CAGR of 7.6% during the forecast period
- This growth is driven by factors such as rising demand for sustainable and eco-friendly aquafeed alternatives and high nutritional value of algae including omega-3 fatty acids and essential amino acids
- Furthermore, growing concerns over the environmental impact of traditional fishmeal and the need for scalable, plant-based feed options are positioning algae-based aquafeed as a viable and eco-friendly solution
Algae Based Aquafeed Market Analysis
- The global and U.S. algae based aquafeed market is experiencing steady growth, driven by particularly microalgae, are naturally rich in omega-3 fatty acids such as EPA and DHA, which are crucial for the growth, immune function, and reproductive health of farmed fish and shrimp. Traditionally sourced from fish oil, omega-3s are increasingly being extracted from algae to avoid the environmental downsides of overfishing. In addition to fatty acids, algae contain high-quality proteins and essential amino acids that support optimal development and metabolic functions in aquaculture species. These nutrients are not only vital for animal health but also enhance the nutritional value of the final seafood product, catering to health-conscious consumers
- Moreover, the digestibility of algae-based feed ingredients often surpasses that of conventional plant-based alternatives, improving feed efficiency and reducing waste outputs. As aquaculture continues to expand to meet global seafood demand, algae-based feeds offer a nutritionally complete and sustainable option to support high-performance aquaculture systems
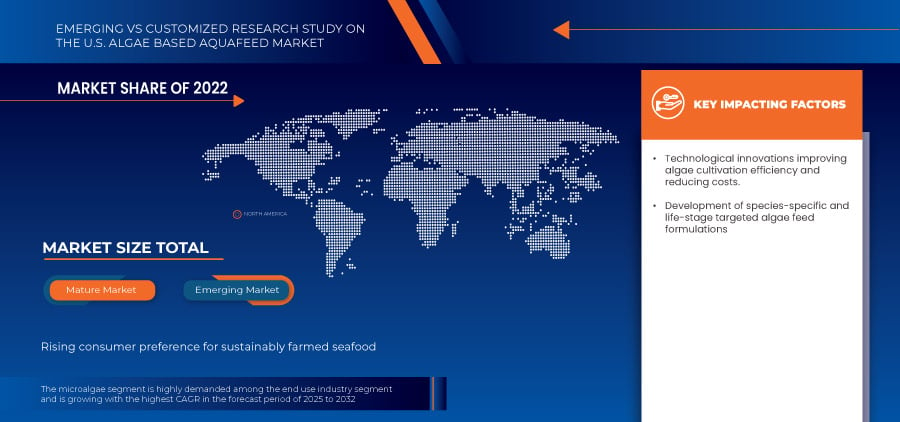
- The microalgae segment dominated the Global and U.S. Algae Based Aquafeed Market in 2024 due to its high nutritional content, including essential proteins and omega-3 fatty acids, and its alignment with sustainable aquaculture practices
Report Scope and Algae Based Aquafeed Market Segmentation
|
Attributes |
Algae Based Aquafeed Key Market Insights |
|
Segments Covered |
|
|
Countries Covered |
|
|
Key Market Players |
|
|
Market Opportunities |
|
|
Value Added Data Infosets |
In addition to the insights on market scenarios such as market value, growth rate, segmentation, geographical coverage, and major players, the market reports curated by the Data Bridge Market Research also include import export analysis, production capacity overview, production consumption analysis, price trend analysis, climate change scenario, supply chain analysis, value chain analysis, raw material/consumables overview, vendor selection criteria, PESTLE Analysis, Porter Analysis, and regulatory framework. |
Algae Based Aquafeed Market Trends
Advancements In R&D Targeting Cost Optimization, Enhanced Algal Strains, And Improved Processing Efficiency
- Research and Development (R&D) in algae cultivation and processing offers a significant opportunity to overcome key cost and scalability challenges in the algae-based aquafeed market
- Innovations focused on reducing production costs, optimizing strain selection, and improving downstream processing are driving the commercial viability of algae as a sustainable aquafeed ingredient.
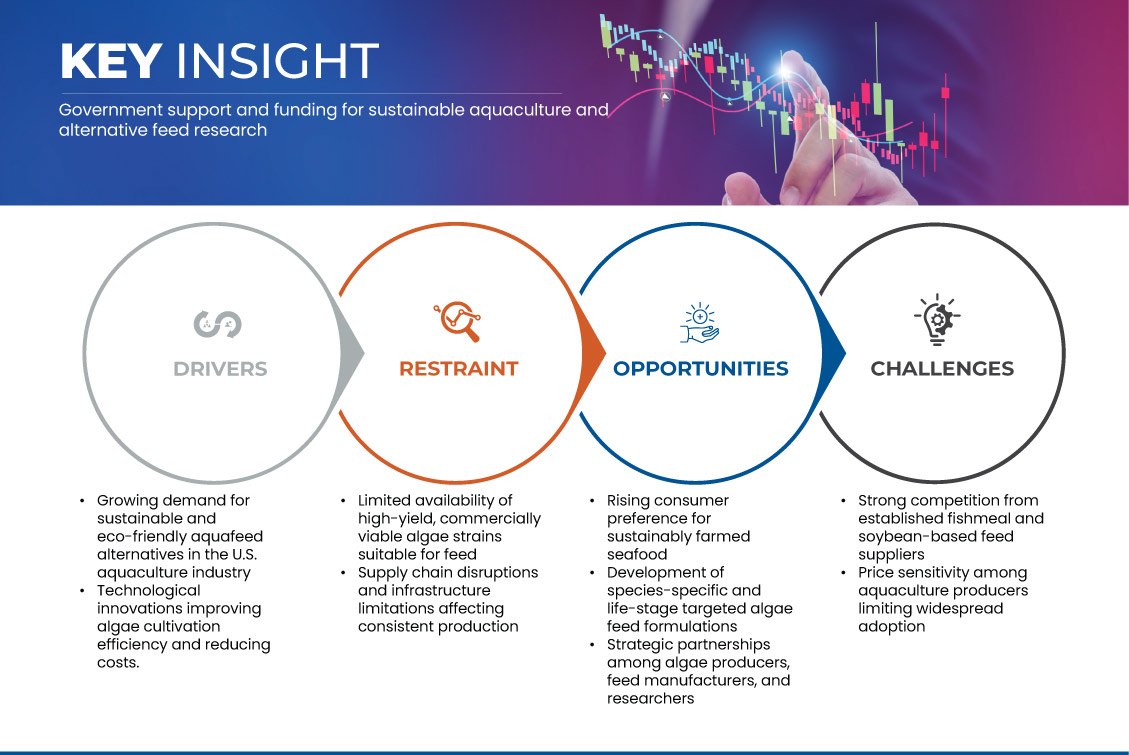
- Advanced biotechnology is enabling the development of high-yield, fast-growing algal strains with tailored nutritional profiles, such as increased levels of essential fatty acids, amino acids, and pigments. These customized strains can boost feed efficiency and health benefits for aquatic species
- Simultaneously, improvements in harvesting, dewatering, and drying methods—such as low-energy filtration, solar drying, and novel extraction technologies—are making algae processing more energy-efficient and cost-effective
- Integrated biorefineries are also gaining traction, allowing for the extraction of multiple valuable products (lipids, proteins, pigments) from a single algal biomass, thereby enhancing economic returns. Public and private investments in algae R&D, often supported by government and academic partnerships, are accelerating breakthroughs in these areas
Algae Based Aquafeed Market Dynamics
Driver
Rising Demand for Sustainable and Eco-Friendly Aquafeed Alternatives
- Conventional aquafeed, primarily composed of fishmeal and fish oil, contributes to overfishing and degradation of the marine ecosystem. In contrast, algae-based feed offers a renewable and environmentally friendly solution, rich in essential nutrients such as omega-3 fatty acids, proteins, and vitamins
- With increasing awareness of environmental impacts and stricter sustainability standards from regulators and certifying bodies, aquaculture producers are actively shifting toward algae-based alternatives
- Moreover, growing consumer demand for sustainably farmed seafood is pressuring aquaculture operations to adopt more environmentally friendly practices throughout the entire value chain
- Algae cultivation also requires minimal land and freshwater resources compared to traditional crops, further enhancing its appeal amid concerns about climate change and resource scarcity. Innovations in biotechnology and algae production methods have enhanced cost efficiency and scalability, making algae-based feed more accessible for both small- and large-scale aquaculture operations
- For instance, In February 2024, an article by MDPI stated that using algae in aquaculture is an eco-friendly, safe, and cost-effective approach that can effectively replace fish meal and fish oil in aquatic feeds. As dietary supplements, algae play a significant role in enhancing the health of aquatic animals and contribute to the improvement of ecosystems. They are nutrient-rich and form the base of the aquatic food chain
- The rising emphasis on sustainability in aquaculture is a key driver propelling the adoption of algae-based aquafeed. As environmental regulations tighten and consumer awareness increases, the shift toward eco-friendly feed solutions is expected to accelerate. Algae-based feed offers both ecological and nutritional benefits, positioning it as a crucial component in the future of responsible aquaculture practices
Restraint/Challenge
Price Competition from Traditional Feed Ingredients Like Fishmeal and Soybean Meal
- Traditional ingredients benefit from mature, large-scale supply chains, consistent availability, and relatively low production costs, making them economically favorable to aquaculture producers worldwide.
- In contrast, algae-based feed components—despite offering superior nutritional profiles and sustainability—remain comparatively expensive due to high cultivation, harvesting, and processing costs.
- Fishmeal and soybean meal are deeply integrated into aquafeed formulations, with global infrastructure supporting their production and distribution. Their long-standing use has led to technological optimization and economies of scale, which algae-based alternatives have yet to fully achieve.
- As a result, producers in cost-sensitive markets, particularly in developing regions, often opt for these lower-cost options despite the potential environmental and nutritional trade-offs associated with them.
- For instance, In November 2024, as per MDPI, algae-based feeds cost between USD 1,000–1,500 per ton, significantly higher than plant-based feeds (USD 300–700) and fishmeal (USD 1,600). This substantial cost difference hinders the adoption of algae-based feeds, especially among small-scale farmers in developing regions
- In July 2024, according to an article by Fish Farmer, the unpredictability of fishmeal supply and its high prices led fish farmers to seek alternatives. While algae-based feeds offer sustainability benefits, their higher costs compared to traditional ingredients like fishmeal and soybean meal pose adoption challenges
- Price competition from fishmeal and soybean meal remains a major hurdle for the algae-based aquafeed market. Without cost parity or supportive policies, algae-derived alternatives risk being sidelined despite their sustainability and nutritional benefits. Achieving competitive pricing through innovation, scale-up, and strategic partnerships is crucial for algae-based feeds to capture a broader market share.
Algae Based Aquafeed Market Scope
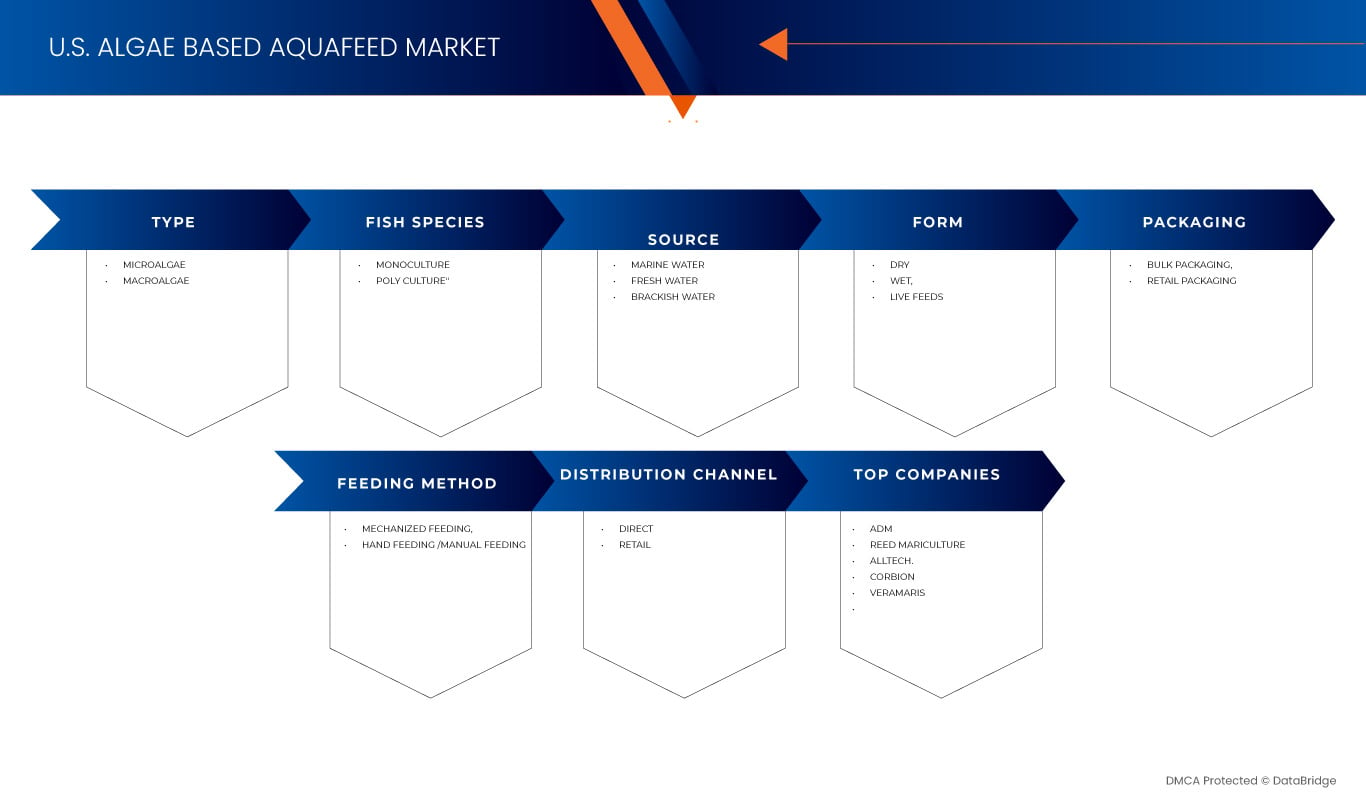
The market is segmented on the basis of type, fish species, source, form, feeding method, packaging, and distribution channel
- By Type
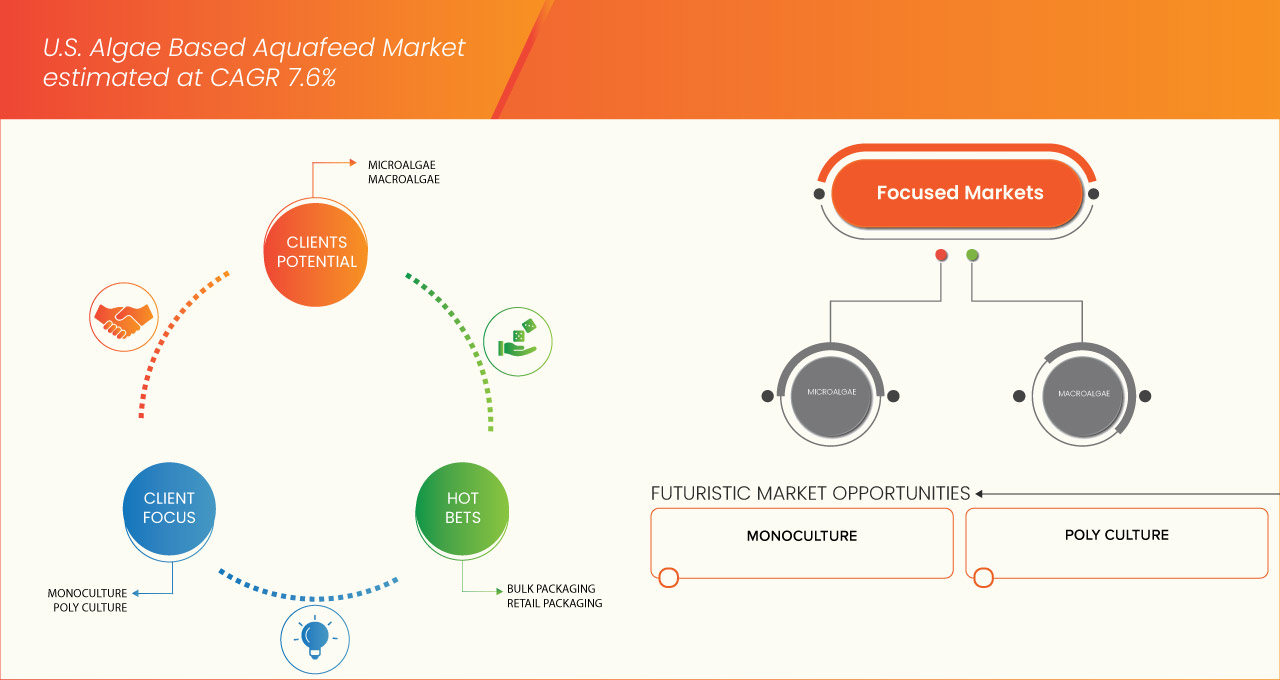
On the basis of type, the market is segmented into microalgae and macroalgae. In 2025, the microalgae segment is expected to dominate the market with a market share of 89.78% growing with the highest CAGR of 7.6% in the forecast period of 2025 to 2032 driven by its high nutritional content, including essential proteins and omega-3 fatty acids, and its alignment with sustainable aquaculture practices.
- By Fish Species
On the basis fish species, the market is segmented into monoculture, poly culture. In 2025, the sustainable rigid films monoculture segment is expected to dominate the market with a market share of 62.18% growing with the highest CAGR of 7.6% in the forecast period of 2025 to 2032 driven by its streamlined cultivation processes, cost-effectiveness, and consistent quality.
- By Source
On the basis of source, the market is segmented into marine water, fresh water, brackish water. In 2025, the marine water segment is expected to dominate the market with a market share of 48.17% growing with the highest CAGR of 7.7% in the forecast period of 2025 to 2032 driven by the expansion of saltwater aquaculture in coastal regions, particularly in the southern U.S.
- By Form
On the basis of form, the market is segmented into dry, wet, live feeds. In 2025, the dry segment is expected to dominate the market with a 70.14 % growing with the CAGR of 7.6 % in the forecast period of 2025 to 2032 driven by its superior storage stability, cost-effectiveness, and ease of transportation. Dry feeds, including pellets and powders, offer longer shelf life and consistent nutrient profiles, making them ideal for large-scale aquaculture operations seeking efficiency and sustainability.
- By Feeding Method
On the basis of feeding method, the market is segmented into mechanized feeding, hand feeding /manual feeding. In 2025, the mechanized feeding segment is expected to dominate the market with a 64.26 %growing with the CAGR of 7.6% in the forecast period of 2025 to 2032 driven by its ability to enhance feeding precision, reduce labor costs, and minimize feed waste. Automated systems ensure consistent feed distribution, optimizing fish growth and health, which aligns with the industry's shift towards sustainable and efficient aquaculture practices.
- By Packaging
On the basis of packaging, the market is segmented into bulk packaging, retail packaging. In 2025, the bulk packaging segment is expected to dominate the market with a 67.61 % growing with the CAGR of 7.6% in the forecast period of 2025 to 2032 driven by the operational efficiencies it offers to large-scale aquaculture operations. Bulk packaging reduces transportation and storage costs, minimizes packaging waste, and supports streamlined feed inventory management, catering to the growing demand for cost-effective and sustainable feed solutions.
- By Distribution Channel
On the basis of distribution channel, the market is segmented into direct and retail. In 2025, the direct segment is expected to dominate the market with a 58.12 % growing with the CAGR of 7.6% in the forecast period of 2025 to 2032 as producers increasingly seek to establish closer relationships with aquaculture farms. Direct sales channels allow for better customer feedback, tailored feed solutions, and improved supply chain transparency, fostering trust and responsiveness in meeting specific nutritional requirements.
U.S. Algae Based Aquafeed Market Regional Analysis
- U.S. algae based aquafeed market is expected to reach 52,568.71 USD million by 2032, from 29,484.00 USD million in 2024, and is expected to register the CAGR of 7.6% from 2025 to 2032 in 2025, driven by increasing demand for sustainable and plant-based feed alternatives
- Algae offer high protein, omega-3 fatty acids, and essential nutrients, reducing reliance on fishmeal. Rising environmental concerns, advancements in algae cultivation, and the push for clean-label aquaculture are driving adoption
- Regulatory support and growing awareness among feed manufacturers are further accelerating market growth in the U.S. aquafeed industry
Algae Based Aquafeed Market Share
The algae based aquafeed market industry is primarily led by well-established companies, including
- ADM (U.S.)
- Reed Mariculture (U.S.)
- Alltech. (U.S.)
- Corbion (Netherlands)
- Veramaris (Netherlands)
- Brine Shrimp Direct, Inc. (U.S.)
- Hikari Sales USA, Inc. (U.S.)
- Fluval (Canada)
Latest Developments in Global and U.S. Algae Based Aquafeed Market
- In March 2025, Aperture Pet & Life has announced an exclusive North American distribution partnership with Germany-based Giesemann Aquaristic. This collaboration will bring Giesemann’s premium aquarium lighting, equipment, and accessories to the U.S. market. Retailers can now access these high-quality products through Aperture’s distribution network.
- In July 2024, INVE Aquaculture has announced a strategic partnership with Reed Mariculture Inc. to expand its distribution network across the U.S. and Canada. This collaboration aims to enhance access to INVE’s advanced aquaculture nutrition and health products, backed by Reed Mariculture’s market expertise and customer reach
SKU-

- Interactive Data Analysis Dashboard
- Company Analysis Dashboard for high growth potential opportunities
- Research Analyst Access for customization & queries
- Competitor Analysis with Interactive dashboard
- Latest News, Updates & Trend analysis
- Harness the Power of Benchmark Analysis for Comprehensive Competitor Tracking
Table of Content
1 INTRODUCTION
1.1 OBJECTIVES OF THE STUDY
1.2 MARKET DEFINITION
1.3 OVERVIEW
1.4 LIMITATIONS
1.5 MARKETS COVERED
2 MARKET SEGMENTATION
2.1 MARKETS COVERED
2.2 GEOGRAPHICAL SCOPE
2.3 YEARS CONSIDERED FOR THE STUDY
2.4 CURRENCY AND PRICING
2.5 DBMR TRIPOD DATA VALIDATION MODEL
2.6 MULTIVARIATE MODELING
2.7 PRIMARY INTERVIEWS WITH KEY OPINION LEADERS
2.8 DBMR MARKET POSITION GRID
2.9 DBMR VENDOR SHARE ANALYSIS
2.1 SECONDARY SOURCES
2.11 ASSUMPTIONS
3 EXECUTIVE SUMMARY
4 PREMIUM INSIGHTS
4.1 VALUE CHAIN ANALYSIS
4.2 FACTORS INFLUENCING PURCHASING DECISION OF END-USERS IN THE U.S. ALGAE-BASED AQUAFEED MARKET
4.3 PATENT QUALITY AND STRENGTH
4.3.1 PATENT FAMILIES
4.3.2 LICENSING AND COLLABORATIONS
4.3.3 COMPANY PATENT LANDSCAPE
4.3.4 REGION PATENT LANDSCAPE
4.3.5 IP STRATEGY AND MANAGEMENT
4.3.6 PATENT ANALYSIS
4.4 PRODUCTION CAPACITY FOR TOP MANUFACTURERS
4.5 PRICING ANALYSIS
4.6 BRAND OUTLOOK
4.6.1 BRAND COMPARATIVE ANALYSIS OF GLOBAL AND U.S. ALGAE-BASED AQUAFEED MARKET
4.6.2 PRODUCT VS BRAND OVERVIEW
4.6.2.1 PRODUCT OVERVIEW
4.6.2.2 BRAND OVERVIEW
4.7 GLOBAL OVERVIEW
4.8 GROWTH STRATEGIES ADOPTED BY KEY MARKET PLAYERS IN THE U.S. ALGAE-BASED AQUAFEED MARKET
4.9 IMPACTS OF ECONOMIC SLOWDOWN ON THE U.S. ALGAE-BASED AQUAFEED MARKET
4.9.1 IMPACT ON PRICE
4.9.2 IMPACT ON SUPPLY CHAIN
4.9.3 IMPACT ON SHIPMENT
4.9.4 IMPACT ON COMPANY’S STRATEGIC DECISIONS
4.1 RAW MATERIAL SOURCING ANALYSIS – U.S. ALGAE-BASED AQUAFEED MARKET
4.11 SUPPLY CHAIN ANALYSIS – GLOBAL AND U.S. ALGAE-BASED AQUAFEED MARKET
4.12 SUPPLY CHAIN ANALYSIS – GLOBAL AND U.S. ALGAE-BASED AQUAFEED MARKET
4.13 OVERVIEW OF TECHNOLOGICAL INNOVATIONS IN THE U.S. ALGAE-BASED AQUAFEED MARKET
4.14 COST ANALYSIS BREAKDOWN – U.S. ALGAE-BASED AQUAFEED MARKET
4.15 INDUSTRY ECOSYSTEM ANALYSIS: ALGAE-BASED AQUAFEED MARKET
4.16 MAJOR DEALS AND STRATEGIC ALLIANCES ANALYSIS
4.16.1 JOINT VENTURES
4.16.2 MERGERS AND ACQUISITIONS
4.16.3 LICENSING AND PARTNERSHIP
4.16.4 TECHNOLOGY COLLABORATIONS
4.16.5 STRATEGIC DIVESTMENTS
4.16.6 NUMBER OF PRODUCTS IN DEVELOPMENT
4.16.7 STAGE OF DEVELOPMENT
4.16.8 TIMELINES AND MILESTONES
4.16.9 INNOVATION STRATEGIES AND METHODOLOGIES
4.16.10 RISK ASSESSMENT AND MITIGATION
4.16.11 FUTURE OUTLOOK
4.17 PROFIT MARGINS SCENARIO – U.S. ALGAE-BASED AQUAFEED MARKET
5 TARIFFS & IMPACT ON THE U.S. ALGAE-BASED AQUAFEED MARKET
5.1 TRADE POLICY FLUCTUATIONS AND BROADER IMPACT ON GLOBAL SUPPLY DYNAMICS
5.2 CURRENT TARIFF RATE(S) IN TOP-5 COUNTRY MARKETS
5.3 OUTLOOK: LOCAL PRODUCTION V/S IMPORT RELIANCE
5.4 VENDOR SELECTION CRITERIA DYNAMICS
5.5 IMPACT ON SUPPLY CHAIN
5.5.1 RAW MATERIAL PROCUREMENT
5.5.2 MANUFACTURING AND PRODUCTION
5.5.3 LOGISTICS AND DISTRIBUTION
5.5.4 PRICE PITCHING AND POSITION OF MARKET
5.6 INDUSTRY PARTICIPANTS: PROACTIVE MOVES
5.6.1 SUPPLY CHAIN OPTIMIZATION
5.6.2 JOINT VENTURE ESTABLISHMENTS
5.7 IMPACT ON PRICES
5.8 REGULATORY INCLINATION
5.8.1 GEOPOLITICAL SITUATION
5.8.2 TRADE PARTNERSHIPS BETWEEN THE COUNTRIES
5.8.2.1 FREE TRADE AGREEMENTS
5.8.2.2 ALLIANCE ESTABLISHMENTS
5.8.3 STATUS ACCREDITATION (INCLUDING MFN)
5.8.4 DOMESTIC COURSE OF CORRECTION
5.8.4.1 INCENTIVE SCHEMES TO BOOST PRODUCTION OUTPUTS
5.8.4.2 ESTABLISHMENT OF SPECIAL ECONOMIC ZONES / INDUSTRIAL PARKS
6 REGULATORY FRAMEWORK AND GUIDELINES FOR THE U.S. ALGAE-BASED AQUAFEED MARKET
7 MARKET OVERVIEW
7.1 DRIVERS
7.1.1 RISING DEMAND FOR SUSTAINABLE AND ECO-FRIENDLY AQUAFEED ALTERNATIVES
7.1.2 HIGH NUTRITIONAL VALUE OF ALGAE, INCLUDING OMEGA-3 FATTY ACIDS AND ESSENTIAL AMINO ACIDS
7.1.3 GROWING GLOBAL AQUACULTURE PRODUCTION AND SEAFOOD CONSUMPTION
7.1.4 TECHNOLOGICAL ADVANCEMENTS IN ALGAE CULTIVATION AND PROCESSING SYSTEMS
7.2 RESTRAINTS
7.2.1 HIGH PRODUCTION AND PROCESSING COSTS OF ALGAE-BASED FEED
7.2.2 ENERGY-INTENSIVE AND COMPLEX HARVESTING AND DRYING PROCESSES
7.3 OPPORTUNITIES
7.3.1 INCREASING DEMAND FOR FUNCTIONAL FEED WITH HEALTH AND PERFORMANCE BENEFITS
7.3.2 ADVANCEMENTS IN R&D TARGETING COST OPTIMIZATION, ENHANCED ALGAL STRAINS, AND IMPROVED PROCESSING EFFICIENCY
7.3.3 INCORPORATION OF CARBON CAPTURE AND WASTEWATER REUSE TECHNOLOGIES INTO ALGAE-BASED AQUAFEED PRODUCTION SYSTEMS
7.4 CHALLENGES
7.4.1 PRICE COMPETITION FROM TRADITIONAL FEED INGREDIENTS LIKE FISHMEAL AND SOYBEAN MEAL
7.4.2 SUPPLY CHAIN LIMITATIONS AND INADEQUATE PROCESSING INFRASTRUCTURE
8 U.S. ALGAE-BASED AQUAFEED MARKET, BY TYPE
8.1 OVERVIEW
8.2 MICROALGAE
8.3 MACROALGAE
9 U.S. ALGAE-BASED AQUAFEED MARKET, BY FISH SPECIES
9.1 OVERVIEW
9.2 MONOCULTURE
9.3 POLY CULTURE
10 U.S. ALGAE-BASED AQUAFEED MARKET, BY SOURCE
10.1 OVERVIEW
10.2 MARINE WATER
10.3 FRESH WATER
10.4 BRACKISH WATER
11 U.S. ALGAE-BASED AQUAFEED MARKET, BY FORM
11.1 OVERVIEW
11.2 DRY
11.3 WET
11.4 LIVE FEEDS
12 U.S. ALGAE-BASED AQUAFEED MARKET, BY FEEDING METHOD
12.1 OVERVIEW
12.2 MECHANIZED FEEDING
12.3 HAND FEEDING /MANUAL FEEDING
13 U.S. ALGAE-BASED AQUAFEED MARKET, BY PACKAGING
13.1 OVERVIEW
13.2 BULK PACKAGING
13.3 RETAIL PACKAGING
14 U.S. ALGAE-BASED AQUAFEED MARKET, BY DISTRIBUTION CHANNEL
14.1 OVERVIEW
14.2 DIRECT
14.3 RETAIL
15 U.S ALGAE-BASED AQUAFEED MARKET: COMPANY LANDSCAPE
15.1 COMPANY SHARE ANALYSIS: U.S.
16 SWOT ANALYSIS
17 COMPANY PROFILES DISTRIBUTORS
17.1 APERTURE PET & LIFE
17.1.1 COMPANY SNAPSHOT
17.1.2 PRODUCT PORTFOLIO
17.1.3 RECENT DEVELOPMENT
17.2 ARTEMIA INTERNATIONAL LLC
17.2.1 COMPANY SNAPSHOT
17.2.2 PRODUCT PORTFOLIO
17.2.3 RECENT DEVELOPMENT
17.3 FRESH N MARINE
17.3.1 COMPANY SNAPSHOT
17.3.2 PRODUCT PORTFOLIO
17.3.3 RECENT DEVELOPMENT
17.4 INVE AQUACULTURE
17.4.1 COMPANY SNAPSHOT
17.4.2 PRODUCT PORTFOLIO
17.4.3 RECENT DEVELOPMENT
17.5 PENTAIRAES
17.5.1 COMPANY SNAPSHOT
17.5.2 PRODUCT PORTFOLIO
17.5.3 RECENT DEVELOPMENT
17.6 UNIVAR SOLUTIONS LLC
17.6.1 COMPANY SNAPSHOT
17.6.2 PRODUCT PORTFOLIO
17.6.3 RECENT DEVELOPMENTS
18 COMPANY PROFILES MANUFACTURERS
18.1 ADM
18.1.1 COMPANY SNAPSHOTS
18.1.2 REVENUE ANALYSIS
18.1.3 PRODUCT PORTFOLIO
18.1.4 RECENT DEVELOPMENTS
18.2 REED MARICULTURE
18.2.1 COMPANY SNAPSHOT
18.2.2 PRODUCT PORTFOLIO
18.2.3 RECENT DEVELOPMENT
18.3 ALLTECH
18.3.1 COMPANY SNAPSHOT
18.3.2 PRODUCT PORTFOLIO
18.3.3 RECENT DEVELOPMENT
18.4 CORBION
18.4.1 COMPANY SNAPSHOT
18.4.2 REVENUE ANALYSIS
18.4.3 PRODUCT PORTFOLIO
18.4.4 RECENT DEVELOPMENTS
18.5 VERAMARIS
18.5.1 COMPANY SNAPSHOT
18.5.2 PRODUCT PORTFOLIO
18.5.3 RECENT DEVELOPMENTS
18.6 BRINE SHRIMP DIRECT, INC.
18.6.1 COMPANY SNAPSHOT
18.6.2 PRODUCT PORTFOLIO
18.6.3 RECENT DEVELOPMENTS
18.7 FLUVAL
18.7.1 COMPANY SNAPSHOT
18.7.2 PRODUCT PORTFOLIO
18.7.3 RECENT DEVELOPMENT
18.8 HIKARI SALES USA, INC.
18.8.1 COMPANY SNAPSHOT
18.8.2 PRODUCT PORTFOLIO
18.8.3 RECENT DEVELOPMENT
19 QUESTIONNAIRE
20 RELATED REPORTS
List of Table
TABLE 1 PRODUCTION CAPACITY FOR TOP MANUFACTURERS
TABLE 2 KEY INSIGHTS ON RAW MATERIAL SOURCING FOR U.S. ALGAE-BASED AQUAFEED MARKET
TABLE 3 U.S. ALGAE-BASED AQUAFEED MARKET, BY TYPE, 2018-2032 (USD THOUSAND)
TABLE 4 U.S. ALGAE-BASED AQUAFEED MARKET, BY TYPE, 2018-2032 (TONS)
TABLE 5 U.S. ALGAE-BASED AQUAFEED MARKET, BY TYPE, 2018-2032 (USD/KG)
TABLE 6 U.S. MICROALGAE IN ALGAE-BASED AQUAFEED, BY TYPE, 2018-2032 (USD THOUSAND)
TABLE 7 U.S. MICROALGAE IN ALGAE-BASED AQUAFEED, BY TYPE, 2018-2032 (TONS)
TABLE 8 U.S. MICROALGAE IN ALGAE-BASED AQUAFEED, BY TYPE, 2018-2032 (USD/KG)
TABLE 9 U.S. CHLORELLA IN ALGAE-BASED AQUAFEED, BY TYPE, 2018-2032 (USD THOUSAND)
TABLE 10 U.S. CHLORELLA IN ALGAE-BASED AQUAFEED, BY TYPE, 2018-2032 (TONS)
TABLE 11 U.S. CHLORELLA IN ALGAE-BASED AQUAFEED, BY TYPE, 2018-2032 (USD/KG)
TABLE 12 U.S. MACROALGAE IN ALGAE-BASED AQUAFEED, BY TYPE, 2018-2032 (USD THOUSAND)
TABLE 13 U.S. MACROALGAE IN ALGAE-BASED AQUAFEED, BY TYPE, 2018-2032 (TONS)
TABLE 14 U.S. MACROALGAE IN ALGAE-BASED AQUAFEED, BY TYPE, 2018-2032 (USD/KG)
TABLE 15 U.S. RED ALGAE (RHODOPHYTA) IN ALGAE-BASED AQUAFEED, BY TYPE, 2018-2032 (USD THOUSAND)
TABLE 16 U.S. RED ALGAE (RHODOPHYTA) IN ALGAE-BASED AQUAFEED, BY TYPE, 2018-2032 (TONS)
TABLE 17 U.S. RED ALGAE (RHODOPHYTA) IN ALGAE-BASED AQUAFEED, BY TYPE, 2018-2032 (USD/KG)
TABLE 18 U.S. BROWN ALGAE (PHAEOPHYTA) IN ALGAE-BASED AQUAFEED, BY TYPE, 2018-2032 (USD THOUSAND)
TABLE 19 U.S. BROWN ALGAE (PHAEOPHYTA) IN ALGAE-BASED AQUAFEED, BY TYPE, 2018-2032 (TONS)
TABLE 20 U.S. BROWN ALGAE (PHAEOPHYTA) IN ALGAE-BASED AQUAFEED, BY TYPE, 2018-2032 (TONS)
TABLE 21 U.S. GREEN ALGAE (CHLOROPHYTA) IN ALGAE-BASED AQUAFEED MARKET, BY TYPE, 2018-2032 (USD THOUSAND)
TABLE 22 U.S. GREEN ALGAE (CHLOROPHYTA) IN ALGAE-BASED AQUAFEED MARKET, BY TYPE, 2018-2032 (TONS)
TABLE 23 U.S. GREEN ALGAE (CHLOROPHYTA) IN ALGAE-BASED AQUAFEED MARKET, BY TYPE, 2018-2032 (USD/KG)
TABLE 24 U.S. ULVA IN ALGAE-BASED AQUAFEED MARKET, BY TYPE, 2018-2032 (USD THOUSAND)
TABLE 25 U.S. ULVA IN ALGAE-BASED AQUAFEED MARKET, BY TYPE, 2018-2032 (TONS)
TABLE 26 U.S. ULVA IN ALGAE-BASED AQUAFEED MARKET, BY TYPE, 2018-2032 (USD/KG)
TABLE 27 U.S. ALGAE-BASED AQUAFEED MARKET, BY FISH SPECIES, 2018-2032 (USD THOUSAND)
TABLE 28 U.S. ALGAE-BASED AQUAFEED MARKET, BY FISH SPECIES, 2018-2032 (TONS)
TABLE 29 U.S. ALGAE-BASED AQUAFEED MARKET, BY FISH SPECIES, 2018-2032 (USD/KG)
TABLE 30 U.S. MONOCULTURE IN ALGAE-BASED AQUAFEED MARKET, BY SPECIES, 2018-2032 (USD THOUSAND)
TABLE 31 U.S. MONOCULTURE IN ALGAE-BASED AQUAFEED MARKET, BY SPECIES, 2018-2032 (TONS)
TABLE 32 U.S. MONOCULTURE IN ALGAE-BASED AQUAFEED MARKET, BY SPECIES, 2018-2032 (USD/KG)
TABLE 33 U.S. FISHES IN ALGAE-BASED AQUAFEED MARKET, BY TYPE, 2018-2032 (USD THOUSAND)
TABLE 34 U.S. FISHES IN ALGAE-BASED AQUAFEED MARKET, BY TYPE, 2018-2032 (TONS)
TABLE 35 U.S. FISHES IN ALGAE-BASED AQUAFEED MARKET, BY TYPE, 2018-2032 (USD/KG)
TABLE 36 U.S. KOI/CARP IN ALGAE-BASED AQUAFEED MARKET, BY TYPE, 2018-2032 (USD THOUSAND)
TABLE 37 U.S. KOI/CARP IN ALGAE-BASED AQUAFEED MARKET, BY TYPE, 2018-2032 (TONS)
TABLE 38 U.S. KOI/CARP IN ALGAE-BASED AQUAFEED MARKET, BY TYPE, 2018-2032 (USD/KG)
TABLE 39 U.S. MOLLUSKS IN ALGAE-BASED AQUAFEED MARKET, BY TYPE, 2018-2032 (USD THOUSAND)
TABLE 40 U.S. MOLLUSKS IN ALGAE-BASED AQUAFEED MARKET, BY TYPE, 2018-2032 (TONS)
TABLE 41 U.S. MOLLUSKS IN ALGAE-BASED AQUAFEED MARKET, BY TYPE, 2018-2032 (USD/KG)
TABLE 42 U.S. CRUSTACEANS IN ALGAE-BASED AQUAFEED MARKET, BY TYPE, 2018-2032 (USD THOUSAND)
TABLE 43 U.S. CRUSTACEANS IN ALGAE-BASED AQUAFEED MARKET, BY TYPE, 2018-2032 (TONS)
TABLE 44 U.S. CRUSTACEANS IN ALGAE-BASED AQUAFEED MARKET, BY TYPE, 2018-2032 (USD/KG)
TABLE 45 U.S. PRAWNS IN AQUAFEED MARKET, BY TYPE, 2018-2032 (USD THOUSAND)
TABLE 46 U.S. PRAWNS IN AQUAFEED MARKET, BY TYPE, 2018-2032 (TONS)
TABLE 47 U.S. PRAWNS IN ALGAE-BASED AQUAFEED MARKET, BY TYPE, 2018-2032 (USD/KG)
TABLE 48 U.S. ALGAE-BASED AQUAFEED MARKET, BY SOURCE, 2018-2032 (USD THOUSAND)
TABLE 49 U.S. ALGAE-BASED AQUAFEED MARKET, BY SOURCE, 2018-2032 (TONS)
TABLE 50 U.S. ALGAE-BASED AQUAFEED MARKET, BY SOURCE, 2018-2032 (USD/KG)
TABLE 51 U.S. ALGAE-BASED AQUAFEED MARKET, BY FORM, 2018-2032 (USD THOUSAND)
TABLE 52 U.S. ALGAE-BASED AQUAFEED MARKET, BY FORM, 2018-2032 (TONS)
TABLE 53 U.S. ALGAE-BASED AQUAFEED MARKET, BY FORM, 2018-2032 (USD/KG)
TABLE 54 U.S. DRY IN ALGAE-BASED AQUAFEED MARKET, BY FORM, 2018-2032 (USD THOUSAND)
TABLE 55 U.S. DRY IN ALGAE-BASED AQUAFEED MARKET, BY FORM, 2018-2032 (TONS)
TABLE 56 U.S. DRY IN ALGAE-BASED AQUAFEED MARKET, BY FORM, 2018-2032 (USD/KG)
TABLE 57 U.S. ALGAE-BASED AQUAFEED MARKET, BY FEEDING METHOD, 2018-2032 (USD THOUSAND)
TABLE 58 U.S. ALGAE-BASED AQUAFEED MARKET, BY FEEDING METHOD, 2018-2032 (TONS)
TABLE 59 U.S. ALGAE-BASED AQUAFEED MARKET, BY FEEDING METHOD, 2018-2032 (USD/KG)
TABLE 60 U.S. MECHANIZED FEEDING IN ALGAE-BASED AQUAFEED MARKET, BY TYPE, 2018-2032 (USD THOUSAND)
TABLE 61 U.S. MECHANIZED FEEDING IN ALGAE-BASED AQUAFEED MARKET, BY TYPE, 2018-2032 (TONS)
TABLE 62 U.S. MECHANIZED FEEDING IN ALGAE-BASED AQUAFEED MARKET, BY TYPE, 2018-2032 (USD/KG)
TABLE 63 U.S. MOBILE FEEDING EQUIPMENT IN ALGAE-BASED AQUAFEED MARKET, BY TYPE, 2018-2032 (USD THOUSAND)
TABLE 64 U.S. MOBILE FEEDING EQUIPMENT IN ALGAE-BASED AQUAFEED MARKET, BY TYPE, 2018-2032 (TONS)
TABLE 65 U.S. MOBILE FEEDING EQUIPMENT IN ALGAE-BASED AQUAFEED MARKET, BY TYPE, 2018-2032 (USD/KG)
TABLE 66 U.S. STATIONARY FEEDING EQUIPMENT IN ALGAE-BASED AQUAFEED MARKET, BY TYPE, 2018-2032 (USD THOUSAND)
TABLE 67 U.S. STATIONARY FEEDING EQUIPMENT IN ALGAE-BASED AQUAFEED MARKET, BY TYPE, 2018-2032 (TONS)
TABLE 68 U.S. STATIONARY FEEDING EQUIPMENT IN ALGAE-BASED AQUAFEED MARKET, BY TYPE, 2018-2032 (USD/KG)
TABLE 69 U.S. WITH SUPPLIED ENERGY – AUTOMATIC FEEDERS IN ALGAE-BASED AQUAFEED MARKET, BY TYPE, 2018-2032 (USD THOUSAND)
TABLE 70 U.S. WITH SUPPLIED ENERGY – AUTOMATIC FEEDERS IN ALGAE-BASED AQUAFEED MARKET, BY TYPE, 2018-2032 (TONS)
TABLE 71 U.S. WITH SUPPLIED ENERGY – AUTOMATIC FEEDERS IN ALGAE-BASED AQUAFEED MARKET, BY TYPE, 2018-2032 (USD/KG)
TABLE 72 U.S. ALGAE-BASED AQUAFEED MARKET, BY PACKAGING, 2018-2032 (USD THOUSAND)
TABLE 73 U.S. ALGAE-BASED AQUAFEED MARKET, BY PACKAGING, 2018-2032 (TONS)
TABLE 74 U.S. ALGAE-BASED AQUAFEED MARKET, BY PACKAGING, 2018-2032 (USD/KG)
TABLE 75 U.S. BULK PACKAGING IN ALGAE-BASED AQUAFEED MARKET, BY PACKAGING TYPE, 2018-2032 (USD THOUSAND)
TABLE 76 U.S. BULK PACKAGING IN ALGAE-BASED AQUAFEED MARKET, BY PACKAGING TYPE, 2018-2032 (TONS)
TABLE 77 U.S. BULK PACKAGING IN ALGAE-BASED AQUAFEED MARKET, BY PACKAGING TYPE, 2018-2032 (USD/KG
TABLE 78 U.S. RETAIL PACKAGING IN ALGAE-BASED AQUAFEED MARKET, BY PACKAGING TYPE, 2018-2032 (USD THOUSAND)
TABLE 79 U.S. RETAIL PACKAGING IN ALGAE-BASED AQUAFEED MARKET, BY PACKAGING TYPE, 2018-2032 (TONS)
TABLE 80 U.S. RETAIL PACKAGING IN ALGAE-BASED AQUAFEED MARKET, BY PACKAGING TYPE, 2018-2032 (USD/KG)
TABLE 81 U.S. ALGAE-BASED AQUAFEED MARKET, BY DISTRIBUTION CHANNEL, 2018-2032 (USD THOUSAND)
TABLE 82 U.S. ALGAE-BASED AQUAFEED MARKET, BY PACKAGING, 2018-2032 (TONS)
TABLE 83 U.S. ALGAE-BASED AQUAFEED MARKET, BY PACKAGING, 2018-2032 (USD/KG)
TABLE 84 U.S. RETAIL IN ALGAE-BASED AQUAFEED MARKET, BY DISTRIBUTION CHANNEL, 2018-2032 (USD THOUSAND)
TABLE 85 U.S. RETAIL IN ALGAE-BASED AQUAFEED MARKET, BY DISTRIBUTION CHANNEL, 2018-2032 (TONS)
TABLE 86 U.S. RETAIL IN ALGAE-BASED AQUAFEED MARKET, BY DISTRIBUTION CHANNEL, 2018-2032 (USD/KG)
TABLE 87 U.S. STORE BASED IN ALGAE-BASED AQUAFEED MARKET, BY RETAIL, 2018-2032 (USD THOUSAND)
TABLE 88 U.S. STORE BASED IN ALGAE-BASED AQUAFEED MARKET, BY RETAIL, 2018-2032 (TONS)
TABLE 89 U.S. STORE BASED IN ALGAE-BASED AQUAFEED MARKET, BY RETAIL, 2018-2032 (USD/KG)
TABLE 90 U.S. NON-STORE BASED IN ALGAE-BASED AQUAFEED MARKET, BY RETAIL, 2018-2032 (USD THOUSAND)
TABLE 91 U.S. NON-STORE BASED IN ALGAE-BASED AQUAFEED MARKET, BY RETAIL, 2018-2032 (TONS)
TABLE 92 U.S. NON-STORE BASED IN ALGAE-BASED AQUAFEED MARKET, BY RETAIL, 2018-2032 (USD/KG)
List of Figure
FIGURE 1 U.S. ALGAE-BASED AQUAFEED MARKET
FIGURE 2 U.S. ALGAE-BASED AQUAFEED MARKET: DATA TRIANGULATION
FIGURE 3 U.S. ALGAE-BASED AQUAFEED MARKET: DROC ANALYSIS
FIGURE 4 U.S. ALGAE-BASED AQUAFEED MARKET: REGIONAL MARKET ANALYSIS
FIGURE 5 U.S. ALGAE-BASED AQUAFEED MARKET: COMPANY RESEARCH ANALYSIS
FIGURE 6 U.S. ALGAE-BASED AQUAFEED MARKET: MULTIVARIATE MODELLING
FIGURE 7 U.S. ALGAE-BASED AQUAFEED MARKET: INTERVIEW DEMOGRAPHICS
FIGURE 8 U.S. ALGAE-BASED AQUAFEED MARKET: DBMR MARKET POSITION GRID
FIGURE 9 U.S. ALGAE-BASED AQUAFEED MARKET: VENDOR SHARE ANALYSIS
FIGURE 10 U.S. ALGAE-BASED AQUAFEED MARKET: SEGMENTATION
FIGURE 11 EXECUTIVE SUMMARY
FIGURE 12 TWO SEGMENTS COMPRISE THE U.S. ALGAE-BASED AQUAFEED MARKET, BY TYPE (2024)
FIGURE 13 STRATEGIC DECISIONS
FIGURE 14 INCREASING CONSUMER DEMAND FOR HEALTH-CONSCIOUS AND SUSTAINABLE SEAFOOD PRODUCTS IS EXPECTED TO DRIVE THE U.S. ALGAE-BASED AQUAFEED MARKET IN THE FORECAST PERIOD (2025-2032)
FIGURE 15 THE MICROALGAE SEGMENT IS EXPECTED TO ACCOUNT FOR THE LARGEST SHARE OF THE U.S. ALGAE-BASED AQUAFEED MARKET IN 2025 AND 2032
FIGURE 16 VALUE CHAIN OF GLOBAL AND U.S. ALGAE-BASED AQUAFEED MARKET
FIGURE 17 PATENT FAMILIES
FIGURE 18 NUMBER OF INTERNATIONAL PATENT FAMILIES BY PUBLICATION YEAR
FIGURE 19 U.S. ALGAE-BASED AQUAFEED MARKET, 2024-2032, AVERAGE SELLING PRICE (USD/ KG)
FIGURE 20 DROC ANALYSIS
FIGURE 21 U.S. ALGAE-BASED AQUAFEED MARKET: BY TYPE, 2024
FIGURE 22 U.S. ALGAE-BASED AQUAFEED MARKET: BY FISH SPECIES, 2024
FIGURE 23 U.S. ALGAE-BASED AQUAFEED MARKET: BY SOURCE, 2024
FIGURE 24 U.S. ALGAE-BASED AQUAFEED MARKET: BY FORM, 2024
FIGURE 25 U.S. ALGAE-BASED AQUAFEED MARKET: BY FEEDING METHOD, 2024
FIGURE 26 U.S. ALGAE-BASED AQUAFEED MARKET: BY PACKAGING, 2024
FIGURE 27 U.S. ALGAE-BASED AQUAFEED MARKET: BY DISTRIBUTION CHANNEL, 2024
FIGURE 28 U.S. ALGAE-BASED AQUAFEED MARKET: COMPANY SHARE 2024 (%)
Global And Us Algae Based Aquafeed Market, Supply Chain Analysis and Ecosystem Framework
To support market growth and help clients navigate the impact of geopolitical shifts, DBMR has integrated in-depth supply chain analysis into its Global And Us Algae Based Aquafeed Market research reports. This addition empowers clients to respond effectively to global changes affecting their industries. The supply chain analysis section includes detailed insights such as Global And Us Algae Based Aquafeed Market consumption and production by country, price trend analysis, the impact of tariffs and geopolitical developments, and import and export trends by country and HSN code. It also highlights major suppliers with data on production capacity and company profiles, as well as key importers and exporters. In addition to research, DBMR offers specialized supply chain consulting services backed by over a decade of experience, providing solutions like supplier discovery, supplier risk assessment, price trend analysis, impact evaluation of inflation and trade route changes, and comprehensive market trend analysis.
Data collection and base year analysis are done using data collection modules with large sample sizes. The stage includes obtaining market information or related data through various sources and strategies. It includes examining and planning all the data acquired from the past in advance. It likewise envelops the examination of information inconsistencies seen across different information sources. The market data is analysed and estimated using market statistical and coherent models. Also, market share analysis and key trend analysis are the major success factors in the market report. To know more, please request an analyst call or drop down your inquiry.
The key research methodology used by DBMR research team is data triangulation which involves data mining, analysis of the impact of data variables on the market and primary (industry expert) validation. Data models include Vendor Positioning Grid, Market Time Line Analysis, Market Overview and Guide, Company Positioning Grid, Patent Analysis, Pricing Analysis, Company Market Share Analysis, Standards of Measurement, Global versus Regional and Vendor Share Analysis. To know more about the research methodology, drop in an inquiry to speak to our industry experts.
Data Bridge Market Research is a leader in advanced formative research. We take pride in servicing our existing and new customers with data and analysis that match and suits their goal. The report can be customized to include price trend analysis of target brands understanding the market for additional countries (ask for the list of countries), clinical trial results data, literature review, refurbished market and product base analysis. Market analysis of target competitors can be analyzed from technology-based analysis to market portfolio strategies. We can add as many competitors that you require data about in the format and data style you are looking for. Our team of analysts can also provide you data in crude raw excel files pivot tables (Fact book) or can assist you in creating presentations from the data sets available in the report.


