
Global Application Performance Monitoring Market
Market Size in USD Billion
 USD
9.04 Billion
USD
21.30 Billion
2024
2032
USD
9.04 Billion
USD
21.30 Billion
2024
2032
| 2025 - 2032 | |
| USD 9.04 Billion | |
| USD 21.30 Billion | |
| % | |
|
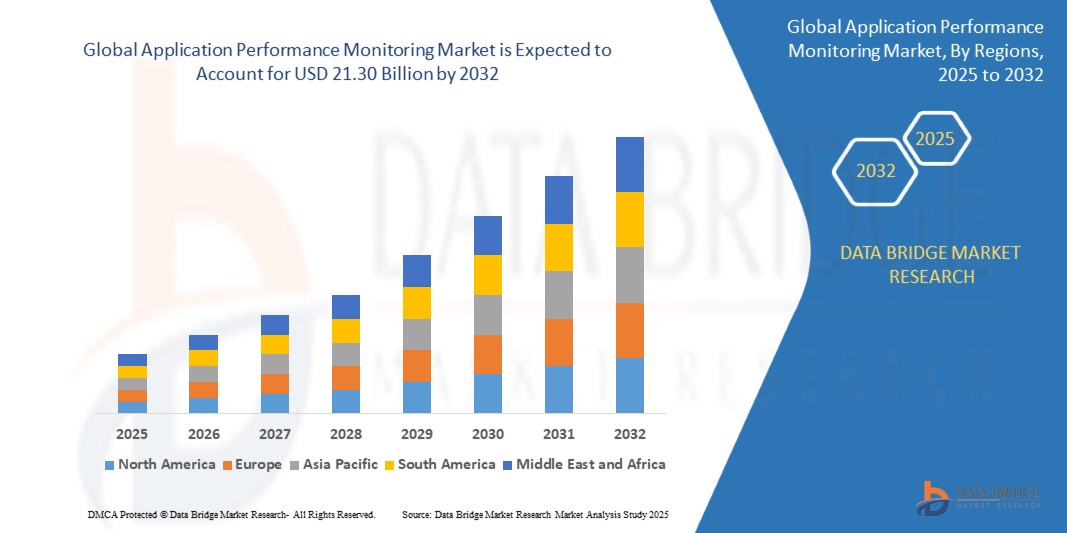
Application Performance Monitoring Market Size
- The global application performance monitoring market was valued at USD 9.04 billion in 2024 and is expected to reach USD 21.30 billion by 2032
- During the forecast period of 2025 to 2032 the market is likely to grow at a CAGR of 11.31%, primarily driven by rising integration of artificial intelligence and machine learning
- This growth is driven by factors such as automated anomaly detection, predictive analytics, user experience optimization, and security and compliance
Application Performance Monitoring Market Analysis
- Application Performance Monitoring (APM) refers to the process of tracking application performance, availability, and user experience by identifying bottlenecks, diagnosing issues, and ensuring seamless functionality across IT environments
- The market growth is significantly driven by increasing cloud adoption, rising IT infrastructure complexity, and the growing demand for real-time performance monitoring. As businesses continue to embrace digital transformation, there is a heightened need for APM solutions to ensure seamless application functionality and operational efficiency
- In addition, the integration of artificial intelligence (AI) and machine learning (ML) is reshaping the APM landscape. AI-powered solutions enable predictive analytics, automated issue detection, and proactive troubleshooting, enhancing system reliability and performance
- For instance, Dynatrace has incorporated AI-driven monitoring capabilities into its APM solutions, allowing businesses to leverage automation for faster issue resolution and performance optimization
- The application performance monitoring market is poised for sustained growth, driven by continuous advancements in AI and cloud computing. Increasing demand for real-time analytics, enhanced user experience, and efficient IT operations will further propel market expansion, with businesses prioritizing performance optimization to maintain competitiveness
Report Scope and Application Performance Monitoring Market Segmentation
|
Attributes |
Application Performance Monitoring Key Market Insights |
|
Segments Covered |
|
|
Countries Covered |
North America
Europe
Asia-Pacific
Middle East and Africa
South America
|
|
Key Market Players |
|
|
Market Opportunities |
|
|
Value Added Data Infosets |
In addition to the market insights such as market value, growth rate, market segments, geographical coverage, market players, and market scenario, the market report curated by the Data Bridge Market Research team includes in-depth expert analysis, import/export analysis, pricing analysis, production consumption analysis, and pestle analysis. |
Application Performance Monitoring Market Trends
“Increasing Adoption of Cloud and Mobile Computing”
- One prominent trend in the global ophthalmic operational microscope market is the increasing adoption of cloud and mobile computing
- This trend is driven by the widespread migration of enterprises to cloud environments and the growing reliance on mobile applications for business operations and customer engagement
- For instance, Microsoft Azure and AWS have expanded their APM capabilities to support cloud-native and mobile-first applications, enabling businesses to monitor performance across distributed systems
- As organizations prioritize seamless digital experiences, APM solutions are evolving to provide real-time insights, optimize cloud resources, and enhance mobile application performance
- This shift is expected to drive continuous innovation in APM technologies, ensuring businesses can maintain reliability, scalability, and efficiency in dynamic IT ecosystems
Application Performance Monitoring Market Dynamics
Driver
“Rising Adoption of Cloud and Mobile Computing”
- The increasing reliance on cloud computing and mobile applications is a key driver of growth in the Application Performance Monitoring (APM) market. As businesses transition from traditional IT infrastructure to cloud-based environments, the need for efficient performance monitoring has become more critical than ever
- This shift is particularly evident in industries such as e-commerce, finance, and healthcare, where digital transformation is accelerating the adoption of cloud-native applications and mobile platforms
- With businesses operating in multi-cloud and hybrid environments, the complexity of application performance management has increased. Organizations are now investing in APM solutions to monitor cloud-based workloads, ensure seamless integrations, and optimize performance across distributed networks
- The growing mobile-first approach among enterprises further fuels demand for APM tools. With the rise in mobile applications, businesses require robust monitoring solutions to track app performance, detect latency issues, and deliver a seamless user experience across various devices and networks
- As businesses continue to embrace cloud-based operations and mobile-driven strategies, the demand for APM solutions will remain strong
For instance,
- In the financial sector, major banks and fintech companies utilize APM solutions to ensure uninterrupted mobile banking services. Leading financial institutions, such as JPMorgan Chase and PayPal, leverage real-time monitoring tools to enhance transaction speeds and detect performance bottlenecks in their mobile applications
- In the e-commerce industry, companies such as Shopify and Amazon employ APM solutions to manage cloud-hosted applications, ensuring fast load times and seamless shopping experiences, particularly during high-traffic sales events such as Black Friday and Cyber Monday
- With increasing investments in digital transformation and infrastructure modernization, APM will play a crucial role in optimizing application performance, reducing downtime, and enhancing user satisfaction, driving sustained market growth
Opportunity
“Increasing Regulatory Compliance Requirements”
- The rising complexity of regulatory frameworks across industries presents a significant opportunity for the Application Performance Monitoring (APM) market. Organizations must comply with stringent regulations related to data security, privacy, and operational transparency, driving the demand for robust APM solutions
- Regulations such as the General Data Protection Regulation (GDPR) in Europe, the California Consumer Privacy Act (CCPA) in the U.S., and financial sector requirements such as SOX (Sarbanes-Oxley Act) and PCI-DSS (Payment Card Industry Data Security Standard) mandate strict monitoring and reporting of IT system performance
- Enterprises increasingly adopt APM solutions to ensure regulatory compliance by tracking system performance, identifying security vulnerabilities, and maintaining audit logs. These solutions help prevent non-compliance penalties, data breaches, and service disruptions
For instance,
- Financial institutions use APM tools to comply with Basel III regulations by ensuring seamless transaction monitoring and fraud detection. Real-time performance tracking minimizes downtime and meets financial reporting standards
- Hospitals and healthcare providers utilize APM solutions to comply with Health Insurance Portability and Accountability Act (HIPAA) requirements by ensuring uninterrupted access to electronic health records (EHRs) and protecting patient data integrity
- As regulatory scrutiny intensifies worldwide, the demand for APM solutions will continue to grow, positioning them as essential tools for organizations to maintain compliance, mitigate risks, and enhance operational reliability
Restraint/Challenge
“High Implementation Costs”
- The high implementation costs of Application Performance Monitoring (APM) solutions pose a significant challenge for organizations, particularly small and medium-sized enterprises (SMEs). The expenses associated with licensing, infrastructure upgrades, integration with existing IT systems, and ongoing maintenance can be substantial, creating financial barriers to adoption
- In addition to initial costs, companies must invest in training IT staff, customization, and scalability to ensure effective deployment. Enterprises with complex, multi-cloud environments often require advanced APM solutions, which come at a premium price and add to the total cost of ownership
- Industries such as healthcare, finance, and e-commerce, where real-time monitoring is crucial, face the challenge of balancing APM investment with budget constraints. Organizations operating with legacy systems may also incur higher integration costs when transitioning to modern monitoring solutions
For instance,
- A mid-sized e-commerce company aiming to implement APM for better user experience and website performance faces high initial costs due to the need for real-time analytics, cloud integration, and AI-driven monitoring. The financial burden may delay adoption, impacting overall operational efficiency
- Consequently, high implementation costs create financial barriers, limit adoption among small and mid-sized enterprises, and impact budget allocations for IT infrastructure. To sustain growth, industry players must offer flexible pricing models, invest in cost-effective innovations, and enhance value propositions to ensure wider accessibility and long-term market expansion
Application Performance Monitoring Market Scope
The market is segmented on the basis of deployment type, access type, end-user, and solution type.
|
Segmentation |
Sub-Segmentation |
|
By Deployment Type |
|
|
By Access Type |
|
|
By End-User |
|
|
By Solution Type
|
|
Application Performance Monitoring Market Regional Analysis
“North America is the Dominant Region in the Application Performance Monitoring Market”
- North America dominates the application performance monitoring market, driven by the presence of leading global players, particularly in the U.S. and Canada, which drive innovation and technological advancements in the sector
- The U.S. holds a significant share due to country’s widespread adoption of cloud computing, SaaS applications, and mobile technologies
- The region’s strong IT infrastructure, high adoption rates of cloud and mobile computing, and increasing competition among enterprises further contribute to its leadership position
- In addition, the growing reliance on advanced analytics and artificial intelligence for real-time performance tracking reinforces North America's market leadership
“Asia-Pacific is Projected to Register the Highest Growth Rate”
- The Asia-Pacific region is expected to witness the highest growth rate in the application performance monitoring market, driven by the increasing regulatory compliance requirements and the rising adoption of advanced monitoring solutions to optimize application performance across industries
- The rapid digital transformation in countries such as China, India, and Japan has led to a surge in demand for sophisticated performance management tools that ensure seamless application operation and mitigate downtime risks
- In addition, the expansion of e-commerce, fintech, and cloud-based enterprises in the region has amplified the need for efficient application performance monitoring solutions
- As organizations prioritize real-time performance tracking, security, and compliance with evolving regulations, the Asia-Pacific market presents significant growth opportunities for vendors offering comprehensive and scalable monitoring solutions tailored to the region’s dynamic business landscape
Application Performance Monitoring Market Share
The market competitive landscape provides details by competitor. Details included are company overview, company financials, revenue generated, market potential, investment in research and development, new market initiatives, global presence, production sites and facilities, production capacities, company strengths and weaknesses, product launch, product width and breadth, application dominance. The above data points provided are only related to the companies' focus related to market.
The Major Market Leaders Operating in the Market Are:
- Splunk LLC (U.S.)
- BMC Software, Inc. (U.S.)
- Dynatrace LLC (U.S.)
- Hewlett Packard Enterprise Development LP (U.S.)
- IBM (U.S.)
- Zoho Corporation Pvt. Ltd. (India)
- Microsoft (U.S.)
- New Relic, Inc (U.S.)
- meshIQ. (U.S.)
- Oracle (U.S.)
- Quest Software Inc. (U.S.)
- Riverbed Technology (U.S.)
- SolarWinds Worldwide, LLC (U.S.)
- Paessler GmbH (Germany)
Latest Developments in Global Application Performance Monitoring Market
- In May 2023, New Relic launches Grok, an AI observability assistant powered by a big language model. It assists engineers in various tasks using natural language, enhancing instrumentation setup, reporting, and account management for the DevOps and DevSecOps movements
- In April 2023, Dynatrace Application Security receives FedRAMP and StateRAMP authorizations, enabling secure cloud transformation for public sector customers. Government agencies and educational institutions can now utilize Dynatrace's platform for intelligent observability, DevSecOps automation, and continuous vulnerability identification and protection
SKU-

- Interactive Data Analysis Dashboard
- Company Analysis Dashboard for high growth potential opportunities
- Research Analyst Access for customization & queries
- Competitor Analysis with Interactive dashboard
- Latest News, Updates & Trend analysis
- Harness the Power of Benchmark Analysis for Comprehensive Competitor Tracking
Table of Content
1 INTRODUCTION
1.1 OBJECTIVES OF THE STUDY
1.2 MARKET DEFINITION
1.3 OVERVIEW OF GLOBAL APPLICATION PERFORMANCE MONITORING MARKET
1.4 CURRENCY AND PRICING
1.5 LIMITATION
1.6 MARKETS COVERED
2 MARKET SEGMENTATION
2.1 KEY TAKEAWAYS
2.2 ARRIVING AT THE GLOBAL APPLICATION PERFORMANCE MONITORING MARKET
2.2.1 VENDOR POSITIONING GRID
2.2.2 TECHNOLOGY LIFE LINE CURVE
2.2.3 MARKET GUIDE
2.2.4 COMAPANY MARKET SHARE ANALYSIS
2.2.5 MULTIVARIATE MODELLING
2.2.6 TOP TO BOTTOM ANALYSIS
2.2.7 STANDARDS OF MEASUREMENT
2.2.8 VENDOR SHARE ANALYSIS
2.2.9 DATA POINTS FROM KEY PRIMARY INTERVIEWS
2.2.10 DATA POINTS FROM KEY SECONDARY DATABASES
2.3 GLOBAL APPLICATION PERFORMANCE MONITORING MARKET: RESEARCH SNAPSHOT
2.4 ASSUMPTIONS
3 MARKET OVERVIEW
3.1 DRIVERS
3.2 RESTRAINTS
3.3 OPPORTUNITIES
3.4 CHALLENGES
4 EXECUTIVE SUMMARY
5 PREMIUM INSIGHT
5.1 PORTERS FIVE FORCES
5.2 REGULATORY STANDARDS
5.3 TECHNOLOGICAL TRENDS
5.4 PATENT ANALYSIS
5.5 CASE STUDY
5.6 VALUE CHAIN ANALYSIS
5.7 COMPANY COMPARITIVE ANALYSIS
5.8 PRICING ANALYSIS
6 GLOBAL APPLICATION PERFORMANCE MONITORING MARKET, BY OFFERING
6.1 OVERVIEW
6.2 SOLUTIONS
6.2.1 REAL USER MONITORING
6.2.2 NETWORK, PROCESS, AND HOST MONITORING
6.2.3 ROOT CAUSE ANALYSIS
6.2.4 MOBILE APP MONITORING
6.2.5 DIAGNOSTICS
6.2.6 OTHERS
6.3 SERVICES
6.3.1 PROFESSIONAL SERVICES
6.3.1.1. DEPLOYMENT AND INTEGRATION
6.3.1.2. TRAINING AND EDUCATION
6.3.1.3. SUPPORT AND MAINTENANCE
6.3.2 MANAGED SERVICES
7 GLOBAL APPLICATION PERFORMANCE MONITORING MARKET, BY ORGANIZATION SIZE
7.1 OVERVIEW
7.2 SMALL & MEDIUM SIZE ENTERPRISE
7.3 LARGE SIZE ENTERPRISE
8 GLOBAL APPLICATION PERFORMANCE MONITORING MARKET, BY DEPLOYMENT MODE
8.1 OVERVIEW
8.2 ON-PREMISE
8.2.1 BY ORGANIZATION SIZE
8.2.1.1. SMALL & MEDIUM SIZE ENTERPRISE
8.2.1.2. LARGE SIZE ENTERPRISE
8.3 CLOUD
8.3.1 BY TYPE
8.3.1.1. HYBRID
8.3.1.2. PUBLIC
8.3.1.3. PRIVATE
8.3.2 BY ORGANIZATION SIZE
8.3.2.1. SMALL & MEDIUM SIZE ENTERPRISE
8.3.2.2. LARGE SIZE ENTERPRISE
9 GLOBAL APPLICATION PERFORMANCE MONITORING MARKET, BY PLATFORM TYPE
9.1 OVERVIEW
9.2 MOBILE BASED
9.2.1 BY OPERATING SYSTEM
9.2.1.1. ANDROID
9.2.1.2. IPHONE
9.2.1.3. IPAD
9.3 WEB-BASED
9.3.1 BY OPERATING SYSTEM
9.3.1.1. WINDOWS
9.3.1.2. LINUX
9.3.1.3. MAC
10 GLOBAL APPLICATION PERFORMANCE MONITORING MARKET, BY MONITORING TYPE
10.1 OVERVIEW
10.2 FULL STACK MONITORING
10.3 INFRASTRUCTURE MONITORING
10.4 LOG MONITORING
10.5 CLOUD MONITORING
10.6 SYNTHETIC MONITORING
10.7 END-USER MONITORING
10.8 SERVICE LEVEL AGREEMENTS (SLAS) MONITORING
10.9 IOT MONITORING
10.1 DATABASE MONITORING
10.11 NETWORK MONITORING
11 GLOBAL APPLICATION PERFORMANCE MONITORING MARKET, BY USE CASES
11.1 OVERVIEW
11.2 REAL USER MONITORING
11.3 ANALYTICS
11.4 REPORTING
11.5 DIAGNOSTICS
11.6 DIGITAL EXPERIENCE MONITORING (DEM)
11.7 OTHERS
12 GLOBAL APPLICATION PERFORMANCE MONITORING MARKET, BY END USER
12.1 OVERVIEW
12.2 BFSI
12.2.1 BY OFFERING
12.2.1.1. SOLUTIONS
12.2.1.1.1. REAL USER MONITORING
12.2.1.1.2. NETWORK, PROCESS, AND HOST MONITORING
12.2.1.1.3. ROOT CAUSE ANALYSIS
12.2.1.1.4. MOBILE APP MONITORING
12.2.1.1.5. DIAGNOSTICS
12.2.1.1.6. OTHERS
12.2.1.2. SERVICES
12.2.1.2.1. PROFESSIONAL SERVICES
12.2.1.2.2. MANAGED SERVICES
12.3 RETAIL & E-COMMERCE
12.3.1 BY OFFERING
12.3.1.1. SOLUTIONS
12.3.1.1.1. REAL USER MONITORING
12.3.1.1.2. NETWORK, PROCESS, AND HOST MONITORING
12.3.1.1.3. ROOT CAUSE ANALYSIS
12.3.1.1.4. MOBILE APP MONITORING
12.3.1.1.5. DIAGNOSTICS
12.3.1.1.6. OTHERS
12.3.1.2. SERVICES
12.3.1.2.1. PROFESSIONAL SERVICES
12.3.1.2.2. MANAGED SERVICES
12.4 MANUFACTURING
12.4.1 BY OFFERING
12.4.1.1. SOLUTIONS
12.4.1.1.1. REAL USER MONITORING
12.4.1.1.2. NETWORK, PROCESS, AND HOST MONITORING
12.4.1.1.3. ROOT CAUSE ANALYSIS
12.4.1.1.4. MOBILE APP MONITORING
12.4.1.1.5. DIAGNOSTICS
12.4.1.1.6. OTHERS
12.4.1.2. SERVICES
12.4.1.2.1. PROFESSIONAL SERVICES
12.4.1.2.2. MANAGED SERVICES
12.5 HEALTHCARE
12.5.1 BY OFFERING
12.5.1.1. SOLUTIONS
12.5.1.1.1. REAL USER MONITORING
12.5.1.1.2. NETWORK, PROCESS, AND HOST MONITORING
12.5.1.1.3. ROOT CAUSE ANALYSIS
12.5.1.1.4. MOBILE APP MONITORING
12.5.1.1.5. DIAGNOSTICS
12.5.1.1.6. OTHERS
12.5.1.2. SERVICES
12.5.1.2.1. PROFESSIONAL SERVICES
12.5.1.2.2. MANAGED SERVICES
12.6 IT & TELECOM
12.6.1 BY OFFERING
12.6.1.1. SOLUTIONS
12.6.1.1.1. REAL USER MONITORING
12.6.1.1.2. NETWORK, PROCESS, AND HOST MONITORING
12.6.1.1.3. ROOT CAUSE ANALYSIS
12.6.1.1.4. MOBILE APP MONITORING
12.6.1.1.5. DIAGNOSTICS
12.6.1.1.6. OTHERS
12.6.1.2. SERVICES
12.6.1.2.1. PROFESSIONAL SERVICES
12.6.1.2.2. MANAGED SERVICES
12.7 GOVERNMENT
12.7.1 BY OFFERING
12.7.1.1. SOLUTIONS
12.7.1.1.1. REAL USER MONITORING
12.7.1.1.2. NETWORK, PROCESS, AND HOST MONITORING
12.7.1.1.3. ROOT CAUSE ANALYSIS
12.7.1.1.4. MOBILE APP MONITORING
12.7.1.1.5. DIAGNOSTICS
12.7.1.1.6. OTHERS
12.7.1.2. SERVICES
12.7.1.2.1. PROFESSIONAL SERVICES
12.7.1.2.2. MANAGED SERVICES
12.8 MEDIA & ENTERTAINMENT
12.8.1 BY OFFERING
12.8.1.1. SOLUTIONS
12.8.1.1.1. REAL USER MONITORING
12.8.1.1.2. NETWORK, PROCESS, AND HOST MONITORING
12.8.1.1.3. ROOT CAUSE ANALYSIS
12.8.1.1.4. MOBILE APP MONITORING
12.8.1.1.5. DIAGNOSTICS
12.8.1.1.6. OTHERS
12.8.1.2. SERVICES
12.8.1.2.1. PROFESSIONAL SERVICES
12.8.1.2.2. MANAGED SERVICES
12.9 TRANSPORTATION & LOGISTICS
12.9.1 BY OFFERING
12.9.1.1. SOLUTIONS
12.9.1.1.1. REAL USER MONITORING
12.9.1.1.2. NETWORK, PROCESS, AND HOST MONITORING
12.9.1.1.3. ROOT CAUSE ANALYSIS
12.9.1.1.4. MOBILE APP MONITORING
12.9.1.1.5. DIAGNOSTICS
12.9.1.1.6. OTHERS
12.9.1.2. SERVICES
12.9.1.2.1. PROFESSIONAL SERVICES
12.9.1.2.2. MANAGED SERVICES
12.1 EDUCATION
12.10.1 BY OFFERING
12.10.1.1. SOLUTIONS
12.10.1.1.1. REAL USER MONITORING
12.10.1.1.2. NETWORK, PROCESS, AND HOST MONITORING
12.10.1.1.3. ROOT CAUSE ANALYSIS
12.10.1.1.4. MOBILE APP MONITORING
12.10.1.1.5. DIAGNOSTICS
12.10.1.1.6. OTHERS
12.10.1.2. SERVICES
12.10.1.2.1. PROFESSIONAL SERVICES
12.10.1.2.2. MANAGED SERVICES
12.11 OTHERS
13 GLOBAL APPLICATION PERFORMANCE MONITORING MARKET, BY GEOGRAPHY
GLOBAL APPLICATION PERFORMANCE MONITORING MARKET, (ALL SEGMENTATION PROVIDED ABOVE IS REPRESENTED IN THIS CHAPTER BY COUNTRY)
13.1 NORTH AMERICA
13.1.1 U.S.
13.1.2 CANADA
13.1.3 MEXICO
13.2 EUROPE
13.2.1 GERMANY
13.2.2 FRANCE
13.2.3 U.K.
13.2.4 ITALY
13.2.5 SPAIN
13.2.6 RUSSIA
13.2.7 TURKEY
13.2.8 BELGIUM
13.2.9 NETHERLANDS
13.2.10 NORWAY
13.2.11 FINLAND
13.2.12 SWITZERLAND
13.2.13 DENMARK
13.2.14 SWEDEN
13.2.15 POLAND
13.2.16 REST OF EUROPE
13.3 ASIA PACIFIC
13.3.1 JAPAN
13.3.2 CHINA
13.3.3 SOUTH KOREA
13.3.4 INDIA
13.3.5 AUSTRALIA
13.3.6 NEW ZEALAND
13.3.7 SINGAPORE
13.3.8 THAILAND
13.3.9 MALAYSIA
13.3.10 INDONESIA
13.3.11 PHILIPPINES
13.3.12 TAIWAN
13.3.13 VIETNAM
13.3.14 REST OF ASIA PACIFIC
13.4 SOUTH AMERICA
13.4.1 BRAZIL
13.4.2 ARGENTINA
13.4.3 REST OF SOUTH AMERICA
13.5 MIDDLE EAST AND AFRICA
13.5.1 SOUTH AFRICA
13.5.2 EGYPT
13.5.3 SAUDI ARABIA
13.5.4 U.A.E
13.5.5 OMAN
13.5.6 BAHRAIN
13.5.7 ISRAEL
13.5.8 KUWAIT
13.5.9 QATAR
13.5.10 REST OF MIDDLE EAST AND AFRICA
13.6 KEY PRIMARY INSIGHTS: BY MAJOR COUNTRIES
14 GLOBAL APPLICATION PERFORMANCE MONITORING MARKET,COMPANY LANDSCAPE
14.1 COMPANY SHARE ANALYSIS: GLOBAL
14.2 COMPANY SHARE ANALYSIS: NORTH AMERICA
14.3 COMPANY SHARE ANALYSIS: EUROPE
14.4 COMPANY SHARE ANALYSIS: ASIA PACIFIC
14.5 MERGERS & ACQUISITIONS
14.6 NEW PRODUCT DEVELOPMENT AND APPROVALS
14.7 EXPANSIONS
14.8 REGULATORY CHANGES
14.9 PARTNERSHIP AND OTHER STRATEGIC DEVELOPMENTS
15 GLOBAL APPLICATION PERFORMANCE MONITORING MARKET, SWOT & DBMR ANALYSIS
16 GLOBAL APPLICATION PERFORMANCE MONITORING MARKET, COMPANY PROFILE
16.1 GOOGLE
16.1.1 COMPANY SNAPSHOT
16.1.2 REVENUE ANALYSIS
16.1.3 PRODUCT PORTFOLIO
16.1.4 RECENT DEVELOPMENT
16.2 MICROSOFT
16.2.1 COMPANY SNAPSHOT
16.2.2 REVENUE ANALYSIS
16.2.3 PRODUCT PORTFOLIO
16.2.4 RECENT DEVELOPMENT
16.3 AMAZON WEB SERVICES, INC
16.3.1 COMPANY SNAPSHOT
16.3.2 REVENUE ANALYSIS
16.3.3 PRODUCT PORTFOLIO
16.3.4 RECENT DEVELOPMENT
16.4 DYNATRACE LLC (ALLIANCE WITH INFOSYS LIMITED)
16.4.1 COMPANY SNAPSHOT
16.4.2 REVENUE ANALYSIS
16.4.3 PRODUCT PORTFOLIO
16.4.4 RECENT DEVELOPMENT
16.5 IBM
16.5.1 COMPANY SNAPSHOT
16.5.2 REVENUE ANALYSIS
16.5.3 PRODUCT PORTFOLIO
16.5.4 RECENT DEVELOPMENT
16.6 DATADOG
16.6.1 COMPANY SNAPSHOT
16.6.2 REVENUE ANALYSIS
16.6.3 PRODUCT PORTFOLIO
16.6.4 RECENT DEVELOPMENT
16.7 APPDYNAMICS(A PART OF CISCO SYSTEMS, INC.)
16.7.1 COMPANY SNAPSHOT
16.7.2 REVENUE ANALYSIS
16.7.3 PRODUCT PORTFOLIO
16.7.4 RECENT DEVELOPMENT
16.8 ORACLE
16.8.1 COMPANY SNAPSHOT
16.8.2 REVENUE ANALYSIS
16.8.3 PRODUCT PORTFOLIO
16.8.4 RECENT DEVELOPMENT
16.9 NEW RELIC, INC.
16.9.1 COMPANY SNAPSHOT
16.9.2 REVENUE ANALYSIS
16.9.3 PRODUCT PORTFOLIO
16.9.4 RECENT DEVELOPMENT
16.1 SUMO LOGIC
16.10.1 COMPANY SNAPSHOT
16.10.2 REVENUE ANALYSIS
16.10.3 PRODUCT PORTFOLIO
16.10.4 RECENT DEVELOPMENT
16.11 SERVICENOW
16.11.1 COMPANY SNAPSHOT
16.11.2 REVENUE ANALYSIS
16.11.3 PRODUCT PORTFOLIO
16.11.4 RECENT DEVELOPMENT
16.12 ZOHO CORPORATION
16.12.1 COMPANY SNAPSHOT
16.12.2 REVENUE ANALYSIS
16.12.3 PRODUCT PORTFOLIO
16.12.4 RECENT DEVELOPMENT
16.13 SEMATEXT GROUP
16.13.1 COMPANY SNAPSHOT
16.13.2 REVENUE ANALYSIS
16.13.3 PRODUCT PORTFOLIO
16.13.4 RECENT DEVELOPMENT
16.14 RADWARE
16.14.1 COMPANY SNAPSHOT
16.14.2 REVENUE ANALYSIS
16.14.3 PRODUCT PORTFOLIO
16.14.4 RECENT DEVELOPMENT
16.15 OPEN TEXT
16.15.1 COMPANY SNAPSHOT
16.15.2 REVENUE ANALYSIS
16.15.3 PRODUCT PORTFOLIO
16.15.4 RECENT DEVELOPMENT
16.16 ELASTICSEARCH B.V
16.16.1 COMPANY SNAPSHOT
16.16.2 REVENUE ANALYSIS
16.16.3 PRODUCT PORTFOLIO
16.16.4 RECENT DEVELOPMENT
16.17 EG INNOVATIONS
16.17.1 COMPANY SNAPSHOT
16.17.2 REVENUE ANALYSIS
16.17.3 PRODUCT PORTFOLIO
16.17.4 RECENT DEVELOPMENT
16.18 RIVERBED TECHNOLOGY
16.18.1 COMPANY SNAPSHOT
16.18.2 REVENUE ANALYSIS
16.18.3 PRODUCT PORTFOLIO
16.18.4 RECENT DEVELOPMENT
16.19 MIDDLEWARE LAB, INC.
16.19.1 COMPANY SNAPSHOT
16.19.2 REVENUE ANALYSIS
16.19.3 PRODUCT PORTFOLIO
16.19.4 RECENT DEVELOPMENT
16.2 BROADCOM(A PART OF AVAGO TECHNOLOGIES LIMITED)
16.20.1 COMPANY SNAPSHOT
16.20.2 REVENUE ANALYSIS
16.20.3 PRODUCT PORTFOLIO
16.20.4 RECENT DEVELOPMENT
16.21 OPSRAMP, INC(A PART OF HEWLETT PACKARD ENTERPRISE COMPANY)
16.21.1 COMPANY SNAPSHOT
16.21.2 REVENUE ANALYSIS
16.21.3 PRODUCT PORTFOLIO
16.21.4 RECENT DEVELOPMENT
16.22 PROGRESS SOFTWARE CORPORATION
16.22.1 COMPANY SNAPSHOT
16.22.2 REVENUE ANALYSIS
16.22.3 PRODUCT PORTFOLIO
16.22.4 RECENT DEVELOPMENT
NOTE: THE COMPANIES PROFILED IS NOT EXHAUSTIVE LIST AND IS AS PER OUR PREVIOUS CLIENT REQUIREMENT. WE PROFILE MORE THAN 100 COMPANIES IN OUR STUDY AND HENCE THE LIST OF COMPANIES CAN BE MODIFIED OR REPLACED ON REQUEST
17 CONCLUSION
18 QUESTIONNAIRE
19 RELATED REPORTS
20 ABOUT DATA BRIDGE MARKET RESEARCH
Data collection and base year analysis are done using data collection modules with large sample sizes. The stage includes obtaining market information or related data through various sources and strategies. It includes examining and planning all the data acquired from the past in advance. It likewise envelops the examination of information inconsistencies seen across different information sources. The market data is analysed and estimated using market statistical and coherent models. Also, market share analysis and key trend analysis are the major success factors in the market report. To know more, please request an analyst call or drop down your inquiry.
The key research methodology used by DBMR research team is data triangulation which involves data mining, analysis of the impact of data variables on the market and primary (industry expert) validation. Data models include Vendor Positioning Grid, Market Time Line Analysis, Market Overview and Guide, Company Positioning Grid, Patent Analysis, Pricing Analysis, Company Market Share Analysis, Standards of Measurement, Global versus Regional and Vendor Share Analysis. To know more about the research methodology, drop in an inquiry to speak to our industry experts.
Data Bridge Market Research is a leader in advanced formative research. We take pride in servicing our existing and new customers with data and analysis that match and suits their goal. The report can be customized to include price trend analysis of target brands understanding the market for additional countries (ask for the list of countries), clinical trial results data, literature review, refurbished market and product base analysis. Market analysis of target competitors can be analyzed from technology-based analysis to market portfolio strategies. We can add as many competitors that you require data about in the format and data style you are looking for. Our team of analysts can also provide you data in crude raw excel files pivot tables (Fact book) or can assist you in creating presentations from the data sets available in the report.


