
Global Artificial Lift Systems Market
Market Size in USD Billion
 USD
14.55 Billion
USD
27.73 Billion
2025
2033
USD
14.55 Billion
USD
27.73 Billion
2025
2033
| 2026 - 2033 | |
| USD 14.55 Billion | |
| USD 27.73 Billion | |
| % | |
|
Artificial Lift Systems Market Overview
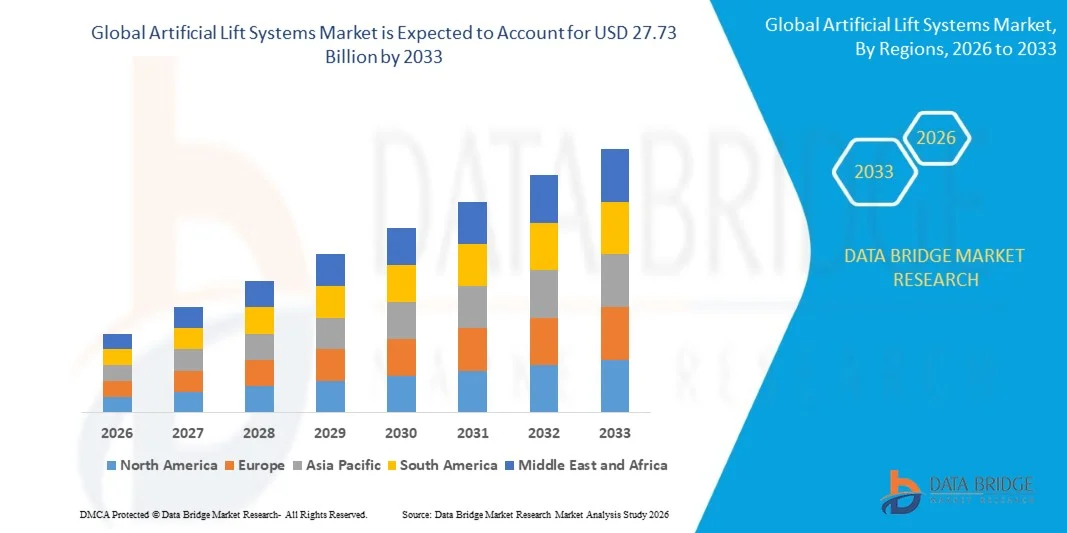
The Artificial Lift Systems Market was valued at USD 14.55 Billion in 2025 and is projected to reach USD 27.73 Billion by 2033, growing at a CAGR of 8.40% from 2026 to 2033. The market is experiencing consistent growth driven by increasing production from mature oilfields, rising demand for enhanced oil recovery techniques, and growing investments in upstream oil and gas activities. Expanding deployment of advanced artificial lift technologies, including electrical submersible pumps, gas lift systems, and progressing cavity pumps, is further supporting market expansion across both onshore and offshore production assets.
The increasing depletion of natural reservoir pressure and the growing need to maximize hydrocarbon recovery are encouraging operators to adopt efficient artificial lift solutions to sustain production levels and improve operational performance. Artificial lift systems are increasingly being integrated with digital monitoring, automation, and predictive maintenance technologies to enhance well productivity, reduce downtime, and optimize operating costs. Rising exploration and production activities, coupled with continuous technological advancements in intelligent lift systems, are further accelerating market growth across major oil and gas producing regions.
Key Market Trends & Insights
- North America dominated the Artificial Lift Systems Market with the largest revenue share of 41.43% in 2025, supported by extensive oil and gas production activities, growing redevelopment of mature oilfields, and increasing adoption of advanced production optimization technologies
- The positive displacement segment led the market with a 46.8% share in 2025, driven by its extensive use across a wide range of well conditions and production environments
- Asia-Pacific is expected to be the fastest-growing region at a CAGR of 9.59% from 2026 to 2033, fueled by increasing oil and gas exploration activities, rising energy demand, and growing investments in mature field redevelopment projects
- are the fastest-growing simulation type, projected to register a CAGR of % from 2026 to 2033,
- The Electrical Submersible Pumping (ESP) segment dominated the type category with a 44.3% revenue share in 2025, led by its widespread adoption in high-volume oil production wells and ability to operate efficiently under challenging reservoir conditions
- Pump accounted for 31.4% of the market in 2025, preferred by its critical role as the primary fluid lifting component across nearly all artificial lift technologies
- The segment is the fastest-growing category, with a CAGR of % from 2026 to 2033, driven by
Market Size & Forecast
- Global Market Value (2025): USD 14.55 Billion
- Expected Market Value (2033): USD 27.73 Billion
- Forecast CAGR (2026–2033): 8.40%
- Leading Region in 2025: North America
- Fastest Growing Region: Asia-Pacific
Report Scope and Artificial Lift Systems Market Segmentation
|
Attributes |
Artificial Lift Systems Key Market Insights |
|
Segments Covered |
|
|
Countries Covered |
North America · U.S. · Canada · Mexico Europe · Germany · France · U.K. · Netherlands · Switzerland · Belgium · Russia · Italy · Spain · Turkey · Rest of Europe Asia-Pacific · China · Japan · India · South Korea · Singapore · Malaysia · Australia · Thailand · Indonesia · Philippines · Rest of Asia-Pacific Middle East and Africa · Saudi Arabia · U.A.E. · South Africa · Egypt · Israel · Rest of Middle East and Africa South America · Brazil · Argentina · Rest of South America |
|
Key Market Players |
· Baker Hughes Company (U.S.) · NOV Inc. (U.S.) · Halliburton Energy Services, Inc. (U.S.) · Weatherford (U.S.) · JJ Tech Systems (Canada) · MAN Energy Solutions SE (Germany) · Dover Corporation (U.S.) · Schlumberger Limited (U.S.) · Tenaris (Luxembourg) · EBARA CORPORATION (Japan) · MITSUBISHI HEAVY INDUSTRIES, LTD. (Japan) · Solar Turbines Incorporated (U.S.) · Burckhardt Compression AG (Switzerland) · Ariel Corporation (U.S.) · NEUMAN & ESSER GROUP (Germany) · Hitachi, Ltd. (Japan) · Aker Solutions (Norway) · General Electric (U.S.) · Occidental Petroleum Corporation (U.S.) · Canadian Advanced ESP (Canada) |
|
Market Opportunities |
· Expansion of Artificial Lift Deployment in Unconventional Oil and Gas Reservoirs · Growing Adoption of Automated and Remote Monitoring Solutions in Oilfields · Increasing Investments in Deepwater and Offshore Hydrocarbon Production Projects |
|
Value Added Data Infosets |
In addition to the insights on market scenarios such as market value, growth rate, segmentation, geographical coverage, and major players, the market reports curated by the Data Bridge Market Research also include in-depth expert analysis, geographically represented company-wise production and capacity, network layouts of distributors and partners, detailed and updated price trend analysis and deficit analysis of supply chain and demand. |
Artificial Lift Systems Market Trends
Trend: Increasing Adoption of Digital and Intelligent Artificial Lift Systems
Oil and gas operators are increasingly adopting digital and intelligent artificial lift systems to improve production efficiency, reduce operational downtime, and optimize well performance across mature and unconventional reservoirs. Integration of artificial intelligence, predictive analytics, IoT-enabled sensors, and real-time monitoring platforms is enabling operators to detect equipment issues early and maximize hydrocarbon recovery. Automated lift optimization technologies are becoming increasingly important as companies focus on reducing operating costs while improving production reliability. The growing shift toward smart oilfield operations is further accelerating deployment of digitally connected artificial lift solutions.
Companies such as SLB (Schlumberger) and Baker Hughes have expanded their digital production optimization portfolios by integrating advanced analytics and remote monitoring capabilities into artificial lift operations, enabling operators to improve equipment performance and reduce unplanned interventions across global oilfields.
Artificial Lift Systems Market Dynamics
Key Market Driver: Rising Production Optimization Requirements in Mature Oilfields
The increasing number of aging oilfields experiencing natural reservoir pressure decline is significantly driving demand for artificial lift systems worldwide. As mature wells account for a substantial share of global oil production, operators are increasingly deploying rod lift, electrical submersible pumps (ESP), and gas lift technologies to maintain commercial production rates and extend field life. Artificial lift systems play a critical role in improving recovery factors and maximizing hydrocarbon extraction from existing assets. Growing investments in enhanced oil recovery programs are further supporting market demand.
According to the International Energy Agency (IEA), more than 70% of the world's producing oilfields are mature fields facing production decline, encouraging operators to invest heavily in artificial lift technologies. Companies such as Occidental Petroleum and Saudi Aramco continue to deploy advanced artificial lift systems across mature reservoirs to sustain production output and improve recovery efficiency.
Key Restraint/Challenge: High Installation and Maintenance Costs of Advanced Lift Technologies
A major challenge in the Artificial Lift Systems market is the substantial capital and operational expenditure associated with installing and maintaining advanced lift technologies. Systems such as electrical submersible pumps and intelligent lift solutions require significant investments in equipment, monitoring infrastructure, power systems, and specialized maintenance services. Harsh operating conditions, equipment failures, corrosion, and frequent well interventions can further increase lifecycle costs. These financial constraints are particularly significant for smaller operators managing marginal and low-production wells.
The increasing deployment of high-capacity ESP systems in offshore and deepwater fields has highlighted the cost-intensive nature of advanced artificial lift operations, with operators often allocating significant budgets toward equipment replacement, monitoring systems, and maintenance programs to ensure production continuity.
Key Market Opportunity: Growing Adoption of Automated and Remote Monitoring Solutions in Oilfields
The rapid adoption of automated production management and remote monitoring technologies is creating significant growth opportunities for the Artificial Lift Systems market. Oil and gas operators are increasingly implementing intelligent monitoring platforms that provide real-time insights into well conditions, equipment performance, and production trends. These technologies help reduce unplanned downtime, improve operational efficiency, and enable predictive maintenance strategies across large well networks. Growing digital transformation initiatives across upstream operations are further accelerating adoption of smart artificial lift systems.
Companies such as Halliburton and Weatherford are expanding their digital oilfield offerings through advanced automation platforms and remote monitoring solutions designed specifically for artificial lift optimization. These developments are enabling operators to enhance production efficiency, lower operating costs, and maximize asset performance across both onshore and offshore oilfields.
Artificial Lift Systems Market Scope
The artificial lift systems market is segmented on the basis of type, component, application, and mechanism.
- By Type
On the basis of type, the Artificial Lift Systems Market is segmented into Rod Lift, Electrical Submersible Pumping (ESP), Progressing Cavity Pumping (PCP), Plunger, Gas Lift, and Others. The Electrical Submersible Pumping (ESP) segment dominated the market with the largest share of 44.3% in 2025, driven by its widespread adoption in high-volume oil production wells and ability to operate efficiently under challenging reservoir conditions. ESP systems are extensively utilized in both onshore and offshore fields due to their capability to handle large fluid volumes while maintaining production stability. Increasing investments in mature field optimization and enhanced oil recovery activities continue to support deployment across major producing regions. Technological advancements in pump design, monitoring systems, and operational reliability further strengthen segment growth. Strong demand for maximizing hydrocarbon recovery from aging assets reinforces its leading market position.
The Gas Lift segment is projected to register the fastest growth at a CAGR of 8.9% from 2026 to 2033, driven by rising adoption in deepwater, high-pressure, and deviated well environments where operational flexibility is critical. Gas lift systems offer lower intervention requirements and improved performance in wells experiencing fluctuating production rates. Increasing offshore exploration and production activities are supporting wider implementation across complex reservoirs. Advancements in gas injection technologies and digital well monitoring solutions are enhancing efficiency and reducing operating costs. Growing focus on extending well life and improving recovery rates is expected to accelerate segment expansion throughout the forecast period.
- By Component
On the basis of component, the Artificial Lift Systems Market is segmented into Pump, Motor, Cable System, Drive Head, Separator, Pump Jack, Sucker Rod, Gas-Lift Valves, Gas-Lift Mandrels, and Controller. The Pump segment dominated the market with a share of 31.4% in 2025, supported by its critical role as the primary fluid lifting component across nearly all artificial lift technologies. Pumps are essential for maintaining production flow rates and maximizing extraction efficiency in both conventional and unconventional oilfields. Rising drilling activities and increasing deployment of artificial lift equipment in mature reservoirs continue to generate strong demand. Continuous improvements in pump durability, corrosion resistance, and energy efficiency further enhance adoption. Their indispensable role in well productivity optimization sustains market leadership.
The Controller segment is projected to register the fastest growth at a CAGR of 9.7% from 2026 to 2033, driven by increasing integration of automation, digital monitoring, and intelligent production management systems. Operators are investing in advanced controllers to improve equipment performance, reduce downtime, and enable predictive maintenance capabilities. Growing adoption of smart oilfield technologies is accelerating demand for real-time operational control and data analytics. Controllers help optimize energy consumption and enhance production efficiency across artificial lift installations. Expanding digital transformation initiatives throughout the oil and gas industry are expected to support rapid segment growth.
- By Application
On the basis of application, the Artificial Lift Systems Market is segmented into Oil and Gas. The Oil and Gas segment dominated the market in 2025, driven by the essential role of artificial lift technologies in sustaining hydrocarbon production throughout the lifecycle of oil and gas wells. Increasing depletion of reservoir pressure in mature fields has significantly expanded the need for efficient lifting solutions to maintain commercial production levels. Growing investments in enhanced oil recovery projects and unconventional resource development continue to support market demand. Artificial lift systems enable operators to improve recovery rates, extend well productivity, and optimize operational performance. Rising global energy demand and continuous exploration and production activities further reinforce segment growth.
The Oil and Gas segment is also expected to grow at a CAGR of 8.4% from 2026 to 2033, supported by increasing deployment of advanced lift technologies across both onshore and offshore production assets. Expanding investments in mature field redevelopment and production optimization programs are creating substantial opportunities for artificial lift equipment manufacturers. Digitalization, automation, and remote monitoring capabilities are further enhancing operational efficiency and reliability. Growing focus on maximizing hydrocarbon recovery while reducing production costs is expected to sustain long-term demand. Continuous technological innovation remains a key factor supporting market expansion.
- By Mechanism
On the basis of mechanism, the Artificial Lift Systems Market is segmented into Positive Displacement, Dynamic Displacement, and Gas Assisted. The Positive Displacement segment dominated the market with the largest share of 46.8% in 2025, driven by its extensive use across a wide range of well conditions and production environments. Technologies such as rod lift and progressing cavity pumps operate under this mechanism and are widely preferred for their reliability and effectiveness in low-to-medium production wells. These systems provide consistent fluid movement and perform efficiently in wells with varying viscosity levels. Strong deployment across mature oilfields and cost-effective operation further support widespread adoption. Their proven performance and operational versatility maintain segment leadership.
The Gas Assisted segment is projected to register the fastest growth at a CAGR of 10.2% from 2026 to 2033, driven by increasing utilization in offshore, deepwater, and high-production wells requiring flexible lifting solutions. Gas-assisted mechanisms help reduce mechanical wear while improving production efficiency in challenging operating environments. Rising investments in complex hydrocarbon reservoirs and unconventional resource development are supporting broader adoption. Advancements in gas injection systems, monitoring technologies, and production optimization tools are enhancing operational effectiveness. Growing industry focus on maximizing recovery while minimizing intervention costs is expected to accelerate segment growth during the forecast period.
Artificial Lift Systems Market Regional Analysis
North America dominated the artificial lift systems market and accounted for the largest revenue share of 41.43% in 2025, driven by extensive oil and gas production activities, growing redevelopment of mature oilfields, and increasing adoption of advanced production optimization technologies. The region benefits from a large base of aging wells that require artificial lift solutions to maintain economic production levels and improve recovery rates. Strong investments in shale oil and tight oil development across major producing basins continue to support demand for rod lift, ESP, and gas lift systems. Operators are increasingly deploying automated lift technologies integrated with real-time monitoring platforms to enhance operational efficiency and reduce downtime. In addition, the presence of leading oilfield service providers and ongoing technological advancements continue to reinforce North America's leadership position in the global market.
U.S. Artificial Lift Systems Market Insight
The U.S. Artificial Lift Systems market is experiencing strong growth driven by increasing unconventional oil and gas production, rising investments in enhanced oil recovery projects, and widespread deployment of digital oilfield technologies. Operators across the Permian Basin, Eagle Ford, and Bakken formations are increasingly utilizing advanced lift systems to maximize production from mature and low-pressure reservoirs. Growing focus on production efficiency and cost optimization is accelerating the adoption of intelligent lift monitoring and automation solutions. The country’s strong oilfield infrastructure and continuous drilling activities further support market expansion. In addition, ongoing technological innovations in ESP and gas lift systems are contributing significantly to market growth across the U.S.
Canada Artificial Lift Systems Market Insight
The Canada Artificial Lift Systems market is witnessing steady growth supported by increasing oil sands production, expanding conventional oilfield operations, and rising demand for enhanced recovery technologies. Operators are increasingly adopting artificial lift systems to improve well productivity and optimize hydrocarbon extraction from mature reservoirs. The country’s focus on operational efficiency and production sustainability is encouraging investment in advanced lift technologies equipped with remote monitoring capabilities. Growing redevelopment of aging oilfields and expansion of upstream activities are further supporting market demand. In addition, technological improvements in lifting equipment performance and durability continue to contribute to market growth in Canada.
Europe Artificial Lift Systems Market Insight
The Europe Artificial Lift Systems market is expanding steadily due to increasing efforts to maximize production from mature offshore fields, growing investments in enhanced oil recovery, and rising adoption of digital production technologies. The region benefits from established oil and gas infrastructure, particularly in the North Sea, where operators are focused on extending field life and improving recovery rates. Artificial lift systems are increasingly deployed to maintain production efficiency and reduce operational costs in aging reservoirs. Rising integration of automation and predictive maintenance technologies is further enhancing operational performance. Continuous investments in offshore production optimization continue to support regional market growth.
U.K. Artificial Lift Systems Market Insight
The U.K. Artificial Lift Systems market is growing steadily, driven by ongoing redevelopment of mature North Sea assets, increasing focus on production optimization, and rising deployment of advanced well intervention technologies. Operators are investing in artificial lift systems to sustain production levels and improve reservoir recovery from aging offshore fields. Growing adoption of digital monitoring solutions is enabling improved operational efficiency and equipment reliability. The country's well-established offshore energy infrastructure supports continued implementation of advanced lift technologies. In addition, increasing investments in extending asset life cycles are strengthening market expansion in the U.K.
Germany Artificial Lift Systems Market Insight
The Germany Artificial Lift Systems market is expanding due to growing investments in domestic energy production, increasing adoption of advanced oilfield technologies, and rising emphasis on operational efficiency within hydrocarbon extraction activities. Energy companies are focusing on improving well productivity through the deployment of reliable and cost-effective artificial lift solutions. Technological advancements in automation, monitoring systems, and production optimization tools are supporting wider adoption. The country's strong engineering capabilities contribute to the development and utilization of advanced oilfield equipment. In addition, increasing focus on maximizing recovery from existing resources is further supporting market development in Germany.
Asia-Pacific Artificial Lift Systems Market Insight
The Asia-Pacific Artificial Lift Systems market is expected to register the fastest growth with a CAGR of 9.59% from 2026 to 2033, driven by increasing oil and gas exploration activities, rising energy demand, and growing investments in mature field redevelopment projects. Countries such as China, India, Indonesia, Malaysia, and Australia are witnessing substantial upstream investments aimed at improving production efficiency and hydrocarbon recovery. Increasing deployment of advanced artificial lift technologies across onshore and offshore assets is significantly boosting market demand. Rising adoption of digital oilfield solutions and automated production systems is further enhancing operational effectiveness. In addition, supportive government initiatives to strengthen domestic energy production are accelerating regional market expansion.
Japan Artificial Lift Systems Market Insight
The Japan Artificial Lift Systems market is witnessing steady growth supported by increasing investments in offshore energy development, growing focus on energy security, and rising adoption of advanced production technologies. Energy operators are increasingly utilizing artificial lift systems to enhance production efficiency and improve reservoir management in existing oil and gas assets. The country's strong technological expertise is encouraging integration of automation and remote monitoring capabilities within lift operations. Growing emphasis on operational reliability and cost optimization is further supporting market demand. In addition, continued technological innovation is strengthening the adoption of advanced artificial lift solutions in Japan.
China Artificial Lift Systems Market Insight
The China Artificial Lift Systems market is growing rapidly due to expanding oil and gas production activities, increasing redevelopment of mature reservoirs, and strong investments in enhanced recovery technologies. Energy companies are actively deploying advanced lift systems to improve production rates and maximize hydrocarbon extraction from aging fields. The country's large-scale upstream investments and growing focus on domestic energy security are creating substantial demand for efficient artificial lift technologies. Increasing integration of automation, data analytics, and intelligent monitoring systems is further enhancing operational performance. In addition, continued expansion of both onshore and offshore exploration activities is driving significant market growth in China.
Artificial Lift Systems Market Share
The artificial lift systems industry is primarily led by well-established companies, including:
- Baker Hughes Company (U.S.)
- NOV Inc. (U.S.)
- Halliburton Energy Services, Inc. (U.S.)
- Weatherford (U.S.)
- JJ Tech Systems (Canada)
- MAN Energy Solutions SE (Germany)
- Dover Corporation (U.S.)
- Schlumberger Limited (U.S.)
- Tenaris (Luxembourg)
- EBARA CORPORATION (Japan)
- MITSUBISHI HEAVY INDUSTRIES, LTD. (Japan)
- Solar Turbines Incorporated (U.S.)
- Burckhardt Compression AG (Switzerland)
- Ariel Corporation (U.S.)
- NEUMAN & ESSER GROUP (Germany)
- Hitachi, Ltd. (Japan)
- Aker Solutions (Norway)
- General Electric (U.S.)
- Occidental Petroleum Corporation (U.S.)
- Canadian Advanced ESP (Canada)
Latest Developments in Artificial Lift Systems Market
- In December 2025, Baker Hughes secured a major multi-year contract from Kuwait Oil Company to supply advanced electrical submersible pump (ESP) systems integrated with intelligent production optimization technologies, including automated monitoring and digital field management solutions. This development is expected to strengthen the adoption of smart artificial lift systems across large-scale oilfields by improving production efficiency, reducing nonproductive time, and enhancing equipment reliability. The agreement highlights the growing industry focus on digitalized artificial lift operations and supports increasing demand for advanced lifting technologies in mature and high-output reservoirs
- In July 2025, SLB completed its acquisition of ChampionX for approximately USD 7.8 billion, significantly expanding its portfolio of artificial lift, production optimization, and digital well management technologies. The acquisition strengthens SLB’s capabilities across ESP, rod lift, PCP, and gas lift solutions while enhancing integrated production services for oil and gas operators. This development is expected to accelerate innovation, improve operational efficiency, and drive broader deployment of advanced artificial lift systems globally as operators increasingly focus on maximizing hydrocarbon recovery from existing assets
- In May 2024, ABB announced an agreement to acquire Siemens’ wiring accessories and smart home systems business in China under a licensing arrangement. The acquisition is expected to strengthen ABB’s automation and electrification portfolio while enhancing its technological capabilities in intelligent control systems. The development supports broader industrial digitalization trends that contribute to improved monitoring and operational efficiency across energy and industrial applications, creating favorable conditions for advanced artificial lift system deployment
- In May 2024, Schneider Electric partnered with Crux to facilitate the purchase of 45X advanced manufacturing production credits from Silfab Solar, a North American solar PV module manufacturer. The collaboration is expected to accelerate domestic clean energy manufacturing and strengthen industrial sustainability initiatives. The development reflects growing investments in energy-efficient and digitally managed industrial infrastructure, supporting the adoption of advanced automation technologies that can enhance artificial lift system performance and operational optimization
- In January 2024, ABB acquired a majority stake in Meshmind, a research and development engineering company specializing in artificial intelligence, Industrial IoT, machine vision, and software-based automation. This acquisition is expected to strengthen ABB’s expertise in AI-driven industrial solutions and accelerate the development of intelligent automation technologies. The enhanced capabilities are likely to support the evolution of predictive maintenance, remote monitoring, and digital optimization applications that are increasingly being integrated into modern artificial lift systems to improve productivity and reduce operating costs
SKU-

- Interactive Data Analysis Dashboard
- Company Analysis Dashboard for high growth potential opportunities
- Research Analyst Access for customization & queries
- Competitor Analysis with Interactive dashboard
- Latest News, Updates & Trend analysis
- Harness the Power of Benchmark Analysis for Comprehensive Competitor Tracking
Global Artificial Lift Systems Market, Supply Chain Analysis and Ecosystem Framework
To support market growth and help clients navigate the impact of geopolitical shifts, DBMR has integrated in-depth supply chain analysis into its Global Artificial Lift Systems Market research reports. This addition empowers clients to respond effectively to global changes affecting their industries. The supply chain analysis section includes detailed insights such as Global Artificial Lift Systems Market consumption and production by country, price trend analysis, the impact of tariffs and geopolitical developments, and import and export trends by country and HSN code. It also highlights major suppliers with data on production capacity and company profiles, as well as key importers and exporters. In addition to research, DBMR offers specialized supply chain consulting services backed by over a decade of experience, providing solutions like supplier discovery, supplier risk assessment, price trend analysis, impact evaluation of inflation and trade route changes, and comprehensive market trend analysis.
Data collection and base year analysis are done using data collection modules with large sample sizes. The stage includes obtaining market information or related data through various sources and strategies. It includes examining and planning all the data acquired from the past in advance. It likewise envelops the examination of information inconsistencies seen across different information sources. The market data is analysed and estimated using market statistical and coherent models. Also, market share analysis and key trend analysis are the major success factors in the market report. To know more, please request an analyst call or drop down your inquiry.
The key research methodology used by DBMR research team is data triangulation which involves data mining, analysis of the impact of data variables on the market and primary (industry expert) validation. Data models include Vendor Positioning Grid, Market Time Line Analysis, Market Overview and Guide, Company Positioning Grid, Patent Analysis, Pricing Analysis, Company Market Share Analysis, Standards of Measurement, Global versus Regional and Vendor Share Analysis. To know more about the research methodology, drop in an inquiry to speak to our industry experts.
Data Bridge Market Research is a leader in advanced formative research. We take pride in servicing our existing and new customers with data and analysis that match and suits their goal. The report can be customized to include price trend analysis of target brands understanding the market for additional countries (ask for the list of countries), clinical trial results data, literature review, refurbished market and product base analysis. Market analysis of target competitors can be analyzed from technology-based analysis to market portfolio strategies. We can add as many competitors that you require data about in the format and data style you are looking for. Our team of analysts can also provide you data in crude raw excel files pivot tables (Fact book) or can assist you in creating presentations from the data sets available in the report.


