
Global Automatic Identification And Data Capture Market
Market Size in USD Billion
 USD
84.85 Billion
USD
404.30 Billion
2025
2033
USD
84.85 Billion
USD
404.30 Billion
2025
2033
| 2026 - 2033 | |
| USD 84.85 Billion | |
| USD 404.30 Billion | |
| % | |
|
What is the Global Automatic Identification and Data Capture Market Size and Growth Rate?
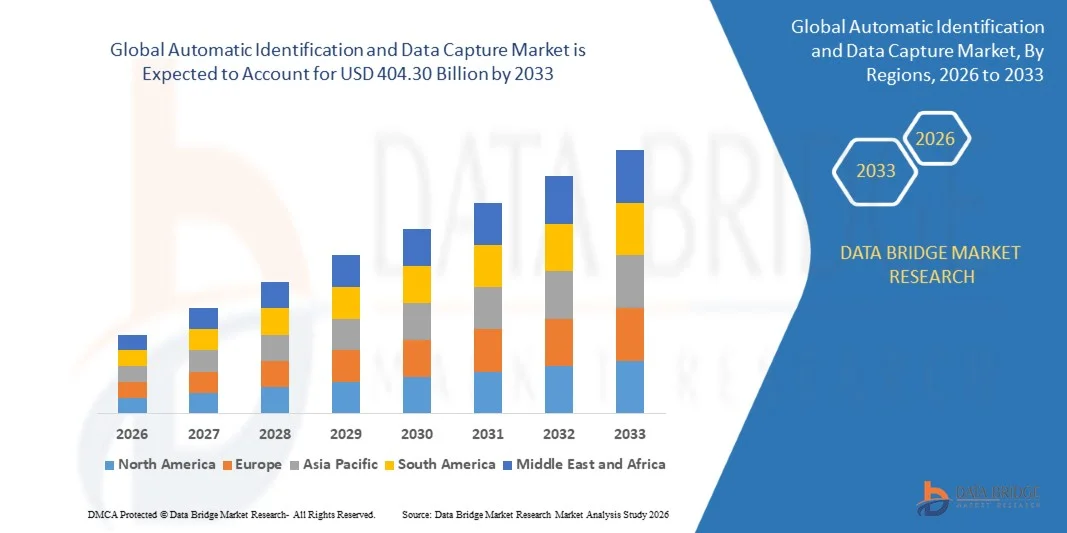
- As per Data Bridge Market Research Analysis the global automatic identification and data capture market size was valued at USD 84.85 billion in 2025 and is expected to reach USD 404.30 billion by 2033, at a CAGR of 21.55% during the forecast period
- The rise in e-commerce industry across the globe acts as one of the major factors driving the growth of automatic identification and data capture market. The adoption of AIDC solutions owning to their ability for declining queuing and transaction time and offer greater convenience to users in making small-value payments accelerate the market growth
- The adoption of AIDC solutions by banking and financial institutions in order to ensure customer safety and security, coupled with data privacy further influence the market
Market Size & Forecast
- Global Market Value (2025): USD 84.85 billion in 2025
- Expected Market Value (2033): USD 404.30 billion by 2033
- Forecast CAGR (2026–2033): 21.55%
What are the Major Takeaways of Automatic Identification and Data Capture Market?
- Huge amounts of data generated, rise in the adoption of Internet of things, rapid digitization, increase system availability and high use of smartphones for QR code scanning and image recognition positively affect the automatic identification and data capture market
- Furthermore, focus of enterprises to implement new and improved supply chain management tools extend profitable opportunities to the market players
- Asia-Pacific dominated the automatic identification and data capture market with a 41.82% revenue share in 2025, driven by strong growth in retail digitization, large-scale manufacturing, e-commerce expansion, logistics automation, and rapid adoption of barcode and RFID solutions across China, Japan, India, South Korea, and Southeast Asia
- North America is projected to register the fastest CAGR of 8.13% from 2026 to 2033, driven by rapid growth in warehouse automation, healthcare digitization, contactless payments, and smart retail solutions across the U.S. and Canada
- The Hardware segment dominated the market with a 46.8% share in 2025, as it remains the core component of AIDC deployment across industries
Report Scope and Automatic Identification and Data Capture Market Segmentation
|
Attributes |
Automatic Identification and Data Capture Key Market Insights |
|
Segments Covered |
|
|
Countries Covered |
North America
Europe
Asia-Pacific
Middle East and Africa
South America
|
|
Key Market Players |
|
|
Market Opportunities |
|
|
Value Added Data Infosets |
In addition to the insights on market scenarios such as market value, growth rate, segmentation, geographical coverage, and major players, the market reports curated by the Data Bridge Market Research also include in-depth expert analysis, pricing analysis, brand share analysis, consumer survey, demography analysis, supply chain analysis, value chain analysis, raw material/consumables overview, vendor selection criteria, PESTLE Analysis, Porter Analysis, and regulatory framework. |
What is the Key Trend in the Automatic Identification and Data Capture Market?
“Increasing Shift Toward Smart, Contactless, and Real-Time Data Capture Solutions”
- The Automatic Identification and Data Capture market is witnessing strong adoption of barcode scanners, RFID systems, biometric devices, QR code readers, and mobile data capture solutions across retail, logistics, healthcare, and manufacturing sectors
- Manufacturers are introducing AI-enabled scanning systems, cloud-connected RFID readers, and real-time asset tracking solutions that offer improved speed, precision, and interoperability with enterprise software systems
- Growing demand for contactless identification, warehouse automation, and real-time inventory visibility is driving widespread usage across supply chain operations and industrial environments
- For instance, companies such as Zebra Technologies Corporation, Honeywell International Inc., and Datalogic S.p.A. are upgrading their AIDC portfolios with advanced RFID, machine vision, and smart scanning technologies
- Increasing need for faster checkout systems, asset traceability, and workforce productivity is accelerating the shift toward integrated, cloud-based data capture solutions
- As industries continue to automate operations, AIDC solutions will remain critical for real-time visibility, error reduction, and operational efficiency
What are the Key Drivers of Automatic Identification and Data Capture Market?
- Rising demand for accurate inventory management, real-time asset tracking, and automated data collection systems is significantly driving market growth
- For instance, in 2025, leading companies expanded investments in RFID, barcode scanning, OCR, and biometric authentication technologies to support warehouse automation and smart retail solutions
- Growing adoption across e-commerce, logistics, healthcare, BFSI, manufacturing, and transportation sectors is boosting demand globally
- Advancements in IoT integration, AI-powered scanning, cloud analytics, and mobile computing devices have strengthened speed, portability, and system efficiency
- Rising use of smart warehouses, omnichannel retail, contactless payment systems, and pharmaceutical traceability solutions is creating sustained long-term demand
- Supported by steady investments in automation, digital transformation, and Industry 4.0 infrastructure, the AIDC market is expected to witness strong growth
Which Factor is Challenging the Growth of the Automatic Identification and Data Capture Market?
- High costs associated with RFID infrastructure, enterprise integration, advanced biometric systems, and software deployment restrict adoption among SMEs and budget-constrained organizations
- For instance, during 2024–2025, rising hardware prices and integration complexities increased deployment costs for several enterprises globally
- Complexity in integrating AIDC solutions with legacy ERP, warehouse management, and enterprise software systems increases implementation challenges
- Data privacy concerns and cybersecurity risks related to cloud-connected devices and biometric data continue to slow adoption in certain industries
- Competition from low-cost local hardware vendors and interoperability challenges across systems creates pricing pressure and reduces differentiation
- To address these issues, companies are focusing on cost-optimized hardware, cloud-native software integration, and enhanced cybersecurity frameworks to increase global adoption
How is the Automatic Identification and Data Capture Market Segmented?
The market is segmented on the basis of offering, product, and vertical.
• By Offering
On the basis of offering, the automatic identification and data capture market is segmented into Hardware, Software, and Services. The Hardware segment dominated the market with a 46.8% share in 2025, as it remains the core component of AIDC deployment across industries. This segment includes barcode scanners, RFID readers, biometric devices, handheld terminals, printers, and mobile computers, which are widely used for inventory tracking, identity verification, and real-time asset monitoring. The strong adoption of physical data capture devices across retail stores, warehouses, hospitals, and manufacturing facilities continues to support segment dominance. Rising demand for durable, portable, and high-speed scanning devices is further strengthening market penetration.
The Software segment is expected to grow at the fastest CAGR from 2026 to 2033, driven by increasing adoption of cloud-based asset tracking platforms, analytics dashboards, AI-powered scanning software, and enterprise integration tools. Growing demand for real-time visibility, automation, and workflow optimization is accelerating software deployment across global enterprises.
• By Product
On the basis of product, the market is segmented into Barcodes, Magnetic Stripe Cards, Smart Cards, Optical Character Recognition (OCR) Systems, RFID Products, and Biometric Systems. The Barcodes segment dominated the market with a 38.6% share in 2025, supported by its widespread use across retail billing, warehouse management, logistics tracking, and product identification systems. Barcode systems continue to be the most cost-effective and easy-to-deploy AIDC solution, making them highly preferred across SMEs and large enterprises asuch as. Their compatibility with POS systems and inventory software further drives large-scale adoption.
The RFID Products segment is projected to grow at the fastest CAGR from 2026 to 2033, driven by increasing demand for contactless tracking, smart inventory systems, warehouse automation, and real-time asset monitoring. Rising use of RFID in supply chain visibility, transportation, healthcare equipment tracking, and smart retail is significantly boosting growth across developed and emerging markets.
• By Vertical
On the basis of vertical, the automatic identification and data capture market is segmented into Manufacturing, Retail, Transportation and Logistics, Banking and Finance, Healthcare, Government, and Others. The Retail segment dominated the market with a 35.9% share in 2025, driven by extensive deployment of barcode scanners, POS systems, RFID tags, self-checkout systems, and inventory management tools. Retailers increasingly rely on AIDC solutions for real-time stock visibility, checkout efficiency, loss prevention, and omnichannel fulfillment operations.
The Transportation and Logistics segment is expected to grow at the fastest CAGR from 2026 to 2033, propelled by rising adoption of RFID-based shipment tracking, warehouse automation, parcel identification, and fleet management systems. Increasing growth in e-commerce, third-party logistics, and last-mile delivery services is driving strong demand for high-speed, real-time data capture solutions across global logistics networks.
Which Region Holds the Largest Share of the Automatic Identification and Data Capture Market?
- Asia-Pacific dominated the automatic identification and data capture market with a 41.82% revenue share in 2025, driven by strong growth in retail digitization, large-scale manufacturing, e-commerce expansion, logistics automation, and rapid adoption of barcode and RFID solutions across China, Japan, India, South Korea, and Southeast Asia. High-volume deployment of POS systems, warehouse scanners, RFID tags, smart cards, and biometric solutions continues to fuel demand across retail chains, logistics hubs, hospitals, and industrial facilities
- Leading companies in Asia-Pacific are introducing AI-enabled barcode scanners, cloud-integrated RFID systems, and mobile data capture devices, strengthening the region’s technological and manufacturing advantage. Continuous investment in smart warehousing, omnichannel retail, and digital supply chain infrastructure supports long-term market expansion
- Strong electronics manufacturing capacity, cost-efficient production ecosystems, and rapid digital transformation initiatives further reinforce regional market leadership
China Automatic Identification and Data Capture Market Insight
China is the largest contributor in Asia-Pacific, supported by massive retail networks, advanced manufacturing ecosystems, strong e-commerce growth, and extensive logistics automation. Increasing deployment of RFID tracking systems, warehouse automation tools, smart scanners, and biometric verification devices continues to intensify market demand. Presence of large domestic manufacturing capabilities and government-backed smart industry initiatives further drives market growth.
Japan Automatic Identification and Data Capture Market Insight
Japan contributes significantly to regional growth, driven by advanced retail technology infrastructure, industrial automation, robotics integration, and healthcare digitization. Enterprises increasingly utilize AIDC solutions for inventory accuracy, patient identification, and smart factory operations. Strong focus on operational efficiency and precision technology strengthens market adoption.
India Automatic Identification and Data Capture Market Insight
India is emerging as a major growth hub, driven by expanding organized retail, logistics modernization, digital payments, and government-backed digital transformation initiatives. Growing demand for barcode systems, POS terminals, RFID solutions, and biometric authentication devices fuels adoption across retail, BFSI, healthcare, and government sectors. Increasing investments in warehousing and e-commerce further accelerate market penetration.
South Korea Automatic Identification and Data Capture Market Insight
South Korea contributes significantly due to strong demand for smart retail systems, advanced logistics tracking, consumer electronics manufacturing, and digital healthcare solutions. Rapid adoption of automation and real-time tracking technologies supports sustained market growth.
North America Automatic Identification and Data Capture Market
North America is projected to register the fastest CAGR of 8.13% from 2026 to 2033, driven by rapid growth in warehouse automation, healthcare digitization, contactless payments, and smart retail solutions across the U.S. and Canada. High adoption of RFID-based asset tracking, biometric systems, and enterprise-grade scanning solutions increases demand across logistics, retail, BFSI, and healthcare sectors. Growth in AI-powered inventory management, omnichannel retail, and digital identity solutions continues to accelerate the need for advanced AIDC systems across enterprise environments.
U.S. Automatic Identification and Data Capture Market Insight
The U.S. is the largest contributor in North America, supported by strong adoption of RFID, OCR systems, smart cards, and warehouse automation technologies across retail, logistics, and healthcare sectors. Increasing development of AI-driven supply chain platforms, automated checkout systems, and patient identification tools further drives market growth.
Canada Automatic Identification and Data Capture Market Insight
Canada contributes significantly to regional growth, driven by rising investment in smart logistics, healthcare automation, digital government services, and retail modernization. Growing enterprise demand for real-time tracking and automated identification systems continues to strengthen market adoption across the country.
Which are the Top Companies in Automatic Identification and Data Capture Market?
The automatic identification and data capture industry is primarily led by well-established companies, including:
- Datalogic S.p.A. (Italy)
- Honeywell International Inc. (U.S.)
- Zebra Technologies Corporation (U.S.)
- Cognex Corporation (U.S.)
- Toshiba Corporation (Japan)
- NEC Corporation (Japan)
- NXP Semiconductors N.V. (Netherlands)
- Synaptics (U.S.)
- Sato Holdings Corporation (Japan)
- JADAK Tech (U.S.)
- Axicon Auto ID Ltd. (U.K.)
- Microscan Systems, Inc. (U.S.)
- Unitech Electronics Co. Ltd. (Taiwan)
- Opticon Sensors Europe B.V. (Netherlands)
- IMPINJ Inc. (U.S.)
- Better Online Solutions (Israel)
- TSC Auto ID Technology Co., Ltd. (Taiwan)
- Epson America Inc. (U.S.)
- Alien Technologies Corporation (U.S.)
- Avery Dennison Corporation (U.S.)
What are the Recent Developments in Global Automatic Identification and Data Capture Market?
- In May 2025, Identiv and InPlay Inc. announced the co-development of BLE-enabled smart labels for high-value logistics applications, with a focus on cold-chain compliance, real-time asset tracking, and supply chain visibility, further strengthening innovation in smart identification and data capture solutions for logistics and transportation sectors
- In March 2025, South Korea successfully completed the national digital ID rollout for approximately 52 million citizens, establishing a robust digital identification infrastructure that supports both government services and commercial authentication applications, thereby accelerating adoption of secure AIDC technologies across the region
- In February 2025, Armenia announced plans to launch a new biometric ID system in 2026 aligned with EU standards, reinforcing the country’s commitment to modern identification frameworks and creating future opportunities for biometric and smart card solution providers
- In May 2024, Datalogic S.p.A. launched the Magellan 900i imaging-based entry-level scanner, replacing its GPS44XX series and delivering 30% higher scanning performance, enhanced 1D and 2D barcode readability, and an expanded field of view, further strengthening its presence across retail, healthcare, manufacturing, transportation, and logistics applications
- In March 2024, Cognex Corporation introduced the 380 Modular Vision Tunnel under its Modular Vision Tunnel portfolio, featuring the DataMan 380 barcode reader with a read rate of over 99%, designed to maximize throughput, improve traceability, and optimize space efficiency for advanced industrial and logistics operations
SKU-

- Interactive Data Analysis Dashboard
- Company Analysis Dashboard for high growth potential opportunities
- Research Analyst Access for customization & queries
- Competitor Analysis with Interactive dashboard
- Latest News, Updates & Trend analysis
- Harness the Power of Benchmark Analysis for Comprehensive Competitor Tracking
Data collection and base year analysis are done using data collection modules with large sample sizes. The stage includes obtaining market information or related data through various sources and strategies. It includes examining and planning all the data acquired from the past in advance. It likewise envelops the examination of information inconsistencies seen across different information sources. The market data is analysed and estimated using market statistical and coherent models. Also, market share analysis and key trend analysis are the major success factors in the market report. To know more, please request an analyst call or drop down your inquiry.
The key research methodology used by DBMR research team is data triangulation which involves data mining, analysis of the impact of data variables on the market and primary (industry expert) validation. Data models include Vendor Positioning Grid, Market Time Line Analysis, Market Overview and Guide, Company Positioning Grid, Patent Analysis, Pricing Analysis, Company Market Share Analysis, Standards of Measurement, Global versus Regional and Vendor Share Analysis. To know more about the research methodology, drop in an inquiry to speak to our industry experts.
Data Bridge Market Research is a leader in advanced formative research. We take pride in servicing our existing and new customers with data and analysis that match and suits their goal. The report can be customized to include price trend analysis of target brands understanding the market for additional countries (ask for the list of countries), clinical trial results data, literature review, refurbished market and product base analysis. Market analysis of target competitors can be analyzed from technology-based analysis to market portfolio strategies. We can add as many competitors that you require data about in the format and data style you are looking for. Our team of analysts can also provide you data in crude raw excel files pivot tables (Fact book) or can assist you in creating presentations from the data sets available in the report.


