
Global Biological Data Visualization Market
Market Size in USD Billion
 USD
1.30 Billion
USD
2.84 Billion
2025
2033
USD
1.30 Billion
USD
2.84 Billion
2025
2033
| 2026 - 2033 | |
| USD 1.30 Billion | |
| USD 2.84 Billion | |
| % | |
|
Biological Data Visualization Market Size
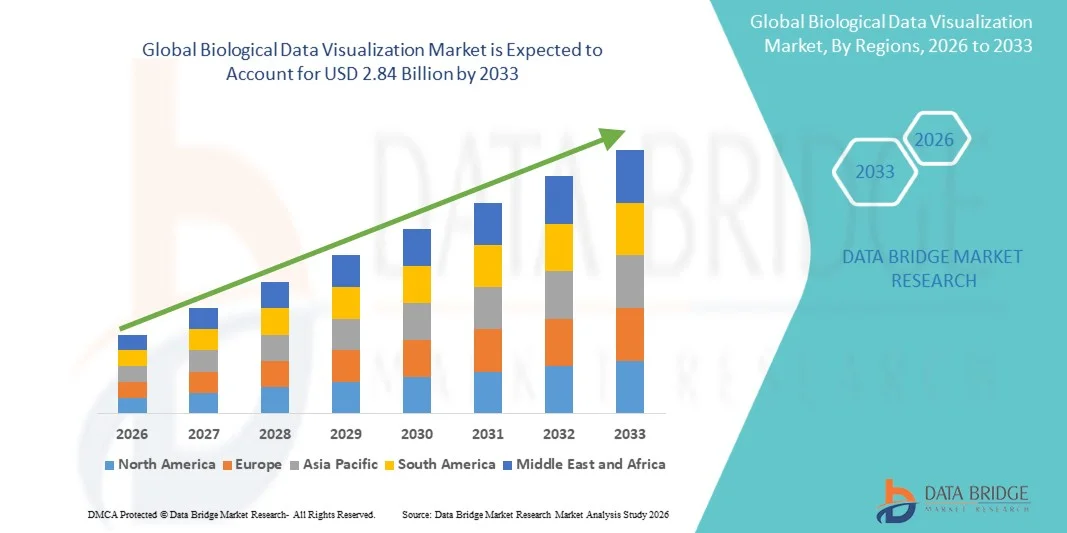
- The global biological data visualization market size was valued at USD 1.30 billion in 2025and is expected to reach USD 2.84 billion by 2033, at a CAGR of 10.30% during the forecast period
- The market growth is primarily driven by the rising adoption of advanced bioinformatics tools and increasing integration of AI and machine learning in life sciences research, enabling more efficient interpretation of complex biological datasets
- Furthermore, growing demand for data-driven decision-making in genomics, proteomics, and drug discovery, along with expanding investments in precision medicine and healthcare analytics, is establishing biological data visualization as a critical component of modern biomedical research, thereby significantly accelerating industry expansion
Biological Data Visualization Market Analysis
- Biological data visualization tools, enabling graphical representation of complex biological and biomedical datasets, are becoming essential in genomics, proteomics, and systems biology due to their ability to simplify data interpretation and support faster scientific decision-making in research and clinical environments
- The escalating demand for biological data visualization solutions is primarily driven by the exponential growth of life sciences data, increasing adoption of bioinformatics platforms, and rising integration of AI and advanced analytics in drug discovery and precision medicine workflows
- North America dominated the biological data visualization market with the largest revenue share of 42.6% in 2025, supported by strong biotech and pharmaceutical R&D infrastructure, high adoption of advanced bioinformatics tools, and significant investments from government and private research institutions, particularly in the U.S.
- Asia-Pacific is expected to be the fastest growing region in the biological data visualization market during the forecast period due to expanding biotechnology sectors, increasing research funding, and rapid adoption of digital health and computational biology solutions in countries such as China, Japan, and India
- The Genomic Analysis segment dominated the biological data visualization market in 2025 with a market share of 38.9%, driven by the widespread use of next-generation sequencing technologies and the growing need for advanced tools to analyze large-scale genetic data for personalized medicine and disease research
Report Scope and Biological Data Visualization Market Segmentation
|
Attributes |
Biological Data Visualization Key Market Insights |
|
Segments Covered |
|
|
Countries Covered |
North America · U.S. · Canada · Mexico Europe · Germany · France · U.K. · Netherlands · Switzerland · Belgium · Russia · Italy · Spain · Turkey · Rest of Europe Asia-Pacific · China · Japan · India · South Korea · Singapore · Malaysia · Australia · Thailand · Indonesia · Philippines · Rest of Asia-Pacific Middle East and Africa · Saudi Arabia · U.A.E. · South Africa · Egypt · Israel · Rest of Middle East and Africa South America · Brazil · Argentina · Rest of South America |
|
Key Market Players |
|
|
Market Opportunities |
· Rapid expansion of single-cell and spatial omics technologies · Increasing integration of cloud-based bioinformatics and collaborative research platforms |
|
Value Added Data Infosets |
In addition to the insights on market scenarios such as market value, growth rate, segmentation, geographical coverage, and major players, the market reports curated by the Data Bridge Market Research also include in-depth expert analysis, patient epidemiology, pipeline analysis, pricing analysis, and regulatory framework |
Biological Data Visualization Market Trends
“Rising Integration of AI-Driven Multi-Omics Visualization Platforms”
- A significant and accelerating trend in the global biological data visualization market is the growing integration of artificial intelligence (AI) with multi-omics visualization platforms, enabling researchers to interpret highly complex genomic, proteomic, and metabolomic datasets with greater speed and accuracy in biomedical research workflows
- For instance, platforms such as Illumina Connected Analytics and QIAGEN Digital Insights are integrating AI-assisted visualization tools that allow interactive exploration of next-generation sequencing data and automated pattern recognition in large-scale biological datasets
- AI integration in biological data visualization enables advanced capabilities such as predictive modeling of disease pathways, automated clustering of gene expression profiles, and real-time identification of biologically relevant patterns across heterogeneous datasets used in drug discovery
- The seamless integration of visualization platforms with cloud computing and bioinformatics pipelines facilitates centralized access to large-scale biological datasets, enabling collaborative research and real-time data sharing across global life sciences organizations
- The increasing use of 3D molecular visualization and digital twin models of biological systems is emerging as a key trend, allowing researchers to simulate cellular behavior and drug interactions in virtual environments for faster hypothesis testing
- This trend toward intelligent, scalable, and interoperable visualization ecosystems is reshaping expectations in biomedical research, as companies such as Thermo Fisher Scientific and Dassault Systèmes develop advanced visualization suites with AI-driven analytics and 3D molecular modeling capabilities
- The demand for AI-enabled biological data visualization tools is growing rapidly across pharmaceutical, biotechnology, and academic research sectors as organizations increasingly prioritize data-driven insights for precision medicine and translational research
Biological Data Visualization Market Dynamics
Driver
“Growing Demand Driven by Expansion of Genomics and Precision Medicine Research”
- The increasing volume of high-throughput biological data generated from genomics, proteomics, and clinical research, combined with the rapid expansion of precision medicine initiatives, is a significant driver for the rising adoption of biological data visualization solutions in research and healthcare applications
- For instance, in April 2025, NVIDIA announced enhanced bioinformatics visualization capabilities within its Clara platform, enabling accelerated processing and visualization of genomic data for cancer research and drug discovery applications
- As research institutions and pharmaceutical companies generate massive multi-dimensional datasets, biological data visualization tools provide essential capabilities such as interactive data mapping, pattern recognition, and integrative analysis of complex biological systems
- Furthermore, the growing adoption of next-generation sequencing technologies and large-scale population genomics studies is making advanced visualization platforms a critical component of modern life sciences research infrastructure
- The increasing need for real-time, interpretable insights from complex biological datasets across drug development and clinical diagnostics is further accelerating the adoption of advanced visualization solutions in both academic and commercial research settings
- The expansion of government-funded genomics initiatives and international research collaborations is further boosting demand for standardized visualization tools that can support cross-border biological data interpretation
- Rising utilization of AI-assisted drug discovery pipelines in pharmaceutical companies is also contributing to higher adoption of visualization platforms for target identification and biomarker discovery
Restraint/Challenge
“High Computational Complexity and Data Integration Barriers”
- Concerns surrounding the high computational requirements and complexity of integrating heterogeneous biological datasets across multiple platforms pose a significant challenge to the broader adoption of biological data visualization solutions
- For instance, large-scale initiatives such as multi-omics cancer research programs often face difficulties in harmonizing genomic, transcriptomic, and clinical datasets within a unified visualization framework due to differences in data formats and processing standards
- Addressing these challenges requires significant investment in high-performance computing infrastructure, standardized data formats, and interoperable software ecosystems to ensure seamless visualization and analysis of complex biological data
- In addition, the high cost of deploying advanced visualization platforms with AI and cloud integration capabilities can be a barrier for smaller research institutions and emerging biotech companies with limited budgets
- Data privacy and regulatory compliance requirements in handling sensitive genomic and patient data further complicate the deployment of cloud-based visualization systems across global research networks
- Limited interoperability between legacy bioinformatics systems and modern visualization platforms also slows down adoption in established research institutions
- While cloud-based solutions from providers such as IBM Watson Health are helping reduce infrastructure constraints, concerns around data privacy, scalability, and system interoperability continue to hinder full-scale adoption
- Overcoming these challenges through improved data standardization, scalable cloud architectures, and cost-effective visualization tools will be critical for sustained growth of the biological data visualization market
Biological Data Visualization Market Scope
The market is segmented on the basis of technique, application, platform, and end use.
- By Technique
On the basis of technique, the biological data visualization market is segmented into microscopy, magnetic resonance imaging (MRI), sequencing, X-ray crystallography, and others. The sequencing segment dominated the market with the largest revenue share of 39.4% in 2025, driven by the widespread adoption of next-generation sequencing (NGS) technologies in genomics and precision medicine. Sequencing generates massive multi-dimensional datasets that require advanced visualization tools for interpretation, making it a core driver of biological data visualization demand. The segment also benefits from strong use in cancer genomics, rare disease research, and large-scale population studies. Increasing integration of sequencing outputs with AI-based visualization platforms further strengthens its dominance in research workflows. In addition, declining sequencing costs have significantly expanded adoption across academic and commercial research institutions globally.
The microscopy segment is anticipated to witness the fastest growth rate of 20.8% from 2026 to 2033, fueled by advancements in high-resolution imaging technologies such as super-resolution and live-cell microscopy. These techniques generate highly complex spatial and temporal datasets that require advanced visualization solutions for cellular and subcellular analysis. Rising adoption of digital pathology and AI-enabled image analysis is further accelerating demand for microscopy-based visualization tools. The segment is also benefiting from increased use in neuroscience, cancer biology, and drug discovery research. Integration of 3D imaging and real-time visualization capabilities is making microscopy a key growth area in life sciences analytics.
- By Application
On the basis of application, the market is segmented into cell and organism imaging, structural biology and molecular modeling, genomic analysis, alignments, phylogeny and evolution, and systems biology. The genomic analysis segment dominated the market with the largest revenue share of 38.9% in 2025, driven by the rapid expansion of genomics research and widespread adoption of next-generation sequencing platforms. This application generates extremely large datasets requiring advanced visualization tools for mutation tracking, gene expression profiling, and variant analysis. The segment is strongly supported by increasing demand for precision medicine and personalized treatment strategies. Pharmaceutical companies and research institutes extensively rely on genomic visualization for biomarker discovery and disease mechanism studies. Continuous growth in cancer genomics and population-scale sequencing projects further reinforces its dominance.
The systems biology segment is anticipated to witness the fastest growth rate of 22.3% from 2026 to 2033, driven by the increasing need to understand complex biological interactions at the network level. Systems biology integrates multi-omics datasets, requiring advanced visualization platforms to map interactions between genes, proteins, and metabolic pathways. Rising adoption of AI and computational modeling is accelerating demand for dynamic and interactive visualization tools. The segment is also gaining traction in drug discovery, where simulation of biological systems helps predict therapeutic responses. Growing focus on holistic disease modeling and predictive biology is further boosting its rapid expansion.
- By Platform
On the basis of platform, the market is segmented into Windows, Mac OS, Linux, and others. The Windows segment dominated the market with the largest revenue share of 52.8% in 2025, driven by its widespread use across academic institutions, pharmaceutical companies, and biotechnology organizations. Windows-based systems are highly compatible with most bioinformatics and visualization software, making them the default choice for biological research environments. The platform also benefits from strong enterprise adoption and easy integration with laboratory information management systems. Extensive developer support and availability of specialized scientific tools further reinforce its dominance. In addition, its cost-effectiveness compared to alternative operating systems supports large-scale deployment in research facilities.
The Linux segment is anticipated to witness the fastest growth rate of 21.5% from 2026 to 2033, driven by its strong suitability for high-performance computing and large-scale biological data analysis. Linux is widely preferred in genomics and bioinformatics research due to its stability, scalability, and ability to handle complex computational workloads. The platform is increasingly adopted in cloud-based research environments and AI-driven analytics pipelines. Open-source flexibility and customization capabilities also make it attractive for advanced visualization tool development. Growing use of supercomputing clusters in life sciences research further accelerates its adoption.
- By End Use
On the basis of end use, the market is segmented into academic research, hospitals and clinics, pharmaceutical and biotechnology companies, and other users. The pharmaceutical and biotechnology companies segment dominated the market with the largest revenue share of 44.9% in 2025, driven by extensive use of biological data visualization in drug discovery, clinical trials, and biomarker identification. These organizations generate large-scale multi-omics datasets that require advanced visualization tools for actionable insights. The segment is supported by strong R&D investments and increasing focus on precision medicine development. Integration of AI-driven analytics into drug development pipelines further strengthens demand for visualization platforms. In addition, collaborations with bioinformatics companies are enhancing the adoption of advanced visualization technologies in commercial research.
The academic research segment is anticipated to witness the fastest growth rate of 23.1% from 2026 to 2033, driven by rising global investments in life sciences education and research initiatives. Universities and research institutes are increasingly adopting advanced visualization tools to analyze genomic, proteomic, and systems biology datasets. Growing availability of government and private research grants is further supporting adoption in academic settings. The increasing use of cloud-based bioinformatics platforms is making advanced visualization tools more accessible to researchers. Expansion of interdisciplinary research programs combining biology, data science, and AI is further accelerating growth in this segment.
Biological Data Visualization Market Regional Analysis
- North America dominated the biological data visualization market with the largest revenue share of 42.6% in 2025, supported by strong biotech and pharmaceutical R&D infrastructure, high adoption of advanced bioinformatics tools, and significant investments from government and private research institutions
- Research organizations and enterprises in the region highly value advanced visualization platforms for their ability to interpret complex genomic, proteomic, and multi-omics datasets, supporting faster and more accurate decision-making in drug discovery and precision medicine
- This widespread adoption is further supported by high R&D investments, a strong presence of leading life sciences companies, advanced healthcare infrastructure, and early adoption of cloud-based and AI-powered bioinformatics solutions, establishing biological data visualization as a critical tool in both academic and commercial research environments
U.S. Biological Data Visualization Market Insight
The U.S. biological data visualization market captured the largest revenue share of 81% in North America in 2025, driven by strong investment in genomics research, advanced bioinformatics infrastructure, and early adoption of AI-enabled life sciences technologies. Researchers and pharmaceutical companies in the country increasingly rely on visualization platforms to manage and interpret large-scale multi-omics and clinical datasets for precision medicine and drug discovery. The presence of leading biotechnology firms and technology companies is further accelerating innovation in AI-driven visualization tools. In addition, strong integration of cloud computing, machine learning, and advanced analytics within research workflows is significantly supporting market expansion.
Europe Biological Data Visualization Market Insight
The Europe biological data visualization market is projected to expand at a substantial CAGR throughout the forecast period, primarily driven by increasing investments in genomics research and stringent regulatory frameworks supporting secure and standardized data management in life sciences. The rise in collaborative research initiatives across academic institutions and pharmaceutical companies is fostering the adoption of advanced visualization platforms. European researchers are also increasingly drawn to scalable and privacy-compliant solutions that support complex biological data interpretation. The region is experiencing significant growth across academic research, clinical diagnostics, and biotechnology applications, with visualization tools being integrated into both research pipelines and healthcare analytics systems.
U.K. Biological Data Visualization Market Insight
The U.K. biological data visualization market is anticipated to grow at a noteworthy CAGR during the forecast period, driven by increasing focus on genomics research, expanding adoption of AI-driven healthcare analytics, and strong government support for life sciences innovation. In addition, rising demand for precision medicine and advanced disease modeling is encouraging widespread use of visualization platforms in both academic and clinical research settings. The UK’s strong digital health infrastructure and growing use of cloud-based bioinformatics platforms are expected to further stimulate market growth. The integration of biological data visualization tools with national healthcare and research systems is also enhancing data accessibility and research efficiency.
Germany Biological Data Visualization Market Insight
The Germany biological data visualization market is expected to expand at a considerable CAGR during the forecast period, fueled by strong pharmaceutical manufacturing capabilities, growing computational biology research, and increasing focus on industrial biotechnology innovation. Germany’s emphasis on high-quality engineering and data security is driving adoption of advanced visualization platforms in both research institutes and industrial R&D centers. The integration of AI-powered analytics with biological data visualization systems is becoming increasingly prevalent in drug development and systems biology studies. Moreover, the country’s strong focus on sustainable and technology-driven healthcare solutions is further supporting market expansion.
Asia-Pacific Biological Data Visualization Market Insight
The Asia-Pacific biological data visualization market is poised to grow at the fastest CAGR of 23.5% during the forecast period of 2026 to 2033, driven by rapid expansion of biotechnology industries, increasing genomics research activities, and strong digital transformation in healthcare systems. Countries such as China, Japan, and India are heavily investing in large-scale biomedical research programs, significantly increasing demand for advanced visualization tools. The region is also benefiting from rising availability of cost-effective cloud-based bioinformatics platforms and growing collaborations between academic and commercial research organizations. Furthermore, increasing government support for precision medicine and life sciences innovation is accelerating adoption across the region.
Japan Biological Data Visualization Market Insight
The Japan biological data visualization market is gaining momentum due to its advanced research infrastructure, strong focus on precision medicine, and high adoption of AI-integrated healthcare technologies. The country places significant emphasis on systems biology and regenerative medicine research, which heavily relies on advanced visualization tools for interpreting complex biological datasets. Integration of visualization platforms with robotics, imaging systems, and IoT-enabled laboratory environments is further strengthening market growth. In addition, Japan’s aging population is increasing demand for advanced diagnostic and research tools, supporting wider adoption in healthcare and academic sectors.
India Biological Data Visualization Market Insight
The India biological data visualization market accounted for the largest market revenue share in Asia-Pacific in 2025, attributed to rapid expansion of biotechnology startups, increasing investment in genomics research, and strong government initiatives supporting digital healthcare transformation. India is emerging as a key hub for life sciences innovation, with growing demand for scalable and affordable visualization platforms across academic, clinical, and commercial research applications. The push toward smart healthcare systems and precision medicine is further accelerating adoption. In addition, the availability of cost-efficient cloud-based bioinformatics solutions and expanding domestic biotech capabilities are significantly driving market growth.
Biological Data Visualization Market Share
The Biological Data Visualization industry is primarily led by well-established companies, including:
- Thermo Fisher Scientific Inc. (U.S.)
- Illumina, Inc. (U.S.)
- QIAGEN (Germany)
- Agilent Technologies, Inc. (U.S.)
- PerkinElmer, Inc. (U.S.)
- Bio-Rad Laboratories, Inc. (U.S.)
- GE HealthCare (U.S.)
- BD (U.S.)
- Bruker Corporation (U.S.)
- Oxford Nanopore Technologies plc (U.K.)
- 10x Genomics, Inc. (U.S.)
- Genedata AG (Switzerland)
- DNASTAR, Inc. (U.S.)
- Schrödinger, Inc. (U.S.)
- Benchling, Inc. (U.S.)
- DNAnexus, Inc. (U.S.)
- Tableau Software, LLC (U.S.)
- Carl Zeiss AG (Germany)
- Leica Microsystems GmbH (Germany)
- Waters Corporation (U.S.)
What are the Recent Developments in Global Biological Data Visualization Market?
- In January 2026, Illumina, a leading biotechnology company, announced the launch of its AI-driven multiomics software platform designed to enhance genomic and biological data analysis. The platform integrates advanced AI algorithms with visualization capabilities to enable researchers to interpret complex multi-omics datasets in real time, improving efficiency in genomics research, clinical studies, and drug discovery workflows
- In October 2025, Illumina introduced its BioInsight business unit focused on combining sequencing technologies with advanced analytics and visualization tools for life sciences applications. The initiative aims to strengthen data interpretation capabilities across genomics and pharmaceutical research by integrating AI-powered analytics into biological workflows
- In February 2025, NVIDIA, a global technology company, announced the integration of its BioNeMo generative AI framework into Illumina’s BaseSpace ecosystem. This collaboration enhances biological data visualization and analysis by enabling accelerated processing of large-scale genomic datasets using AI computing. The integration significantly improves multi-omics interpretation, supporting faster and more accurate drug discovery and precision medicine research
- In May 2023, Deepcell, a biotechnology company specializing in AI-based cellular analysis, launched its REM-I platform, an advanced single-cell visualization system. The platform uses artificial intelligence to analyze and visualize cellular morphology without the need for labeling, enabling high-resolution insights into individual cell structures. This innovation supports applications in cancer research, immunology, and cell therapy development by improving biological data visualization at the cellular level
- In July 2021, industry advancements highlighted the increasing adoption of AI, virtual reality (VR), and advanced computational tools in biological data visualization platforms. These technologies enabled researchers to interactively explore complex genomic and proteomic datasets through immersive visualization environments and 3D modeling systems. This period marked a key transition toward more interactive and AI-enabled biological data analysis ecosystems
SKU-

- Interactive Data Analysis Dashboard
- Company Analysis Dashboard for high growth potential opportunities
- Research Analyst Access for customization & queries
- Competitor Analysis with Interactive dashboard
- Latest News, Updates & Trend analysis
- Harness the Power of Benchmark Analysis for Comprehensive Competitor Tracking
Data collection and base year analysis are done using data collection modules with large sample sizes. The stage includes obtaining market information or related data through various sources and strategies. It includes examining and planning all the data acquired from the past in advance. It likewise envelops the examination of information inconsistencies seen across different information sources. The market data is analysed and estimated using market statistical and coherent models. Also, market share analysis and key trend analysis are the major success factors in the market report. To know more, please request an analyst call or drop down your inquiry.
The key research methodology used by DBMR research team is data triangulation which involves data mining, analysis of the impact of data variables on the market and primary (industry expert) validation. Data models include Vendor Positioning Grid, Market Time Line Analysis, Market Overview and Guide, Company Positioning Grid, Patent Analysis, Pricing Analysis, Company Market Share Analysis, Standards of Measurement, Global versus Regional and Vendor Share Analysis. To know more about the research methodology, drop in an inquiry to speak to our industry experts.
Data Bridge Market Research is a leader in advanced formative research. We take pride in servicing our existing and new customers with data and analysis that match and suits their goal. The report can be customized to include price trend analysis of target brands understanding the market for additional countries (ask for the list of countries), clinical trial results data, literature review, refurbished market and product base analysis. Market analysis of target competitors can be analyzed from technology-based analysis to market portfolio strategies. We can add as many competitors that you require data about in the format and data style you are looking for. Our team of analysts can also provide you data in crude raw excel files pivot tables (Fact book) or can assist you in creating presentations from the data sets available in the report.


