
Global Car T Therapy Treatment Market
Market Size in USD Billion
 USD
2.44 Billion
USD
6.66 Billion
2024
2032
USD
2.44 Billion
USD
6.66 Billion
2024
2032
| 2025 - 2032 | |
| USD 2.44 Billion | |
| USD 6.66 Billion | |
| % | |
|
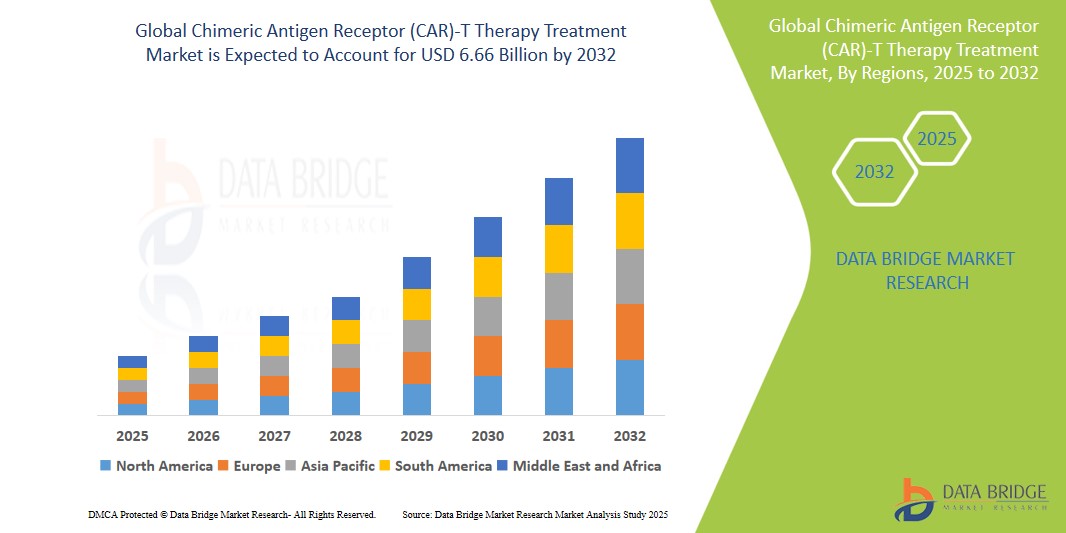
Chimeric Antigen Receptor (CAR)-T Therapy Treatment Market Size
- The global chimeric antigen receptor (CAR)-T cell therapy market size was valued at USD 2.44 billion in 2023 and is projected to reach USD 5.97 billion by 2031, at a CAGR of 15.3% during the forecast period.
- This growth is driven by factors such as increasing prevalence of cancer, advancements in immunotherapy, and growing approvals of CAR-T cell therapies by regulatory agencies
Chimeric Antigen Receptor (CAR)-T Therapy Treatment Market Analysis
- CAR-T cell therapy is a revolutionary cancer treatment that modifies a patient’s T-cells to target and destroy cancer cells. It has shown high efficacy in treating certain types of leukemia, lymphoma, and multiple myeloma
- The demand for CAR-T cell therapy is rising due to increasing incidences of hematologic malignancies and promising outcomes in clinical trials
- North America is expected to dominate the CAR-T cell therapy market owing to strong R&D activities, high healthcare expenditure, and early adoption of advanced therapies
- Asia-Pacific is expected to be the fastest growing region in the CAR-T cell therapy market during the forecast period due to expanding biotechnology sectors and increasing cancer burden.
- Acute lymphocytic leukemia segment is expected to dominate the market with a market share of 30% due to high treatment responsiveness and ongoing clinical development. As one of the first approved indications for CAR-T therapy, it continues to drive market growth
Report Scope and Chimeric Antigen Receptor (CAR)-T Therapy Treatment Market Segmentation
|
Attributes |
Chimeric Antigen Receptor (CAR)-T Therapy Treatment Key Market Insights |
|
Segments Covered |
|
|
Countries Covered |
North America
Europe
Asia-Pacific
Middle East and Africa
South America
|
|
Key Market Players |
|
|
Market Opportunities |
|
|
Value Added Data Infosets |
In addition to the insights on market scenarios such as market value, growth rate, segmentation, geographical coverage, and major players, the market reports curated by the Data Bridge Market Research also include import export analysis, production capacity overview, production consumption analysis, price trend analysis, climate change scenario, supply chain analysis, value chain analysis, raw material/consumables overview, vendor selection criteria, PESTLE Analysis, Porter Analysis, and regulatory framework. |
Chimeric Antigen Receptor (CAR)-T Therapy Treatment Market Trends
“Next-Generation CAR-T Therapies and Off-the-Shelf (Allogeneic) Solutions”
- A major trend in the CAR-T cell therapy landscape is the emergence of next-generation CAR-T therapies and the development of off-the-shelf (allogeneic) CAR-T solutions that aim to overcome the limitations of traditional autologous CAR-T products
- These innovations aim to improve manufacturing efficiency, reduce treatment costs, and ensure faster patient access by eliminating the need to harvest and modify a patient’s own T cells
- For instance, allogeneic CAR-T therapies such as those under development by Allogene Therapeutics and Precision BioSciences utilize gene editing technologies to produce universal CAR-T cells from healthy donors, offering the potential for scalable and readily available treatments
- These advancements are poised to transform cancer immunotherapy, reducing time-to-treatment, enhancing accessibility, and supporting the expansion of CAR-T therapy across broader indications and patient populations
Chimeric Antigen Receptor (CAR)-T Therapy Treatment Market Dynamics
Driver
“Rising Cancer Incidence and High Efficacy of CAR-T in Hematologic Malignancies”
- The growing global burden of cancer—especially hematologic malignancies like leukemia, lymphoma, and multiple myeloma—is a key factor driving the demand for CAR-T cell therapy
- CAR-T therapies offer high efficacy, with several FDA-approved products demonstrating strong remission rates in patients who have not responded to conventional treatments
- For instance, According to the International Agency for Research on Cancer (IARC) in 2022, approximately 20 million new cancer cases were diagnosed globally, with blood cancers accounting for a significant proportion of these cases. The increasing prevalence of treatment-resistant cancers is propelling the need for advanced therapeutic options like CAR-T.
- With continuous advancements in CAR design, target antigen selection, and therapy delivery, the effectiveness and safety of CAR-T therapy continue to improve, driving market growth
Opportunity
“Expanding Indications into Solid Tumors and Earlier Treatment Lines”
- One of the most promising opportunities lies in expanding CAR-T cell therapy beyond hematologic malignancies into solid tumors, which constitute the majority of global cancer cases
- Innovations in tumor microenvironment modulation, dual-targeting CARs, and armored CAR-Ts are enabling CAR-T cells to better infiltrate and persist in solid tumors
- Furthermore, regulatory agencies and researchers are exploring the use of CAR-T therapy in earlier lines of treatment, potentially increasing patient eligibility and outcomes
- For instance, In March 2024, researchers at the National Cancer Institute (NCI) began Phase I trials for CAR-T therapies targeting HER2-positive breast cancer and EGFR-positive glioblastoma, marking a shift toward solid tumor applications
- These developments could significantly expand the commercial scope of CAR-T therapies and position them as a first-line or second-line option in a broader range of cancers
Restraint/Challenge
“High Treatment Costs and Complex Manufacturing Processes”
- One of the biggest challenges limiting widespread adoption of CAR-T therapy is its high cost and complex, individualized manufacturing process, which involves extracting, engineering, and reinfusing a patient’s own T cells
- Treatment costs often exceed hundreds of thousands of dollars per patient, creating significant financial barriers for patients and payers, and limiting access in low- and middle-income countries
- For instance, In October 2024, a study published in Health Affairs estimated the average total cost of CAR-T therapy (including hospitalization and supportive care) in the U.S. at over USD 500,000 per patient, making affordability a major concern for healthcare systems
- Consequently, such limitations can result in disparities in the quality of care and access to advanced surgical procedures, ultimately hindering the overall growth of the market.
Chimeric Antigen Receptor (CAR)-T Therapy Treatment Market Scope
The market is segmented on the basis types, target antigen and therapeutic application.
|
Segmentation |
Sub-Segmentation |
|
By Types |
|
|
By Target Antigen |
|
|
By Therapeutic Application |
|
In 2025, the acute lymphocytic leukemia (ALL) segment is projected to dominate the market with the largest share in the therapeutic application segment
The acute lymphocytic leukemia (ALL) segment is expected to lead the CAR-T cell therapy market in 2025, accounting for the largest market share of approximately 30%. This dominance is attributed to the early approval and clinical success of CAR-T therapies such as Kymriah and Tecartus for treating relapsed or refractory ALL. With its high response rates and life-saving potential, CAR-T therapy is becoming the standard of care for patients unresponsive to conventional treatments. The increasing incidence of ALL, especially in pediatric populations, along with continued clinical advancements, is expected to further reinforce the segment’s leading position.
The CD19 target antigen segment is expected to dominate the market with the largest share in the target antigen segment
The CD19 target antigen segment is projected to hold the largest market share of 48.6% in 2025 within the CAR-T cell therapy market. CD19 has been the most widely targeted antigen due to its high expression in B-cell malignancies such as acute lymphocytic leukemia, non-Hodgkin lymphoma, and chronic lymphocytic leukemia. Multiple FDA-approved CAR-T therapies, including Kymriah, Yescarta, and Breyanzi, are CD19-specific, demonstrating significant clinical efficacy. As ongoing trials explore CD19 in combination therapies and new indications, this segment is expected to maintain its dominant position throughout the forecast period.
Chimeric Antigen Receptor (CAR)-T Therapy Treatment Market Regional Analysis
“North America Holds the Largest Share in the Chimeric Antigen Receptor (CAR)-T Therapy Treatment Market”
- North America dominates the CAR-T cell therapy market, supported by strong clinical research infrastructure, early adoption of innovative immunotherapies, and a robust regulatory framework facilitating advanced cell therapy approvals.
- The United States leads the region with a high concentration of approved CAR-T therapies, including Kymriah, Yescarta, and Breyanzi, which are widely accessible across specialized cancer treatment centers.
- Favorable reimbursement policies, increasing cancer incidence, and government-backed initiatives to promote precision oncology contribute significantly to market expansion.
- In addition, the presence of leading biotechnology companies, ongoing clinical trials for new indications, and investments in cell therapy manufacturing facilities strengthen the region's leadership in the global CAR-T therapy landscape.
“Asia-Pacific is Projected to Register the Highest CAGR in the Chimeric Antigen Receptor (CAR)-T Therapy Treatment Market”
- The Asia-Pacific region is expected to witness the highest growth rate in the CAR-T cell therapy market, fueled by expanding healthcare infrastructure, rising cancer prevalence, and growing investments in biotechnology innovation
- Countries like China, Japan, South Korea, and India are emerging as key markets due to increasing adoption of personalized cancer treatment and government support for clinical research and cell therapy development
- China, in particular, is rapidly advancing in the CAR-T space, with a large number of clinical trials and domestic biotech firms launching competitive therapies targeting CD19, CD22, and BCMA antigens
- Japan’s regulatory body has adopted fast-track approval pathways for regenerative and advanced therapies, helping accelerate access to CAR-T treatments
- India is witnessing growing demand for CAR-T therapy, supported by academic collaborations and initiatives to localize manufacturing and reduce treatment costs. This regional momentum is expected to significantly contribute to global market growth over the forecast period
Chimeric Antigen Receptor (CAR)-T Therapy Treatment Market Share
The market competitive landscape provides details by competitor. Details included are company overview, company financials, revenue generated, market potential, investment in research and development, new market initiatives, global presence, production sites and facilities, production capacities, company strengths and weaknesses, product launch, product width and breadth, application dominance. The above data points provided are only related to the companies' focus related to market.
The Major Market Leaders Operating in the Market Are:
- Autolus Therapeutics (U.K.)
- CARsgen Therapeutics Holdings Limited (U.K.)
- Bristol-Myers Squibb Company (U.S.)
- Sorrento Therapeutics, Inc. (U.S.)
- bluebird bio, Inc. (U.S.)
- Eureka Therapeutics Inc. (U.S.)
- Avacta Group plc (U.K.)
- Cibus Inc. (France)
- Celyad Oncology SA (Belgium)
- Fortress Biotech, Inc. (U.S.)
- Gilead Sciences, Inc. (U.S.)
- Novartis AG (Switzerland)
- Alaunos Therapeutics, Inc. (U.S.)
- Poseida Therapeutics, Inc. (U.S.)
Latest Developments in Global Chimeric Antigen Receptor (CAR)-T Therapy Treatment Market
- In December 2023, Max Healthcare successfully introduced CAR-T cell therapy in the Delhi-NCR area, marking a significant advancement in cancer treatment options. This innovative therapy, developed in partnership with ImmunoACT, is specifically designed to combat lymphomas and leukemias, offering new hope for patients battling these challenging conditions
- In December 2022, CARsgen Therapeutics Co., Ltd. partnered with the Shanghai Cancer Institute to develop new technology that significantly enhances the antitumor effectiveness of T cells. Their research team discovered that CAR T cells engineered to overexpress Runx3 exhibited sustained antitumor activity and improved tumor control compared to traditional chimeric antigen receptor T-cell therapies
- In November 2022, Caribou Biosciences, Inc. announced that its allogeneic anti-CD19 CAR-T cell therapy, CB-010, received Regenerative Medicine Advanced Therapy (RMAT) designation from the U.S. Food and Drug Administration (FDA) for relapsed or refractory large B cell lymphoma (LBCL), as well as fast track designation for relapsed or refractory B cell non-Hodgkin lymphoma
- In June 2022, The University of Ottawa showcased promising results from the Canadian-Led Immunotherapies in Cancer-01 (CLIC-01) clinical trial, which focused on one of the first Canadian-developed CAR-T cell therapies for cancer. This therapy features a unique manufacturing process that may lead to more affordable and equitable treatment options
- In November 2021, The California Institute for Regenerative Medicine's governing board approved a grant of USD 4.1 million to support the advancement of innovative chimeric antigen receptor T-cell therapy being developed by scientists at the University of California San Diego School of Medicine, aiding their efforts to transition this promising cancer treatment from the laboratory to clinical practice
SKU-

- Interactive Data Analysis Dashboard
- Company Analysis Dashboard for high growth potential opportunities
- Research Analyst Access for customization & queries
- Competitor Analysis with Interactive dashboard
- Latest News, Updates & Trend analysis
- Harness the Power of Benchmark Analysis for Comprehensive Competitor Tracking
Table of Content
1 INTRODUCTION
1.1 OBJECTIVES OF THE STUDY
1.2 MARKET DEFINITION
1.3 OVERVIEW OF GLOBAL CHIMERIC ANTIGEN RECEPTOR (CAR)-T THERAPY TREATMENT MARKET
1.4 CURRENCY AND PRICING
1.5 LIMITATION
1.6 MARKETS COVERED
2 MARKET SEGMENTATION
2.1 KEY TAKEAWAYS
2.2 ARRIVING AT THE GLOBAL CHIMERIC ANTIGEN RECEPTOR (CAR)-T THERAPY TREATMENT MARKET SIZE
2.2.1 VENDOR POSITIONING GRID
2.2.2 TECHNOLOGY LIFE LINE CURVE
2.2.3 TRIPOD DATA VALIDATION MODEL
2.2.4 MARKET GUIDE
2.2.5 MULTIVARIATE MODELLING
2.2.6 TOP TO BOTTOM ANALYSIS
2.2.7 CHALLENGE MATRIX
2.2.8 APPLICATION COVERAGE GRID
2.2.9 STANDARDS OF MEASUREMENT
2.2.10 VENDOR SHARE ANALYSIS
2.2.11 EPIDEMIOLOGY
2.2.12 DATA POINTS FROM KEY PRIMARY INTERVIEWS
2.2.13 DATA POINTS FROM KEY SECONDARY DATABASES
2.3 GLOBAL CHIMERIC ANTIGEN RECEPTOR (CAR)-T THERAPY TREATMENT MARKET: RESEARCH SNAPSHOT
2.4 ASSUMPTIONS
3 MARKET OVERVIEW
3.1 DRIVERS
3.2 RESTRAINTS
3.3 OPPORTUNITIES
3.4 CHALLENGES
4 EXECUTIVE SUMMARY
5 PREMIUM INSIGHTS
5.1 PESTEL ANALYSIS
5.2 PORTER’S FIVE FORCES MODEL
6 INDUSTRY INSIGHTS
6.1 PATENT ANALYSIS
6.1.1 PATENT LANDSCAPE
6.1.2 USPTO NUMBER
6.1.3 PATENT EXPIRY
6.1.4 EPIO NUMBER
6.1.5 PATENT STRENGTH AND QUALITY
6.1.6 PATENT CLAIMS
6.1.7 PATENT CITATIONS
6.1.8 PATENT LITIGATION AND LICENSING
6.1.9 FILE OF PATENT
6.1.10 PATENT RECEIVED CONTRIES
6.1.11 TECHNOLOGY BACKGROUND
6.2 DRUG TREATMENT RATE BY MATURED MARKETS
6.3 DEMOGRAPHIC TRENDS: IMPACTS ON ALL INCIDENCE RATES
6.4 PATIENT FLOW DIAGRAM
6.5 KEY PRICING STRATEGIES
6.6 KEY PATIENT ENROLLMENT STRATEGIES
6.7 INTERVIEWS WITH SPECIALIST
6.8 OTHER KOL SNAPSHOTS
7 EPIDEMIOLOGY
7.1 INCIDENCE OF ALL BY GENDER
7.1.1 PREVALENCE OF B-CELL ACUTE LYMPHOBLASTIC LEUKEMIA (ALL)
7.1.2 PREVALENCE OF B-CELL NON-HODGKIN LYMPHOMA (NHL)
7.1.3 PREVALENCE OF FOLLICULAR LYMPHOMA
7.1.4 PREVALENCE OF MANTLE CELL LYMPHOMA (MCL)
7.1.5 PREVALENCE OF MULTIPLE MYELOMA
7.2 TREATMENT RATE
7.3 MORTALITY RATE
7.4 PATIENT TREATMENT SUCCESS RATES
8 MERGERS AND ACQUISITION
8.1 LICENSING
8.2 COMMERCIALIZATION AGREEMENTS
9 REGULATORY FRAMEWORK
9.1 REGULATORY APPROVAL PROCESS
9.2 GEOGRAPHIES’ EASE OF REGULATORY APPROVAL
9.3 REGULATORY APPROVAL PATHWAYS
9.4 LICENSING AND REGISTRATION
9.5 POST-MARKETING SURVEILLANCE
9.6 GOOD MANUFACTURING PRACTICES (GMPS) GUIDELINES
10 PIPELINE ANALYSIS
10.1 CLINICAL TRIALS AND PHASE ANALYSIS
10.2 DRUG THERAPY PIPELINE
10.3 PHASE III CANDIDATES
10.4 PHASE II CANDIDATES
10.5 PHASE I CANDIDATES
10.6 OTHERS (PRE-CLINICAL AND RESEARCH)
TABLE 1 GLOBAL CLINICAL TRIAL MARKET FOR XX
Company Name Therapeutic Area
XX XX
XX XX
XX XX
XX XX
XX XX
XX XX
Sources: Press Releases, Annual Reports, SEC Filings, Investor Presentations, Other Government Sources, Analysis Based on Inputs from Secondary, Expert Interviews
TABLE 2 DISTRIBUTION OF PRODUCTS AND PROJECTS BY PHASE
Phase Number of Projects
Preclinical/Research Projects XX
Clinical Development XX
Phase I XX
Phase II XX
Phase III XX
U.S. Filed/Approved But Not Yet Marketed XX
Total XX
Sources: Press Releases, Annual Reports, SEC Filings, Investor Presentations, Other Government Sources, Analysis Based on Inputs from Secondary, Expert Interviews
TABLE 3 DISTRIBUTION OF PROJECTS BY THERAPEUTIC AREA AND PHASE
Therapeutic Area Preclinical/ Research Project
XX XX
XX XX
XX XX
XX XX
XX XX
Total Projects XX
Sources: Press Releases, Annual Reports, SEC Filings, Investor Presentations, Other Government Sources, Analysis Based on Inputs from Secondary, Expert Interviews
TABLE 4 DISTRIBUTION OF PROJECTS BY SCIENTIFIC APPROACH AND PHASE
Technology Preclinical/ Research Project
XX XX
XX XX
XX XX
XX XX
XX XX
Total Projects XX
Sources: Press Releases, Annual Reports, SEC Filings, Investor Presentations, Other Government Sources, Analysis Based on Inputs from Secondary, Expert Interviews
FIGURE 1 TOP ENTITIES BASED ON R&D GLANCE FOR XX
Sources: Press Releases, Annual Reports, SEC Filings, Investor Presentations, Other Government Sources, Analysis Based on Inputs from Secondary, Expert Interviews
11 MARKETED DRUG ANALYSIS
11.1 DRUG
11.1.1 BRAND NAME
11.1.2 GENERICS NAME
11.2 THERAPEUTIC INDICTION
11.3 PHARMACOLOGICAL CLASS OF THE DRUG
11.4 DRUG PRIMARY INDICATION
11.5 MARKET STATUS
11.6 MEDICATION TYPE
11.7 DRUG DOSAGES FORM
11.8 DOSAGES AVAILABILITY
11.9 DRUG ROUTE OF ADMINISTRATION
11.1 DOSING FREQUENCY
11.11 DRUG INSIGHT
11.12 AN OVERVIEW OF THE DRUG DEVELOPMENT ACTIVITIES SUCH AS REGULATORY MILSTONE, SAFETY DATA AND EFFICACY DATA, MARKET EXCLUSIVITY DATA.
11.12.1 FORECAST MARKET OUTLOOK
11.12.2 CROSS COMPETITION
11.12.3 THERAPEUTIC PORTFOLIO
11.12.4 CURRENT DEVELOPMENT SCENARIO
12 MARKET ACCESS
12.1 10-YEAR MARKET FORECAST
12.2 CLINICAL TRIAL RECENT UPDATES
12.3 ANNUAL NEW FDA APPROVED DRUGS
12.4 DRUGS MANUFACTURER AND DEALS
12.5 MAJOR DRUG UPTAKE
12.6 CURRENT TREATMENT PRACTICES
12.7 IMPACT OF UPCOMING THERAPY
13 R & D ANALYSIS
13.1 COMPARATIVE ANALYSIS
13.2 DRUG DEVELOPMENTAL LANDSCAPE
13.3 IN-DEPTH INSIGHTS ON REGULATORY MILESTONES
13.4 THERAPEUTIC ASSESSMENT
13.5 ASSET-BASED COLLABORATIONS AND PARTNERSHIPS
14 MARKET OVERVIEW
14.1 DRIVERS
14.2 RESTRAINTS
14.3 OPPORTUNITIES
14.4 CHALLENGES
15 GLOBAL CHIMERIC ANTIGEN RECEPTOR (CAR)-T THERAPY TREATMENT MARKET, BY TARGET INDICATION
15.1 OVERVIEW
15.2 B-CELL ACUTE LYMPHOBLASTIC LEUKEMIA (ALL)
15.3 B-CELL NON-HODGKIN LYMPHOMA (NHL)
15.4 FOLLICULAR LYMPHOMA
15.5 MANTLE CELL LYMPHOMA (MCL)
15.6 MULTIPLE MYELOMA
15.7 OTHERS
16 GLOBAL
16.1 OVERVIEW
16.2 AUTOLOGOUS CAR-T CELLS
16.3 ALLOGENEIC CAR-T CELLS
17 GLOBAL CHIMERIC ANTIGEN RECEPTOR (CAR)-T THERAPY TREATMENT MARKET, BY TARGET ANTIGEN
17.1 OVERVIEW
17.2 CD19
17.2.1 TISAGENLECLEUCEL
17.2.1.1. MARKET VALUE (USD MN)
17.2.1.2. MARKET VOLUME (SU)
17.2.1.3. AVERAGE SELLING PRICE (USD)
17.2.2 AXIXABTAGENE CILOLEUCEL
17.2.2.1. MARKET VALUE (USD MN)
17.2.2.2. MARKET VOLUME (SU)
17.2.2.3. AVERAGE SELLING PRICE (USD)
17.2.3 BREXUCABTAGENE AUTOLLEUCEL
17.2.3.1. MARKET VALUE (USD MN)
17.2.3.2. MARKET VOLUME (SU)
17.2.3.3. AVERAGE SELLING PRICE (USD)
17.2.4 LISOCABTAGENE MARALEUCEL
17.2.4.1. MARKET VALUE (USD MN)
17.2.4.2. MARKET VOLUME (SU)
17.2.4.3. AVERAGE SELLING PRICE (USD)
17.2.5 OTHERS
17.3 BCMA
17.3.1 IDECABTAGENE VICLEUCEL
17.3.1.1. MARKET VALUE (USD MN)
17.3.1.2. MARKET VOLUME (SU)
17.3.1.3. AVERAGE SELLING PRICE (USD)
17.3.2 CILTACABTAGENE AUTOLEUCEL
17.3.2.1. MARKET VALUE (USD MN)
17.3.2.2. MARKET VOLUME (SU)
17.3.2.3. AVERAGE SELLING PRICE (USD)
17.3.3 OTHERS
17.4 OTHERS
18 GLOBAL CHIMERIC ANTIGEN RECEPTOR (CAR)-T THERAPY TREATMENT MARKET, BY AGE GROUP
18.1 OVERVIEW
18.2 CHILDREN (0-15)
18.3 ADULTS (16- 64)
18.4 SENIORS (65 AND ABOVE)
19 GLOBAL CHIMERIC ANTIGEN RECEPTOR (CAR)-T THERAPY TREATMENT MARKET, BY GENDER
19.1 OVERVIEW
19.2 MALE
19.3 FEMALE
20 GLOBAL CHIMERIC ANTIGEN RECEPTOR (CAR)-T THERAPY TREATMENT MARKET, BY END USER
20.1 OVERVIEW
20.2 HOSPITAL
20.2.1 PRIVATE
20.2.2 PUBLIC
20.3 SPECIALTY CLINICS
20.4 RESEARCH INSTITUTES
20.5 CANCER INSTITUTES
20.6 PHARMACEUTICAL & BIOTECHNOLOGY COMPANIES
20.7 OTHERS
21 GLOBAL CHIMERIC ANTIGEN RECEPTOR (CAR)-T THERAPY TREATMENT MARKET, BY DISTRIBUTION CHANNEL
21.1 OVERVIEW
21.2 DIRECT SALE
21.3 RETAIL SALES
21.4 OTHERS
22 GLOBAL CHIMERIC ANTIGEN RECEPTOR (CAR)-T THERAPY TREATMENT MARKET, COMPANY LANDSCAPE
22.1 COMPANY SHARE ANALYSIS: GLOBAL
22.2 COMPANY SHARE ANALYSIS: NORTH AMERICA
22.3 COMPANY SHARE ANALYSIS: EUROPE
22.4 COMPANY SHARE ANALYSIS: ASIA-PACIFIC
22.5 MERGERS & ACQUISITIONS
22.6 NEW PRODUCT DEVELOPMENT & APPROVALS
22.7 EXPANSIONS
22.8 REGULATORY CHANGES
22.9 PARTNERSHIP AND OTHER STRATEGIC DEVELOPMENTS
23 GLOBAL CHIMERIC ANTIGEN RECEPTOR (CAR)-T THERAPY TREATMENT MARKET, BY GEOGRAPHY
GLOBAL CHIMERIC ANTIGEN RECEPTOR (CAR)-T THERAPY TREATMENT MARKET, (ALL SEGMENTATION PROVIDED ABOVE IS REPRESENTED IN THIS CHAPTER BY COUNTRY)
23.1 NORTH AMERICA
23.1.1 U.S.
23.1.2 CANADA
23.1.3 MEXICO
23.2 EUROPE
23.2.1 GERMANY
23.2.2 U.K.
23.2.3 ITALY
23.2.4 FRANCE
23.2.5 SPAIN
23.2.6 RUSSIA
23.2.7 SWITZERLAND
23.2.8 TURKEY
23.2.9 BELGIUM
23.2.10 NETHERLANDS
23.2.11 DENMARK
23.2.12 SWEDEN
23.2.13 POLAND
23.2.14 NORWAY
23.2.15 FINLAND
23.2.16 REST OF EUROPE
23.3 ASIA-PACIFIC
23.3.1 JAPAN
23.3.2 CHINA
23.3.3 SOUTH KOREA
23.3.4 INDIA
23.3.5 SINGAPORE
23.3.6 THAILAND
23.3.7 INDONESIA
23.3.8 MALAYSIA
23.3.9 PHILIPPINES
23.3.10 AUSTRALIA
23.3.11 NEW ZEALAND
23.3.12 VIETNAM
23.3.13 TAIWAN
23.3.14 REST OF ASIA-PACIFIC
23.4 SOUTH AMERICA
23.4.1 BRAZIL
23.4.2 ARGENTINA
23.4.3 REST OF SOUTH AMERICA
23.5 MIDDLE EAST AND AFRICA
23.5.1 SOUTH AFRICA
23.5.2 EGYPT
23.5.3 BAHRAIN
23.5.4 UNITED ARAB EMIRATES
23.5.5 KUWAIT
23.5.6 OMAN
23.5.7 QATAR
23.5.8 SAUDI ARABIA
23.5.9 REST OF MIDDLE EAST AND AFRICA
23.6 KEY PRIMARY INSIGHTS: BY MAJOR COUNTRIES
24 GLOBAL CHIMERIC ANTIGEN RECEPTOR (CAR)-T THERAPY TREATMENT MARKET, SWOT AND DBMR ANALYSIS
25 GLOBAL CHIMERIC ANTIGEN RECEPTOR (CAR)-T THERAPY TREATMENT MARKET, COMPANY PROFILE
25.1 NOVARTIS AG
25.1.1 COMPANY OVERVIEW
25.1.2 REVENUE ANALYSIS
25.1.3 GEOGRAPHIC PRESENCE
25.1.4 PRODUCT PORTFOLIO
25.1.5 RECENT DEVELOPMENTS
25.2 KITE PHARMA
25.2.1 COMPANY OVERVIEW
25.2.2 REVENUE ANALYSIS
25.2.3 GEOGRAPHIC PRESENCE
25.2.4 PRODUCT PORTFOLIO
25.2.5 RECENT DEVELOPMENTS
25.3 JUNO THERAPTICS
25.3.1 COMPANY OVERVIEW
25.3.2 REVENUE ANALYSIS
25.3.3 GEOGRAPHIC PRESENCE
25.3.4 PRODUCT PORTFOLIO
25.3.5 RECENT DEVELOPMENTS
25.4 BRISTOL MYERS SQUIBB
25.4.1 COMPANY OVERVIEW
25.4.2 REVENUE ANALYSIS
25.4.3 GEOGRAPHIC PRESENCE
25.4.4 PRODUCT PORTFOLIO
25.4.5 RECENT DEVELOPMENTS
25.5 LEGEND BIOTECH INC
25.5.1 COMPANY OVERVIEW
25.5.2 REVENUE ANALYSIS
25.5.3 GEOGRAPHIC PRESENCE
25.5.4 PRODUCT PORTFOLIO
25.5.5 RECENT DEVELOPMENTS
25.6 AMMGEN, INC
25.6.1 COMPANY OVERVIEW
25.6.2 REVENUE ANALYSIS
25.6.3 GEOGRAPHIC PRESENCE
25.6.4 PRODUCT PORTFOLIO
25.6.5 RECENT DEVELOPMENTS
25.7 SORRENTO THERAPUTICS, INC.
25.7.1 COMPANY OVERVIEW
25.7.2 REVENUE ANALYSIS
25.7.3 GEOGRAPHIC PRESENCE
25.7.4 PRODUCT PORTFOLIO
25.7.5 RECENT DEVELOPMENTS
25.8 GILEAD SCIENCE
25.8.1 COMPANY OVERVIEW
25.8.2 REVENUE ANALYSIS
25.8.3 GEOGRAPHIC PRESENCE
25.8.4 PRODUCT PORTFOLIO
25.8.5 RECENT DEVELOPMENTS
25.9 BLUE BIRD BIO, INC.
25.9.1 COMPANY OVERVIEW
25.9.2 REVENUE ANALYSIS
25.9.3 GEOGRAPHIC PRESENCE
25.9.4 PRODUCT PORTFOLIO
25.9.5 RECENT DEVELOPMENTS
25.1 IMMUN THERAPUTICS, INC
25.10.1 COMPANY OVERVIEW
25.10.2 REVENUE ANALYSIS
25.10.3 GEOGRAPHIC PRESENCE
25.10.4 PRODUCT PORTFOLIO
25.10.5 RECENT DEVELOPMENTS
25.11 BELLICUM PARMACEUTICALS, INC.
25.11.1 COMPANY OVERVIEW
25.11.2 REVENUE ANALYSIS
25.11.3 GEOGRAPHIC PRESENCE
25.11.4 PRODUCT PORTFOLIO
25.11.5 RECENT DEVELOPMENTS
25.12 PFIZER, INC.
25.12.1 COMPANY OVERVIEW
25.12.2 REVENUE ANALYSIS
25.12.3 GEOGRAPHIC PRESENCE
25.12.4 PRODUCT PORTFOLIO
25.12.5 RECENT DEVELOPMENTS
25.13 ELI LILLY AND COMPANY
25.13.1 COMPANY OVERVIEW
25.13.2 REVENUE ANALYSIS
25.13.3 GEOGRAPHIC PRESENCE
25.13.4 PRODUCT PORTFOLIO
25.13.5 RECENT DEVELOPMENTS
25.14 JW THERAPEUTICS
25.14.1 COMPANY OVERVIEW
25.14.2 REVENUE ANALYSIS
25.14.3 GEOGRAPHIC PRESENCE
25.14.4 PRODUCT PORTFOLIO
25.14.5 RECENT DEVELOPMENTS
25.15 FORTRESS BIOTECH, INC.
25.15.1 COMPANY OVERVIEW
25.15.2 REVENUE ANALYSIS
25.15.3 GEOGRAPHIC PRESENCE
25.15.4 PRODUCT PORTFOLIO
25.15.5 RECENT DEVELOPMENTS
25.16 CARTESIAN THERAPEUTICS, INC.
25.16.1 COMPANY OVERVIEW
25.16.2 REVENUE ANALYSIS
25.16.3 GEOGRAPHIC PRESENCE
25.16.4 PRODUCT PORTFOLIO
25.16.5 RECENT DEVELOPMENTS
25.17 CASI PHARMACEUTICALS
25.17.1 COMPANY OVERVIEW
25.17.2 REVENUE ANALYSIS
25.17.3 GEOGRAPHIC PRESENCE
25.17.4 PRODUCT PORTFOLIO
25.17.5 RECENT DEVELOPMENTS
25.18 POSEIDA THERAPEUTICS, INC.
25.18.1 COMPANY OVERVIEW
25.18.2 REVENUE ANALYSIS
25.18.3 GEOGRAPHIC PRESENCE
25.18.4 PRODUCT PORTFOLIO
25.18.5 RECENT DEVELOPMENTS
25.19 AUTOLUS THERAPEUTICS
25.19.1 COMPANY OVERVIEW
25.19.2 REVENUE ANALYSIS
25.19.3 GEOGRAPHIC PRESENCE
25.19.4 PRODUCT PORTFOLIO
25.19.5 RECENT DEVELOPMENTS
25.2 EUREKA THERAPEUTICS
25.20.1 COMPANY OVERVIEW
25.20.2 REVENUE ANALYSIS
25.20.3 GEOGRAPHIC PRESENCE
25.20.4 PRODUCT PORTFOLIO
25.20.5 RECENT DEVELOPMENTS
25.21 AURORA BIOPHARMA
25.21.1 COMPANY OVERVIEW
25.21.2 REVENUE ANALYSIS
25.21.3 GEOGRAPHIC PRESENCE
25.21.4 PRODUCT PORTFOLIO
25.21.5 RECENT DEVELOPMENTS
25.22 IMMUNOACT
25.22.1 COMPANY OVERVIEW
25.22.2 REVENUE ANALYSIS
25.22.3 GEOGRAPHIC PRESENCE
25.22.4 PRODUCT PORTFOLIO
25.22.5 RECENT DEVELOPMENTS
25.23 FERRING PHARMACEUTICALS A/S
25.23.1 COMPANY OVERVIEW
25.23.2 REVENUE ANALYSIS
25.23.3 GEOGRAPHIC PRESENCE
25.23.4 PRODUCT PORTFOLIO
25.23.5 RECENT DEVELOPMENTS
25.24 JANSSEN BIOTECH, INC.
25.24.1 COMPANY OVERVIEW
25.24.2 REVENUE ANALYSIS
25.24.3 GEOGRAPHIC PRESENCE
25.24.4 PRODUCT PORTFOLIO
25.24.5 RECENT DEVELOPMENTS
NOTE: THE COMPANIES PROFILED IS NOT EXHAUSTIVE LIST AND IS AS PER OUR PREVIOUS CLIENT REQUIREMENT. WE PROFILE MORE THAN 100 COMPANIES IN OUR STUDY AND HENCE THE LIST OF COMPANIES CAN BE MODIFIED OR REPLACED ON REQUEST
26 RELATED REPORTS
27 CONCLUSION
28 QUESTIONNAIRE
29 ABOUT DATA BRIDGE MARKET RESEARCH
Data collection and base year analysis are done using data collection modules with large sample sizes. The stage includes obtaining market information or related data through various sources and strategies. It includes examining and planning all the data acquired from the past in advance. It likewise envelops the examination of information inconsistencies seen across different information sources. The market data is analysed and estimated using market statistical and coherent models. Also, market share analysis and key trend analysis are the major success factors in the market report. To know more, please request an analyst call or drop down your inquiry.
The key research methodology used by DBMR research team is data triangulation which involves data mining, analysis of the impact of data variables on the market and primary (industry expert) validation. Data models include Vendor Positioning Grid, Market Time Line Analysis, Market Overview and Guide, Company Positioning Grid, Patent Analysis, Pricing Analysis, Company Market Share Analysis, Standards of Measurement, Global versus Regional and Vendor Share Analysis. To know more about the research methodology, drop in an inquiry to speak to our industry experts.
Data Bridge Market Research is a leader in advanced formative research. We take pride in servicing our existing and new customers with data and analysis that match and suits their goal. The report can be customized to include price trend analysis of target brands understanding the market for additional countries (ask for the list of countries), clinical trial results data, literature review, refurbished market and product base analysis. Market analysis of target competitors can be analyzed from technology-based analysis to market portfolio strategies. We can add as many competitors that you require data about in the format and data style you are looking for. Our team of analysts can also provide you data in crude raw excel files pivot tables (Fact book) or can assist you in creating presentations from the data sets available in the report.


